
Abstract
This article views death in battle as an opportunity cost whose size is determined by the number of years a rebel would have lived as a civilian. As civilian life expectancy declines, this opportunity cost does too, increasing the probability of rebellion. This theory is tested with a tragic natural experiment: the HIV/AIDS epidemic in sub-Saharan Africa. Using male circumcision rates as an instrument for life expectancy, the analysis shows that a one-year increase in life expectancy decreases the probability of civil war by 2.6 percentage points. This supports the theory that opportunity costs are important determinants of conflict onset and that nonpecuniary opportunity costs should be taken into account. This article concludes by noting that cost–benefit analyses of public health interventions should include decreases in the probability of civil war, and the attendant benefits in terms of lives saved and material damage prevented, in their calculations.
Engaging in armed conflict is one of the riskiest decisions an individual can make. Since 1946, over 10 million soldiers have been killed in wars (Marshall and Cole 2014). While the probability of death in battle for a guerrilla has not been precisely calculated, it is “orders of magnitude” greater than it is for a civilian (Sanín 2010, 134; Goldstein 2011). Yet the current literature on civil war ignores this risk when examining the onset of rebellion.
This article views death in battle as an opportunity cost whose size is determined by the number of years one would have lived as a civilian. As civilian life expectancy declines, this opportunity cost does too, increasing the probability of rebellion. This article begins by formalizing the theory and then tests it using probit regressions. The coefficient on life expectancy is negative and statistically significant, in keeping with the theory. To ensure that this result is not driven by endogeneity, this article employs a tragic natural experiment: the HIV/AIDS epidemic in sub-Saharan Africa. Since 1990, the epidemic has claimed more than 20 million lives in the region and lowered life expectancies by as much as twenty-five years. Using male circumcision rates calculated from Murdock (1967) as an instrument for life expectancy, this article finds that a one-year increase in life expectancy decreases the probability of civil war by 2.6 percentage point.
These results are important for several reasons. They identify and discuss a previously unknown cause of civil war. In this process, they expand the opportunity cost model of civil war onset to include nonpecuniary costs. They also demonstrate that the HIV/AIDS epidemic has been a significant driver of conflict in sub-Saharan Africa. It follows that public health interventions may be an effective tool for reducing the onset of civil war and that cost–benefit analyses of HIV/AIDS prevention and treatment programs should consider the decrease in the probability of civil war and the attendant benefits in terms of lives saved and material damage prevented.
The second section discusses the theory. The third section presents a naive analysis that does not correct for endogeneity, and the fourth section presents the results from the natural experiment. The fifth section tests the robustness of these results, using the percentage of the population killed in battle as the dependent variable. The sixth section reviews the policy implications of these findings and the seventh section concludes.
Theory
While it may seem curious to view the possibility of death as an opportunity cost which varies with life expectancy, individuals with shorter life expectancies due to one condition are less worried about other risks (Rosen 1988). For instance, individuals who live in areas with more pollution are more likely to smoke, reasoning that since the pollution is likely to kill them anyway the opportunity cost of smoking—the number of years of life lost by smoking—is lower (Ganz 2000). Individuals with Huntington’s disease apply the same logic when choosing whether to use tobacco and as a result those with the genetic mutation which causes the disease are 50 percent more likely to smoke than those without the mutation (Oster, Shoulson, and Dorsey 2013).
The opportunity cost of death also affects employment decisions. Workers in dangerous occupations receive a wage premium proportionate to the precariousness of their positions, and this premium decreases with age (Aldy and Viscusi 2008). Evans and Smith (2008) show that age is acting as a proxy for the number of years of life being placed at peril. As a retired nuclear engineer who volunteered to help clean up the Fukushima nuclear disaster put it, “Radiation exposure is unavoidable. But even without (radiation) damage … the rest of my life is no more than 15 years” (The Japan Times 2012).
Field experiments have shown that this same reasoning applies to the HIV/AIDS epidemic in Africa. Young men who are infected with, or at high risk for infection by, HIV are more accepting of other risks of death since they believe HIV has or will greatly decrease their life expectancy (Lammers and Van Wijnbergen 2008). This increased risk acceptance has had an effect on the battlefield, according to British military officials. “The incredibly high rate of HIV and AIDS among [African rebels] makes them fearless. They have nothing to live for anyway” (Hoffman 2011, 244).
This logic lends itself to a decision-theory model.
1
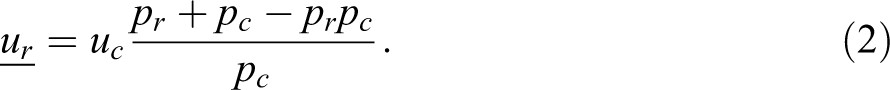
Formally, let the probability of death from all causes—except dying in battle during a civil war—be denoted as pc, where 0 < pc < 1. Let the probability of a rebel dying in battle during a civil war be denoted as pr, where 0 < pr < 1. Let uc be the utility from being a civilian, ur be the utility from being a rebel, with uc > 0 and ur > 0. (The utility of being dead is normalized to 0.) The continuation value to being a civilian is

where the right-hand side is the opportunity cost of rebelling. Let
To see how changes in pc affect if this threshold is reached take the partial derivative of equation (2) with regard to pc,
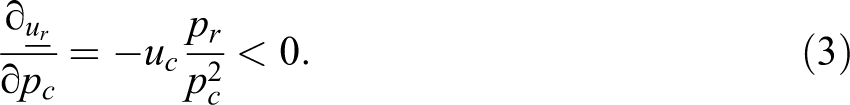
So increases in pc decrease
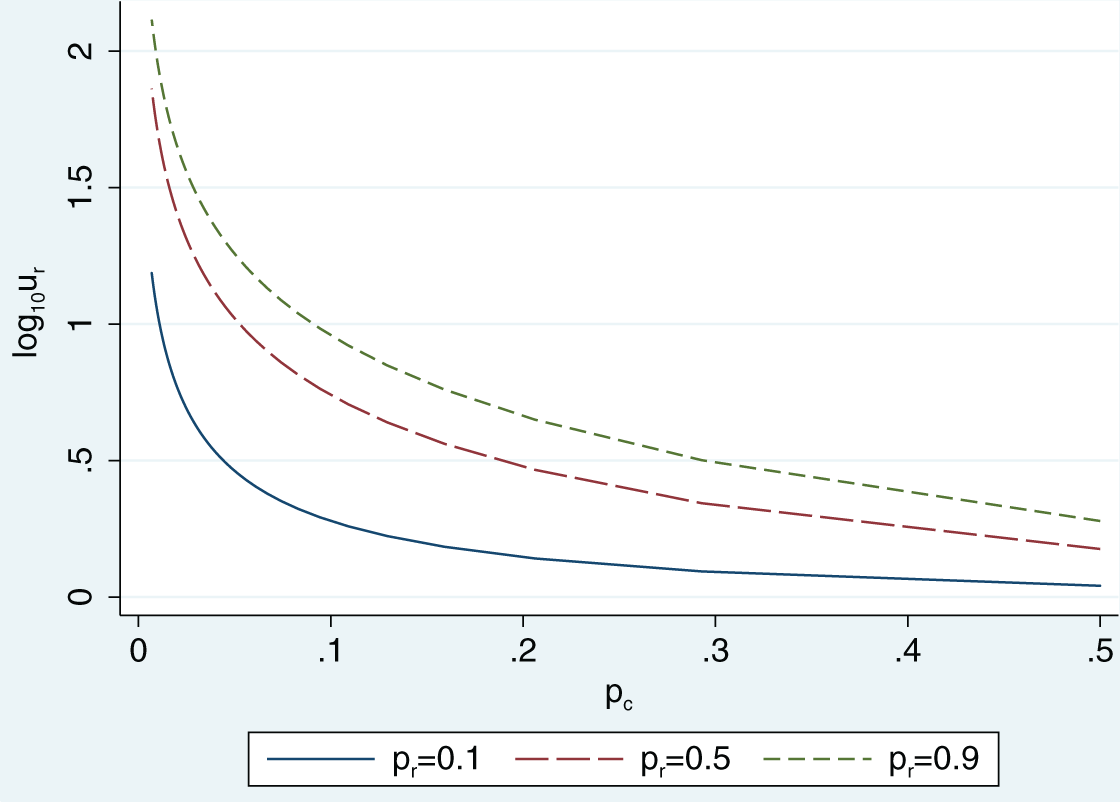
Figure 1 plots the relationship between pc and
It may be suggested that potential rebels are unlikely to consult actuarial tables and make careful calculations about the costs and benefits of their actions. However, the blue-collar civilian employees, such as miners, loggers, and fishermen, who receive the large-wage premiums are also unlikely to do so. Instead, they engage in cruder calculations and informal decision-making to conclude that they should demand more money for jobs that place their lives in jeopardy. Those engaged in illegal employment should weigh their costs no differently (Becker 1968).
If this theory is correct, it will have several implications. First, it will identify a new variable—life expectancy—which affects civil war, thereby expanding our understanding of which factors cause conflict and should be included in future analysis. Second, it will expand the opportunity cost theory of onset to include nonpecuniary costs. Previous tests of the theory have focused solely on pecuniary costs. While using gross domestic product (GDP) per capita as a proxy for forgone wages has given results that support this theory in both correlative (Hegre and Sambanis 2006) and causal studies (Miguel, Satyanath, and Sergenti 2004), analysis using unemployment rates has not (Berman et al. 2011). Applying the theory to Palestinian terrorists has found no effect (Krueger and Malečková 2003; Berrebi 2007), 3 although selective recruitment by the terrorist organizations may be driving the result (Bueno de Mesquita 2005; Benmelech, Berrebi, and Klor 2012). By expanding the analysis to nonpecuniary costs, this article provides a new perspective on this debate. Third, in terms of both dollars and lives, civil war is massively destructive. If low life expectancy causes civil war, then interventions that increase life expectancy should also reduce the probability of civil war. Current analysis of the benefits of public health interventions fails to consider this effect, thereby underestimating the interventions’ utility.
Naive Regression
This article uses the Uppsala Conflict Data Program/Peace Research Institute Oslo (UCDP/PRIO) definition of civil war onset: the first year a conflict caused at least twenty-five battle deaths (Themnér and Wallensteen 2014; Gleditsch et al. 2002). 4 The dependent variable is binary, taking a value of 0 when the country is not in civil war and 1 for years in which a civil war began. Since a country cannot enter civil war while a civil war is ongoing, the value of civil war onset is set to missing after the first year of conflict. The data set begins in 1946 and ends in 2013. The onset data are brought forward one year to diminish the effect of civil war on the independent variables, so that it effectively runs until 2012. 5
Figure 2 provides readers a chance to visually examine the data before proceeding to the econometric analysis. Since onset may only take two values, a scatter plot of life expectancy versus civil war onset is not informative. 6 Instead, Figure 2 presents a graph of the number of years each country spent in civil war versus its life expectancy during times of peace, showing a strong negative correlation between the variables.
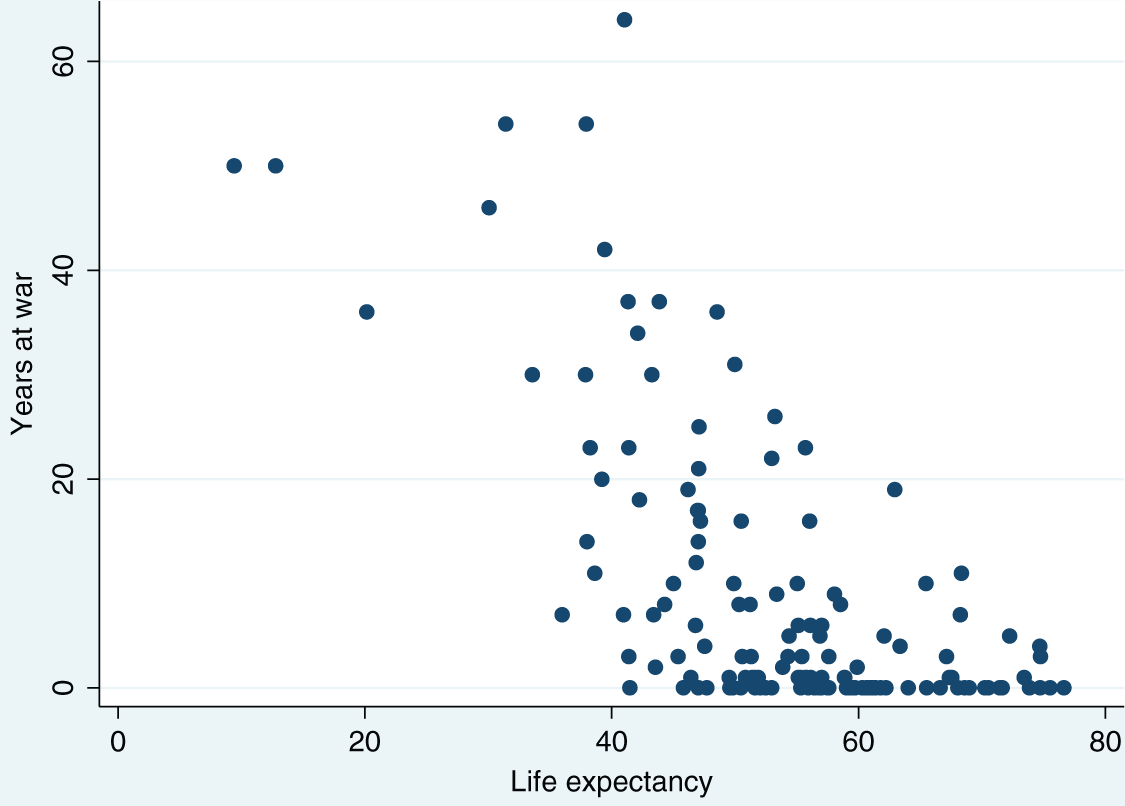
Scatter plot of life expectancy versus years in civil war.
Of the factors that Hegre and Sambanis (2006) find are robustly correlated with civil war, three could affect life expectancy: GDP per capita, the growth rate of GDP per capita, and the Polity index. As countries become richer, their citizens and governments can afford to devote more resources to health care. To ensure that life expectancy is capturing only the opportunity cost of dying in combat, and is not acting as a proxy for GDP and GDP growth, GDP and GDP growth are included as controls in the naive regression. Because they have to respond to the demands of the electorate or lose office, democrats may place more emphasis on the health of their citizens than dictators (Kudamatsu 2012). The standard measure of regime type, the Polity index, is comprised of five components and is robustly correlated with civil war. Vreeland (2008) shows that this correlation is tautological, since two of the score’s components explicitly take political violence into account in their grading. Examining the components that are not by definition related to civil war, he finds no correlation. Nonetheless, to exclude the possibility that life expectancy is proxying for an omitted measure of regime type, the square of the openness of executive recruitment (Xropen) component of the Polity index is included as a control variable in some regressions. 7 A Xropen missing dummy variable is included to account for cases where Xropen cannot be given a score due to a period of interruption, interregnum, or transition. In these cases, Xropen is assigned a value of 0. Life expectancy, GDP, GDP growth, and population data all come from the World Bank (2014). Polity data come from the Polity IV Project (2014).
Table 1 presents summary statistics for these variables, as well as population, percentage of the population who are Muslim, ethnic fragmentation, and the average age at which men marry. The latter variables are used in the natural experiment and are discussed in that section. The all countries sample includes countries with a population of at least 500,000 in 1990. 8 To ensure comparability between regressions, a country-year observation is included in the sample only if data for all variables listed in Table 2 are available, effectively restricting the sample to 1961 through 2012.
Summary Statistics for the All Countries 1961 to 2012 Sample.
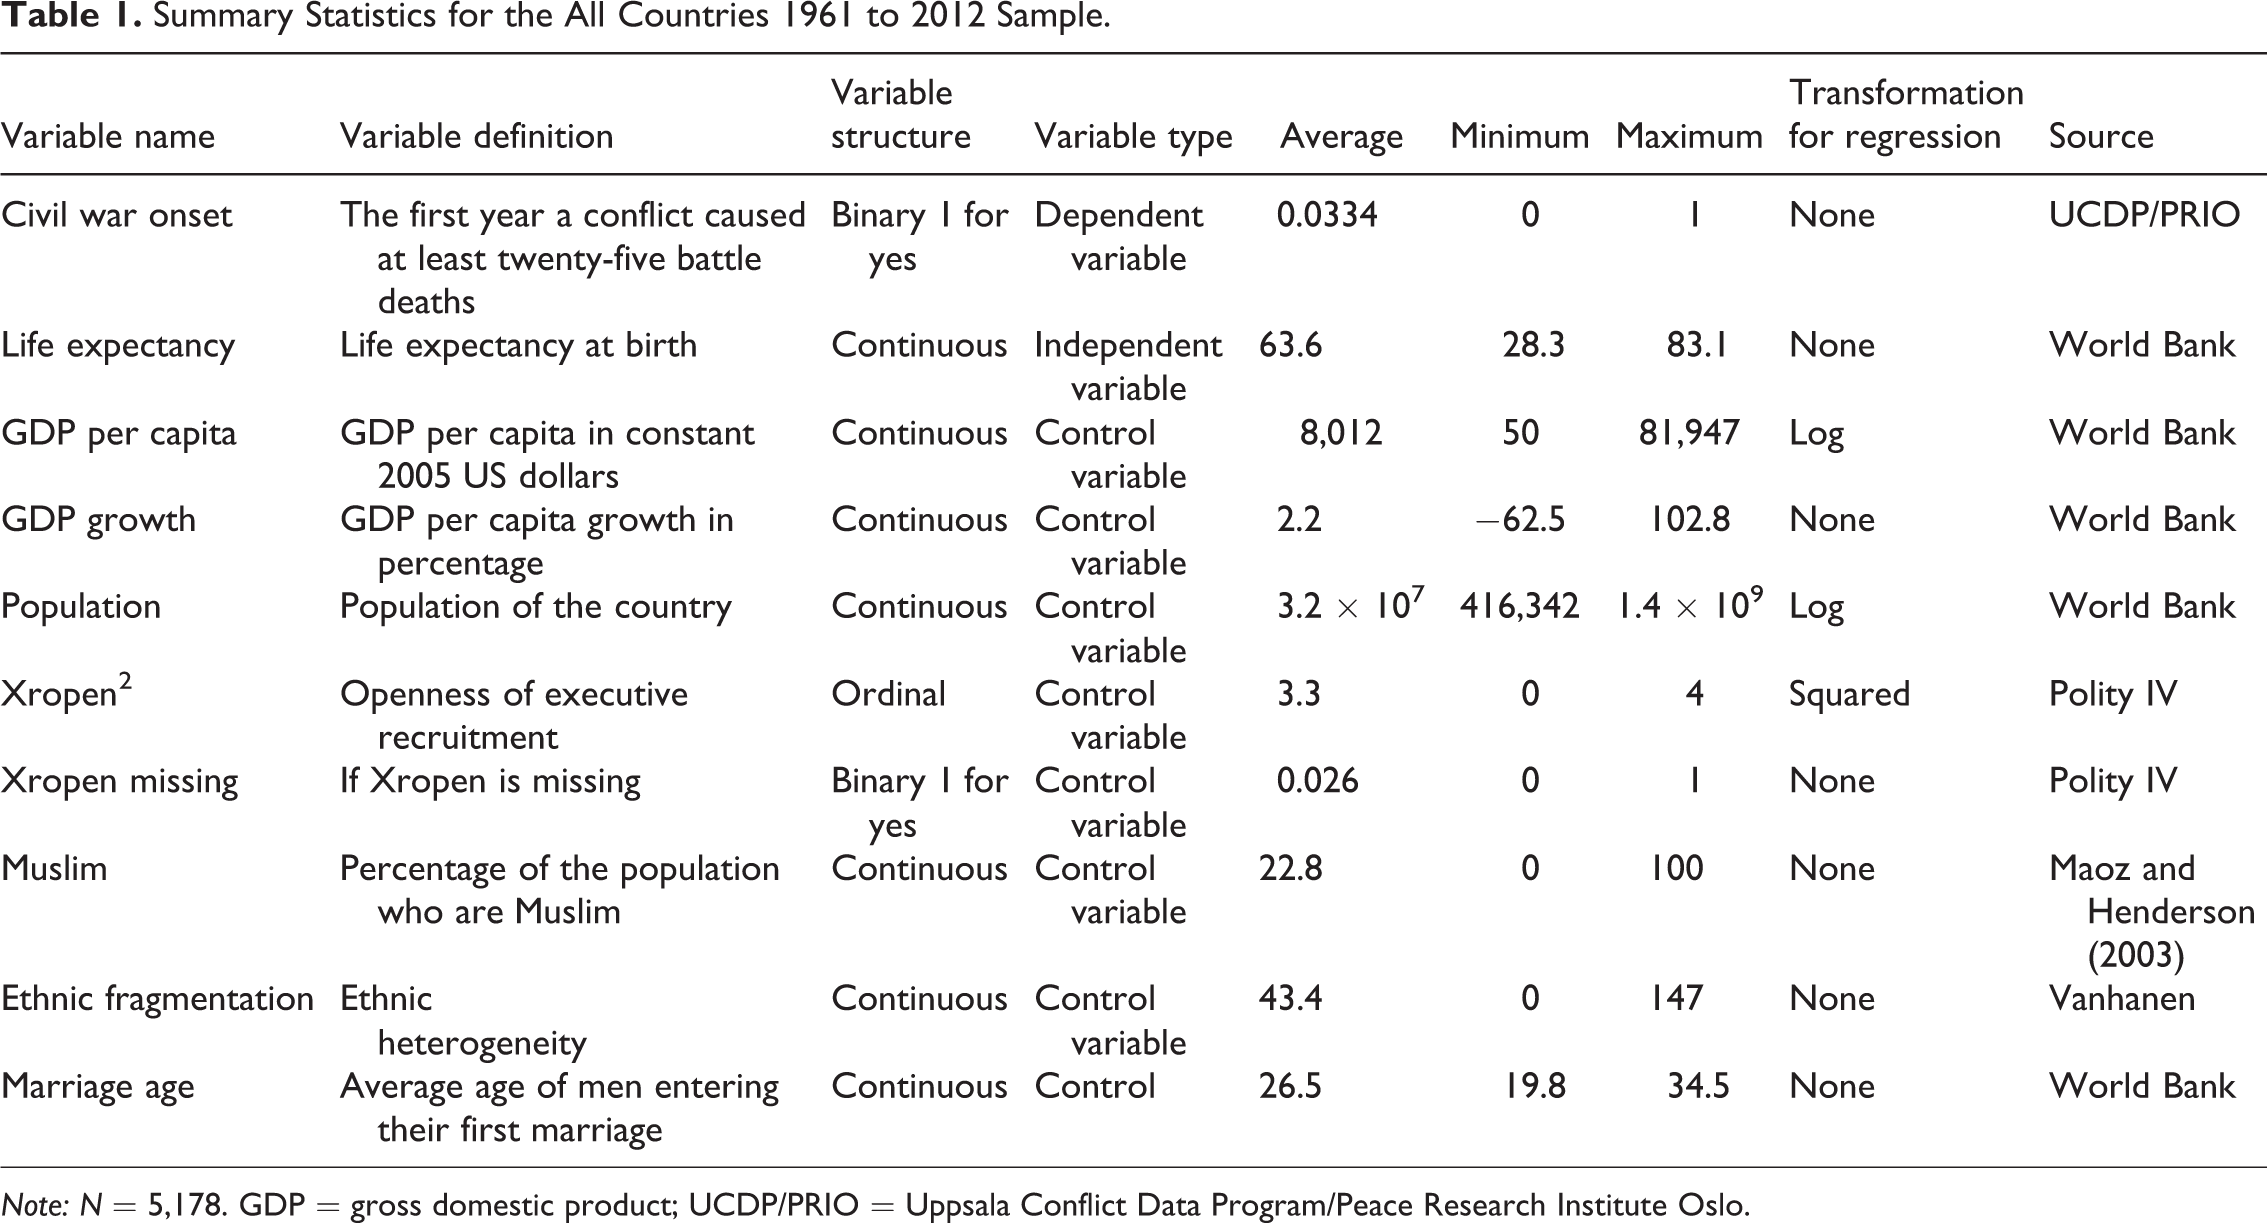
Note: N = 5,178. GDP = gross domestic product; UCDP/PRIO = Uppsala Conflict Data Program/Peace Research Institute Oslo.
Naive Probit Results of the Effect of Life Expectancy on Civil War Onset, All Countries Sample.
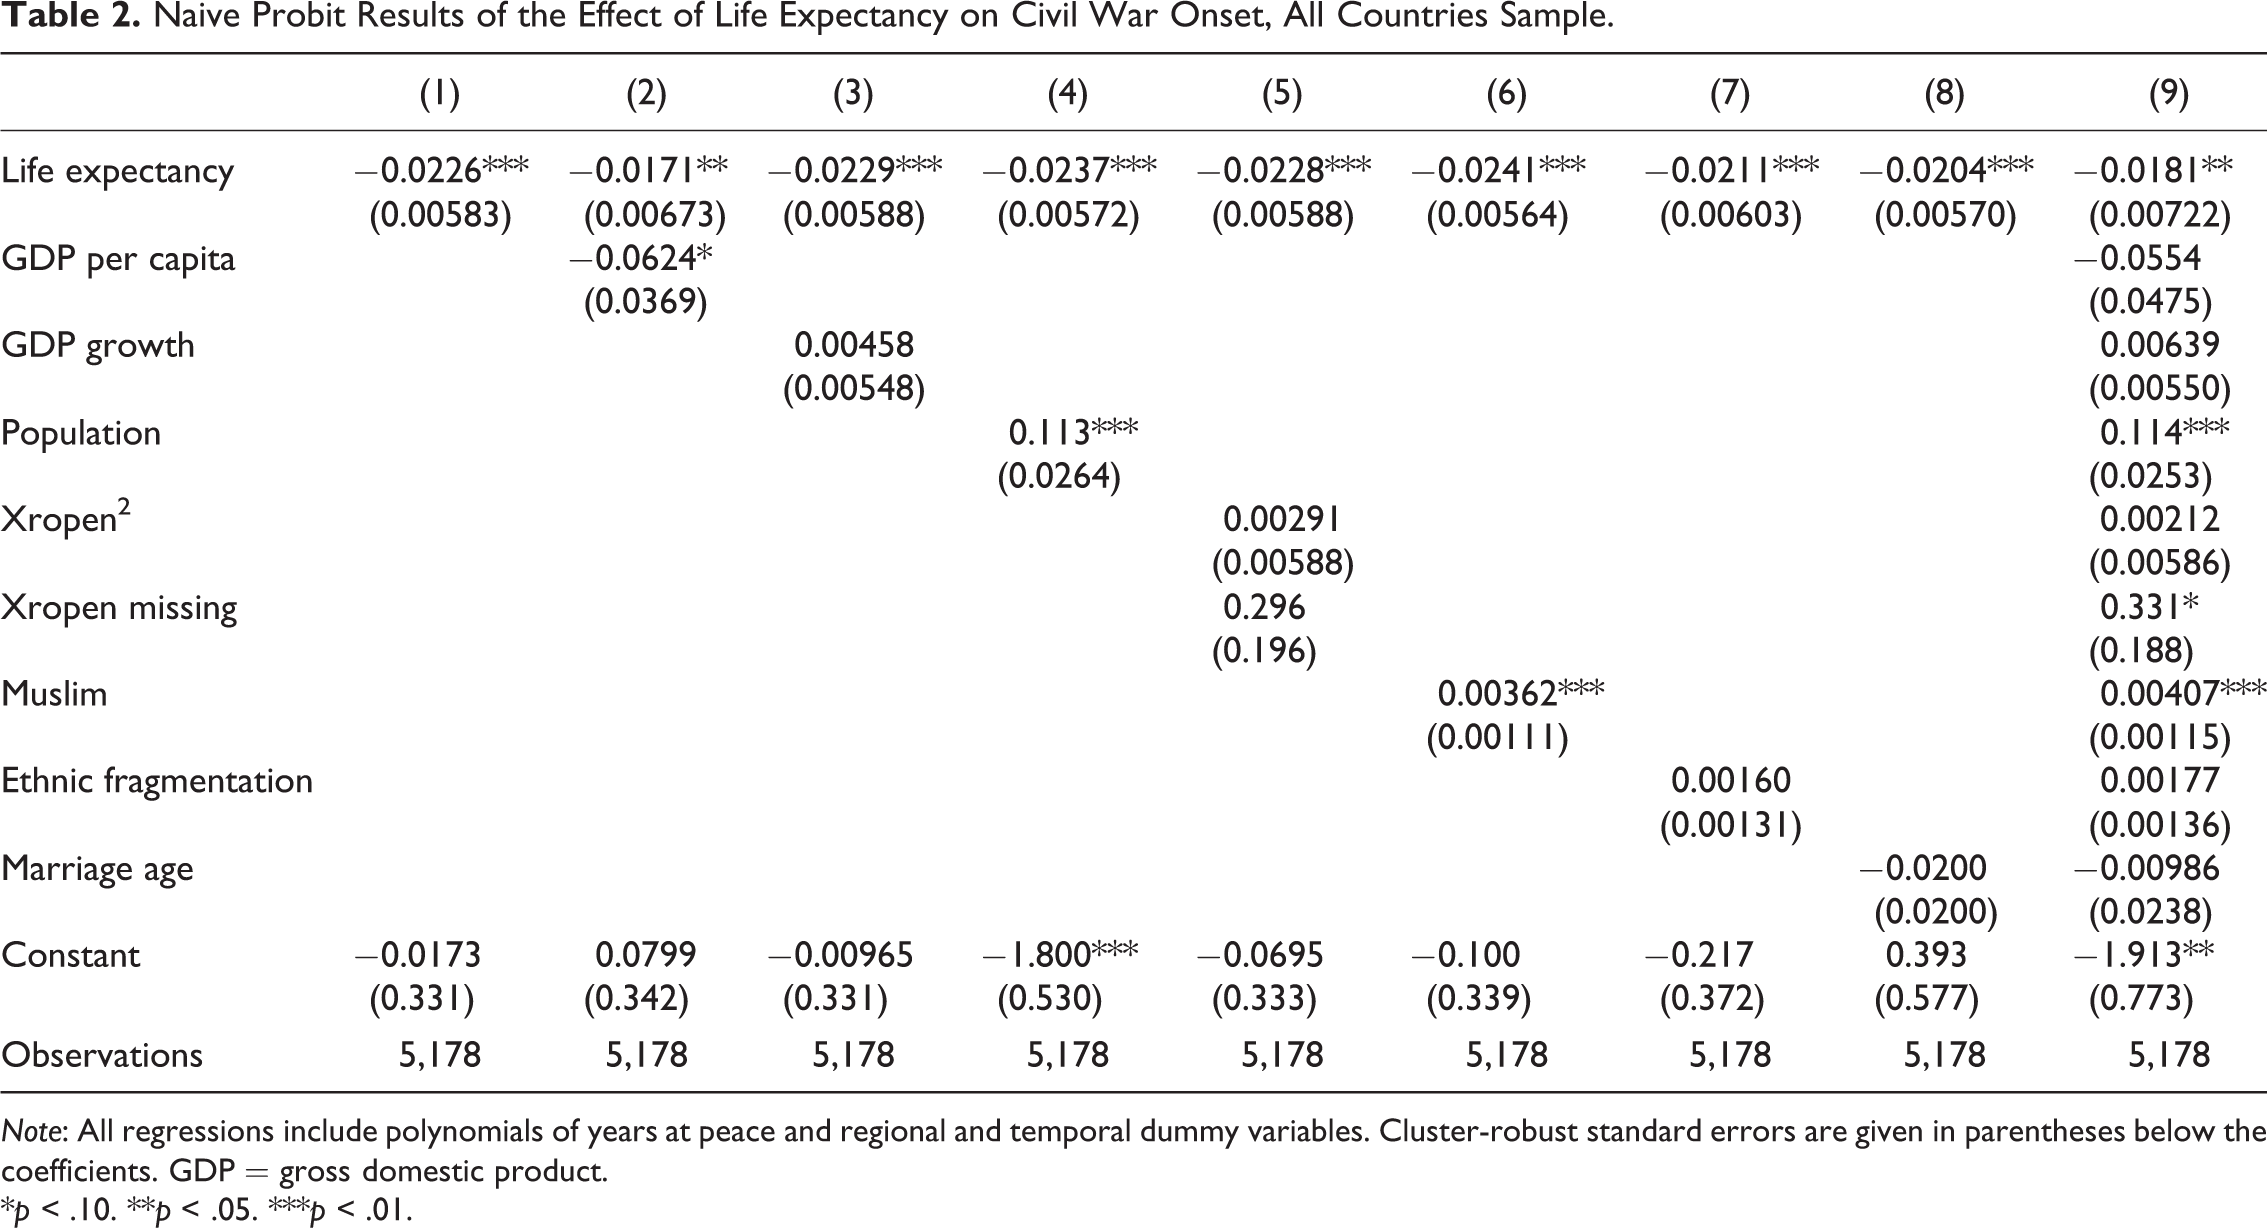
Note: All regressions include polynomials of years at peace and regional and temporal dummy variables. Cluster-robust standard errors are given in parentheses below the coefficients. GDP = gross domestic product.
*p < .10. **p < .05. ***p < .01.
Table 2 reports the results of the naive probit regressions on the all countries sample described above. 9 Column 1 shows that decreases in life expectancy one year are correlated with civil war onset in the next year at the 1 percent significance level. Columns 2 through 5 show that this result is robust to the inclusion of GDP, GDP growth, population, and Polity data. Columns 6 through 8 show that it is robust to the inclusion of the percentage of the population who are Muslim, ethnic fragmentation, and age at marriage. Column 9 includes all of the preceding variables, and, in this case the result is significant at the 5 percent level.
Natural Experiment
The results in Table 2 show that life expectancy is highly correlated with the onset of civil war. These results, however, must be interpreted with caution. Regressing life expectancy on civil war onset gives rise to endogeneity concerns since factors that have already been found to cause civil war, such as GDP, may affect life expectancy. Moreover, third factors, such as the quality of a nation’s institutions and government, also affect both life expectancy and the probability of civil war. While in theory these may be corrected for, mismeasurement of any of these variables could result in part of their effect being mistakenly attributed to life expectancy, making it spuriously significant.
The HIV/AIDS epidemic in sub-Saharan Africa has created a tragic natural experiment for examining the effect of life expectancy on civil war. Two out of three cases of the disease are in sub-Saharan Africa. Since 1990, AIDS has killed 20 million people there and lowered life expectancies by as much as twenty-five years (UNAIDS 2014). Moreover, there is substantial cross-country variation among African nations, with countries such as Botswana and Zimbabwe seeing substantial declines while others like Madagascar and Senegal have barely been affected. While other diseases quickly incapacitate and then kill their victims, HIV takes several years to cause AIDS. During this time, those infected are healthy, capable of rebelling, and doomed.
Rational choice theory assumes that individuals are well informed about the consequences of their actions and weigh them carefully (March and Simon 1958). Many Africans who have HIV/AIDS do not know they are infected. Those who do know are unable to say with certainty when they will die. People are, however, able to observe the deaths of their friends and family and use this to form a rough estimate of their own life span. While this estimate will not be exact, it will still cause people to be more willing to fight as the epidemic intensifies.
In order to ensure that the magnitude of a country’s HIV/AIDS epidemic is not driven by variables that could affect civil war through other channels, male circumcision rates from no later than 1967 are used as an instrumental variable for HIV prevalence and life expectancy. Since 1986 (Alecena 1986; Fink 1986), the medical community has suspected that male circumcision is correlated with a lower risk of HIV infection in heterosexual men. In the following two decades, scores of studies have shown the correlation is robust to the population of heterosexual men under study (Weiss, Quigley, and Hayes 2000; Siegfried et al. 2003). Three randomized clinical trials to test male circumcision’s effectiveness had to be stopped early on ethical grounds because interim results showed circumcision to be sufficiently effective that denying it to the control group was considered immoral (Auvert et al. 2005; Bailey et al. 2007; Gray et al. 2007). Citing preliminary results of these trials, the World Health Organization (2006) recommended men be circumcised in order to reduce their risk of contracting HIV.
Murdock (1967) synthesizes hundreds of anthropological studies into an Ethnographic Atlas, although it more closely resembles an anthropological database. Among the variables he reports is whether a tribe practices male circumcision. While he does report the age at which circumcision is performed, he does not report what percentage of men are circumcised since tribes require all their members to follow their circumcision practices. In tribes that practice circumcision, males who are not circumcised are considered to be boys, not men, with little social standing. The presence of foreskin is seen as feminine and therefore sexually repulsive to heterosexual women (Niang and Boiro 2007). Removing the age at which circumcision is performed transforms Murdock’s circumcision variable into a dummy variable.
Alesina et al. (2003) provide data on the percentage of each tribe in each country. Williams et al. (2006) multiply Alesina et al.’s tribe-by-country matrix with Murdock’s circumcision-by-tribe vector to calculate the percentage of men who are circumcised in each country in sub-Saharan Africa. For instance, if a country was composed of 50 percent tribe A, 30 percent tribe B, and 20 percent tribe C, and tribes A and B practiced male circumcision and tribe C did not, then the country’s circumcision rate would be (0.50 × 1) + (0.30 × 1) + (0.20 × 0) = 0.80. Williams et al. perform these calculations for most of the countries in sub-Saharan Africa. However, they use current circumcision data for Botswana, Burkina Faso, Cameroon, Côte d’Ivoire, Ghana, Kenya, Mozambique, South Africa, Tanzania, and Uganda. This article uses Williams et al.’s method to calculate the historical circumcision rate for these countries, except Côte d’Ivoire and Ghana where Williams et al. note that a tribe was misclassified as not practicing circumcision when they did, and Tanzania, since data on percentage of each tribe in the population are not available. Furthermore, Williams et al. do not report data for Madagascar or Mauritius. This article calculates the rate for Madagascar, but it cannot do so for Mauritius since circumcision-by-tribe data are not available for the island nation. These efforts yield circumcision rates for all countries in sub-Saharan Africa with populations of over 500,000 people, except Mauritius.
Circumcision practices predate colonial influences and there is no theoretical reason why they should be correlated with common political, economic, or social variables (apart from those discussed below). The quality of a government’s response to the HIV/AIDS epidemic, such as whether it encourages male circumcision to help prevent HIV infections, could be correlated with unmeasurable factors that influence its vulnerability to civil war. By using male circumcision data from no later than 1967, fifteen years before the medical community identified HIV and almost two decades before a correlation between male circumcision and infection was suggested, this concern is avoided.
Muslims regard male circumcision as a religious mandate and practically all Muslim men are circumcised. 10 Male circumcision among non-Muslims in sub-Saharan Africa is a cultural practice that varies by tribe. As a result, the correlation between male circumcision and the percentage of the population who are Muslim is .59. At the same time, Islam may affect the probability of civil war independently of its effect on male circumcision. While it is important to reiterate that the vast majority of Muslims reject violent religious struggle, UCDP/PRIO reports that Islamist groups have participated in civil conflicts in Chad (Islamic Legions), Eritrea (Harakat al Jihad al Islami), Ethiopia (Al-Itihaad al-Islamiya), Mali (Ansar Dine), Nigeria (Boko Haram), and Somalia (Al-Shabaab). All of these countries have a large fraction of the population who are Muslim, ranging from 34 percent of the population (Ethiopia) to over 99 percent of the population (Somalia), for an average of 62 percent. Countries that have not experienced Islamist participation in their civil war (either because they have not had a civil war or there has been no Islamist participation) have between less than 1 percent of the population who are Muslim (Botswana, Lesotho, Namibia, and Swaziland) to 90 percent of the population who are Muslim (Senegal). On average, 26 percent of their population is Muslim. Therefore, the data suggest having a high percentage of the population who are Muslim may be related to Islamist participation in a civil war. So while male circumcision decreases HIV prevalence, increases life expectancy and, in theory, decreases the probability of civil war, increases in the percentage of the population who are Muslim may result in greater religious strife and civil war. Therefore, the effect of Islam could attenuate the effect of circumcision. To ensure male circumcision is not acting as a proxy for the percentage of the population who are Muslim, the latter variable should be included as a control.
If circumcision is randomly distributed by tribe, countries with fewer tribes will be likely to have circumcision rates nearer the extremes of 0 or 100 percent circumcision, while countries with more tribes will be likely to have circumcision rates nearer the expected mean. Ethnic fragmentation is robustly correlated with civil war (Hegre and Sambanis 2006). The correlation between ethnic fragmentation and male circumcision in sub-Saharan Africa is .53. To ensure that circumcision is not acting as a proxy for ethnic fragmentation, the variable should be included as a control.
Leaving home to become a guerrilla is a greater hardship for those with wives and children. If the proportion of men who are married is correlated with male circumcision rates, this could confound the analysis. While the percentage of men who are married is not available, the average age of men when they marry is available. It is mildly correlated with circumcision rates, −.10, so to ensure that circumcision is not acting as a proxy for the lack of familial responsibilities, it should be included as a control.
Although these corrections prevent other variables from influencing life expectancy, life expectancy could impact other variables. 11 For instance, declines in life expectancy decrease a country’s population. Hegre and Sambanis find population to be positively correlated with civil war onset, so excluding population from the regression would bias the coefficient on life expectancy toward 0. Therefore, population is included as a control. The effects on GDP per capita and GDP growth are less clear. On the one hand, the epidemic decreases the number of workers while leaving physical capital unharmed, thereby increasing the capital–labor ratio and, in turn, wages. On the other hand, HIV/AIDS incapacitates working age adults and lowers human-capital formation by shortening the number of working years in which individuals benefit from their education (Fortson 2011; Oster, Shoulson, and Dorsey 2013). If the former effect dominates, this would bias the coefficient on life expectancy toward 0, while if the latter effect dominates, this would increase the absolute value of the coefficient of life expectancy. Young (2005) shows that the former effect cancels out the latter, and Cogneau and Grimm (2008) estimate that the epidemic has had a negligible impact on per capita income. Nonetheless, to correct for any possible bias, GDP per capita and GDP growth are also included as control variables. Finally, Polity data were included as a control in Table 3, and while there is no reason to expect that they should be affected by life expectancy, for the sake of consistency, they are also included here.
Summary Statistics for the Sub-Saharan African 1990 to 2012 Sample.
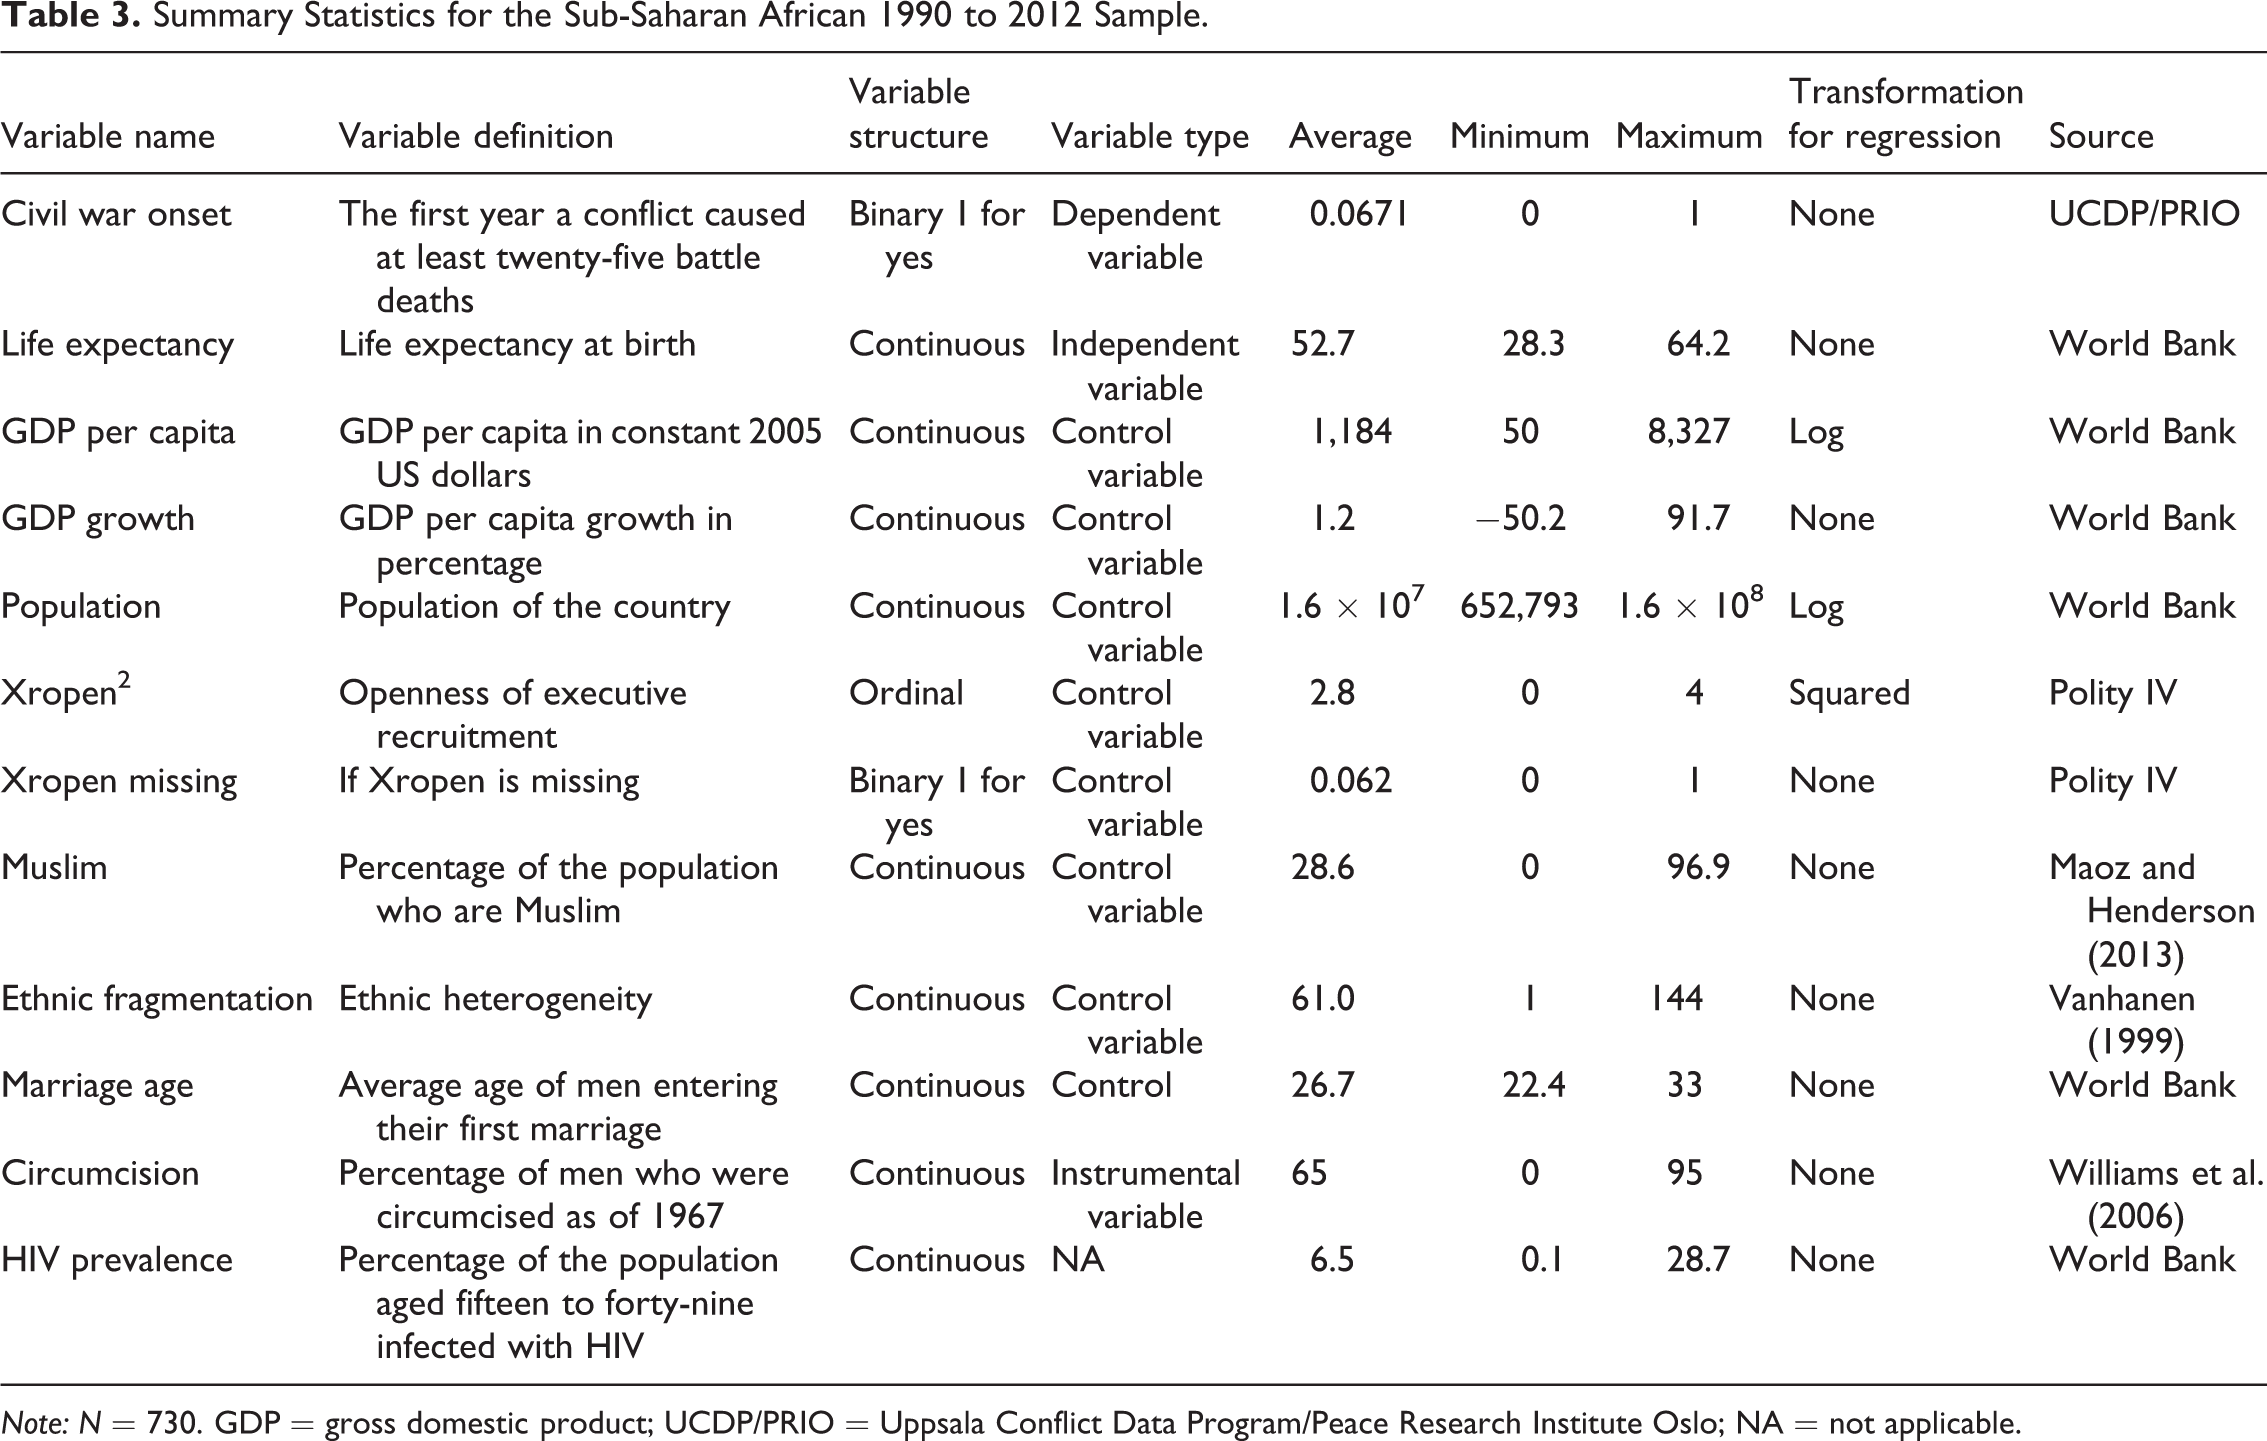
Note: N = 730. GDP = gross domestic product; UCDP/PRIO = Uppsala Conflict Data Program/Peace Research Institute Oslo; NA = not applicable.
Data for HIV prevalence come from the World Bank’s World DataBase and run from 1990 to 2012. The percentage of the population who are Muslim comes from Maoz and Henderson (2013). Vanhanen’s (1999) ethnic heterogeneity variable was the most significant ( p = .001) of the twelve measures of ethnic fragmentation considered by Hegre and Sambanis, so it is used as the measure of ethnic diversity.
Table 3 provides summary statistics for the sub-Saharan African sample. To be included, a country must have a population of at least 500,000 in 1990. 12 Moreover, because the instrumental variable regressions make use of the HIV/AIDS epidemic in sub-Saharan Africa, the sample is restricted to sub-Saharan African countries from 1990 to 2012 for which data on all variables listed in Table 4 are available.
Naive Probit Results of the Effect of Life Expectancy on Civil War Onset, Sub-Saharan African Sample.
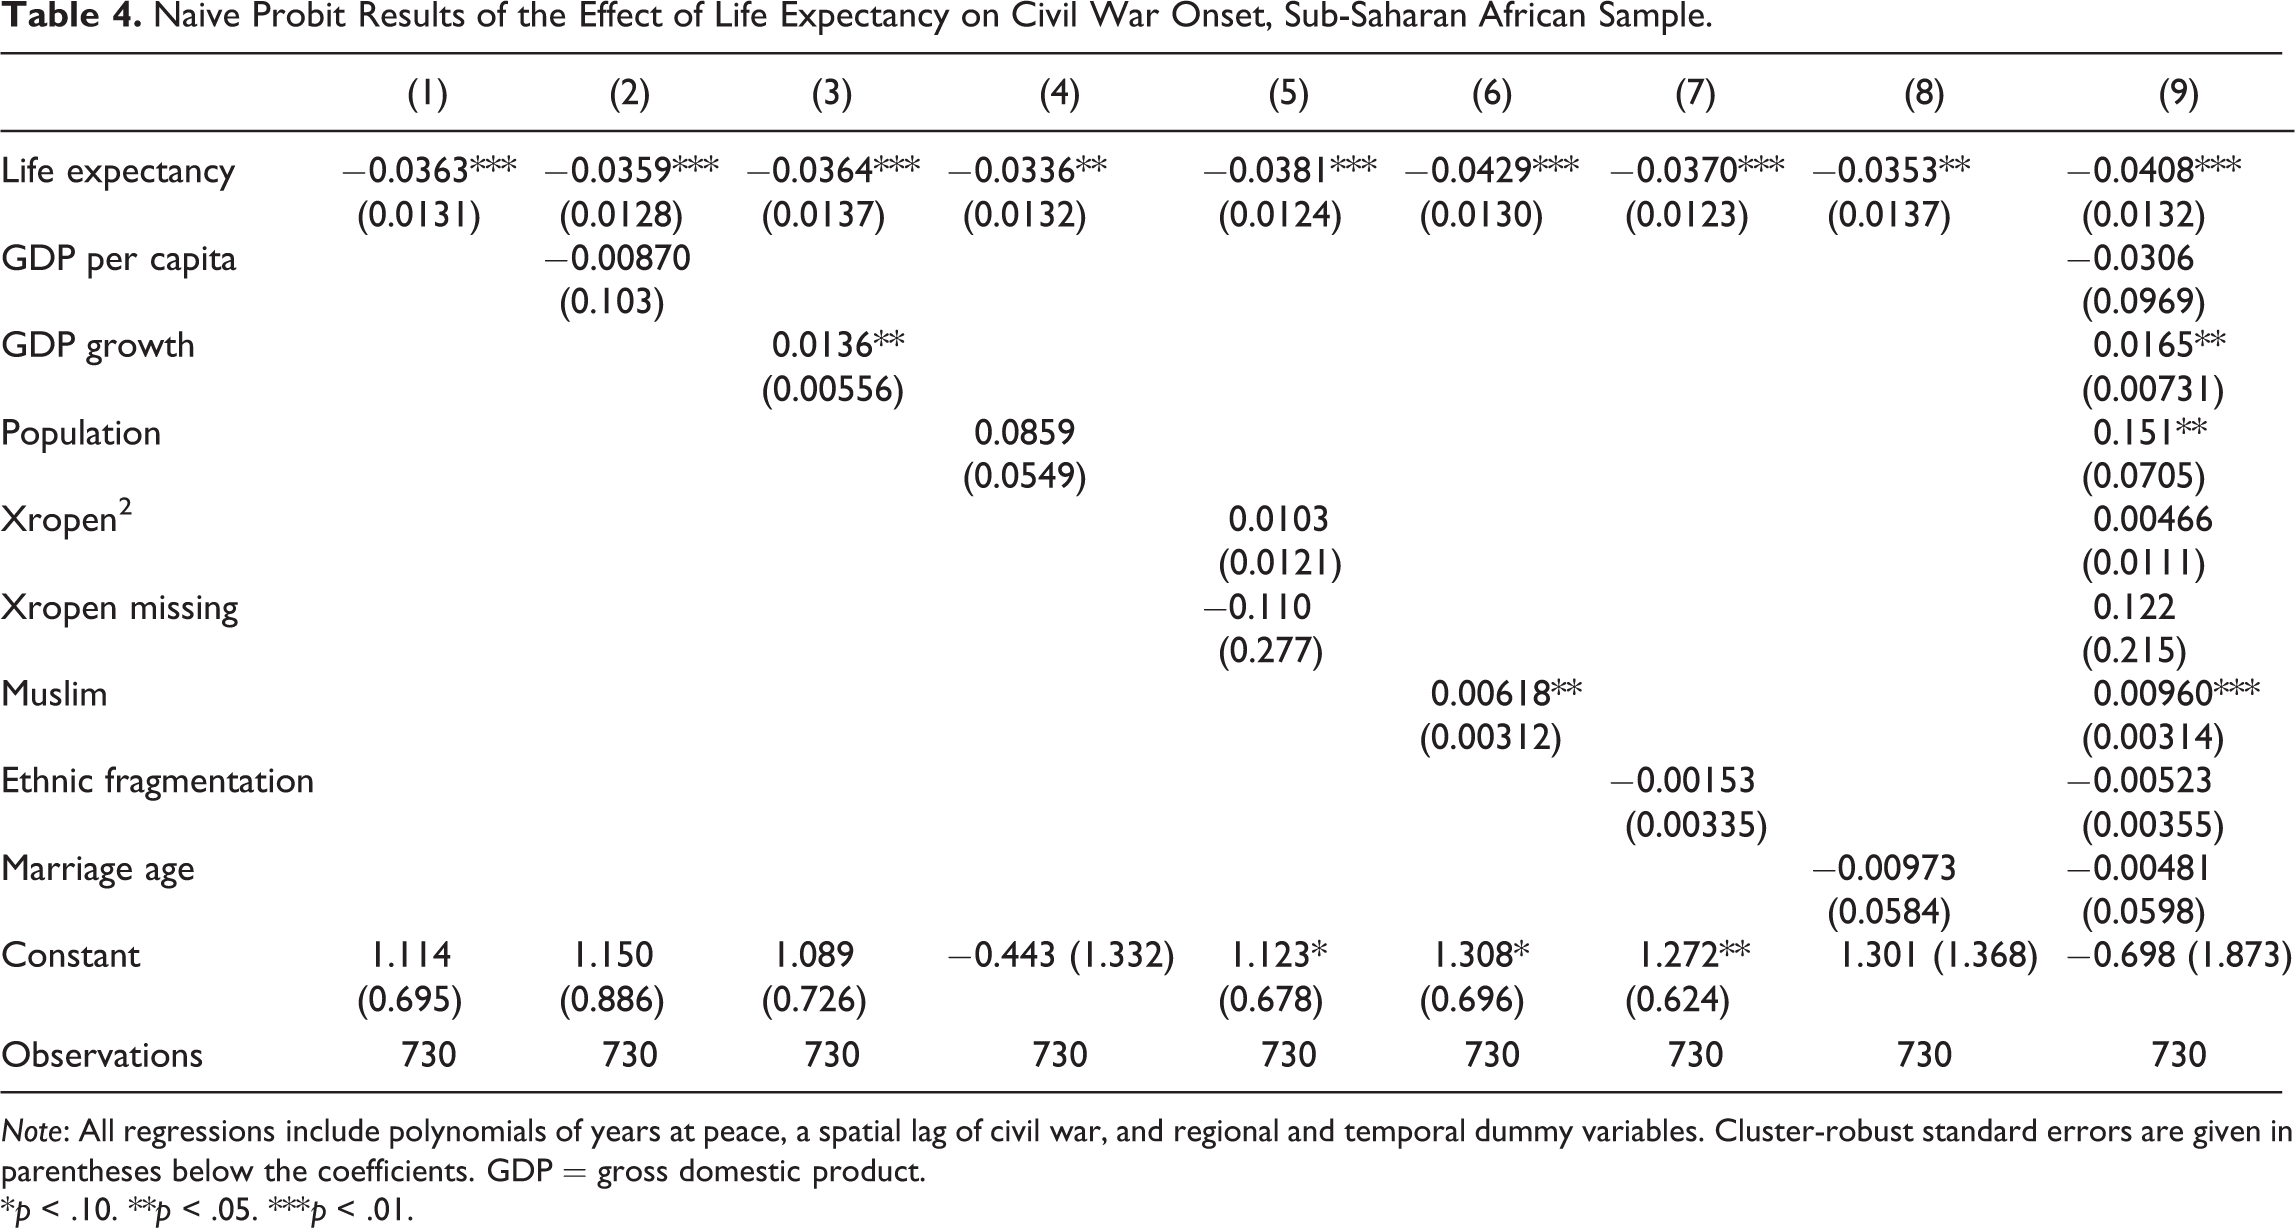
Note: All regressions include polynomials of years at peace, a spatial lag of civil war, and regional and temporal dummy variables. Cluster-robust standard errors are given in parentheses below the coefficients. GDP = gross domestic product.
*p < .10. **p < .05. ***p < .01.
Table 4 reports the results of the naive probit regressions considering the sub-Saharan African sample, to verify that the correlation between life expectancy and civil war onset holds in that sample before proceeding to the instrumental variable analysis. 13 The columns mirror those of the naive probit on the all countries sample. Column 1 shows that decreases in life expectancy one year are correlated with civil war onset in the next year. Columns 2 through 5 show that this result is robust to the inclusion of GDP, GDP growth, population, and Polity data. Columns 6 through 8 show that it is robust to the inclusion of the percentage of the population who are Muslim, ethnic fragmentation, and age at marriage. Column 9 includes all of the preceding variables. While the coefficients differ between the all countries and sub-Saharan African samples, the results are substantively unchanged. In every case, life expectancy is negative and significant, typically at the 1 percent level.
Online Appendix Table 2 illustrates the strong link between historical male circumcision rates and HIV prevalence in sub-Saharan Africa. Column 1 begins with circumcision. Column 2 adds percentage Muslim, ethnic fragmentation, and age at marriage. Columns 3 through 6 include these variables as well as GDP, GDP growth, population, or Xropen. Column 7 includes all these variables. No matter which variables are added, the coefficient on life expectancy remains near −.1 and significant at the 1 percent level.
Online Appendix Table 3 shows that increases in HIV prevalence decrease life expectancy. The variables included in each column are the same as in Online Appendix Table 2. No matter which variables are added, the coefficient on life expectancy remains near −.7 and significant at the 1 percent level.
Table 5 reports the relationship between male circumcision and life expectancy, which is the first stage of the instrumental variable probit. Again, no matter what variables are added, the coefficient on male circumcision rates remains effectively unchanged and the result is significant at the 1 percent level. The table also reports the F statistic on circumcision. In all cases, it is above the Stock, Wright, and Yogo (2002) critical value, so the instrumental variable results will not be attenuated.
The Effect of Circumcision on Life Expectancy.
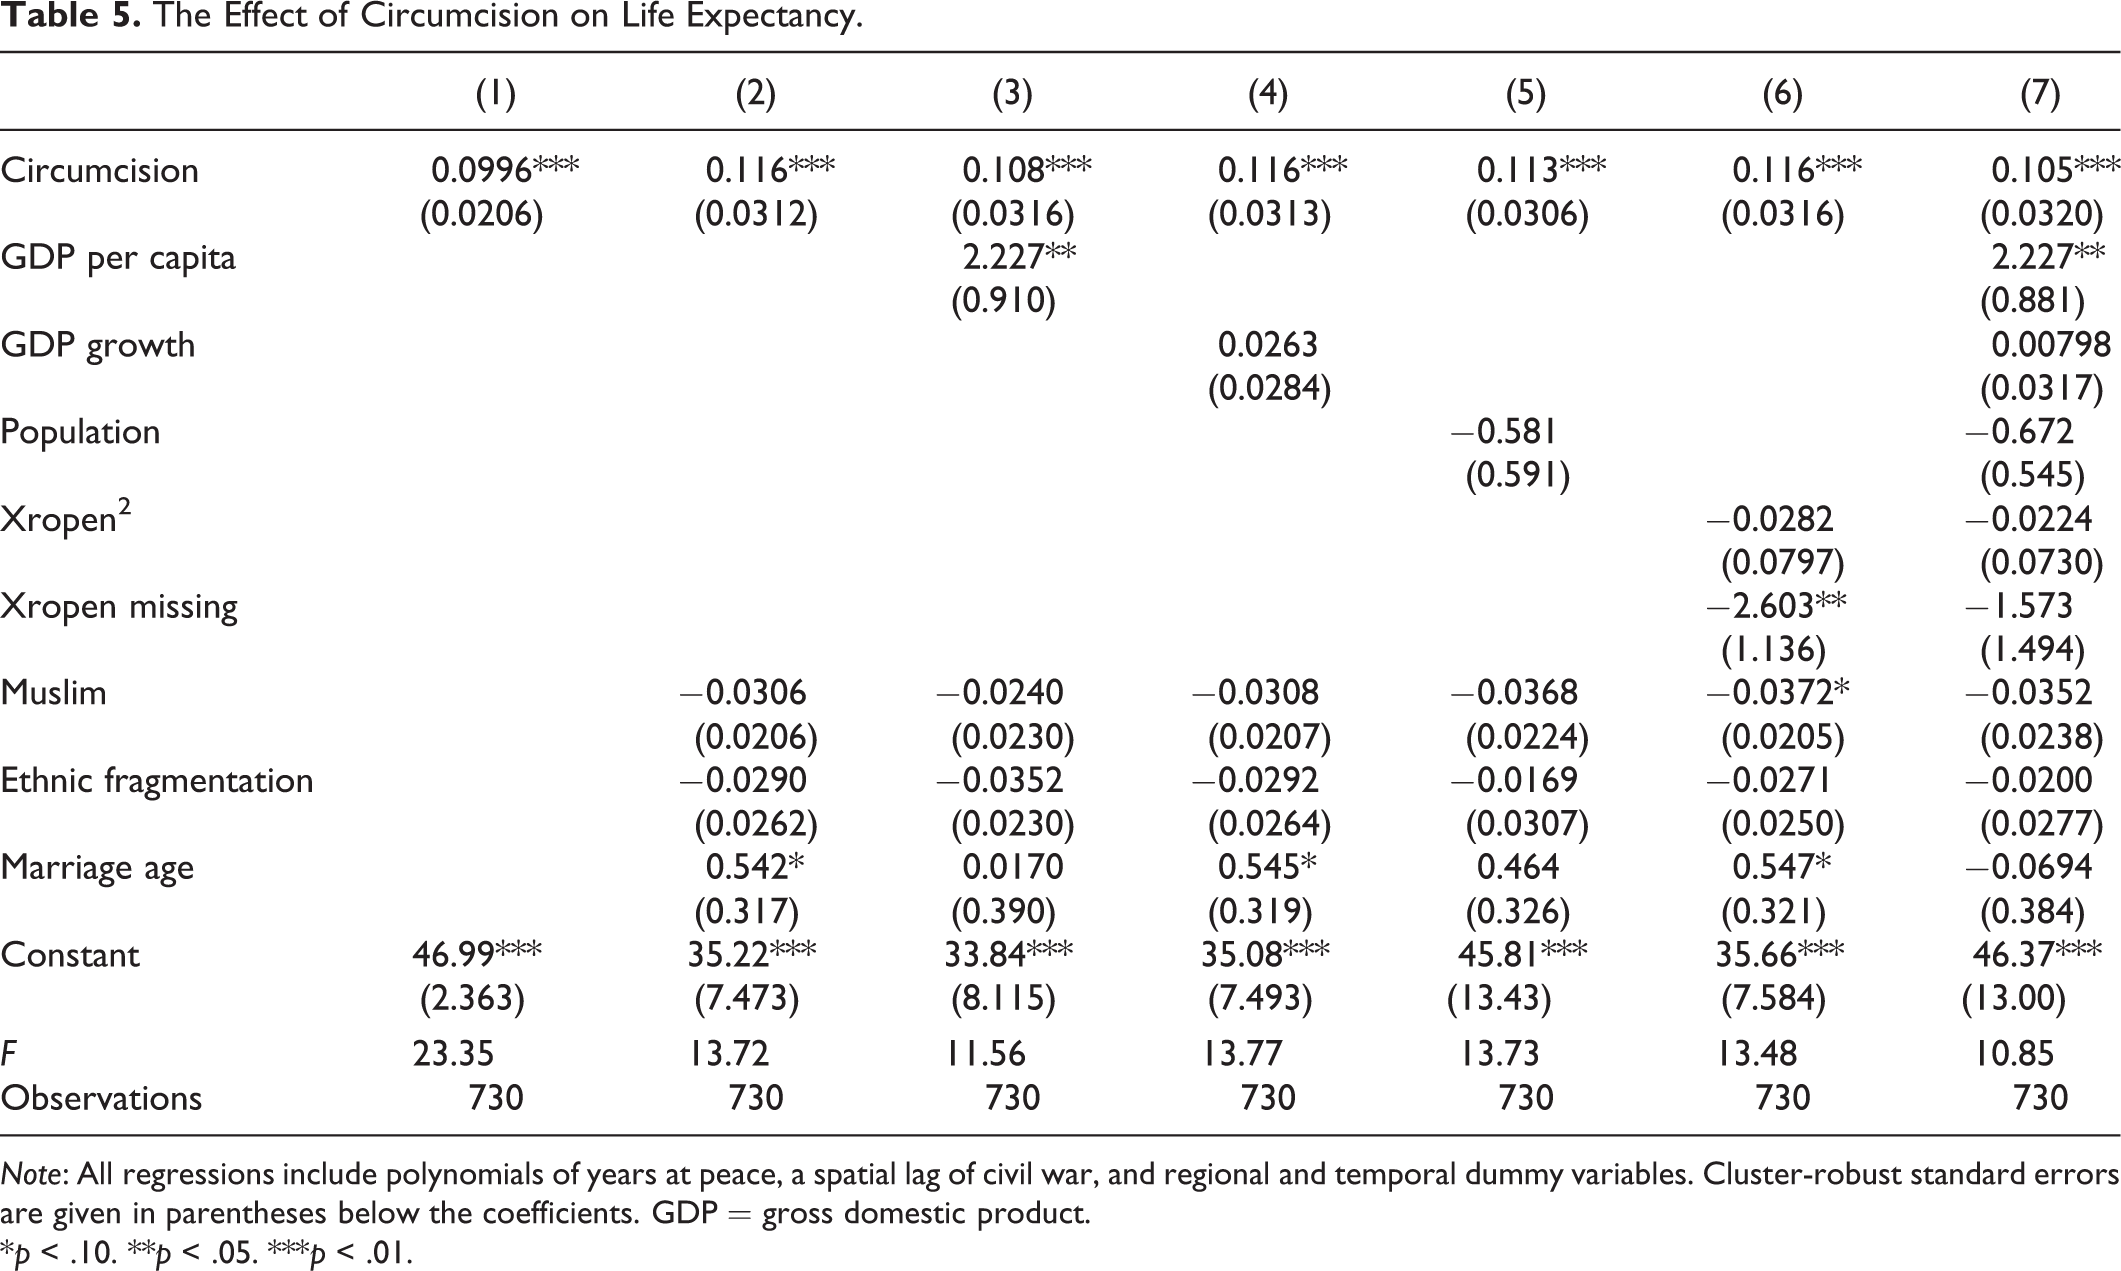
Note: All regressions include polynomials of years at peace, a spatial lag of civil war, and regional and temporal dummy variables. Cluster-robust standard errors are given in parentheses below the coefficients. GDP = gross domestic product.
*p < .10. **p < .05. ***p < .01.
Online Appendix Table 4 reports the reduced form probit results. The variables and countries included in each column of Online Appendix Table 4 are the same as the variables and countries included in the equivalent column of Table 5. The result in column 1 is insignificant, although it should be noted that controls for the percentage of the population who are Muslim, ethnic fragmentation, and age at marriage are not included. They are included in column 2 onward and the results are thereafter significant at atleast the 5 percent level.
Table 6 presents the results from the second stage of the instrumental variable probit, where circumcision is used as an instrument for life expectancy. 14 Life expectancy is significant at the 10 percent level in the first column, however, that regression omits the percentage of the population who are Muslim, ethnic fragmentation, and age at marriage. Columns 2 through 6 include these controls, and the results are significant at the 1 percent level. These results hold regardless of whether GDP per capita, GDP growth, population, or Xropen is included. In the seventh column, when all four variables are included, life expectancy has a p value of .014.
Instrumental Variable Probit Results of the Effect of Life Expectancy on Civil War Onset.
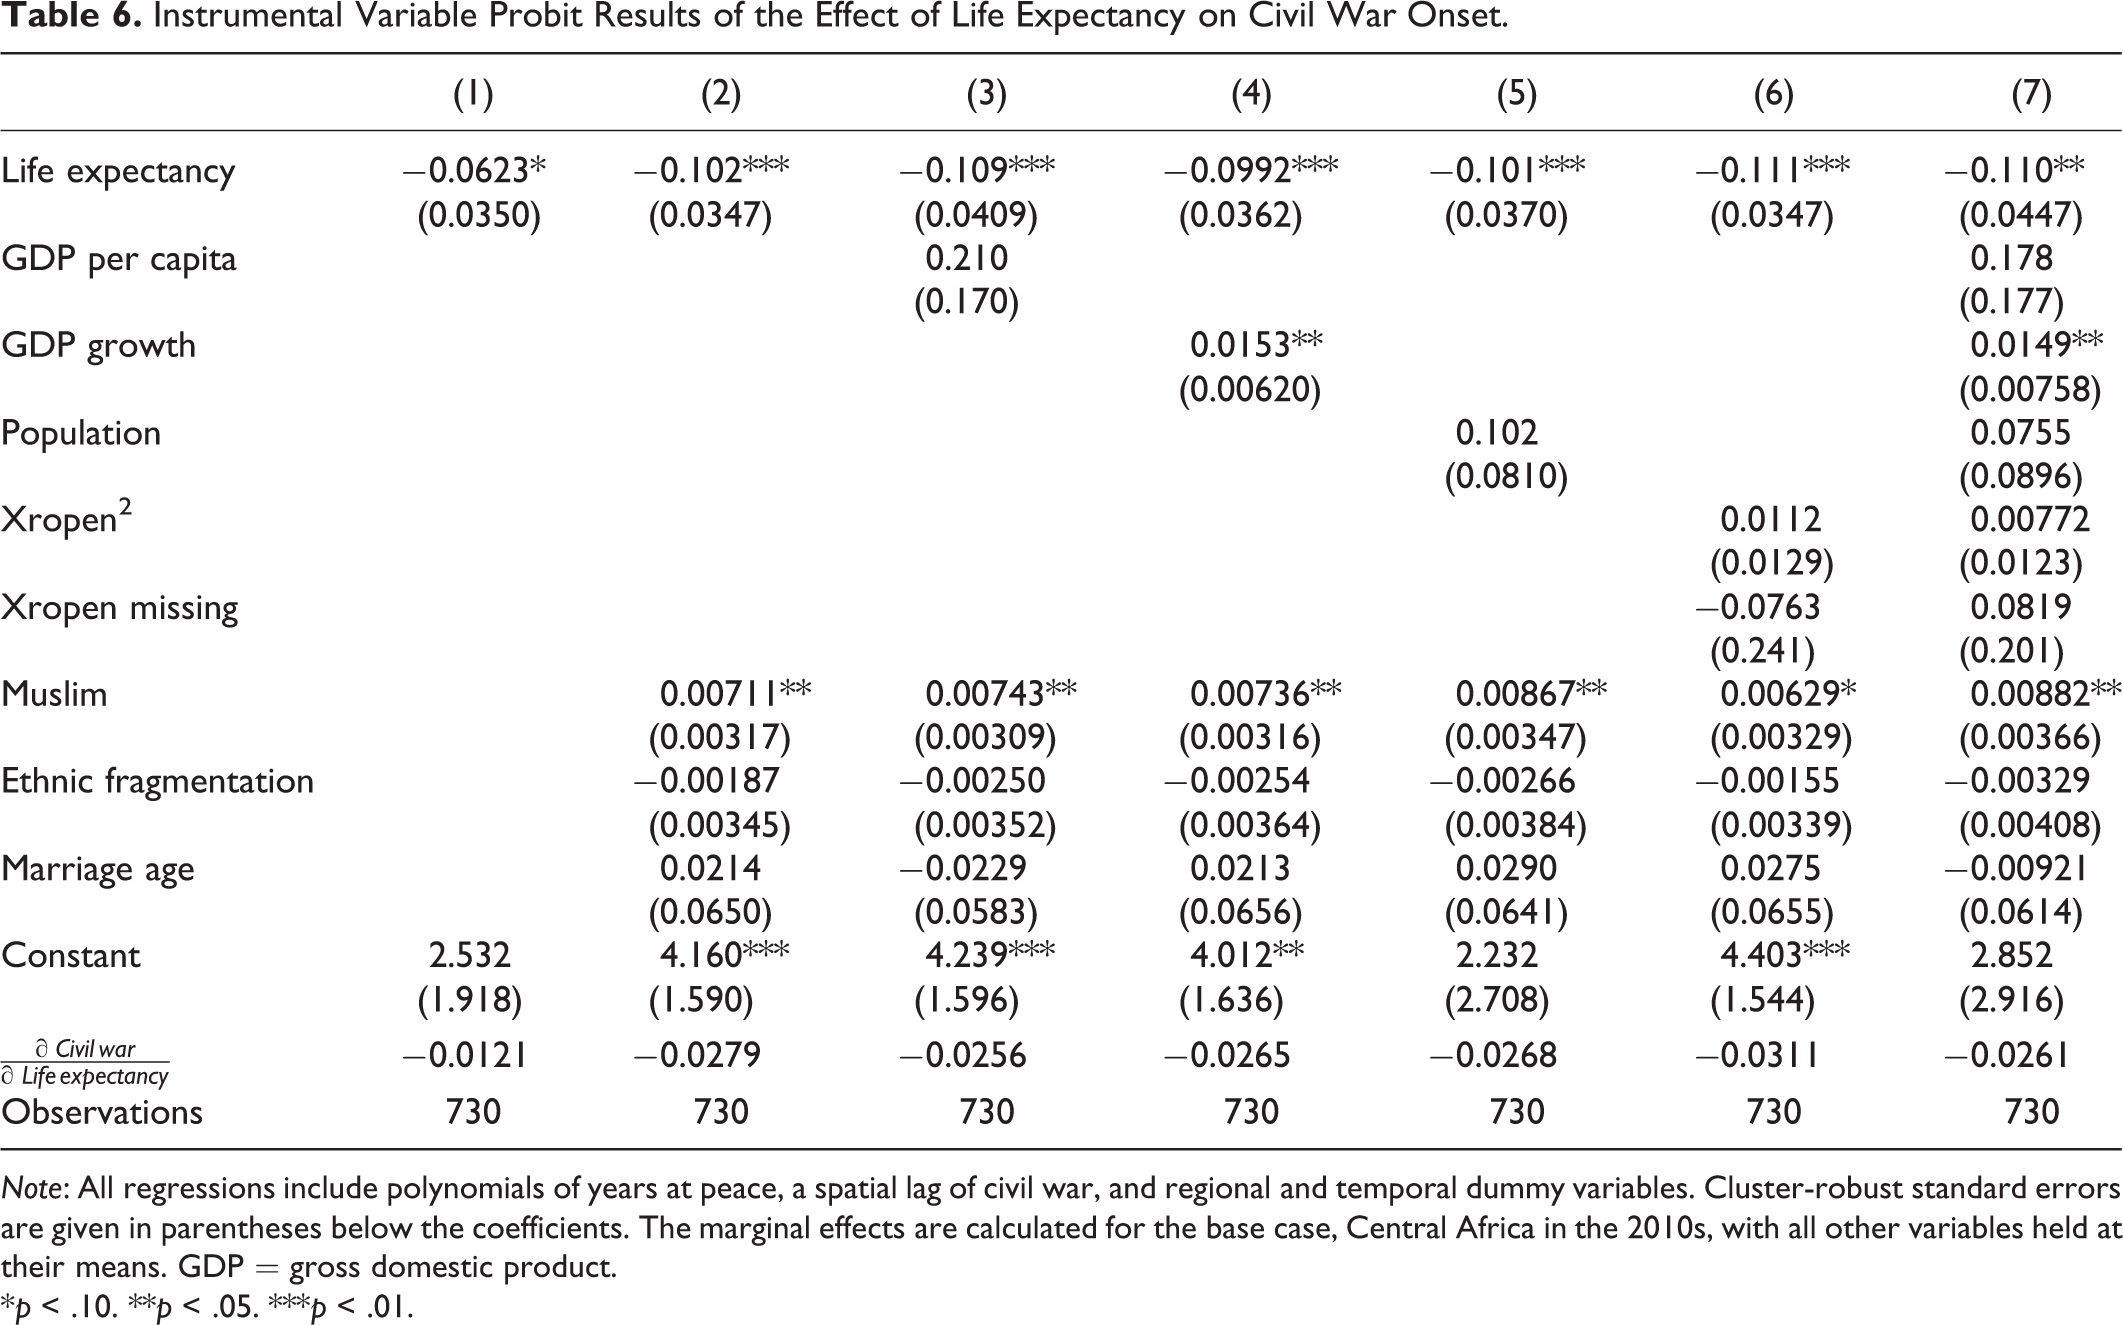
Note: All regressions include polynomials of years at peace, a spatial lag of civil war, and regional and temporal dummy variables. Cluster-robust standard errors are given in parentheses below the coefficients. The marginal effects are calculated for the base case, Central Africa in the 2010s, with all other variables held at their means. GDP = gross domestic product.
*p < .10. **p < .05. ***p < .01.
The coefficient on life expectancy is stable, ranging between −.0992 and −.111 in columns 2 through 7. Because the second stage is a probit, the marginal effect of life expectancy on the probability of civil war onset varies with the values of the independent variables. The second to last row of Table 6 reports this effect when the variables are held at their means. It ranges from −.0256 to −.0311 in columns 2 through 7, so a one-year increase in life expectancy decreases the probability of civil war onset by 2.56 to 3.11 percentage points.
While there is no theoretical reason to believe that the results are driven by a correlation between circumcision and an omitted variable that affects civil war onset, it would be beneficial nonetheless to provide a falsification test to prove this. The falsification test would require a case where circumcision rates have no effect on life expectancy. Prior to the eruption of the HIV/AIDS epidemic in the late 1980s and early 1990s, circumcision rates were poor predictors of life expectancy. Online Appendix Table 6 provides the summary statistics of the sample to the same sub-Saharan African countries considered in Tables 4 through 6, but changes the time frame to 1961 through 1984. Online Appendix Table 7 examines the effect of circumcision on life expectancy in this sample. 15 The columns mirror those in the previous tables. In no case is circumcision statistically significant.
Online Appendix Table 8 reports the reduced form probit where circumcision rates are used to predict conflict prior to the HIV/AIDS epidemic. The columns follow the same pattern as Table 6. In no case is life expectancy statistically significant, showing that the results are not being driven by a fixed effect which is correlated both with circumcision and civil war onset.
Battle Deaths
The model predicts decreases in life expectancy will make becoming a rebel more attractive, resulting in more rebels and therefore a greater chance of civil war. The previous section tested this using a rough measure of civil war, whether a country experienced at least twenty-five battle deaths in a year. Increases in the number of rebels should not only make conflict more likely, it should also make it deadlier (Heger and Salehyan 2007). This section tests the opportunity costs theory with a subtler metric, fraction of the population killed in battle in each war.
Data for battle-related deaths come from the UCDP Battle-Related Deaths Dataset (Uppsala Conflict Data Program 2014b), which provides data from 1989 to 2013. 16 UCDP scrutinizes death information from publicly available sources such as news agencies, journals, research reports, international and multilateral organization, nongovernmental organizations, and the warring parties’ own documents. Nonetheless, they acknowledge that “little information on the exact number of deaths is usually available…[so] the precision of the numbers belies the uncertainty of the estimates” (Uppsala Conflict Data Program 2014a, 6-7). So while the battle-death metric is subtler, it is more susceptible to measurement error.
Notwithstanding this concern, this article tests whether lower life expectancies result in deadlier wars. The percentage of the population killed in battle for each war is calculated using the battle-deaths and population data. Among countries with a civil war, between 0.0000027 and 0.81 percent of their population were killed in the all countries sample, and between 0.000097 and 0.50 percent of their population were killed in the sub-Saharan African sample. Of course, in countries at peace, 0 percent of their population were killed in battle.
Like the civil war onset data, the battle-deaths data are brought forward one year to diminish the effect of civil war on the independent variables. The all countries sample runs from 1988 to 2012. The sub-Saharan African sample runs from 1990 to 2012 to accommodate the instrumental variable analysis. To address the wide dispersion of the percentage killed measure, it is transformed by adding 1 and then taking the natural logarithm.
Online Appendix Table 9 provides the summary statistics for the all countries sample during the time period for which battle deaths data are available. Summary statistics for the sub-Saharan African sample are provided in Table 4.
Online Appendix Table 10 presents the naive tobit results for the all countries sample. The columns test each of the control variables in turn, following the same pattern as the previous naive regressions. As predicted by the theory, the coefficient on life expectancy is negative. The results are statistically significant, typically at the 1 percent level.
Online Appendix Table 11 reproduces Online Appendix Table 10 but restricts the observations to the sub-Saharan African sample. The results have the predicted negative coefficients and are statistically significant at atleast the 5 percent level.
Table 7 uses an instrumental variable tobit, where circumcision is used as an instrument for life expectancy. 17 Column 1 begins with circumcision. Column 2 adds percentage Muslim, ethnic fragmentation, and age at marriage, which the previous section explained may be correlated with circumcision. Columns 3 through 6 include these variables as well as GDP, GDP growth, population, or Xropen. Column 7 includes all these variables. So long as percentage Muslim, ethnic fragmentation, and age at marriage are present, the coefficient on life expectancy is negative and significant at atleast the 10 percent level. These results show that the theory explains both the onset of civil war and the fraction of the population killed in battle.
Instrumental Variable Tobit of the Effect of Life Expectancy on the Fraction of Population Killed in Battle.
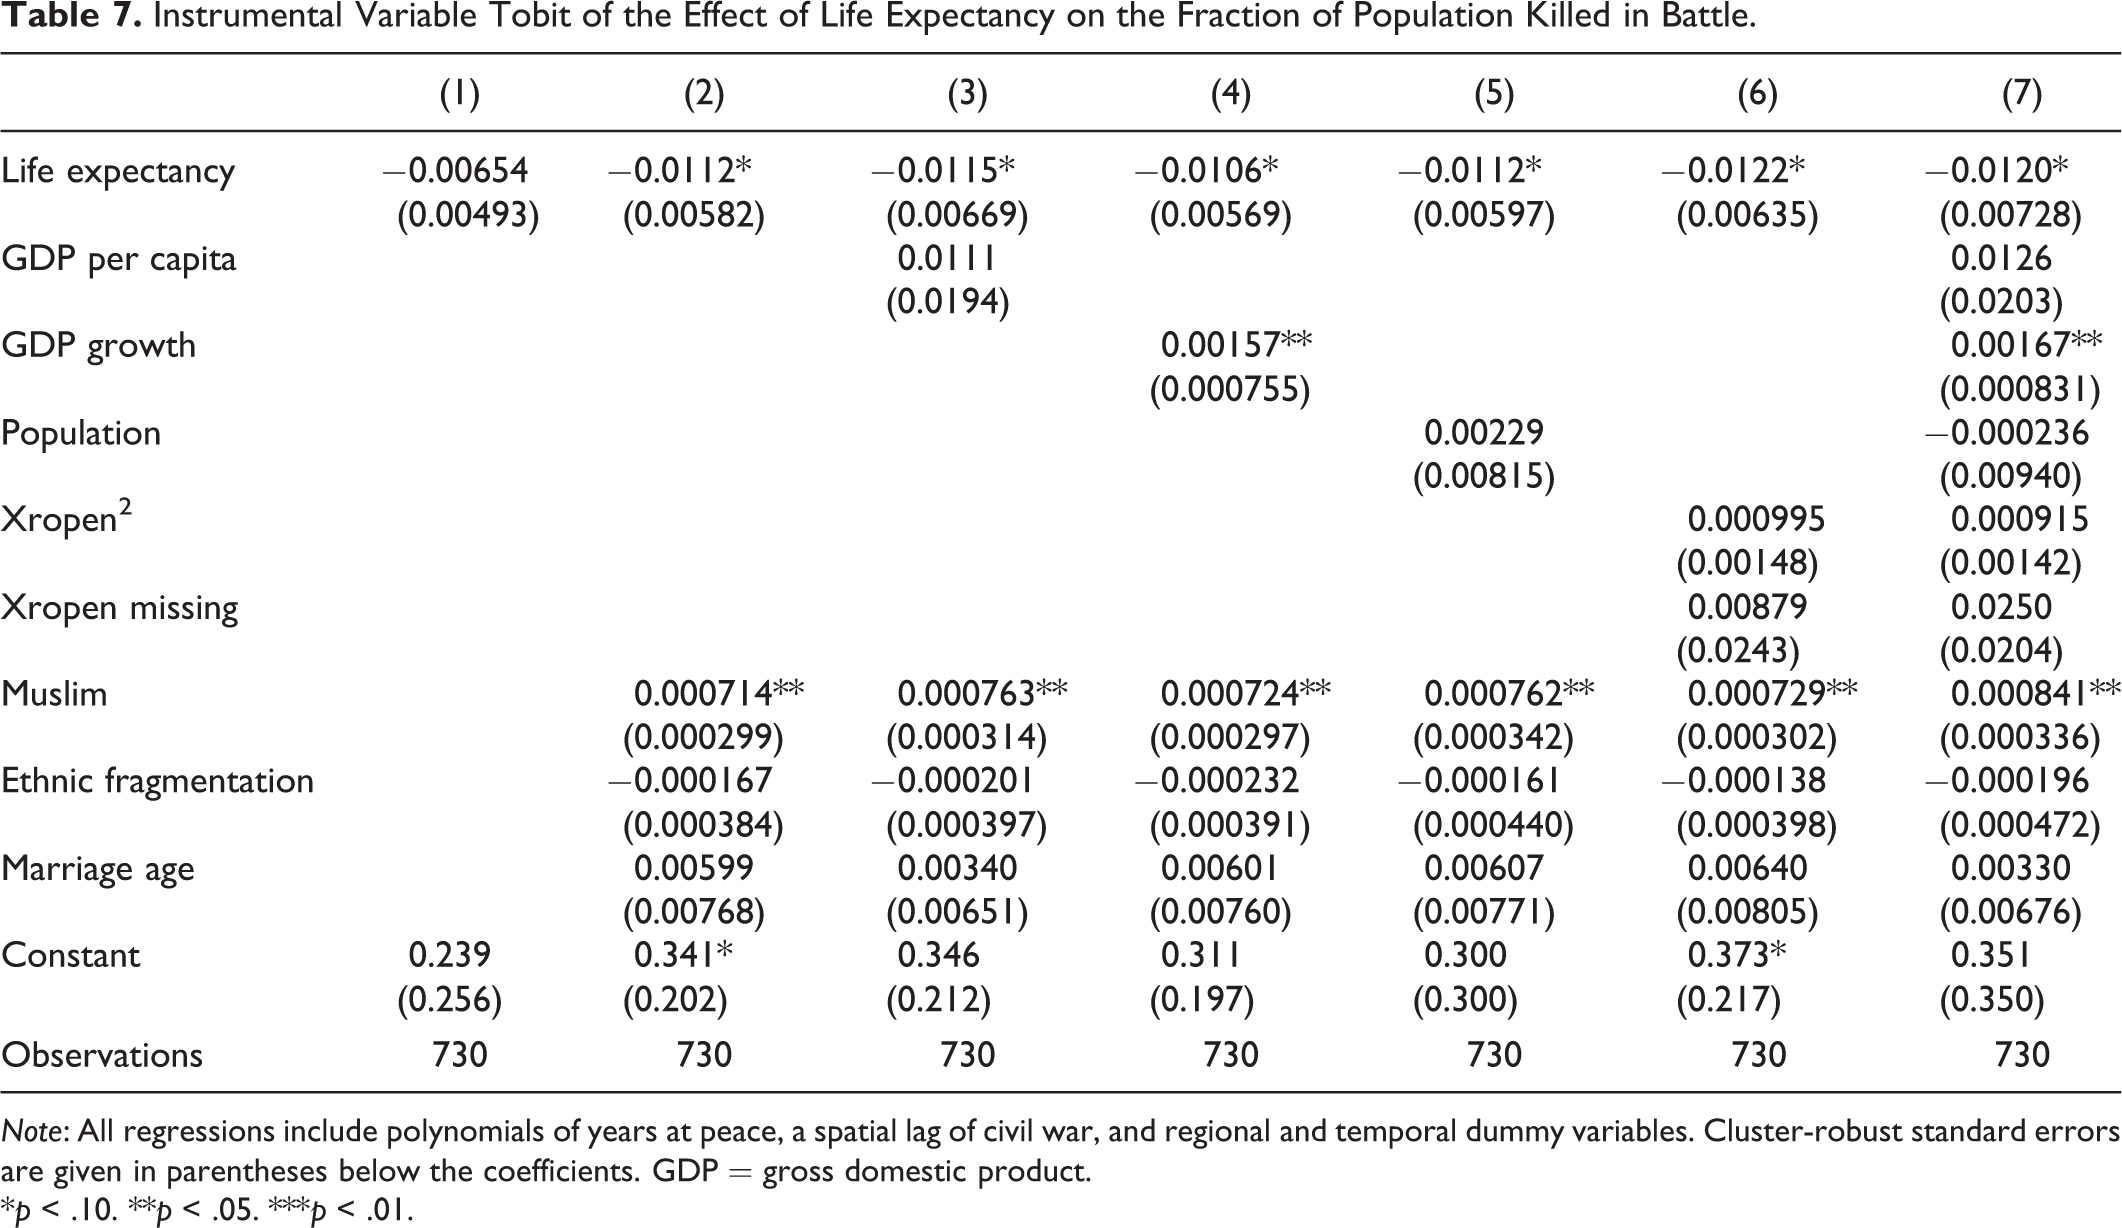
Note: All regressions include polynomials of years at peace, a spatial lag of civil war, and regional and temporal dummy variables. Cluster-robust standard errors are given in parentheses below the coefficients. GDP = gross domestic product.
*p < .10. **p < .05. ***p < .01.
Policy Implications
War kills, war maims, and war destroys. The average African civil war involved over 14,000 battle-related deaths (Uppsala Conflict Data Program 2014b). 18 Conflict is also closely linked with massacres. Eck and Hultman (2007) and Uppsala Conflict Data Program (2014c) report that an additional 13,000 people were killed in war-related one-sided violence during the average African civil war. 19
Wars raze a country’s health facilities, produce unsanitary conditions and cause food shortages. According to Guha-Sapir et al. (2005), civil wars have increased the childhood malnutrition rates above 30 percent in countries such as Ethiopia. Ghobarah, Huth, and Russett (2003) report that the destruction of health care and sanitation systems combined with mass population movements caused by war means that conflicts create the perfect conditions for spreading communicable diseases. As a result, civil wars increase the rates of malaria, tuberculosis, and AIDS, among other conditions. Therefore, the number of indirect deaths from starvation and disease is anywhere from three to fifteen times the number of battle deaths (The Geneva Declaration 2011). War also damages economies, with the average civil war lowering GDP per capita by 1 to 4 percentage points per year (Gates et al. 2010; Collier et al. 2003). This effect is cumulative. The African civil wars under study lasted an average of just under six years, 20 so by the end of a war GDP is 6 to 24 percent lower than it would have been otherwise.
Given the massive cost of war in terms of lives, health and dollars, interventions which increase civilian life expectancy, thereby decreasing the probability of civil war, should include a more peaceful world among their benefits. This is especially true of public health interventions, since increasing life expectancy decreases war, which in turn decreases violence and disease in a virtuous cycle. Current cost–benefit analyses, however, exclude this effect (Geldsetzer et al. 2015; The Global Fund to Fight AIDS, Tuberculosis and Malaria 2013). Including these benefits would make the analyses more accurate and support additional funding for public health efforts.
Conclusion
This article argues that low life expectancy decreases the opportunity cost of rebellion, thereby increasing its probability. This article tests this theory, first with probit regressions of all country-years and then with probit and instrumental variable probit regressions of sub-Saharan African countries during the HIV/AIDS epidemic using male circumcision rates as an instrument for life expectancy. The robustness of these results is checked using battle deaths rather than onset as the dependent variable. In all cases, the regressions show that life expectancy has a substantial and statistically significant effect on civil war onset.
These results have numerous implications. They identify a new variable, life expectancy, which affects civil war. In the course of doing so, this article expands the opportunity cost model of civil war onset to include nonpecuniary costs and provides additional support for this model. From a more practical perspective, this article identifies the HIV/AIDS epidemic as an important driver of conflict in sub-Saharan Africa. It follows that public health interventions which raise life expectancies, by alleviating HIV/AIDS and other diseases, have a previously unrecognized benefit—they reduce the probability of civil war—which could justify increasing the resources allocated to them.
Footnotes
Appendix
This appendix details the steps required to solve the model presented in the second section. Recall that the probability of death from all causes—except dying in battle during a civil war—is pc, where 0 < pc < 1, and the probability of a rebel dying in battle during a civil war is pr, where 0 < pr < 1. uc is the utility from being a civilian and ur is the utility from being a rebel, with uc > 0 and ur > 0. (The utility of being dead is normalized to 0.) Therefore, the continuation value to being a civilian is Vc = uc + (1 − pc)Vc where (1 − pc) is the probability of surviving to the next round as a civilian. The continuation value to being a rebel is
First solve for Vr and Vc.
Then substitute these values of Vr and Vc into the condition that
To solve for threshold ur such that the benefits of rebelling are equal to the opportunity cost of rebelling, set the left-hand side of equation (1) equal to the right-hand side and solve for
This gives equation (2) from the second section.
To see how changes in civilian life expectancy affect whether the benefits to rebellion outweigh the costs, take the partial derivative of
which is equation (3) in the second section. So decreases in civilian life expectancy decrease the utility of being a civilian. This decreases the opportunity cost of dying in combat, resulting in a lower utility threshold for rebellion and, therefore, increasing the chances that the individual becomes a rebel.
Acknowledgments
Thanks are due to Neal Beck, Chris Blattman, Rachel Brulé, Bruce Bueno de Mesquita, Reint-Jan Groot Nuelend, Macartan Humphreys, Umberto Mignozzetti, Emily Oster, Cyrus Samii, Shanker Satyanath, Alex Scacco, Lee J. M. Seymour, Vit Simral, Alastair Smith, the editor of the Journal of Conflict Resolution, and the anonymous referees for their excellent suggestions. This article also benefited from the comments provided at the Contemporary African Political Economy Research Seminar at Columbia University, the European Consortium for Political Research General Conference in Montreal, and the Midwestern Political Science Association Annual Conference in Chicago. Any errors remain my own.
Declaration of Conflicting Interests
The author declared no potential conflicts of interest with respect to the research, authorship, and/or publication of this article.
Funding
The author received no financial support for the research, authorship, and/or publication of this article.