
Abstract
The Global Trust Inventory (GTI), conceptually assessing trust in others ranging from close interpersonal relationships to relationships with government and financial institutions as a whole, was administered to representative online samples in 11 democratic states (N = 11,917 from Europe, the Americas, and New Zealand). A seven-factor solution had configural, metric, and reasonable scalar invariance in multi-group confirmatory factor analysis. Using latent profile analysis, individual-level measures of trust were derived that complement existing measures of social capital in their impact and implications. Western societies had proportionately more people with high propensity to trust, Catholic/European intermediate, and Latin American societies the least. A High Trust Profile had virtues associated with social capital: greater participation in political discussion, greater elaboration of political thinking, more community engagement, less prejudice, and greater participation in elections. A Low Trust Profile exhibited opposite tendencies. Demographically, high trust was associated with higher self-reported social status, home ownership, older age, and political conservatism. A more complex set of relationships differentiated two intermediate profiles, dubbed Moderate and Low Institutional Trust. Conceptually, the GTI operationalizes a holistic view of trust as a “synthetic force” that holds various aspects of society together, ranging from interpersonal to institutionalized relationships.
Keywords
A healthy democracy requires an involved citizenry who share forms of understanding and habits of association that enable its political institutions to thrive. Some political theorists have proposed that ideologies and values fill this role (e.g., Inglehart & Baker, 2000), whereas others have emphasized the role of social capital and trust (Coleman, 1988; Fukuyama, 1995; Putnam, 2000). But only rarely have theorists considered how different forms of trust constitute an overall system of meaning that can measure “the “habits of the heart,” which are vital for enhancing democracy across cultures (Newton, 2001, p. 201). This article introduces a Global Trust Inventory (GTI) encompassing trust in close interpersonal relationships up to trust in local and national bodies. We propose a theory and advance evidence that synthesizes these discrete but interconnected forms of trust into a global system of meaning (Sibley & Liu, 2013). These individual-level measures of trust complement measures of social capital (see (Sobel, 2002; Stone, 2001) that focus on inter-individual or inter-organizational links.
Previous research has theorized interpersonal/social forms of trust and institutional/political forms of trust as separate concepts, perhaps causally linked (Mishler & Rose, 2001; Newton, 2001). We offer an alternative conception where trust is theorized as a system of meaning that encompasses both the sub-components of and an overall grasp of the risks of opening oneself up to a range of dependencies on others. These range from the interpersonal to institutional. Seminal definitions of trust imply high mutuality of different forms of trust. For example, Yamagishi and Yamagishi (1994) define trust as “an expectation that partners, including potential partners, have goodwill and benign intent in dealing with us” (pp. 135-136); Mayer, Davis, and Schoorman (1995) define trust as the willingness of a party to be vulnerable to the actions of another party based on the expectation that the other will perform a particular action important to the trustor, irrespective of the ability to monitor of control that other party. (p. 712)
Yamagishi and Yamagishi (1994) focused on the interpersonal, whereas Mayer et al. (1995) on organizations, but what is in common is they deal with relationships as a form of risk management. In Meyer et al.’s ABI (ability, benevolence, integrity) model, trust could be applied to any relationship. A person could trust their government because he or she has confidence in its ability to deliver benefits to citizens, or because they feel government has citizens’ interests at heart, and/or because they think the government has integrity (is not corrupt). The same logic could apply to trust from a worker toward their manager or vice versa. Yamagishi and Yamagishi (1994) theoretically distinguish trust from assurance. Assurance is relational power over the people you rely on (e.g., if you betray me you’ll be ostracized from our social network). Assurance does not involve risk as much as trust.
Thus, in accord with long-standing traditions in social theory (see Simmel, 1950, p. 326), we hold that trust is among the most powerful “synthetic forces” in society. Trust integrates: it “may be a ‘meso’ concept, integrating microlevel psychological processes and group dynamics with macrolevel institutional arrangements” (Rousseau, Sitkin, Burt, & Camerer, 1998, p. 393). In the words of Putnam (2001), “trust is not part of the definition of social capital but it is certainly a close consequence, and therefore could be easily thought of as a proxy” (p. 45). Trust is social glue for any society, but especially democracies, because it has a wide range of freedoms that impinge on other people. The democratic actions we focus on are the vote, political engagement, discussion and elaboration, community involvement, and being less prejudiced; Paxton (2002) argues that improved performance on all these are benefits of social capital, and we concur that these benefits should accrue to trust in democratic societies.
There is disagreement among theorists about the exact relationship between social capital and trust: Paxton (2002) includes general trust as part of social capital, but Coleman (1988) conceptualizes trust/trustworthiness as a part of the normative apparatus that allows social capital to function (i.e., a precursor). We argue that a better measure of global trust at the individual-level can assist with theoretical difficulties in the future.
In contrast to the interconnectedness that defines the measurement of social capital (Stone, 2001), trust can be conceptualized from an individual’s perspective as a system of meaning or representation (Moscovici, 1988). Trust is a window to the social reality surrounding a person, filtered through their sense-making apparatuses. Similar to Coleman’s (1988, p. S98) view of social capital, we theorize trust not as a “single entity” but with sub-components (factors) and an overall configuration that makes sense of social interactions that link the individual to levels of society. The advantage of trust thus conceived is that it can be measured from an individual’s perspective as a system of societal meaning, having both culture-specific and universal elements that characterize how a person should manage their dependencies on others. These relationships encompass those with other individuals, individuals interpreted as representatives of groups/institutions, or the institutions themselves (see Bimber et al., 2014; Coleman, 1988).
Cross-Cultural Similarity and Variability in the Structure of Trust
The rise of democracies around the world after the dissolution of the Soviet empire is well documented (Fukuyama, 1992). But there are huge differences in the ability of democratic states to provide basic services, security, and life satisfaction to their citizens (Mishler & Rose, 2001). The idea of cultural zones (Inglehart & Baker, 2000) or dimensions of cultural variation (Hofstede, 2001; Schwartz, 1992) now informs our understanding of how well democracies perform under different historical trajectories (see Liu, Fisher Onar, & Woodward, 2014).
It is difficult to measure concepts to the level of precision where they can be treated as equivalent across cultures (Van de Vijver & Leung, 1997). This might be especially true of the structure of trust in societies with different political systems or from different cultural zones.
This is why the idea of trust as a framework or system of configuring meaning is so valuable. Trust links the individual to other persons and to social forces through a multi-focal lens. This lens is intuitively understood by the individual, and is theorized to contain both culture-specific and culture-general elements. Some elements of trust, particularly at the level of close interpersonal relationships, could be universal and central to human evolution (see Cosmides & Tooby, 2013). Other aspects, like trust in government, may be culture specific, as the meaning of government varies according to the social system it leads. To solve the conundrum of measuring such an elastic concept, we introduce a new measure, the GTI and assess its configural, metric, and scalar equivalence (Vandenberg & Lance, 2000) among representative samples across democratic states from Latin America, North America, and Europe. These were chosen as a starting point for analysis because they share sufficient similarities that we might expect the global structure of trust to be similar across these zones (Hanke et al., 2015; Inglehart & Baker, 2000).
This study seeks to (a) document the psychometric properties of this new measure of global trust and (b) establish this measure’s relationship to attitudes and behaviors that support democratic functioning, so as to assist in conceptualizing a global system of trust.
Conceptualizing Trust as a Global Concept
Managing the “dilemma of trust” is fundamental not only to contemporary social life but also in the evolutionary origins of our species (Dawes, 1980). In human collectives, there is always the temptation to extract benefits from others without fulfilling one’s own end of the bargain. “While an individual can benefit from mutual cooperation, each one can also do even better by exploiting the cooperative efforts of others” (Axelrod & Hamilton, 1981, p. 1391). Cosmides and Tooby (2013) claim that human beings are evolutionarily adapted to factor degree of kinship (as a proxy for degree of trustworthiness) into social exchange involving risk. They also posited that people have “cheater detection” modules enabling them to assess whether a social contract has been fulfilled. In other words, human beings are evolutionarily programmed to seek out and find others they can trust to fulfill mutually rewarding exchange relationships. This is the biological basis for our claim that working out who you can trust should be fundamental for understanding the structure of human social life.
Over the course of evolutionary time, the specific forms trust takes should be varied, but the problem of establishing trust should be universal. Heinrich, Heine, and Norenzayan (2010), for example, documented the extent to which cultural complexity impacts modal distributions of resources in social exchange experiments. Less complex societies have substantially different notions of fairness and reputational trustworthiness than people living in modern societies. Thus, trust as a global concept has universal elements inherent in the biological underpinnings of the mind, but also elements that are part of culture-specific “mentalities” (Shweder, 2000) that are tuned to environmental circumstances.
Trust as a Form of Social Representation
Social exchange does not take place in a vacuum, but is influenced by social representations (Sibley & Liu, 2013; Wagner et al., 1999): These are ensembles of cognition and feeling about social objects ranging from people to families, corporations, and police. This shared knowledge is enacted within communities of practice that draw upon stereotypes of others- other groups, other “races,” other organizations, and other people inhabiting social roles spanning the degree of complexity in that society (Heinrich et al., 2010). Any notion and any measure of global trust must be sufficiently elastic to assess considerable variation from culture to culture and between individuals. We do not claim to be constructing a GTI that can be applied to all human societies: Rather, we aim to supply a measure of the structure of trust in modern (complex) societies. We focus attention in this article on established democracies as a subset of these.
To operationalize the idea of a system of meaning “grasping together” (Sibley & Liu, 2013) sub-components of trust in different relationships and institutions, we employ latent profile analysis (LPA; Hagenaars & McCutcheon, 2002). LPA (a type of latent class analysis using continuous measures) is a form of mixture modeling that can be used to build typologies of response profiles. It explores how unobserved subgroups of participants may differ reliably in their views by hypothesizing a categorical latent variable (i.e., a set of distinct categories or types of people) held responsible for producing the observed pattern. We expect to be able to identify people with high, low, and medium propensity to trust. This will allow us to make cross-cultural comparisons on a categorical basis even if there is a lack of measurement invariance in the factors of trust prevalent in different cultural societies.
Previous Research and Related Concepts
Work on the macro-side of the trust equation (e.g., political science, sociology) has been strongly influenced by the World Values Survey (WVS; see Newton, 2001; Newton & Norris, 1999; Rothstein & Stolle, 2008). In this literature, where question wording has been fixed by decades-long international covenants, the terms “trust” and “confidence” in political institutions are used almost interchangeably, and political/institutional trust/confidence is positioned as distinct from interpersonal or “general” trust. One finding we wanted to probe further as part of the structure of global trust is Rothstein and Stolle’s (2008) assertion that trust/confidence in government should be differentiated between representative (elected and thus partisan) institutions versus order/implementation (impartial) institutions.
We admire the cross-cultural approach taken by the WVS and agree that a multi-component, multi-level analysis of trust is the correct approach. But we are uncomfortable with its conflation of the terms “trust” and “confidence.” We suspect that this may be one of the reasons why there is variability in the effects of social/interpersonal trust and political/institutional “trust” (Brehm & Rahn, 1997). At times, they are measured using different terms, but treated as equivalent concepts theoretically (see Newton, 2001, p. 211, where confidence in political institutions is equated with political trust 1 ).
Conceptually, trust encompasses both an expectancy of outcomes, and a component of good will or benign intent. This is not the same as confidence, which is calibrated according to performance (see Mayer et al., 1995). Following Yamagishi and Yamagishi (1994), we consider expectation of goodwill or benign intent to be more important than the expectation of competence in performance, because trust by definition “provides a solution to the problems caused by social uncertainty” (p. 131). The greater the uncertainty, the more trust is required when depending on another, even though we may lack confidence in the other’s ability to deliver the desired outcomes. Therefore, we argue that confidence and trust, though related, should not be treated interchangeably in a global data set (especially because of translational difficulties, see Brislin, 1980).
From Mayer et al. (2005), we adopt the notion that a decision to trust can be regarded as having a component derived from stable individual differences (“propensity to trust”) as well as more situationally variable components based on the trustworthiness of the other. We operationalize both, the first using LPA and the second using confirmatory factor analysis (CFA).
Measuring Trust as a Global Concept
Using the WVS as a starting point, 2 the GTI was designed to assess trust in a wide range of institutions, organizations, communities, and relationships. Rather than employ the term “confidence” to describe political or institutional trust, the term “trust” is used across a range of 20-some “others.” Conceptually, we expected certain factors to emerge. Based on evolutionary theory, we anticipated that across cultures, trust will be highest toward close relationships, especially family but also including friends. This sub-factor of trust should be consistently invariant across cultures. Beyond this, we expected that trust in representative (or partisan/elected) institutions should form a different type of situational trust factor (or sub-component) compared to order (implementation) institutions of government (following Rothstein & Stolle, 2008). The WVS items also emphasized security (e.g., police and military). We added additional items to WVS items to form factors representing financial and knowledge sectors.
We expected that social and political trust will be positively correlated across cultures. Whether the consistency of factor structure of trust takes the weak form of configural invariance (the same factors underpin the same manifest items across cultures), the moderately strong form of metric invariance (where factor loadings are consistent across cultures), or the strong form of scalar invariance (where the meaning of the items are so consistent that they allow mean comparison across cultures) is an open question. Our goal was to achieve at least metric invariance given the similarity of the cultures selected.
Previous research by Mishler and Rose (2001) and Segovia Arancibia (2008) found that political trust in formerly Communist states of the Soviet block and in Latin American democracies was lower (measured using the term “confidence”) than established Western democracies. Neither of these studies used the latest techniques (see Vandenberg & Lance, 2000) to ensure measurement invariance. But anticipating that these findings hold true using more stringent methods, we expect the highest levels of trust to be in Western societies with long-established democracies, followed by Catholic/Orthodox societies in cultural and geographic proximity to these Western societies, and the lowest levels of trust in Latin American societies where democracy has been historically unsettled (Segovia Arancibia, 2008; see Hanke et al., 2010 for the classification of cultures).
We also expected our measures of trust to predict a wide range of attitudes and behaviors necessary for a well-functioning democracy. We included non-institutionalized forms of participation (e.g., community involvement, political discussion, and elaboration) and institutionalized forms of participation (e.g., local and national voting) as the main criterion variables, which are often seen as distinct but complementary components in building an engaged democracy (Zukin, Keeter, Andolina, Jenkins, & Carpini, 2006). We also included intergroup attitudes (e.g., prejudice and perceived threat) to reflect broader issues of tolerance toward people from different groups that is necessary for healthy democratic functioning, but is less directly connected to engagement. A range of demographic correlates of trust profiles are reported as well. In general, greater participation and reduced prejudice were expected to be correlates of a person high in the propensity to trust.”
Methods
Participants and Sampling Procedure
The data here analyzed are a part of an international survey collected in 22 countries from the Americas, Asia, Europe, and South Africa (detailed information available from authors as an Appendix). The present analyses are based on data from 11 of these countries, all democracies, and all with moderate to low (or no) cultural distance to Western societies. The 11 countries chosen were from what have been described as Western (Anglo and/or European), Catholic/Orthodox, and Latin American cultural zones in previous research (see Hanke et al., 2010; Inglehart & Baker, 2000). As countries relatively low in culture distance from one another (all Christian based), and as democracies, we reasoned that this subset was an appropriate place to begin to derive cross-culturally valid measures. As we expected the GTI to be sensitive to actual variations in the power, reach, and benevolence of social institutions across cultures, we do not expect to find the same configuration of trust in East Asia (see Zhang et al., under review)
The international survey was conducted by a global partnership led by the first and third authors. Items were translated for each country by a group of participating scholars, employing either back-translation (Behling & Law, 2000) or the committee approach (Brislin, 1980). Survey administration was performed by Nielsen, a global media polling company based in the United States which curates an online panel worldwide with a total pool of potential respondents across the 22 countries of over 10 million. Nielsen used stratified quota sampling techniques on gender, age, and region to create samples whose demographics closely matched those reported by official census agencies. Those who prefer to stay away from the Internet cannot be reached using online surveys, so our results are most representative for moderately well-to-do populations. 3 Since Nielsen partners with companies that employ a combination of panel, and probability-based sampling methods, the limitations of web-only survey designs are minimized (Bosnjak, Das, & Lynn, 2016). However, some parameters of the panel invites are unknown, and therefore traditional response rates should not be calculated (AAPOR, 2011). Detailed information available as an Appendix and supplementary material from the authors.
The present analyses were based on N = 11,917 (53% female) participants. The sample represented 11 countries: Argentina (n = 1,145; 51.7% female), Brazil (n = 1,086; 49.8% female), Chile (n = 964; 51.3% female), Spain (n = 1,019; 52.6% female), Italy (n = 1,041; 55.3% female), Poland (n = 1,060; 54.0% female), Estonia (n = 1,168; 48.8% female), Germany (n = 1,052; 53.9% female), United Kingdom (n = 1,064,54.1% female), New Zealand (n = 1,157; 56.4% female), and United States (n = 1,161; 59.5% female). The average age of the present sample was M = 43.76, SD = 15.711 (Argentina: M = 40.76, SD = 114.304; Brazil: M = 35.87, SD = 12.040; Chile: M = 35.05, SD = 13.098; Spain: M =40.16, SD =12.633; Italy: M = 41.72, SD = 13.151; Poland: M = 41.96, SD = 14.513; Estonia: M = 46.80, SD = 17.155; Germany: M = 45.10, SD = 15.068; United Kingdom: M = 50.61, SD = 15.598; New Zealand: M = 49.54, SD = 17.320; United States: M = 49.76, SD = 16.426).
Different sections of this total sample were used in different analyses. Specifically, the exploratory factorial analyses (EFAs) were conducted using the New Zealand sample. The subsequent multi-group confirmatory factor analyses and latent profile analyses were conducted on the remaining 10 countries representing the three cultural zones described above.
Measures
The GTI administered consisted of 24 items assessing the respondents’ self-reports of trust in a range of domestic, international, governmental, and non-governmental institutions. The items were presented with the following instructions: “Please rate your feelings of trust towards the following people and organisations using the scale below.” All of the items were rated on a 1 (do not trust at all) to 7 (trust completely) scale. The final items in the GTI included the following: National Government, Local Government, Prime Minister or President, Judiciary (Courts), Election Outcomes, The Tax System, Government Surveillance Agencies, Police, Military, Banks, The Stock Market, Multinational Corporations, Oil Companies, Universities, Scientists, Neighbors, One’s Ethnic Group, Other Citizens in One’s Country, Friends, Immediate Family, and Extended Family. The WVS measure of general trust was included as a statistical control.
Along with the above measures, the questionnaire included additional measures used in this article to discriminate the demographic characteristics of different Trust Profiles (“an individual’s propensity to trust,” see LPA in the Results section). Demographic measures included participants’ age (in years) and gender (0 = male, 1 = female). Participant’s self-reported social status was measured using a single item: “On a Scale of 1 to 10, with 10 being the people who are the most well off, and 1 being the people who are the least well off, where would you describe your position?” Participants also reported whether they rented or owned their home and whether they lived in a rural or urban area.
In terms of political engagement, the frequency of voting in local or national elections was assessed by one item each: “Usually, as far as you recall, how often do you vote: In Local [National or presidential] elections?” (1 = never to 7 = all the time). Furthermore, the questionnaire also included three items assessing Political, Economic, and Social conservatism. The items were administered with the following instructions: “On political/economic/social issues, where would you place yourself on a scale from 0 to 10, where 10 = Strong Conservative (right leaning) and 0 = Strong Liberal (left leaning)?” These three items represented a scale of Conservatism (α = .929)
Furthermore, two single-item measures of frequency of political discussion with people of similar and with people of different political views were included (1 = never to 7 = all the time). Finally, a four-item measure of political elaboration (Eveland, 2004)—the extent to which people elaborate on political discussions and conversations they have been engaged in—was included (α = .919). Sample items included “I often find myself thinking about my conversations with other people about politics and public affairs after the discussion has ended,” and “I often think about what I’ve encountered in the news, and tie it together with my own ideas” (1 = disagree completely to 7 = agree completely).
To assess community engagement, a five-item measure of Offline Social Capital was included (α = .920, see Gil de Zúñiga, Jung, & Valenzuela, 2012), the sample items included “People in my community feel like family to me,” and “In my community, we talk to each other about community problems” (1 = disagree completely to 7 = agree completely).
In terms of prejudice and inter-group relations, single-item measures of warmth—or thermometer ratings—toward immigrants, homosexuals, and black people (1 = least warm to 7 = most warm) were used. Finally, items measuring perceived threat from immigrants (i.e., “Immigrants are a threat to world peace today”) was also included (1 = disagree completely to 7 = agree completely).
Results
Factorial Structure of the GTI
To determine the factorial structure of the GTI an EFA was conducted on the New Zealand sample (n = 1,157). The NZ sample was chosen for the EFA as it is an independent sample representative of modern democratic societies, and also familiar to the authors.
The EFA was conducted in MPlus 7.31 (Muthén & Muthén, 1998-2015) with maximum likelihood estimation with robust estimation of standard estimates (MLR), applying an oblique rotation (GEOMIN). Initially, the EFA was conducted with all 24 items of the GTI. After two iterations of the EFA, the following items were removed due to inconsistent loadings and cross loadings: “Trust in your religious group,” “Trust in local business,” and ‘Trust in the country’s border security.”
Based on the findings of the EFA in New Zealand, we applied a confirmatory factorial model of GTI in the three regions of interest—Latin America (Argentina, Brazil, and Chile), Catholic/Europe (Spain, Italy, Poland, and Estonia), and Western democracies (Germany, United Kingdom, and United States). Specifically, we proposed a seven-factor model of the following configuration: (a) Trust in Government—indicated by trust in National government, trust in Local government, and trust in the Prime Minister or President (partisan governing bodies); (b) Trust in Governing Bodies—indicated by trust in the judiciary, trust in government surveillance agencies, trust in election outcomes, and trust in the tax system (non-partisan government bodies); (c) Trust in Security Institutions—indicated by the trust in police and trust in military; (d) Trust in Financial Institutions and Corporations—indicated by trust in banks, trust in the stock market, trust in multinational corporations, and trust in oil companies; (e) Trust in Knowledge Producers—indicated by trust in scientists and trust in universities; (f) Trust in Community—indicated by trust in neighbors, trust in one’s ethnic group, and trust in other citizens of one’s country; and (g) Trust in Close Relations—indicated by trust in friends, trust in extended family, and trust in immediate family. This model was tested in the 10 countries through a multi-group CFA.4,5
The standardized loadings and factor covariances for the CFA are presented in Figure 1. The bivariate correlations and the descriptive statistics for the 21 items in the full country sample are presented in Table 1. The model fit indices for this model in the full sample were χ2(168) = 5,479.516, p < .001; root mean square error approximation (RMSEA) = .054 [.053, .055], comparative fit index (CFI) = .945, Tucker–Lewis index (TLI) = .931, sRMR = .035, indicating good model fit. However, as can be seen in Figure 1, the model indicated relatively high correlations between four of the factors: Government and Governing Bodies (r = .827), Governing Bodies and Security Institutions (r = .827), and between Governing Bodies and Financial Institutions and Corporations (r = .812). Because of these correlations, we tested a number of alternative models. The first alternative configuration specified a five-factor model whereby the items indicating the three factors of Government, Governing Bodies, and Security Institutions were modeled as indicators of a single unified Government factor. The remaining four factors (i.e., Financial and Corporate, Knowledge Producers, Community, and Close Relations) were kept as in the original model. This alternative model provided worse fit to the data as the following fit indices show: χ2(179) = 10,932.116, p < .001, RMSEA = .075 [.074, .076], CFI = .888, TLI = .869, sRMR = .049. This model further indicated a relatively high correlation between the new Government factor and the Financial and Corporate factor (r = .810). Thus, we tested a four-factor model whereby the items indicating the Financial and Corporate factor were specified as additional indicators of the larger Government factor. This alternative model showed further detriments in model fit: χ2(183) = 14,154.505, p < .001, RMSEA = .084 [.083, .085], CFI = .855, TLI = .833, sRMR = .054. Finally, we tested a configural model whereby we assumed that all of the items in the GTI related to a single trust factor. As expected, the model fit indices suggested poor fit, χ2(189) = 28,486.478, p < .001, RMSEA = .118 [.117, .119], CFI = .706, TLI = .673, sRMR = .090.
Bivariate Correlations and Descriptive Statistics for the 21 GTI Items in the 10-Country Sample (1-21 in Order: National Government, Local Government, Prime Minister, Judiciary Election Outcomes, The Tax System, Government Surveillance Agencies Police, Military Banks, The Stock Market, Multinational Corporations, Oil Companies Universities, Scientists Neighbors, One’s Ethnic Group, Other Citizens in One’s Country Friends, Immediate Family, Extended family).
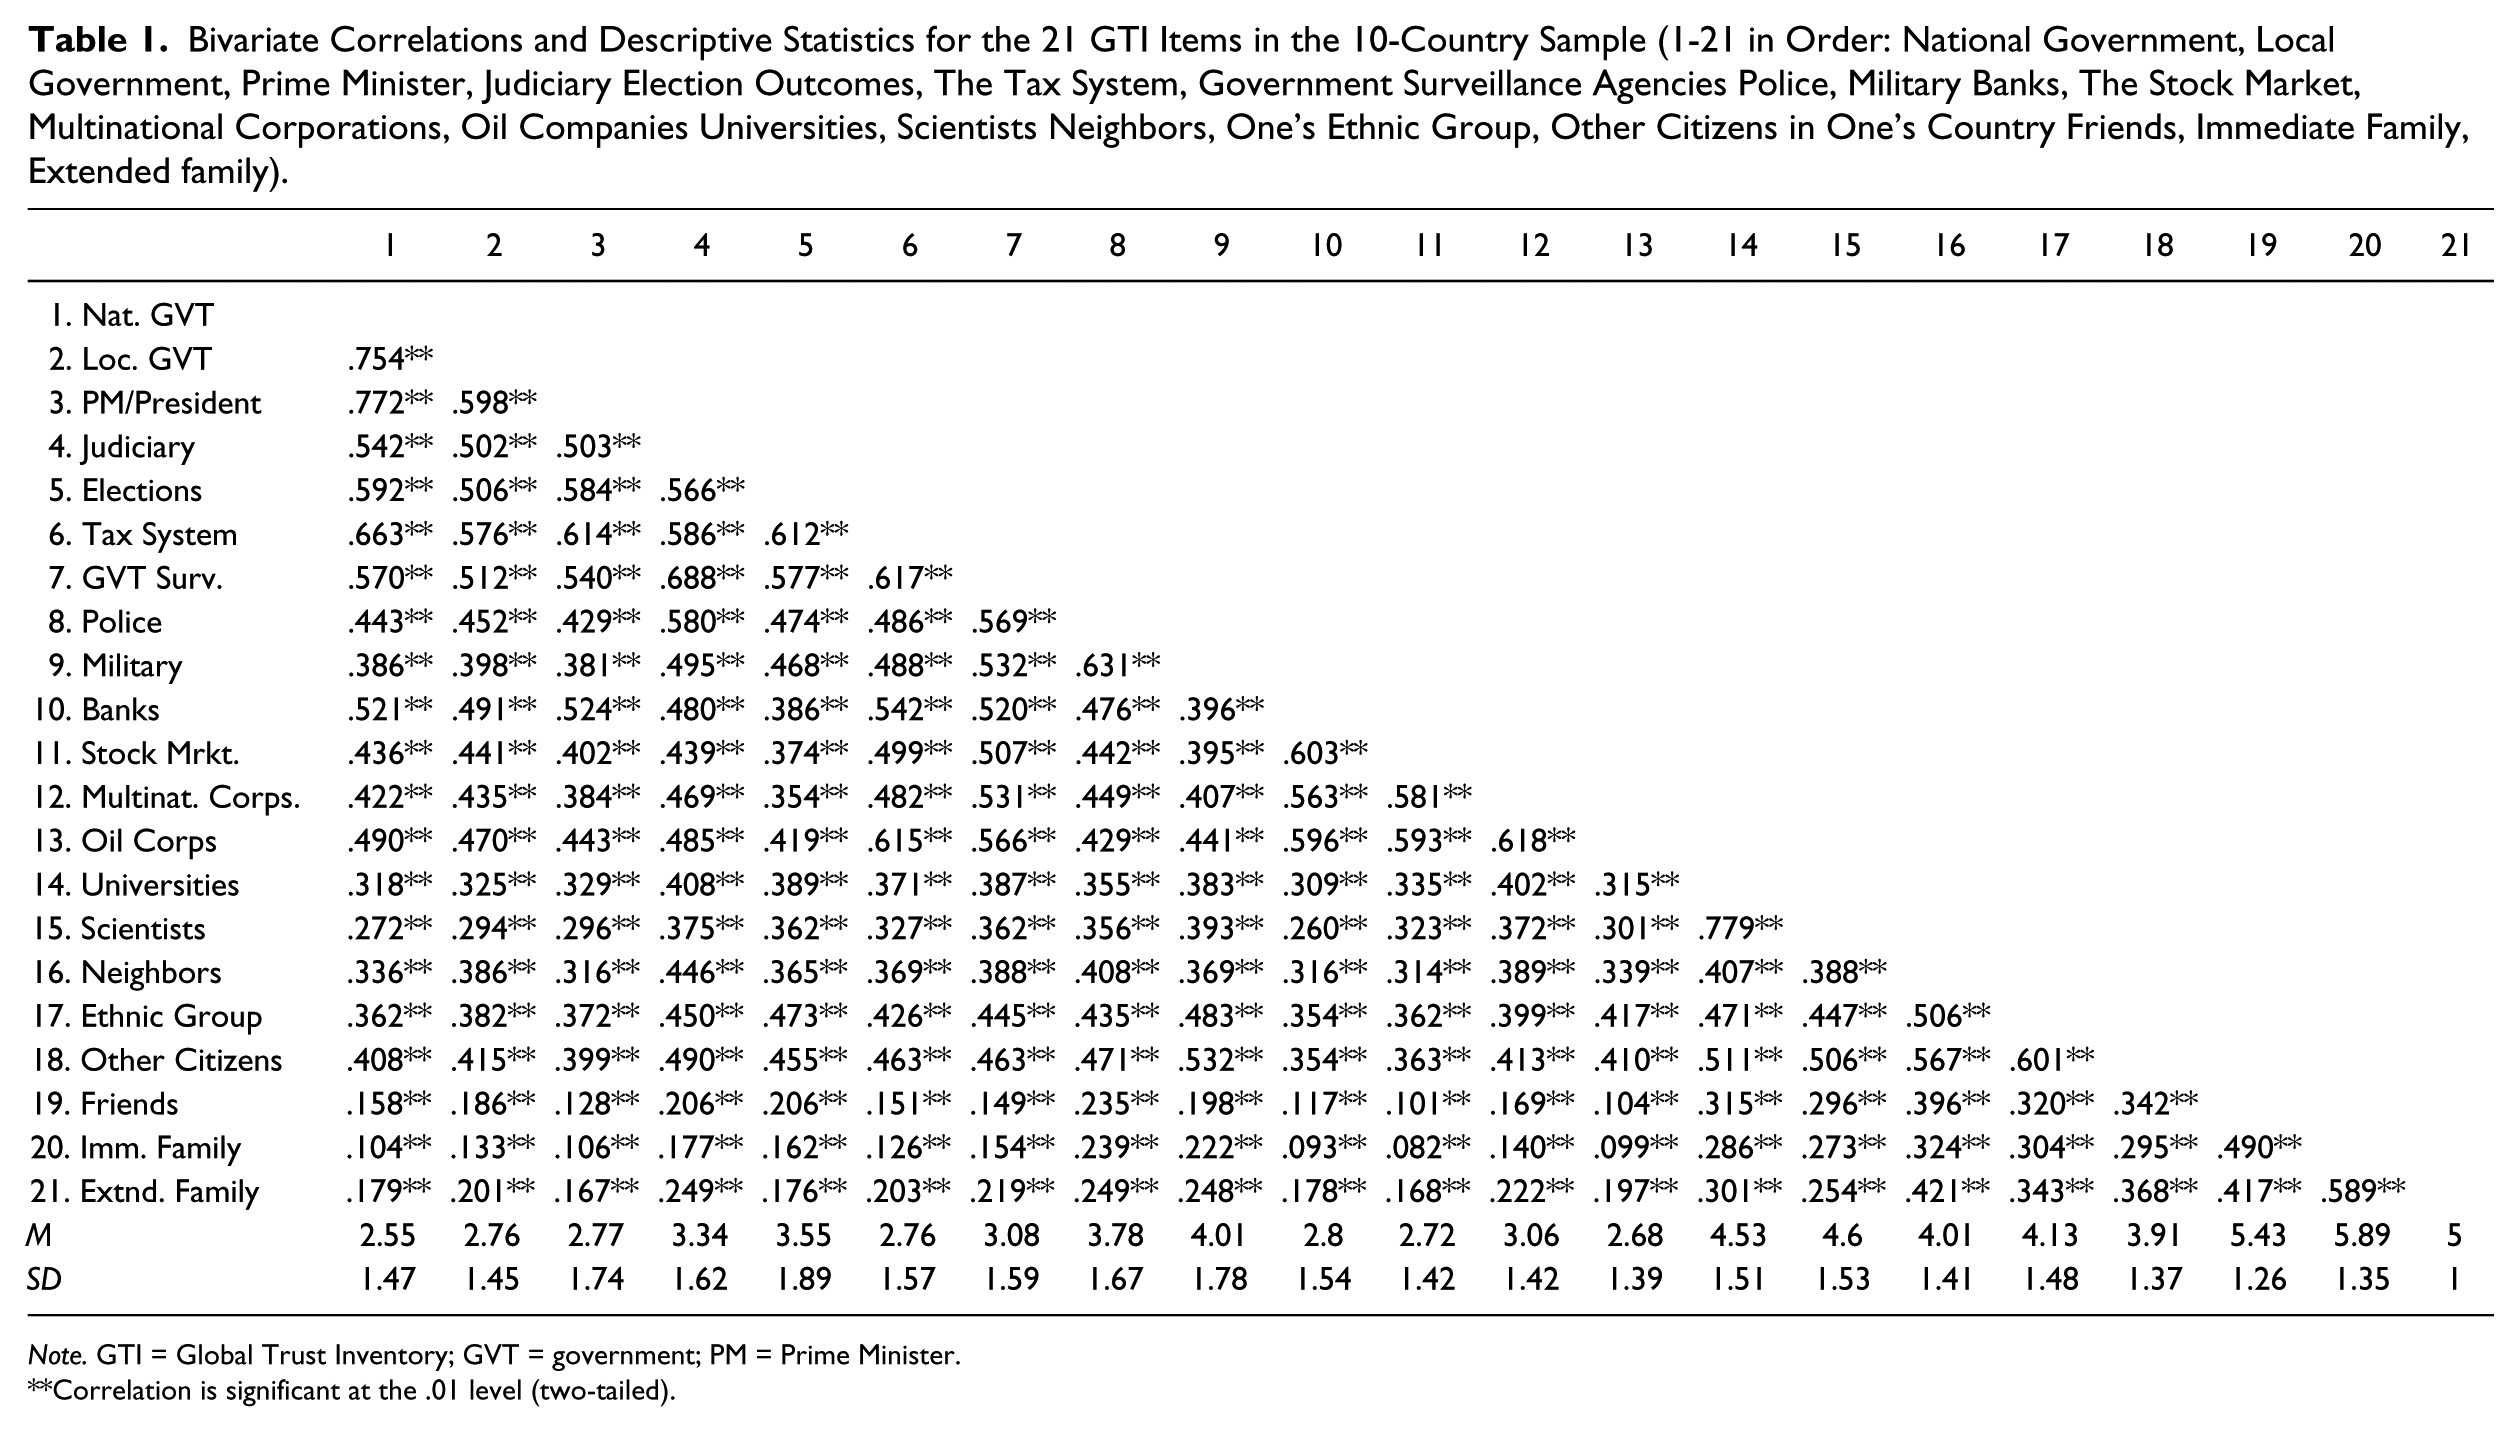
Note. GTI = Global Trust Inventory; GVT = government; PM = Prime Minister.
Correlation is significant at the .01 level (two-tailed).
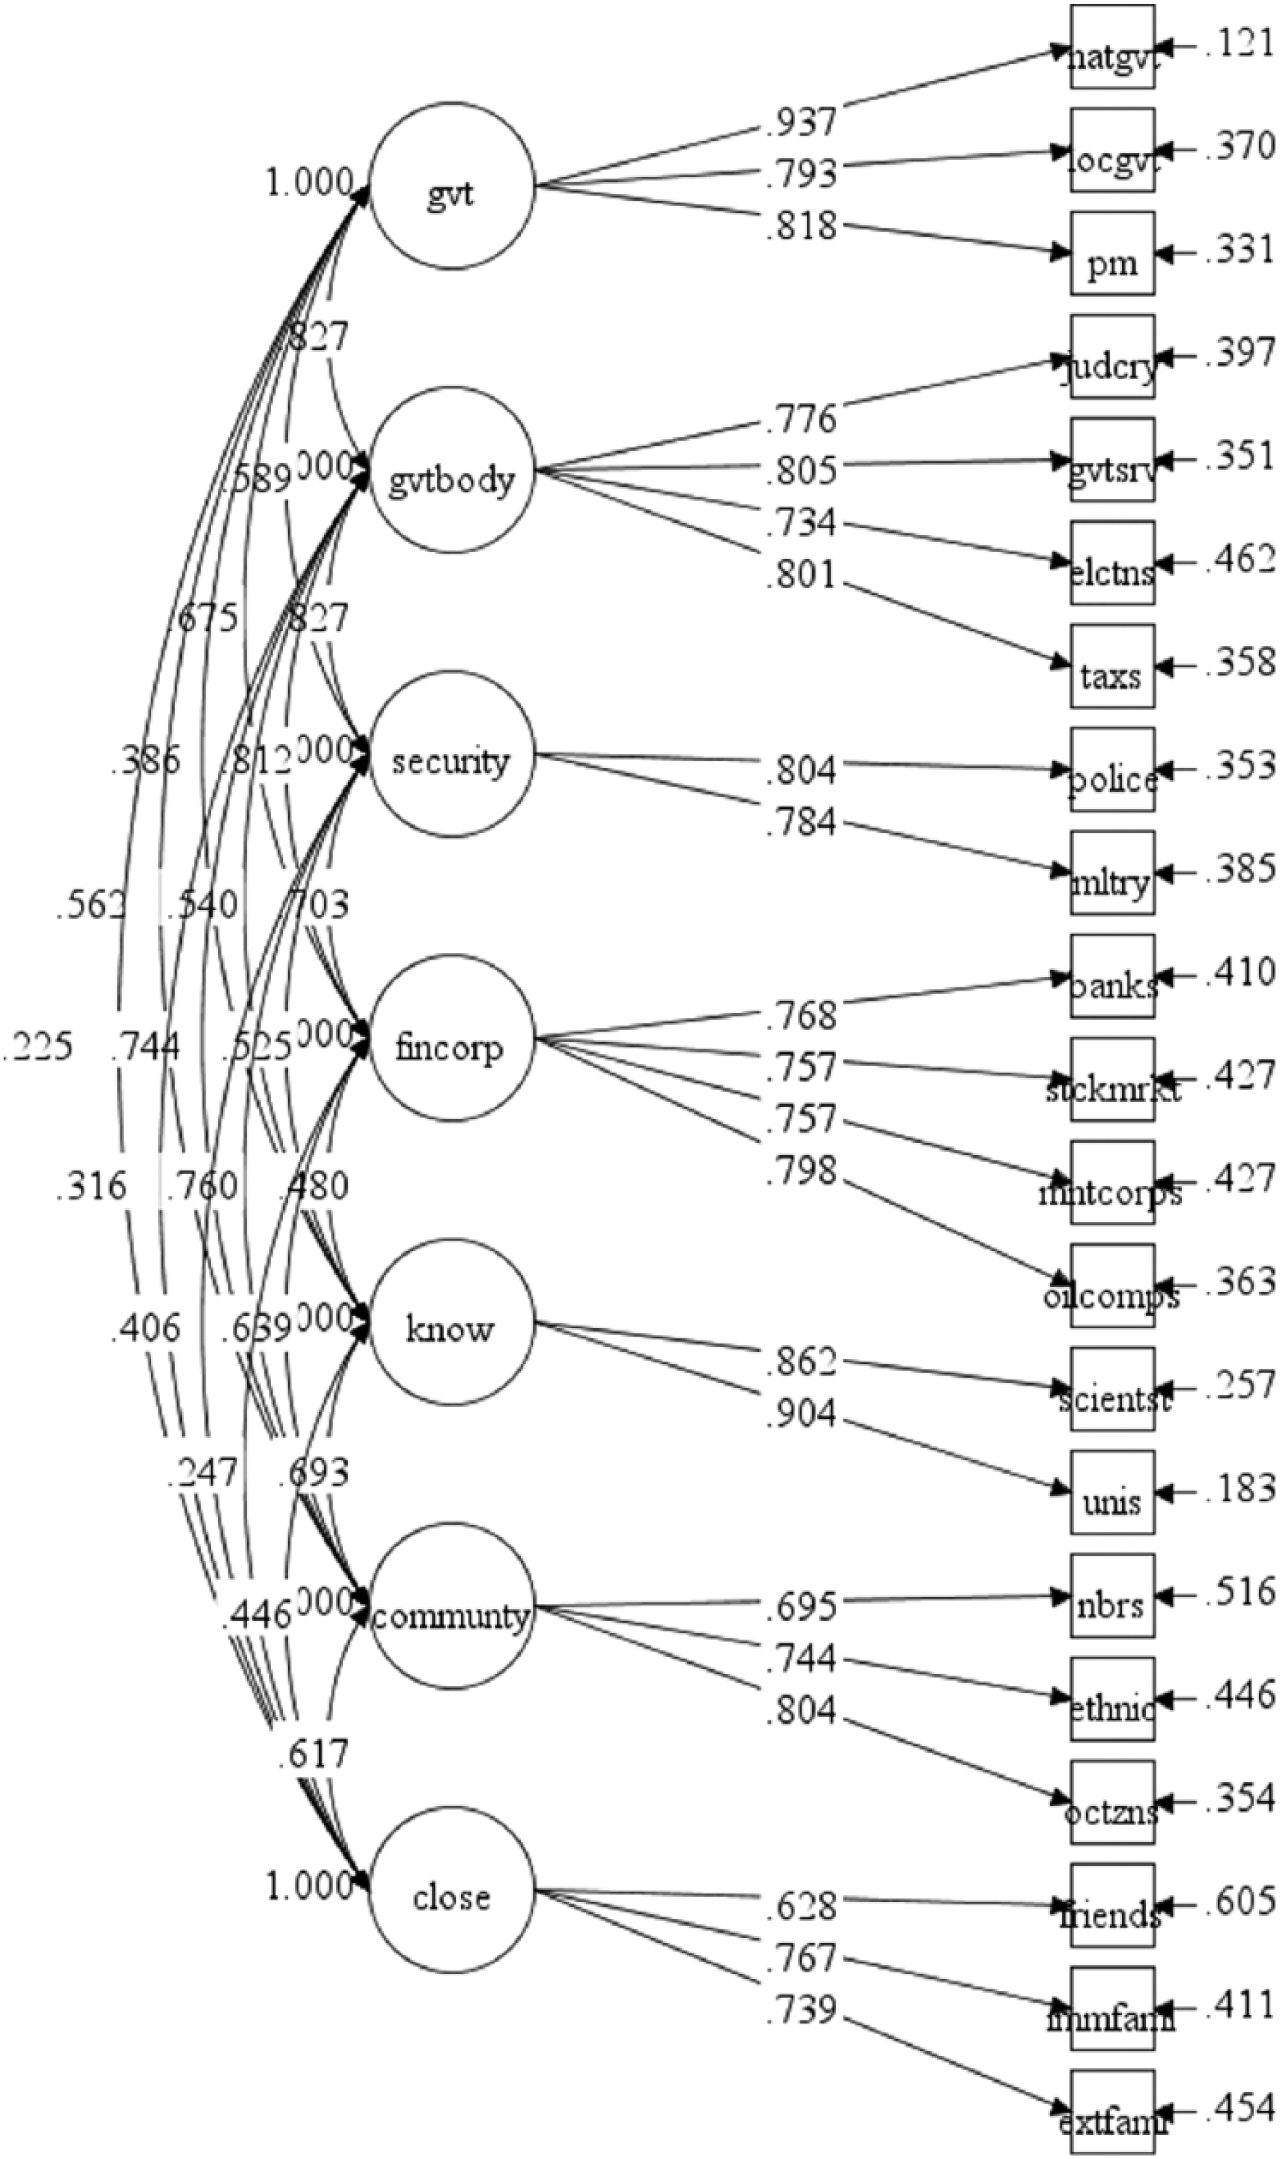
The seven-factor configural model of the GTI.
We finally tested the model in Figure 1 across the 10 countries in the given dataset. The model fit statistics across the 10 countries are presented in Table 2, and the unconstrained standardized factor loadings across the 10 countries are presented in Table 3. We used multi-group CFAs to test a series of increasingly restrictive models for Measurement Invariance of the seven-factor model across the 10 countries (see Table 4).
Model Fit for Configural CFA Model for the Overall Sample and Across the 10 Countries.
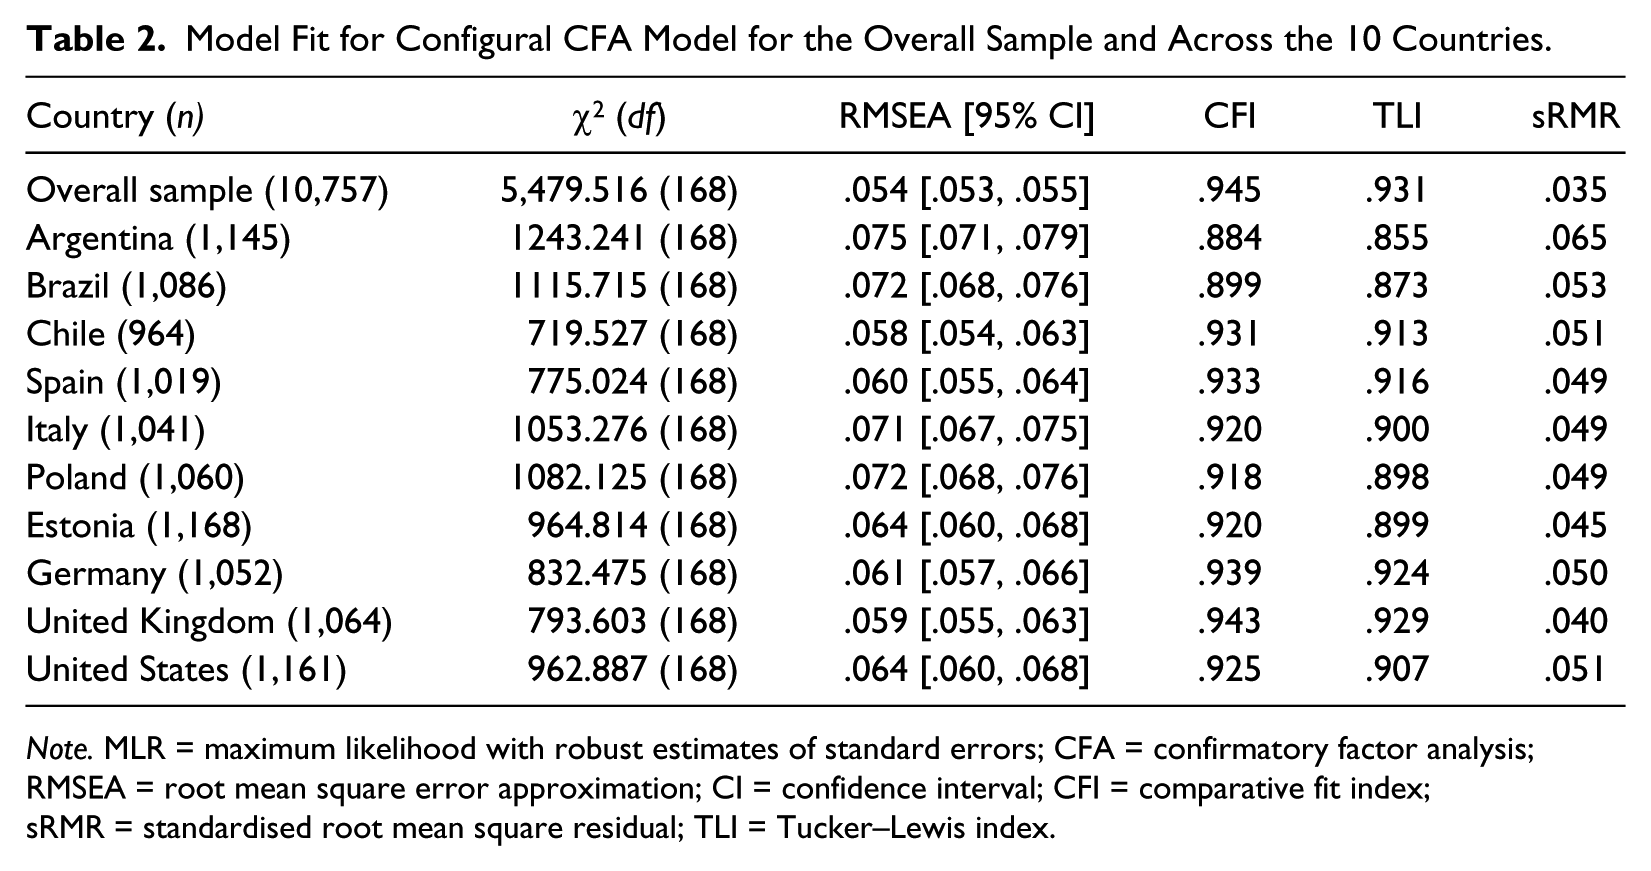
Note. MLR = maximum likelihood with robust estimates of standard errors; CFA = confirmatory factor analysis; RMSEA = root mean square error approximation; CI = confidence interval; CFI = comparative fit index; sRMR = standardised root mean square residual; TLI = Tucker–Lewis index.
Standardized Factor Loadings for the Configural Model Across the 10 Countries.
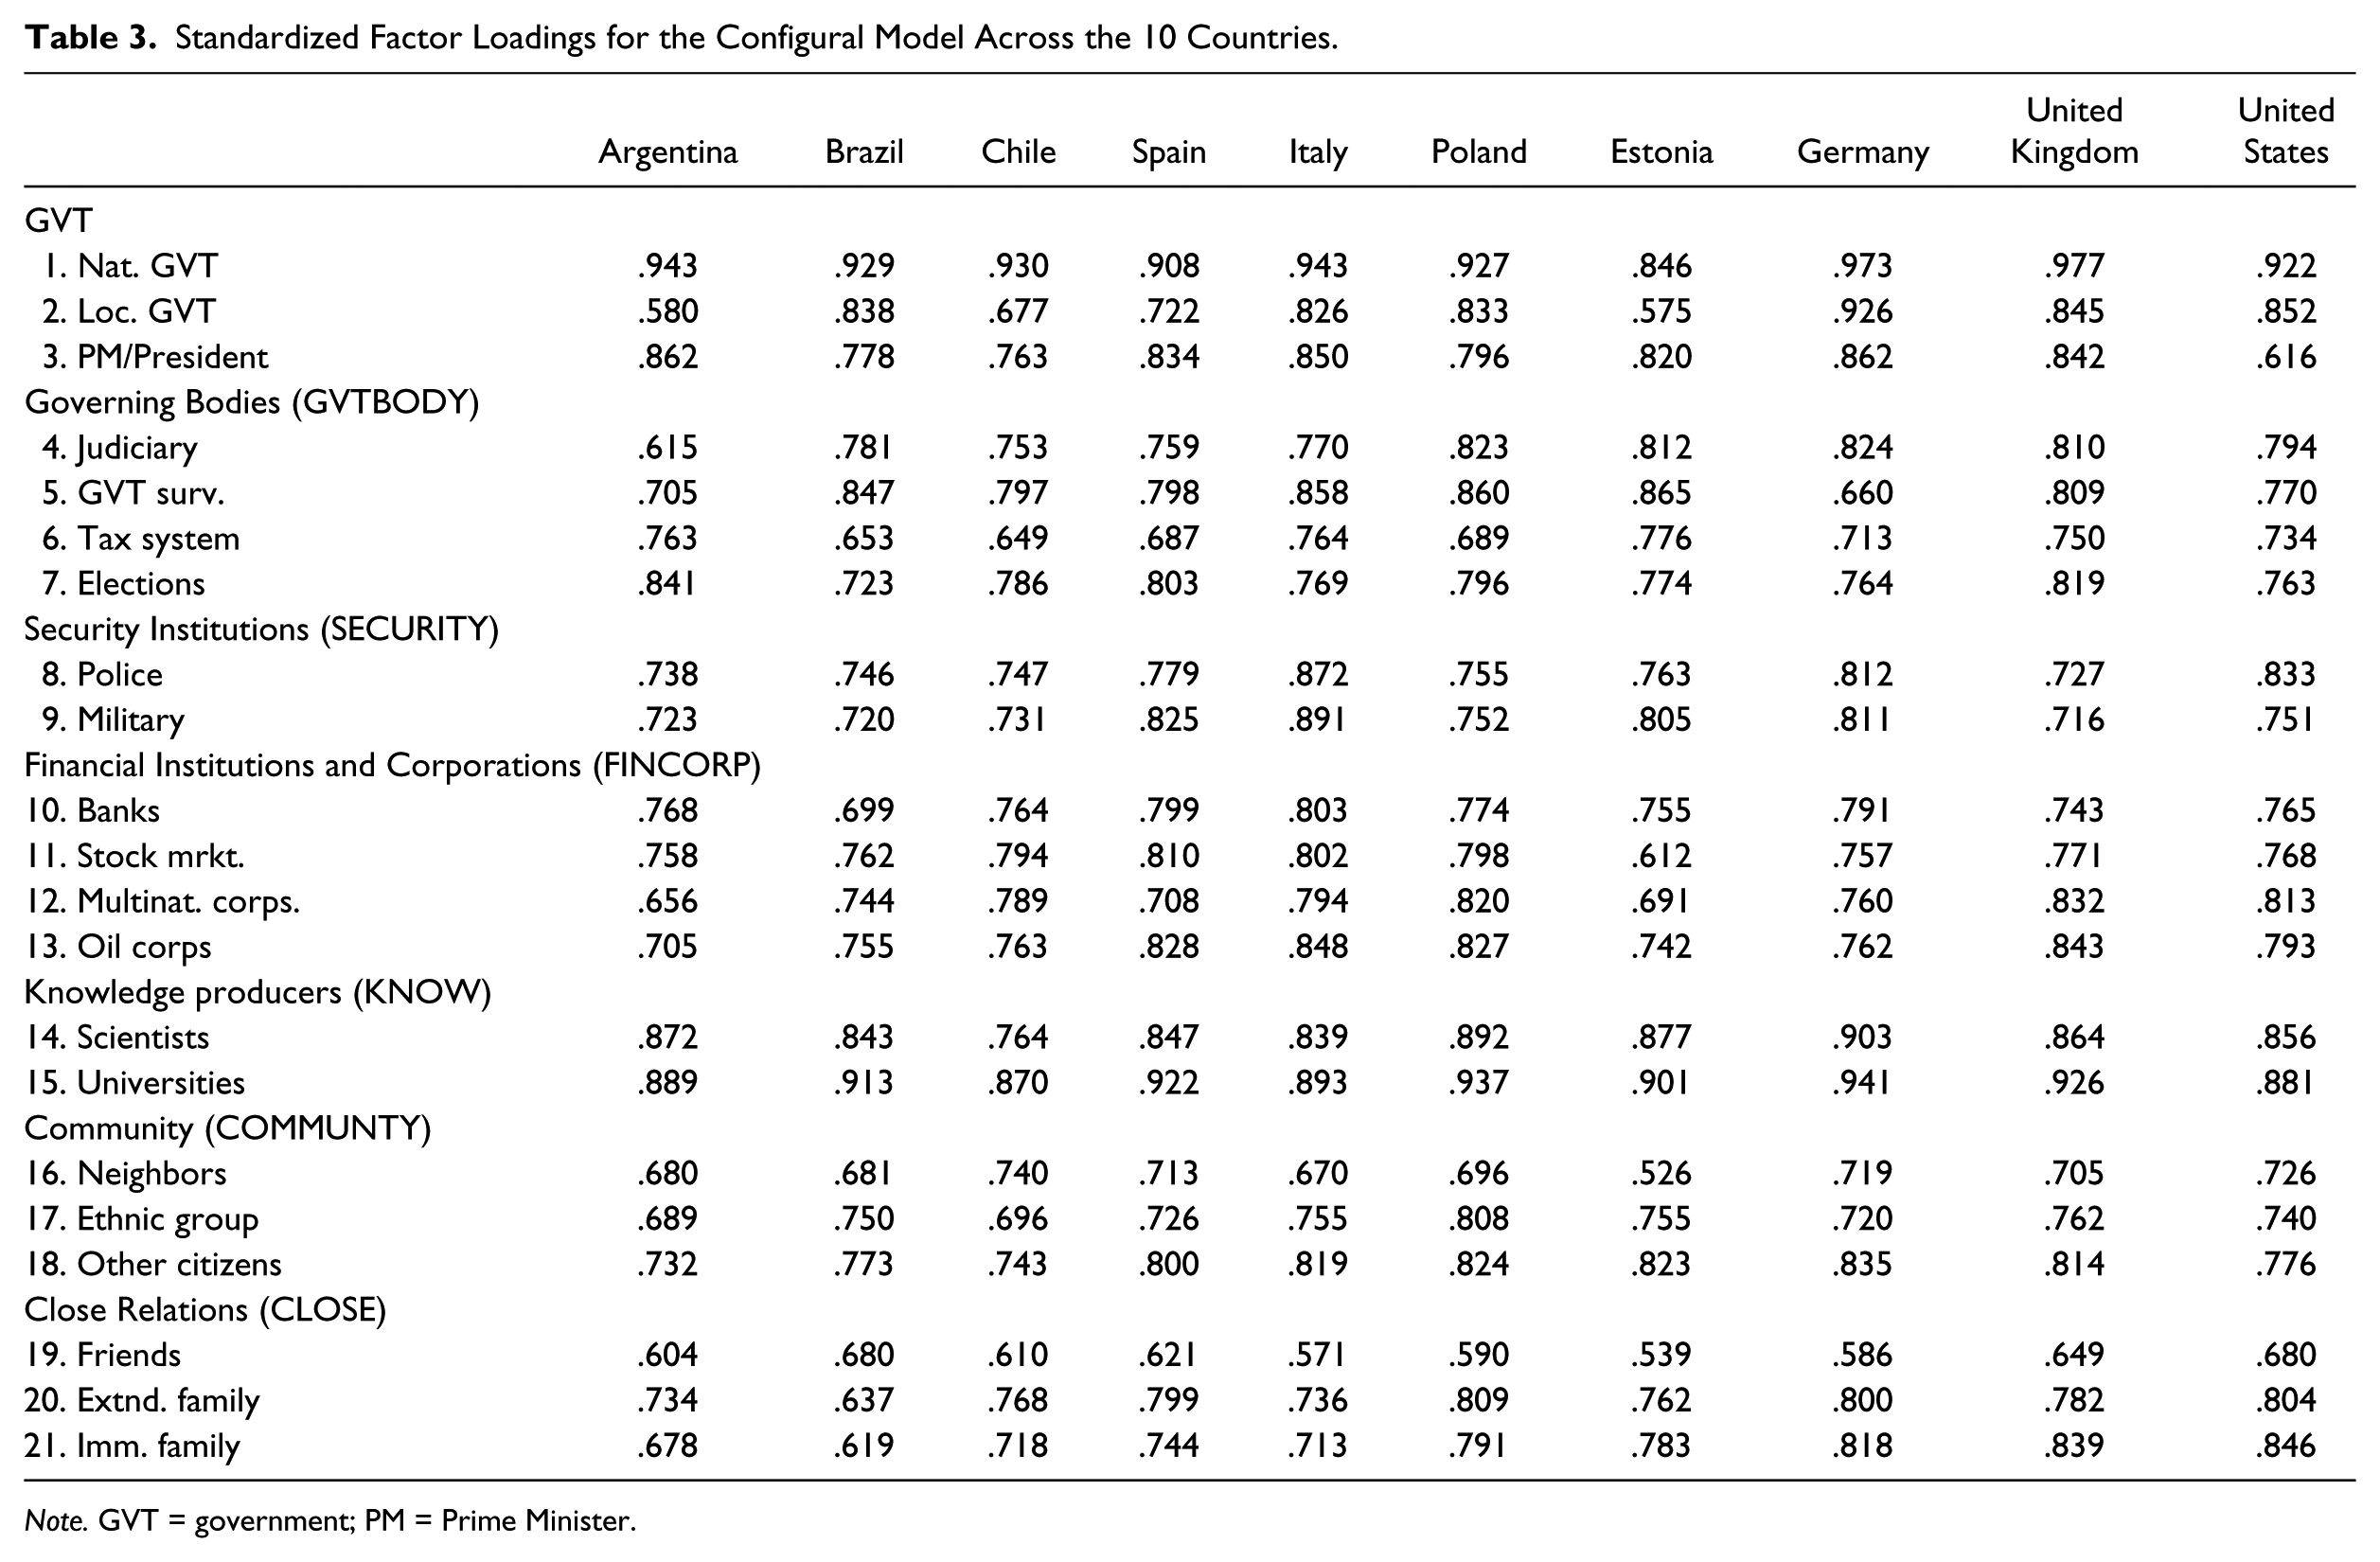
Note. GVT = government; PM = Prime Minister.
Measurement Invariance Tests—Model Fit Indices.
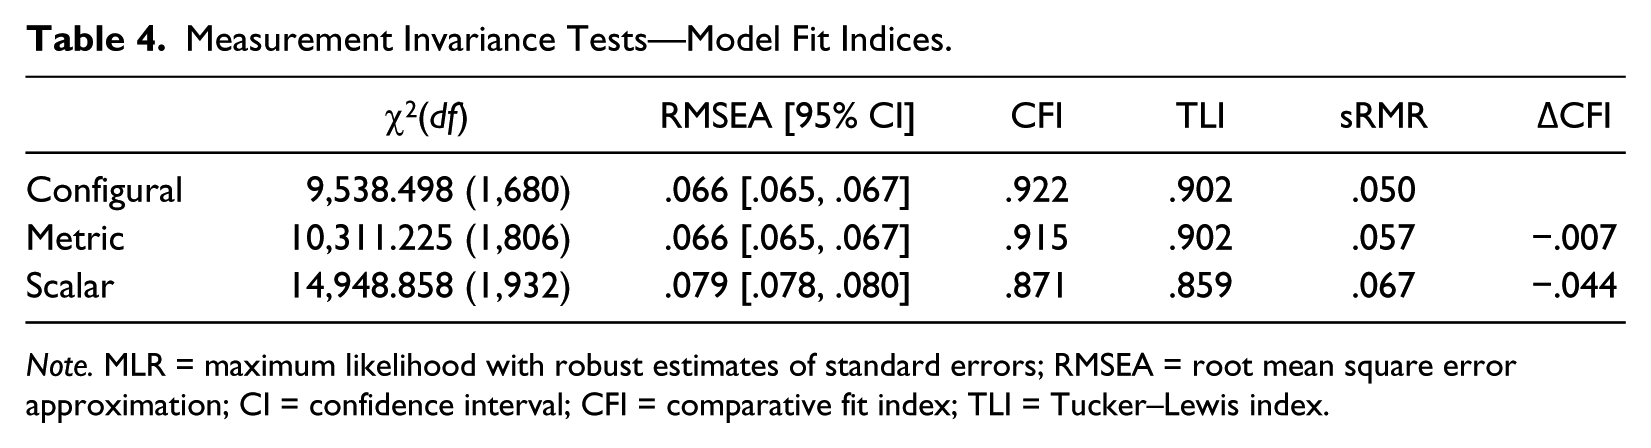
Note. MLR = maximum likelihood with robust estimates of standard errors; RMSEA = root mean square error approximation; CI = confidence interval; CFI = comparative fit index; TLI = Tucker–Lewis index.
The first step in testing measurement invariance is to test the baseline model—a model specifying configural invariance across the 10 countries. In this model, all of the model parameters are freely estimated in all groups, but items must load on their pre-assigned factors. On establishing the configural model as the starting point, a model specifying metric invariance was tested. Here all of the factor loadings were constrained to equality across all 10 countries. Metric invariance indicates that the relationships between the indicator items and the respective latent factors are the same across all of the groups in question. Achieving metric invariance allows interpretations of observed covariance relationships between the factors and covariates and comparisons of these effects between groups. The final step in testing measurement invariance is to test the model specifying scalar invariance. Here all of the loadings and the item intercepts were constrained to equality across the 10 countries. Scalar invariance addresses the meaning of the item scales across the 10 countries and is necessary for making meaningful mean-level comparisons. As can be seen in Table 4, both the configural and metric invariance models indicated good fit to the data. The model fit indices for the scalar model suggest reasonable model fit, particularly considering the restrictions imposed on the model and the diversity of the 10 country samples.
Descriptive Means for the Seven Factors Across Three Cultural Zones
For descriptive purposes, the means and standard deviations of the seven trust factors across the three cultural zones—Latin America (Argentina, Brazil, and Chile), Catholic/Europe (Spain, Italy, Poland, and Estonia), and Western democracies (Germany, United Kingdom, and United States)—along with the significance and effect size for the omnibus test (analysis of variance [ANOVA]) for each factor are presented in Figure 2.
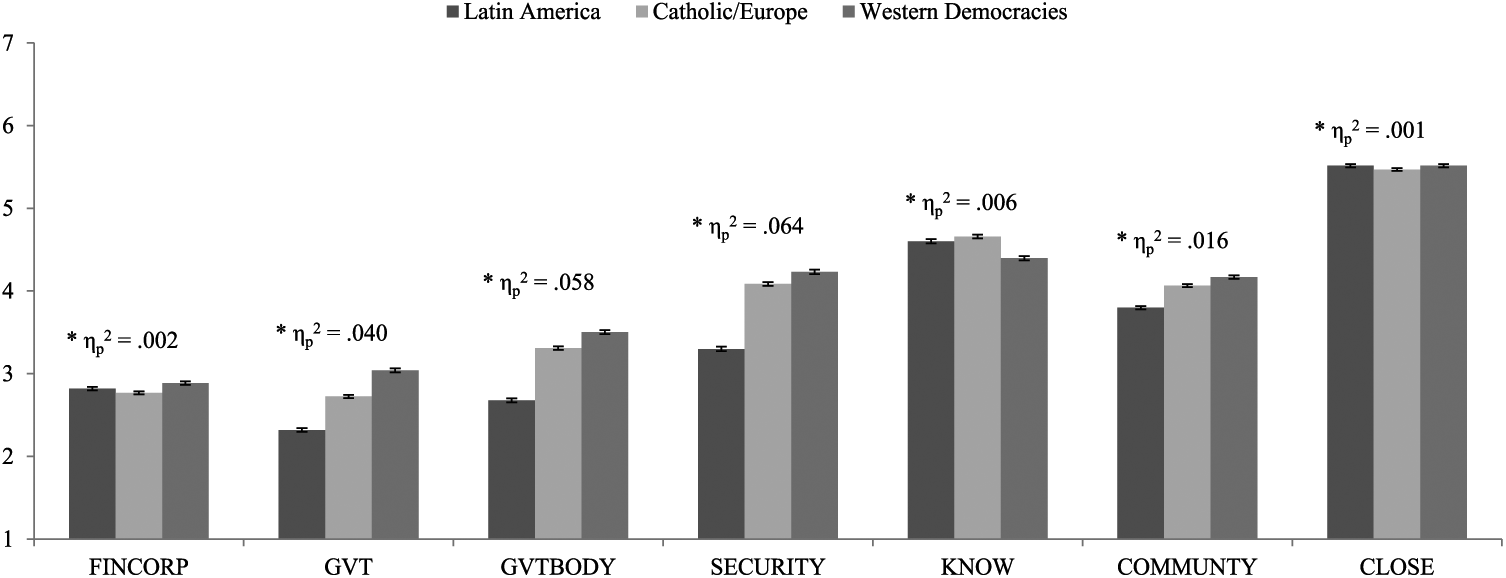
Mean levels of the seven factors of institutional trust across the three cultural zones (* ANOVA p < .05).
Trust in Close Relations was uniformly high with very little variation across the cultural zones, F(2, 10,754) = 7.268, p = .001, ηp2 = .001. Similarly, moderately high trust in Knowledge Producers, and low trust in Financial Institutions and Corporations showed little variation across the zones, F(2, 10,743) = 33.034, p < .001, ηp2 = .006 and F(2, 10,751) = 9.081, p < .001, ηp2 = .002, respectively.
More variation was observed in the levels of trust in Government, F(2, 10,753) = 225.334, p < .001, ηp2 = .040; Governing Bodies, F(2, 10,751) = 329.906, p < .001, ηp2 = .058; Security institutions, F(2, 10,746) = 364.701, p < .001, ηp2 = .064; and Community, F(2, 10,752) = 84.700, p < .001, ηp2 = .016. Across these factors, Western democracies showed consistently the highest trust, while Latin America consistently showed the lowest levels of trust. In general, Financial Institutions and Corporations and the Government were trusted the least, with rising trust in Governing Bodies, Security, Community, Knowledge Producers, and Trust in Close Relations being uniformly high. These findings are in accord with previous findings reported using the WVS measure of confidence in institutions as the measure of political trust (Arancibia, 2008; Mishler & Rose, 2001).
Trust Profiles
Having established the structural and measurement components of the GTI, we further investigated the combined structure of the seven factors within individuals through a LPA. Specifically, we used LPA to identify qualitatively distinct trust profiles based on the mean scores of participants’ responses to the seven factors of the GTI. The LPA was conducted on the full 10 country sample (n = 10,757) to identify overall latent profiles. Upon identifying the best profile solutions (i.e., the number and structure of profiles in our data), we used the three-step distal LPA procedure (Asparouhov & Methuén, 2013) to identify distinct characteristics of and the differences between the profiles based on distal auxiliary variables pertaining to political engagement.
To identify the optimal latent profile solution, we estimated a range of models. We utilized the Vong-Lo-Mendell-Rubin testing procedure as well as the comparison of information criteria (Akaike information criterion [AIC] and adjusted Bayesian information criterion [aBIC]). Decreases in the AIC and the aBIC indicate improvements in model fit. The point at which the decreases level off indicates the best latent profile solution (i.e., increasing the number of profiles does not improve model fit). Finally, we also assessed the substantive contribution and interpretability of the classes identified. The Vong-Lo-Mendell-Rubin statistic (VLMR) and the information criteria (AIC and aBIC) for solutions ranging from one to eight profiles are presented in Table 5. While the VLMR test would suggest that the five- or seven-profile mode is the best solution, the information criteria indicated the four-profile model as the optimal solution. Moreover, the additional profiles identified beyond the four-profile model did not provide substantively interpretable contributions (i.e., there were no cross-over profiles with scores high in some factors and low in others, but further differences in mean levels of trust). Thus, we chose the four-profile model as the optimal solution. This solution showed good entropy (entropy = .825; better than either the five- or the seven-profile model) as well as consistently low average cross classification probabilities (highest cross classification probability .093).
Information Criteria and the VLMR Statistics for the Different Latent Profile Solutions (N = 10,757).
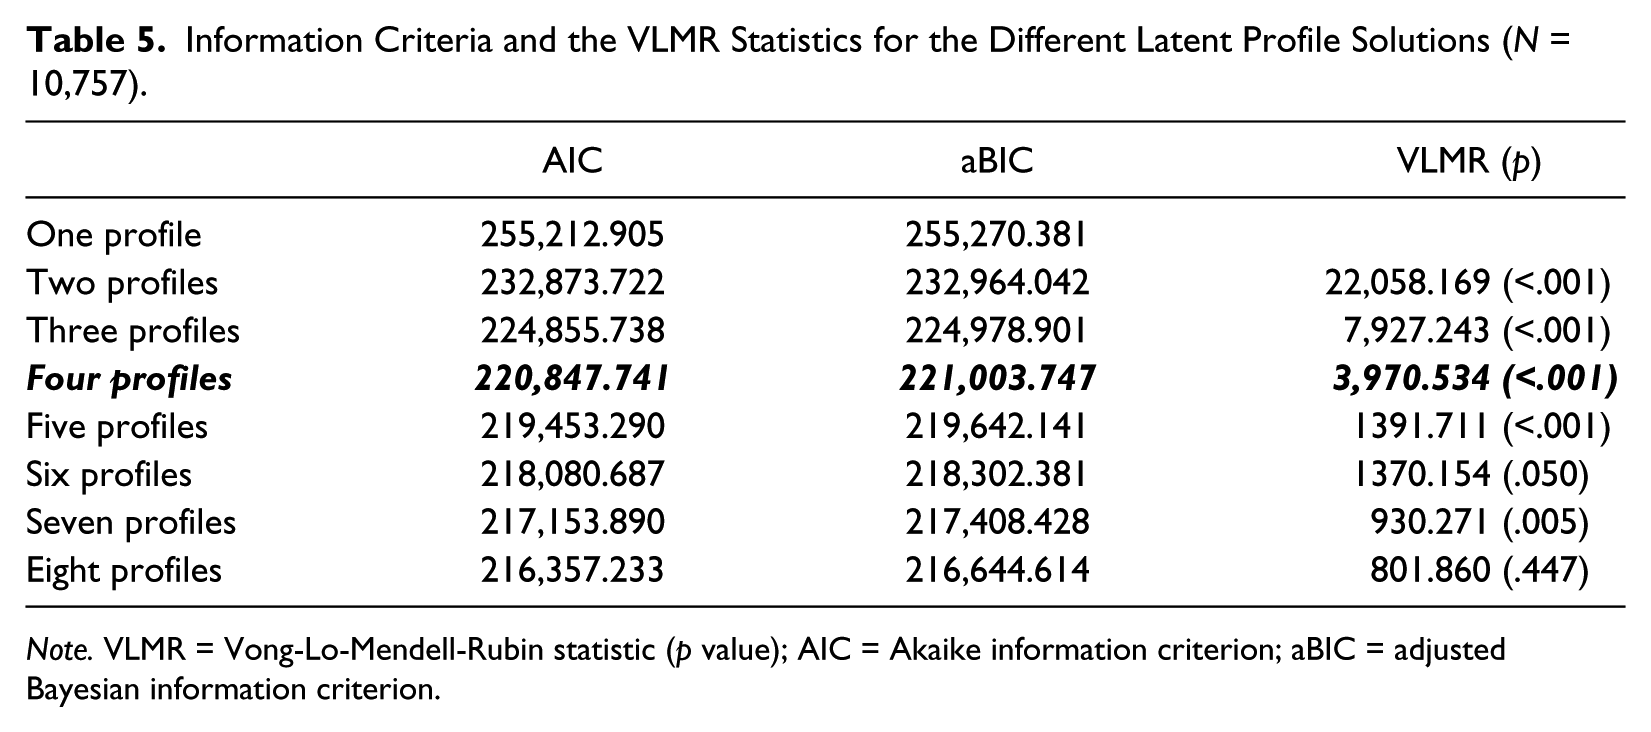
Note. VLMR = Vong-Lo-Mendell-Rubin statistic (p value); AIC = Akaike information criterion; aBIC = adjusted Bayesian information criterion.
The four identified trust profiles (or propensities to trust) are presented in Figure 3. The largest profile—named “Moderate Trust”—was characterized by moderate to high levels of trust across the seven factors of institutional trust. This was the largest profile identified, comprising 38.6% of the sample (n = 4,163). The second largest profile was characterized by moderate to high levels of trust in Knowledge Producers, Community, and Close Relations—at similar levels to those observed in the Moderate Trust Profile. However, this profile exhibited relatively low trust in governmental and financial institutions. This profile—named “Low Institutional Trust”—comprised 32.2% of the sample (n = 3,500). The two smaller profiles were drastically different. The “High Trust” profile was characterized by high levels of trust across all seven factors of trust. This profile comprised 14.5% (n = 1,531) of the sample. On the other hand, the “Low Trust” profile was characterized by low levels of trust across all seven factors except for moderate (but still the lowest) trust in Close Relations. This profile comprised 14.6% (n = 1,563) of our sample.
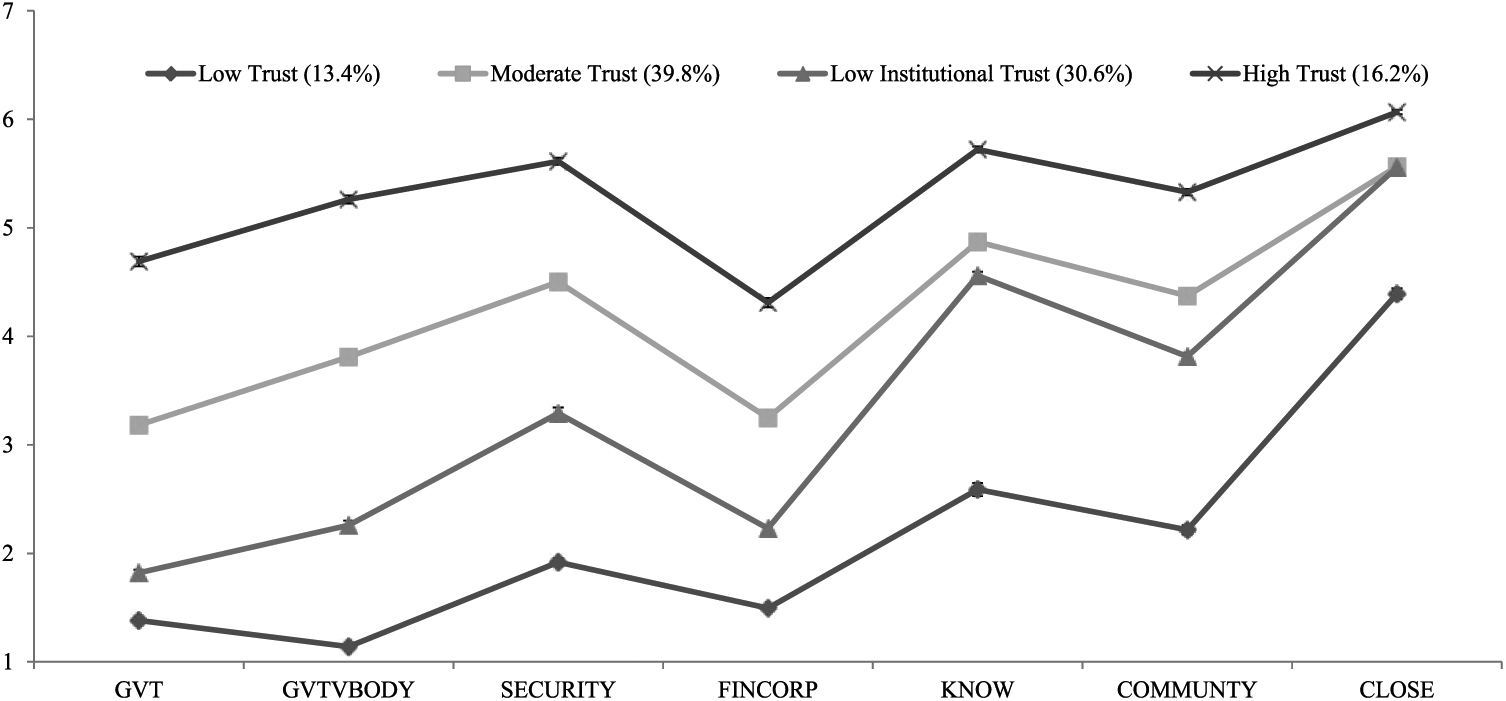
The identified latent trust profiles and the associated mean-levels of trust across the seven-factors of the Global Trust Inventory.
We employed the three-step distal procedure (Asparouhov & Methuén, 2013) to identify the differences between the four identified profiles in terms of basic demographics (gender, age, self-reported social status, urban versus rural residence, and renting versus owning one’s home), Political, Economic, and Social Conservatism, Frequency of Voting in Local and in National Elections, and measures of political engagement, community engagement, and prejudice.
Significant differences in gender proportions were observed across the four profiles, χ2 (3, 10,553) = 61.244, p < .001. Specifically, the High Trust profile had the highest proportion of men (53.9%) relative to the other four profiles (48.6%, 44.4%, and 40.7% in the Moderate Trust, Low Institutional Trust, and Low trust profiles, respectively). There was also a significant overall difference in age, χ2(3, 10,625) = 352.800, p < .001. The High Trust profile was the oldest (M = 48.308, SE = .392), followed by the Moderate Trust profile (M = 43.700, SE = 240), Low Institutional Trust profile (M = 42.161, SE = .259), and finally, the Low Trust profile (M = 38.541, SE = .364). The four classes also differed in the proportion of people who lived in urban versus rural areas, χ2(3, 10,644) = 79.739, p < .001, and the proportion of those who owned versus rented their home, χ2(3, 10,657) = 39.156, p < .001. The Low Institutional Trust (81.7%) and the Low Trust profile (79.1%) had the highest and comparable proportions of people living in urban areas relative to the other two profiles (73.8% and 71.6%; in the Moderate Trust and High Trust profiles, respectively). On the other hand, the High Trust profile had the largest proportion of home owners (75%), whereas the Low Trust profile had the lowest proportion of home-owners (64.1%). The Moderate Trust and the Low Institutional Trust profiles showed comparable proportions of home-owners (70.7% and 69.9%, respectively). Finally, levels of self-reported social status differed across the four profiles, χ2(3, 10,693) = 899.293, p < .001. The High Trust profile reported the highest social status (M = 6.225, SE = .041), followed by the Moderate Trust profile (M = 5.597, SE = .026), the Low Institutional Trust profile (M = 5.132, SE = .029), and finally the Low Trust profile (M = 4.586, SE = .044). Significant differences across the four profiles were also observed in terms of Political Orientation, χ2(3, 10,720) = 130.630, p < .001. High Trustors reported the highest levels of Conservatism (M = 5.481, SE = .058), followed by the Moderate Trust profile (M = 4.897, SE = .035; 5 = midpoint). Low Institutional Trust and Low Trust profiles had comparable levels of Conservatism (M = 4.740, SE = .039 and M = 4.705, SE = .058, respectively).
Consequences of trust profile membership
Importantly, significant differences across the four profiles were observed in terms of the reported frequency of voting in Local, χ2(3, 10,638) = 518.849, p < .001, and in National, χ2(3, 10,621) = 506.827, p < .001, elections. In accord with hypotheses, the High Trust profile reported the highest frequency of voting in local elections (M = 6.144, SE = .038), while the Low Trust profile reported the lowest levels (M = 4.545, SE = .060); Moderate Trust and the Low Institutional Trust profiles were comparable and in between (M = 5.559, SE = .031, and M = 5.572, SE = .34, respectively). Similarly, the High Trust profile reported the highest frequency of voting in national elections (M = 6.246, SE = .037) while the Low Trust profile reported the lowest frequency (M = 4.671, SE = .060), and Moderate Trust and Low Institutional Trust profiles were again comparable and in between (M = 5.702, SE = .030, and M = 5.740,SE = .033; respectively).
Further predicted differences in terms of political engagement were observed, in both political discussion and elaboration of political issues. The amount of discussion of political issues with people with similar political views, χ2(3, 10,704) = 174.646, p < .001, was highest in the High Trust profile (M = 4.250, SE = .040), followed by the Low Institutional Trust (M = 4.088,SE = .028), Moderate Trust (M = 3.952, SE = .026), and finally, the Low Trust profiles (M = 3.522, SE = .043). Similarly, there were significant differences in the amount of discussion of political issues with people with different political views, χ2(3, 10,649) = 68.316, p < .001. The most discussion was reported by the High Trust and the Low Institutional trust profiles (M = 3.715, SE = .039; and M = 3.587, SE = .027, respectively), followed by the Moderate Trust (M = 3.545, SE = .024), and finally the Low Trust profiles (M = 3.273, SE = .040). Similar differences were observed in Political Elaboration, χ2(3, 10,735) = 191.441, p < .001. The High Trust profile had the highest score (M = 4.236, SE = .037), followed by the Low Institutional Trust profile (M = 4.129, SE = .025), the Moderate Trust profile (M = 3.948, SE = .024), and finally the Low Trust profile (M = 3.563, SE = .040). In accord with predictions, people high in trust engaged in the most political discussion, and those low in trust engaged the least.
Differences were also observed in terms of Community Engagement or Offline Social Capital (Gil de Zúñiga et al., 2012; Gil de Zúñiga & Valenzuela, 2011), χ2(3, 10,728) = 969.266, p < .001, as predicted. The High Trust profile had the highest score (M = 4.448, SE = .030), followed by the Moderate Trust profile (M = 3.948, SE = .020), Low Institutional Trust profile (M = 3.735, SE = .023), and finally the Low Trust profile (M = 3.036, SE = .035).
Finally, substantive differences were observed in terms of expressed prejudice, in accord with predictions. Significant differences were observed in thermometer ratings toward Immigrants, χ2(3, 10,725) = 93.197, p < .001, with the highest warmth reported by the High Trust Profile (M = 4.337, SE = .044), followed by the Low Institutional Trust profile (M = 4.225, SE = .030), Moderate Trust profile (M = 4.096, SE = .027), and finally, the Low Trust profile (M = 3.783, SE = .045). Similarly, differences were observed in ratings of warmth toward Homosexuals, χ2(3, 10,730) = 29.404, p < .001, with the similar warmth reported by the High Trust profile (M = 4.399, SE = .046), the Low Institutional Trust profile (M = 4.495, SE = .031), and the Moderate Trust profile (M = 4.374, SE = .028). The Low Trust profile reported the lowest levels of warmth toward homosexuals (M = 4.197, SE = .046). There were significant differences in reported warmth toward Black people, χ2(3, 10,734) = 74.587, p < .001, with the highest warmth reported by the High Trust and the Low Institutional Trust profiles (M = 4.869, SE = .039; and M = 4.922, SE = .026), followed by the Moderate Trust profile (M = 4.739, SE = .025), and finally the Low Trust profile (M = 4.530, SE = .041). Also, in ratings of Immigrants as a threat to world peace, χ2(3, 10,718) = 177.969, p < .001, the highest score was reported by the Low Trust profile (M = 3.688, SE = .048), followed by the High Trust and the Moderate Trust profiles (M = 3.438, SE = .047; and M = 3.357, SE = .029, respectively), and finally, the Low Institutional Trust profile (M = 2.995, SE = .031). Overall, High Trustors were the least prejudiced, as predicted.
Prevalence Mapping
Next, we sought to investigate the prevalence of the four identified Institutional Trust Profiles across the three cultural zones—Latin America (Argentina, Brazil, and Chile), Catholic/Europe (Spain, Italy, Poland, and Estonia), and Western democracies (Germany, United Kingdom, and United States). 6 Following Hanke and colleagues (2015), we refer to this analysis as prevalence mapping. As can be seen in Figure 4, clear differences exist in terms of the distribution of the four profiles across the three regions, in accord with expectations and previous research.
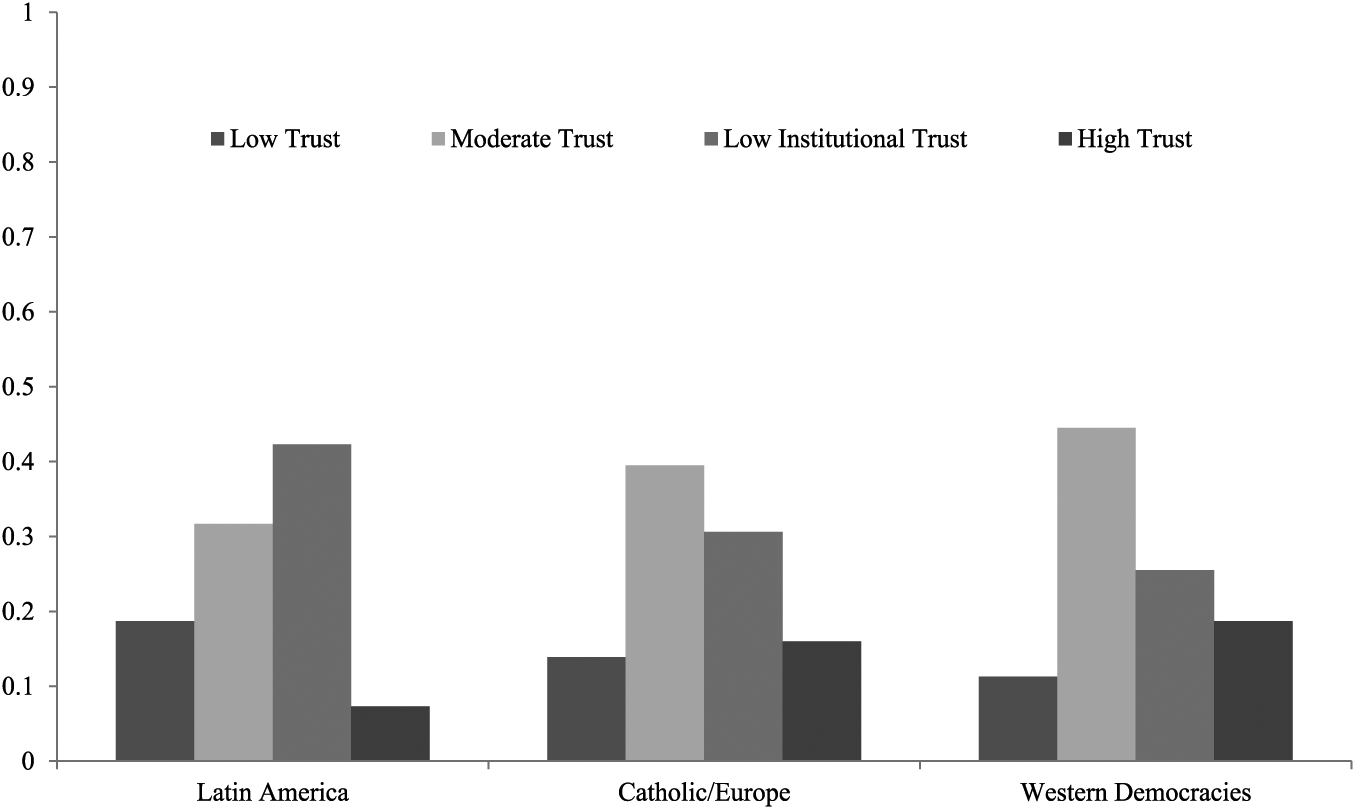
Distribution of trust profiles across the three cultural zones.
The Latin American countries had the highest proportion of the Low Trust (18.7%; relative to 13.9% and 11.3% in Catholic/Europe and Western democracies, respectively) as well as the Low Institutional Trust (42.3%, relative to 30.6% and 25.5% in Catholic/Europe and Western democracies, respectively) profiles. Conversely, Western democracies had the highest proportion of the High Trust profile (18.7%), whereas Latin American countries had the lowest (7.3%; Catholic/Europe had an intermediate proportion, 16%). Similarly, Western democracies had the highest relative level of the Moderate Trust profile (44.5%), whereas the Latin American countries had the lowest (31.7%; with Catholic/Europe intermediate at 39.5%). In summary, the Low institutional Trust and Low Trust profiles comprised a majority in the Latin American zone (61%). Conversely, in both Catholic/Europe (55%) and in Western democracies (63.2%), the High Trust and Moderate Trust profiles comprised the majority.
Discussion
The GTI appears to serve as a survey instrument capable of measuring the “habits of the heart” that foster a healthy environment for democracy. Across 10+1 societies in the Americas, and Europe, the GTI demonstrated configural, metric, and reasonable scalar invariance in multi-group analysis of large representative samples. 7 These analyses suggest that trust carries a strong and intuitive sense of meaning that extends beyond Close Relationships to include situational sensitivity to risking dependencies on others. Whether they part of one’s Community (poorly measured in this iteration of the GTI), Security, Financial Institutions and Corporations, Knowledge Producers, or Government and its Governing Bodies, each of these seven factors represents meaning that consistently differentiated this subcomponent of trust from others for all 10+1 societies analyzed.
In accord with predictions from evolutionary theory, Close Relations were everywhere trusted most, with little variability across cultures. The impersonal social forces of Government and Financial Institutions/Corporations were trusted least, but with more variability across cultures. In accord with Rothstein and Stolle (2008), representative Government and Implementing/Governing Bodies formed separate factors, with the former (more partisan) representative institutions less trusted than the later (perhaps more impartial) implementation bodies. These initial results provide a platform for what we anticipate will be a fruitful body of research using the GTI to examine in greater detail differential impacts of the seven factors on social functioning in different societies and social contexts, even where these seven do not fit (see Zhang et al., under review, for alternative structures for East Asia).
Beyond situation-specific indicators of trust (or the “trustworthiness” of a particular social force), all the factors were combined through LPA to generate a simple measure of propensity to trust as an overall individual difference (Mayer et al., 1995). Four Trust Profiles were identified, none of which indicated trade-offs between one form of trust and another: all factors were positively correlated to greater and lesser degrees. A trade-off between Close Relationships and more generic forms of trust was suggested by Fukuyama (1995), but not found. Instead, a High Trust Profile (14.5% of the total sample) was shown to have all the virtues associated with social capital in the political context: greater participation in political discussion with both similar and dissimilar others, greater elaboration of political thinking, more community engagement, less prejudice against a range of possible outgroups, and greater participation in local and national elections. The opposite pattern was found in the main for the Low Trust Profile (14.6% of total sample). These findings provide evidence for Putnam’s (2001) assertion that trust may serve as a proxy for measuring social capital. Longitudinal path modeling may be able to describe with greater precision the exact causal relationship between different forms of Trust and network measures of social capital. We thus might push the “proxy” toward directional or bi-directional causality in the future.
In between the two extremes, two more common moderate profiles show a nuanced pattern of participation and prejudice. Although they have comparable levels of institutionalized participation (i.e., voting), the Low Institutional Trust Profile (32.2%) seems to be more willing to use a non-institutionalized approach than the Moderate Trust Profile (38.6%) to get involved in political issues (e.g., political discussion & elaboration). The Low Institutional Trust Profile probably corresponds to grass-roots and participatory movements within democracies that express distrust in traditional and institutionalized ways of organization. In contrast, the Moderate Trust Profile seems to represent those who still depend on the traditional system of institutionalized governance and are relatively less enthusiastic about engaging in political discussion and elaboration. Interestingly, the Moderate Trust Profile also had relatively higher prejudice than the Low Institutional Trust Profile: This makes sense given that the “Moderates” were the older, more rural, and more conservative profile.
The psychometric properties of the GTI afford researchers the ability to make more precise comparisons between different societies. As noted by Vandenberg and Lance (2000), establishing measurement invariance across groups is “a logical prerequisite to conducting substantive cross-group comparisons” (p. 4). Specifically, tests of measurement invariance address the assumption that the participants with the same scores on a given measure have the same standing on the construct that underlies the measure (Schmitt & Kuljanin, 2008). Demonstrating good measurement invariance of the GTI across the 10+1 countries in our investigation is a crucial contribution toward allowing meaningful comparisons across countries and regions. However, it is also possible to make less precise but also useful comparisons across more substantially differing cultures (see Hanke et al., 2015) using non-parametric statistics (Zhang et al., under review).
To conserve space, we have outlined the differences in the prevalence of Trust Profiles between countries classified as Western democracies, Catholic/European, and Latin American societies. High Trust Profiles were most common in the wealthy Western democracies and least common in the poorer Latin American societies, with Catholic/European societies intermediate. The reverse was true for Low Trust Profiles. The Latin American societies were particularly high in Low Institutional Trust Profiles. These findings suggest that Trust Profiles can be interpreted as lenses that connect individuals to the social realities surrounding them. We have started using agent-based simulations to model transitions at both the individual and societal level from low to intermediate and high trust (and vice versa, for preliminary results see Perez-Acle et al., in press).
The causal relationship between trust, social capital, political engagement, and social status bears careful future scrutiny. In particular, the demographic correlates of a High Trust Profile are threaded with hopes and fears and realities about inequality: We can all hope to be property owners, to achieve higher status and wealth in society- and this typically occurs with age. Winston Churchill once quipped that if you are young and conservative you have no heart, but if you are old and liberal you have no brain. Our high trustors were not only more conservative than the other profiles, but older, more likely to be men, and wealthier (higher status). They are likely more invested in mutually beneficial dependencies across a wider range of relationships in their societies; they have more resources to absorb risk and the confidence to manage risk as they probably have better assurance networks to protect them in case of adversity (see Yamagishi & Yamagishi, 1994). A propensity to trust might thus not be the property of an individual so much as a social status, gifted disproportionately to members of prosperous societies, and to successful individuals within whatever society they reside. It is sobering to think of propensity to trust as a form of privilege, but this is exactly what these data suggest. By contrast, people living in urban settings tended to take on Low rather than High Trust profile membership, and low trustors are disproportionately young and of lower status; property ownership is increasingly more of a dream than reality in many expensive cities. These correlates suggest that an affluent middle class are the economic drivers of a high trust society, but sadly, this group does not appear to be growing in most of the world’s established democracies (Firebaugh, 2003).
Some qualifications are needed regarding the cross-cultural validity of the conclusion within and beyond the 11 societies. On one hand, although all societies analyzed here are democratic societies, their specific configuration of political system varies. For example, voting is voluntary in most countries, but it is compulsory for eligible citizens in a few countries (e.g., Argentina and Brazil). Thus, we need to be cautious in interpreting the results of voting behavior in these countries. On the other hand, by choosing to restrict ourselves to democratic societies in building an invariant model of trust, we are theorizing that trust is a “synthetic force” responsive to real distributions of power in society. We suspect that the structure of trust in Communist China, where the central government is extraordinarily powerful, and in Russia where the operation of top-down authority has had a long history of practice, takes on qualitatively different forms of meaning. Not all cultures share the ideals of Western democracies where the role of civil society is inscribed to check-and-balance the operations of government. The social forces that underpin the structure of trust in Russia and China are not those of the United States. We believe that the GTI will become a useful instrument in the tool-kit of theorists seeking to model the rise, decline, and fall, or transitional change of democracies worldwide, and moreover, to deepen understanding of the relationship between these processes and non-democratic forms of governance.
Footnotes
Declaration of Conflicting Interests
The author(s) declared no potential conflicts of interest with respect to the research, authorship, and/or publication of this article.
Funding
The author(s) disclosed receipt of the following financial support for the research, authorship, and/or publication of this article: This research was supported by Grant FA2386-15-1-0003 from the Asian Office of Aerospace Research and Development. Réfiné sur le Canal du Midi, complété au dessus l’Océan Pasifique (Air New Zealand Flight 080).