
Abstract
How do perceived and objective cultural distance compare in predicting immigrants’ acculturation experiences? Using data from a diverse sample of immigrants residing in the United States (N = 939), we examined perceived cultural distance alongside objective cultural distance measured by the Cultural Fixation Index (CFST), a novel and flexible metric derived from World Values Survey data that captures between-group variation in cultural values. Our findings reveal that perceived cultural distance, assessed using the Brief Perceived Cultural Distance Scale, was more often associated with psychological outcomes, including higher homesickness (β = .08) and lower psychological adaptation (β = −.08). In contrast, objective cultural distance was negatively associated with physical health (β = −.16), and stronger orientations toward host culture (β = .08). The two measures were moderately correlated (r = .34), and both predicted greater culture shock and stronger heritage culture orientation. Neither objective nor perceived cultural distance significantly predicted depressive symptoms or anxiety. These findings highlight the importance of assessing both subjective perceptions and objective measures of cultural differences when studying acculturation and considering their respective trade-offs.
Introduction
As international migration has become increasingly common in recent decades, driven by factors such as increased international career and education opportunities, natural disasters, and armed conflicts (International Organization for Migration, 2024), more people have been leaving their culture of upbringing to live in societies that may differ significantly from their own. In 2020, nearly 281 million people were living outside their birth country—more than triple the number in 1970 (McAuliffe & Oucho, 2024). The share of international migrants in the global population has also increased, from 2.3% in 1970 to 3.6% in 2020. The United States, which hosts the largest number of international immigrants from nearly every country worldwide, saw its immigrant population rise from 4.7% in 1970 to 14.3% in 2023, reaching a record of 47.8 million and accounting for around one-fifth of the world’s international migrants (Moslimani & Passel, 2024). As migration continues to reshape global demographics, it is increasingly important to understand the challenges individuals face when adjusting to a new country (Benkirane & Doucerain, 2022).
One factor that has been found to be relevant to how easily people are able to adapt to their acculturation experiences is cultural distance (e.g., Ward & Kennedy, 1993)—that is, the difference between the culture of the host society from one’s heritage culture. In general, greater cultural distance has been found to be associated with more difficulty adapting to the host culture and lower well-being (e.g., Demes & Geeraert, 2014), although there are exceptions to this pattern (e.g., O’Grady & Lane, 1996). Additionally, there is some debate over how best to measure cultural distance: some scholars advocate for subjective measures that reflect individuals’ perceived cultural differences (e.g., Demes & Geeraert, 2014; Suanet & Van de Vijver, 2008), while others support objective indicators derived from national-level data (e.g., Akhimien & Adekunle, 2021; Shi & Wang, 2011). Moreover, cultural distance is not just relevant to people’s psychological well-being, but also to how they navigate their adaptation to the host culture (Taušová et al., 2019).
The present research addresses these different perspectives by examining and comparing the roles of perceived and objective cultural distance in predicting immigrants’ adjustment outcomes, including their acculturation orientation, and their adjustment-related well-being. More specifically, objective cultural distance was measured using the cultural fixation index (CFST; Muthukrishna et al., 2020), a relatively novel way of assessing the distance between any cultural groups.
Cultural Distance
Cultural distance refers to the degree of difference in the social and environmental attributes between an individual’s culture of origin and the host culture. It has been widely studied in the fields of international business (e.g., Kogut & Singh, 1988; Shenkar, 2001) and acculturation research (e.g., Demes & Geeraert, 2014; Suanet & Van de Vijver, 2008). One of the earliest attempts to quantify this concept was by Babiker and colleagues (1980), who developed a subjective measure based on overseas students’ perceptions of differences in factors such as climate and family structure between Edinburgh and their home cultures. Since then, a myriad of approaches to measuring cultural distance have emerged, ranging from subjective self-report methods to more objective indices based on country-level indicators. Within acculturation research, cultural distance has been shown to predict key outcomes such as psychological adaptation, sociocultural adjustment, and overall well-being (e.g., Babiker et al., 1980; Searle & Ward, 1990; Ward & Kennedy, 1993; but see Bashir & Khalid, 2022).
Perceived Cultural Distance
Perceived cultural distance refers to the subjective sense of difference individuals perceive between their heritage and host cultures, particularly in terms of social and environmental aspects. It is typically assessed by asking participants to rate perceived differences between the two cultures across various domains, such as social norms, values, climate, interpersonal relationships, or everyday cultural practices (e.g., Demes & Geeraert, 2014). A variety of studies have explored how perceived cultural distance relates to psychological adjustment among migrants (e.g., Babiker et al., 1980; Suanet & Van de Vijver, 2008). A strength of perceived cultural distance is that the individual is likely best positioned to identify the ways that their host culture is at odds with their heritage culture, especially because within any country people belong to a number of different kinds of subcultures, so there is much important variation within nations in terms of people’s cultural experiences. At the same time, perceived cultural distance bears a cost in predicting adjustment outcomes, as it seems likely that an individual’s judgements about how different their host culture is from their heritage culture would be influenced by how well they are getting along in the host culture, which would confound the measures of perceived cultural distance and acculturative difficulties. For example, an individual who feels that they are struggling to fit into a new culture may conclude that the host culture is very different from their heritage culture, whereas one who has adjusted fine may be more likely to conclude the cultures are similar.
Objective Cultural Distance
In contrast to perceived cultural distance, objective cultural distance generally refers to the quantifiable differences between cultures based on standardized dimensions, typically assessed at the national level based on dimensions such as power distance, individualism-collectivism, and uncertainty avoidance (e.g., Hofstede, 2001; Ollier-Malaterre & Foucreault, 2018) and less influenced by individuals’ subjective acculturation experiences. Traditional approaches to measuring cultural distance typically involve calculating Euclidean or Mahalanobis distances based on theoretical frameworks such as Hofstede’s (2001) cultural dimensions (e.g., De Maesschalck et al., 2000; De Santis et al., 2015; Shi & Wang, 2011). Two of the more commonly used indices include Kogut and Singh’s (1988) composite score and Demes and Geeraert’s (2014) adaptation of Hofstede’s model. Other frameworks, such as S. H. Schwartz’s (1992), 2014) cultural value orientations and the GLOBE model (Ollier-Malaterre & Foucreault, 2018), have also been employed. However, many of these efforts are limited as they reduce all of the complexity of a culture to a small number of identified cultural dimensions, thus potentially concealing much other cultural variation. Reflecting the limits of these past efforts to operationalize objective cultural distance, studies have found weak or inconsistent correlations between objective and perceived cultural distance (e.g., Suanet & Van de Vijver, 2008).
In an effort to circumvent some of the limitations of past operationalizations of objective cultural distance, Muthukrishna et al. (2020) introduced the Cultural Fixation Index (CFST), a theoretically grounded metric adapted from the fixation index (FST) in population genetics (Holsinger & Weir, 2009; Wright, 1949). Unlike traditional methods that focus on the mean differences across predefined cultural dimensions (e.g., Hofstede’s cultural dimensions), CFST calculates the ratio of the between-group variance and total variance for any single or combined measured trait. In other words, it estimates the extent to which variation in cultural traits reflects differences between populations rather than differences among individuals within those populations. This allows for the comparison of the distribution of traits across regions or countries, and also accounts for within-group variability. It is a flexible index that can be applied at subnational levels or across other variables such as gender, religion, or even time (e.g., Kay et al., 2025; White et al., 2021). The original CFST was created using the data from the World Value Survey (Inglehart et al., 2014), which has been administered to dozens of countries around the world, in an ongoing series of waves of data collection every several years. Muthukrishna et al. (2020) identified a set of items from this survey that addressed people’s values, behaviors, and beliefs; that were not specifically relevant to any particular region; and that were non-demographic. The CFST does not focus solely on point estimates or predefined cultural dimensions, but instead compares entire distributions of cultural traits, making it scale-invariant, unit-free, and sensitive to within-group variability. This allows for the detection of cultural differences that traditional Euclidean or Mahalanobis distance methods may overlook, especially when group means are similar but internal variances differ. These features make CFST a more flexible and empirically robust tool for measuring cultural distance, especially in studies examining migration, adaptation, and acculturation. It can also accommodate continuous, binary, or nominal traits, and be applied at different levels of analysis, including within-country regional comparisons. Moreover, because this measure does not rely on respondents’ knowledge and subjective impressions, the CFST is less susceptible to individual biases. Much recent research has applied CFST across a wide range of domains, including religious and national clustering (White et al., 2021), cultural diversity (Bentzen et al., 2024), group-beneficial behaviors (Beheim & Bell, 2024), and cultural change over time (Kay et al., 2025). The method has also proven useful beyond psychology, including in anthropology (Boesch et al., 2020), folklore studies (Ross et al., 2013), and research on the evolution of cooperation (Handley & Mathew, 2020; Smith et al., 2018).
Acculturation
Acculturation refers to the psychological, social, and cultural changes that occur when individuals or groups from different cultural backgrounds engage in extended, direct contact. People’s experiences are influenced by their acculturation orientation, which reflects an individual’s approach to adapting to a new cultural context, specifically the extent to which they seek to maintain their heritage culture and adopt aspects of the host culture (Berry, 1997; Ryder et al., 2000). In the current study, we use a bidimensional approach that assesses heritage and host cultural orientations independently, as this has been argued to be the most conceptually and psychometrically robust approach (Arends-Tóth & Van de Vijver, 2007; F. Rudmin, 2009; Ryder et al., 2000).
The process of adapting to a new cultural environment involves much psychological adjustment, which can threaten an individual’s well-being. Poor adjustment has been found to be linked to a variety of negative outcomes including heightened anxiety (Baeza-Rivera et al., 2022; Sullivan & Kashubeck-West, 2015; Wei et al., 2015), depression (Baeza-Rivera et al., 2022; Choy et al., 2021; Hamamura & Laird, 2014; Jackson et al., 2013; Li et al., 2014; Wei et al., 2015), loneliness (Sawir et al., 2007), homesickness (Tochkov et al., 2010), culture shock (Church, 1982), and reduced physical health (Babiker et al., 1980). These characteristics of adjustment-related well-being are typically measured through self-report scales that assess emotional functioning, comfort, and psychological symptoms during cultural transition (e.g., Demes & Geeraert, 2014).
Cultural Distance and Acculturation
Cultural distance, whether perceived or objectively measured, has long been theorized to influence individuals’ acculturation process and outcomes (Babiker et al., 1980; Demes & Geeraert, 2014; F. W. Rudmin, 2003).
A fairly consistent body of research examining individuals’ perceived cultural distance and adjustment outcomes typically finds that individuals who perceive a larger gap between their heritage and host cultures tend to report lower psychological and sociocultural adaptation, along with higher levels of homesickness, stress, culture shock, and social withdrawal (Babiker et al., 1980; Demes & Geeraert, 2014; Suanet & Van de Vijver, 2008; but see Bashir & Khalid, 2022). For example, in Russia, students from China and North Korea reported higher levels of perceived cultural distance and poorer adjustment compared to those from culturally closer regions like Georgia or Ukraine (Galchenko & van de Vijver, 2007; Suanet & Van de Vijver, 2008). In the United Kingdom and the Netherlands, higher perceived cultural distance predicted lower well-being and adaptation among international students (Demes & Geeraert, 2014; Taušová et al., 2019). Beyond between-country cultural distance, longitudinal work in China has shown that higher perceived cultural distance between one’s hometown and the host city also predicted lower sociocultural adaptation over time (Yan et al., 2024). Perceived cultural distance also shapes acculturation orientation. Individuals perceiving greater cultural distance tend to both maintain their heritage culture and endorse multiculturalism while being less inclined to adopt mainstream cultural practices (van Osch & Breugelmans, 2011). This may be because larger perceived differences between the heritage and host cultures can make engagement with the host culture more challenging or less familiar, leading individuals to rely more on cultural practices, values, and social networks associated with their heritage culture.
In contrast to the research on perceived cultural distance, findings on the relationship between objective cultural distance and adjustment-related outcomes have been more mixed. Some studies have found that shorter distances on indices such as Hofstede’s cultural dimensions are associated with poorer psychological and sociocultural adaptation (e.g., Akhimien & Adekunle, 2021; Čuhlová, 2019; Hemmasi & Downes, 2013), and poorer self-rated health outcomes, particularly among first-generation migrants (Detollenaere et al., 2018). However, other studies report findings of null associations between objective distance and key indicators of adjustment such as stress, self-esteem, and psychological well-being (e.g., Geeraert & Demoulin, 2013; Selmer et al., 2007). In some cases, individuals from culturally similar backgrounds have even reported poorer adjustment than those from more culturally distant contexts, such as among repatriated Chinese expatriates (Selmer, 2002) and Venezuelan immigrants in Colombia (S. J. Schwartz et al., 2018). One possibility for the tendency for measures of perceived cultural distance to predict poorer adjustment-related well-being is that people are more likely to perceive greater cultural distance when they are having a difficult time adapting to the host culture, thereby confounding the analysis. In contrast, measures of objective cultural distance do not share this confound.
Therefore, although perceived cultural distance captures individuals’ subjective perceptions of how different the host culture feels relative to their heritage culture, which may be particularly relevant for understanding immigrants’ psychological experiences and adjustment outcomes, it may also be influenced by individual factors such as personality or current adjustment difficulties. In contrast, objective cultural distance can provide standardized estimates of cultural differences between societies, which allows researchers to compare cultural distance systematically across many cultural groups, but it may not fully capture immigrants’ personal experiences in everyday life.
Current Research
In the present study, we aim to advance the measurement of cultural distance by comparing the roles of perceived and objective cultural distance in predicting acculturation orientations, psychological adaptation, and well-being. Perceived cultural distance captures individuals’ subjective sense of difference between their heritage and host cultures, whereas objective cultural distance is operationalized using the Cultural Fixation Index (CFST; Muthukrishna et al., 2020). We hypothesized that greater cultural distance would be associated with reduced psychological adaptation and poorer overall well-being (e.g., Demes & Geeraert, 2014; Hemmasi & Downes, 2013; Suanet & Van de Vijver, 2008; Taušová et al., 2019), and higher maintenance of the heritage culture and lower orientation toward the host culture (van Osch & Breugelmans, 2011). We anticipate that perceived and objective cultural distance may offer distinct yet complementary insights into immigrants’ adjustment-related well-being and acculturation orientations in the United States.
Method
Participants
We recruited participants who had migrated to the United States from other countries, as the United States hosts one of the largest and most culturally diverse immigrant populations in the world (United Nations Department of Economic and Social Affairs, Population Division, 2024). Advertisements were posted on Prolific Academic in January 2024 to recruit individuals who met the following criteria: (a) be 18 years of age or older and (b) have been born outside of the United States but currently reside within the country. The study was approved by the Research Ethics Board at the University of British Columbia, with the approval number H23-03311. All participants provided written informed consent prior to participating.
We aimed to collect data from a large sample to reliably detect any correlations larger than Pearson's r = .10. An a priori power analysis (assuming r = .10, α = .05, and power = .80) indicated a required sample size of n = 782. We initially recruited 1050 participants, and excluded any who failed an attention check, which asked: “Did you approach this survey with seriousness and attentiveness, answering questions thoughtfully?" Also, participants who did not meet the eligibility criteria were excluded, which resulted in a total of 111 excluded participants, yielding a final sample of 939 participants (51.22% women, Mage = 40.57 years, SDage = 14.77 years, 17.68% White). More details on the sample characteristics can be found in the Supplemental Materials (see Table S1).
Measures
Objective Cultural Distance
Objective cultural distance was calculated based on the Cultural Fixation Index (CFST; Muthukrishna et al., 2020; www.culturaldistance.com), a metric that quantifies cultural differences in people’s responses to the World Values Survey by comparing the distribution of culturally relevant beliefs, values, and behaviors across populations. The CFST is derived from the fixation index (FST) used in population genetics and measures the proportion of variance in cultural traits that occurs between groups relative to the total variance. As we focused on cross-national comparisons of cultural distance, objective cultural distance was calculated based on the CFST -based cultural distance between each participant’s country of birth and the United States. 1
Perceived Cultural Distance
Perceived cultural distance was assessed using the Brief Perceived Cultural Distance Scale (Demes & Geeraert, 2014). This 12-item scale measures participants' subjective perceptions of differences between their home country and the United States across various domains, including climate, social environment, daily customs, and more. Participants rated each item on a seven-point Likert scale (1 = Very similar, 7 = Very different), with higher scores indicating a greater perceived cultural gap.
Psychological Adjustment
Psychological adjustment was measured through multiple scales that capture different aspects of cultural adjustment.
Psychological Adaptation
Psychological adaptation was assessed using the eight-item Brief Psychological Adaptation Scale (Demes & Geeraert, 2014), which evaluates participants’ emotional adjustment to life in the United States through items such as “In the last two weeks, how often have you felt happy with your day-to-day life in the United States”. Participants rated each item on a seven-point Likert scale (1 = Never, 7 = Always), with higher scores indicating better psychological adaptation.
Culture Shock
Culture shock was measured using the 12-item Culture Shock Questionnaire (Mumford, 1998), which assesses difficulties participants experienced while adapting to American culture through items such as “Have you found things in your new environment shocking or disgusting?”. Items were assessed using a five-point Likert scale (1 = Never, 5 = Always), with higher scores indicating greater culture shock.
Homesickness
Homesickness was evaluated using the ten-item Homesickness Questionnaire (Archer et al., 1998), which examines feelings of longing for one's home country. Items included “I cannot help thinking about my home” and “I often dream about my family back home” and were assessed using a five-point Likert scale (1 = Never, 5 = Always), with higher scores indicating greater homesickness.
Loneliness
Loneliness was measured using the six-item Revised UCLA Loneliness Scale (Wongpakaran et al., 2020), a widely used measure of social and emotional isolation. Example items included “How often do you feel left out” and “How often do you feel that you are no longer close to anyone?” and were assessed using a five-point Likert scale (1 = Never, 5 = Always), with higher scores indicating greater loneliness.
Mental Health
Mental health as indicated by psychological distress, specifically depressive symptoms, was measured using the eight-item PROMIS Emotional Distress Depression Short Form Scale (PROMIS Health Organization, 2013), while symptoms of anxiety were assessed using the eight-item PROMIS Emotional Distress Anxiety Short Form Scale (Pilkonis et al., 2011). Items included “In the past seven days, I felt worthless” for the measure of depressive symptoms and “In the past seven days, I felt nervous” for the measure of anxiety. Both scales were assessed using a five-point Likert scale (1 = Never, 5 = Always), with higher scores indicating more psychological distress.
Physical Health
Physical health was evaluated using the nine-item Brief Health Inventory (Derogatis & Spencer, 1982), which captures common symptoms such as headaches and other physical ailments felt in the past week. Items were assessed using a five-point Likert scale (1 = Never, 5 = Always) and were reverse-coded. Higher scores indicate fewer physical health symptoms, or better physical health.
Acculturation Orientation
Acculturation orientation was measured using the Vancouver Index of Acculturation (VIA; Ryder et al., 2000), an 18-item scale that assesses individuals’ engagement with both their heritage culture and the mainstream American culture. The VIA assesses heritage and host culture orientations independently, thus yielding two independent continuous and reflecting the bidimensional nature of acculturation orientation (Arends-Tóth & Van de Vijver, 2007; Berry, 1997; Demes & Geeraert, 2014; Ryder et al., 2000). Example items included “I often participate in my native cultural traditions” for heritage culture orientation and “I believe in mainstream American values” for host culture orientation. Participants rated each item on a seven-point Likert scale (1 = Strongly Disagree, 7 = Strongly Agree), with higher scores indicating stronger orientation towards the respective cultural domain.
Each of these measures has been validated in previous research and provides a comprehensive assessment of participants’ acculturation experiences and well-being outcomes (see Supplemental Materials, Table S2, for more detailed information on each measure. The complete survey materials 2 are available on the Open Science Framework at https://osf.io/kthn3. The study was preregistered, and the preregistration document is also accessible at the same OSF link.
Results
Bivariate correlations among all of the key variables are summarized in Table 1. Of particular relevance, we found that objective and perceived cultural distance were moderately correlated (r = .34, p < .001). Although this association may appear relatively small, it reflects the relationship between an individual-level variable and an aggregate country-level indicator, which represent different levels of analysis, and thus some divergence between the two measures is expected. This suggests some convergence between individuals’ subjective impressions and empirically derived cultural differences, while also indicating that the two constructs capture distinct aspects of cultural distance.
Means, Standard Deviations, and Correlations Among Demographic, Cultural Distance, and Outcome Variables.
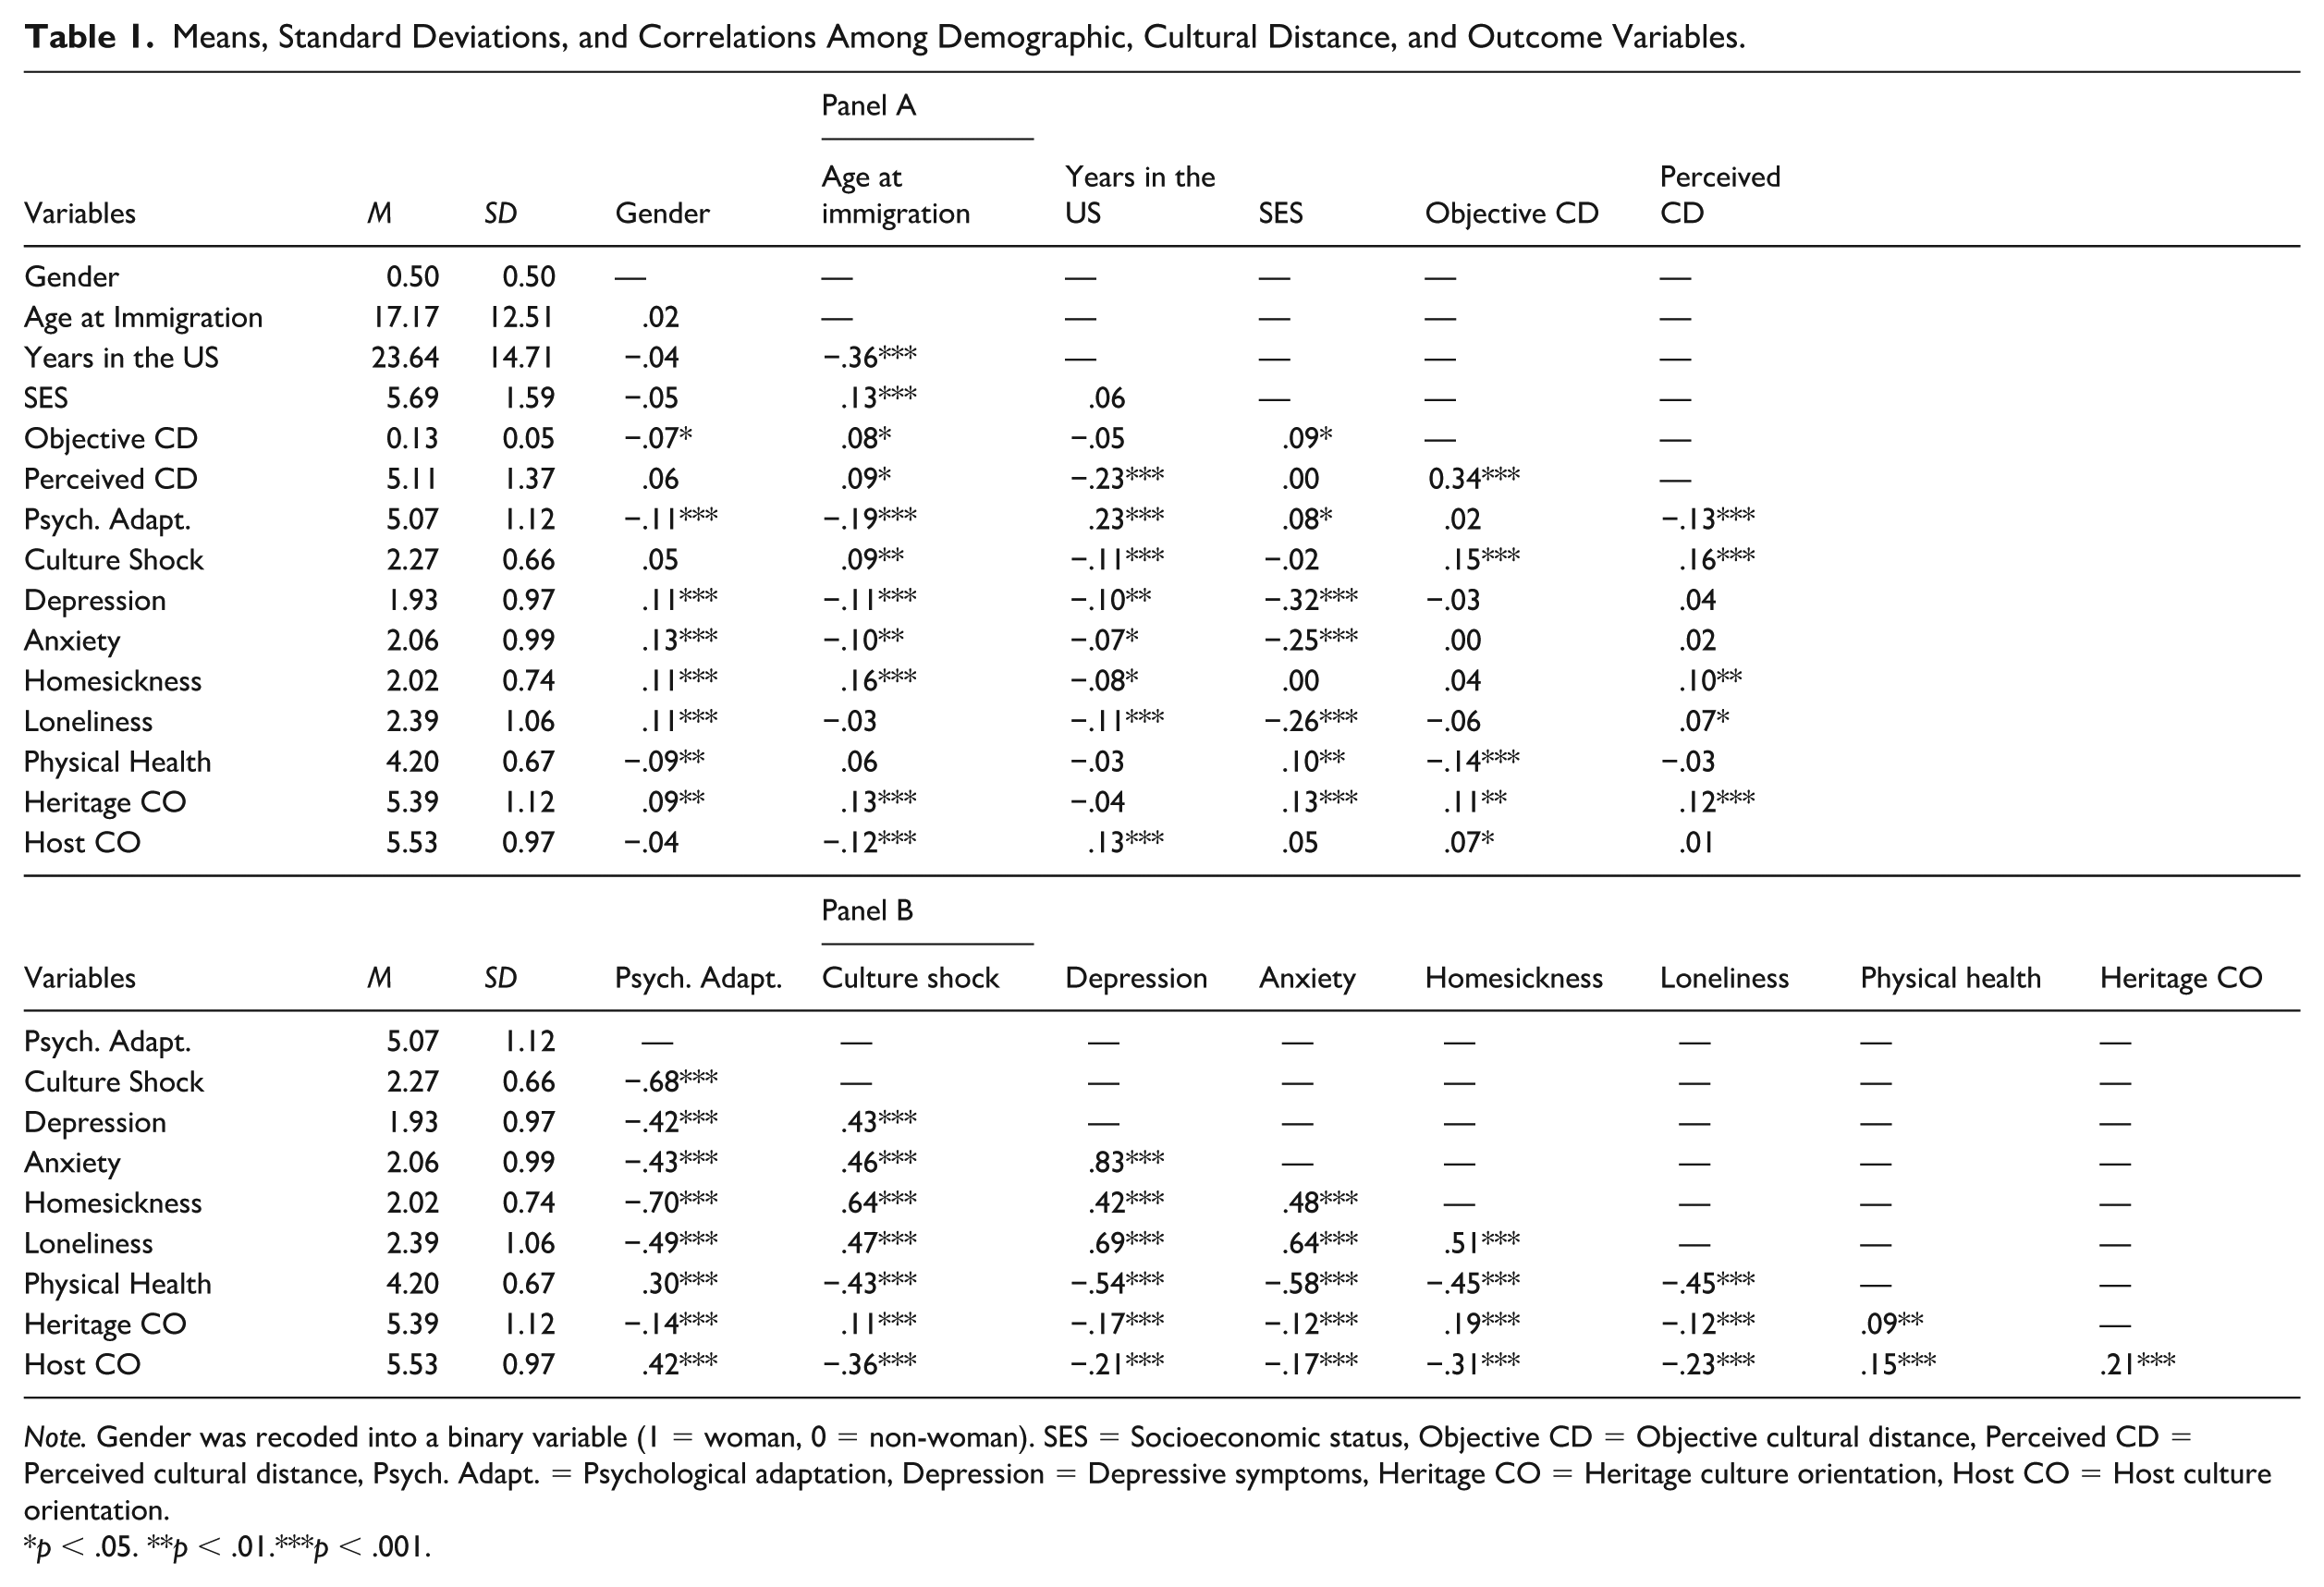
Note. Gender was recoded into a binary variable (1 = woman, 0 = non-woman). SES = Socioeconomic status, Objective CD = Objective cultural distance, Perceived CD = Perceived cultural distance, Psych. Adapt. = Psychological adaptation, Depression = Depressive symptoms, Heritage CO = Heritage culture orientation, Host CO = Host culture orientation.
*p < .05. **p < .01.***p < .001.
The bivariate results interestingly showed that both heritage and host cultural orientation were associated with fewer depressive symptoms, lower anxiety, lower loneliness, and better physical health. This pattern suggests that engagement with both cultural contexts may be overall associated with more positive adjustment-related outcomes.
Cultural Distance and Psychological Adjustment
We conducted a series of multivariate regression models using the stats package in R (R Core Team, 2025) to examine the relationships between the independent variables (objective cultural distance and perceived cultural distance) and the dependent variables (adjustment-related well-being and orientation). These analyses allowed us to examine how each form of cultural distance uniquely influenced adjustment outcomes and acculturation orientation. Each dependent variable was analyzed in a separate regression model to examine its associations with objective and perceived cultural distance while controlling for sociodemographic covariates.
Participants’ gender, socioeconomic status (SES), age of migration to the United States, and the length of stay in the United States 3 (Sam, 2024) were included in all models to account for potential confounding factors. By including these variables, we aimed to isolate the effects of cultural distance on the outcomes of interest (see (Tables 2–5)). Results from bivariate regression models without these covariates are reported in the Supplemental Materials (Tables S4.1–S4.4).
Regression Results Predicting Psychological Adjustment from Objective and Perceived Cultural Distance.
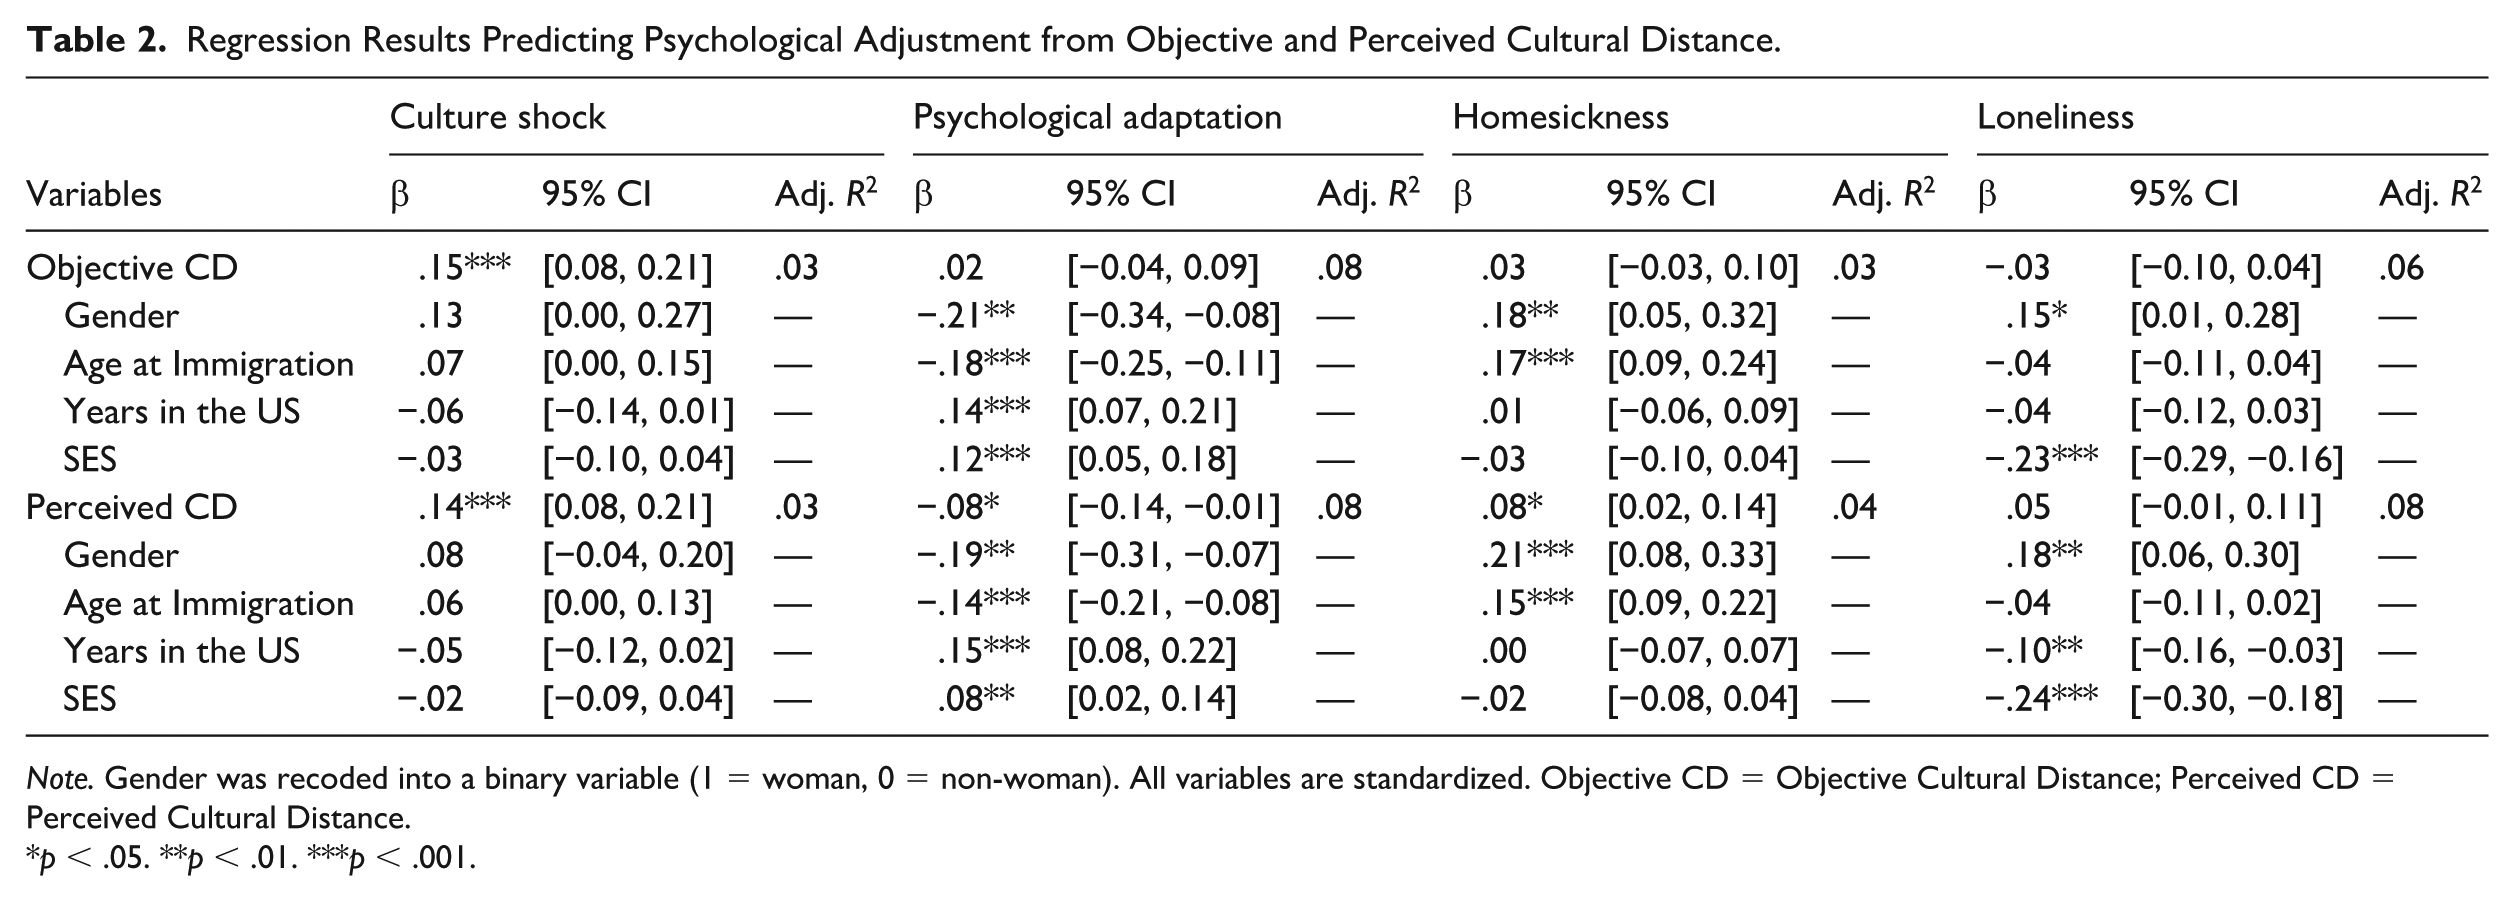
Note. Gender was recoded into a binary variable (1 = woman, 0 = non-woman). All variables are standardized. Objective CD = Objective Cultural Distance; Perceived CD = Perceived Cultural Distance.
*p < .05. **p < .01. ***p < .001.
Regression Results Predicting Mental Health from Objective and Perceived Cultural Distance.
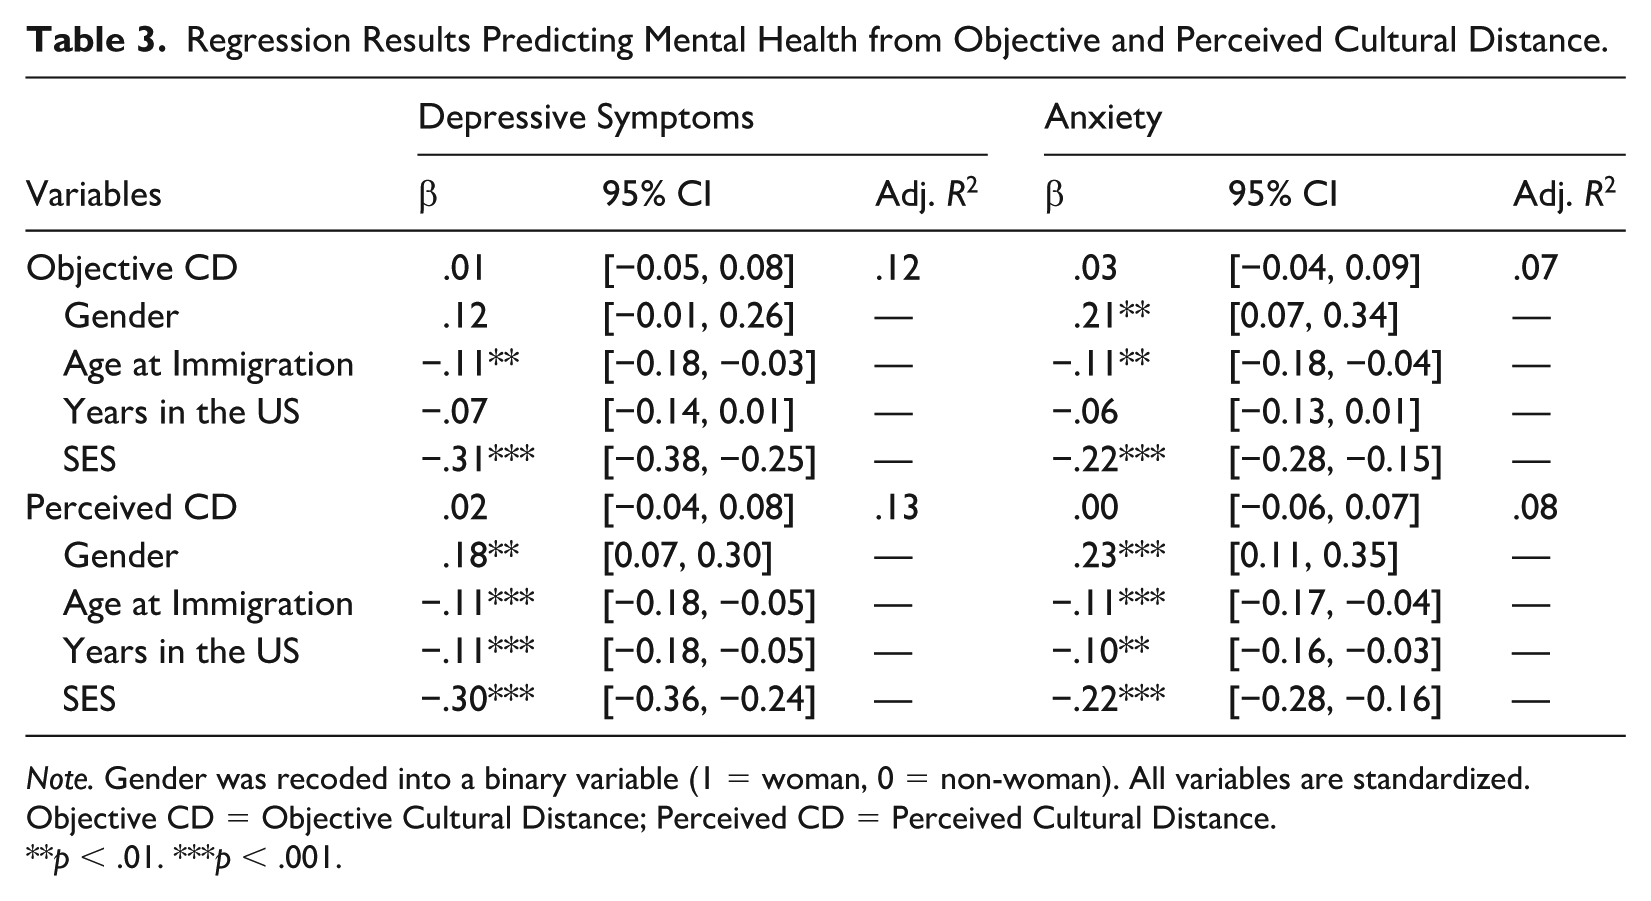
Note. Gender was recoded into a binary variable (1 = woman, 0 = non-woman). All variables are standardized. Objective CD = Objective Cultural Distance; Perceived CD = Perceived Cultural Distance.
**p < .01. ***p < .001.
Regression Results Predicting Physical Health from Objective and Perceived Cultural Distance.
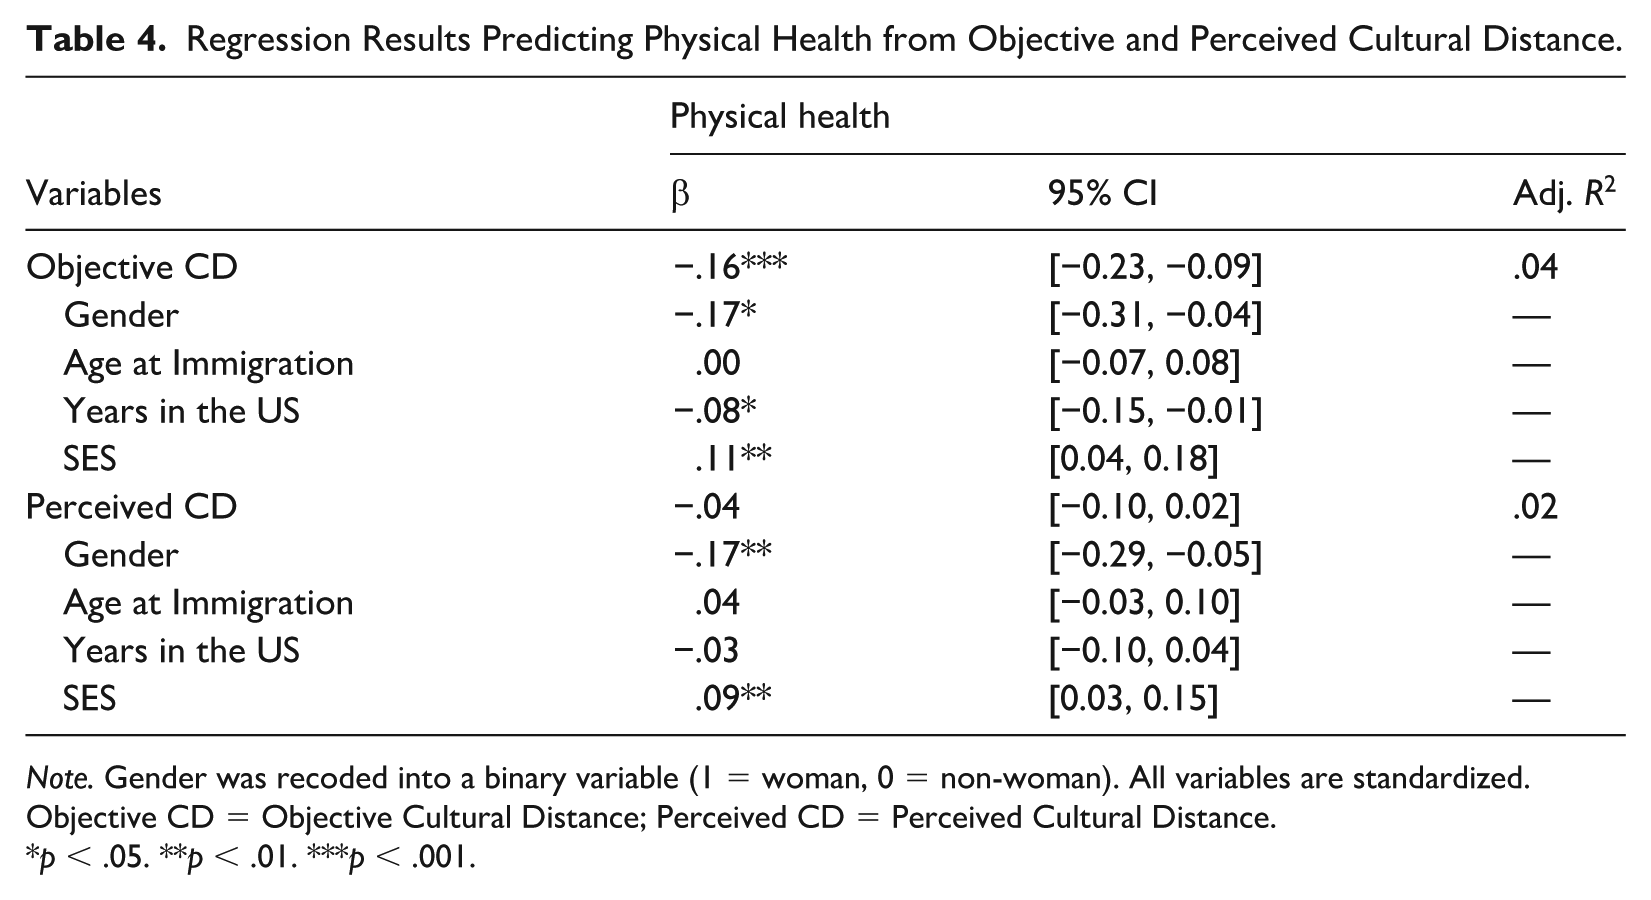
Note. Gender was recoded into a binary variable (1 = woman, 0 = non-woman). All variables are standardized. Objective CD = Objective Cultural Distance; Perceived CD = Perceived Cultural Distance.
*p < .05. **p < .01. ***p < .001.
Regression Results Predicting Acculturation Orientation from Objective and Perceived Cultural Distance.
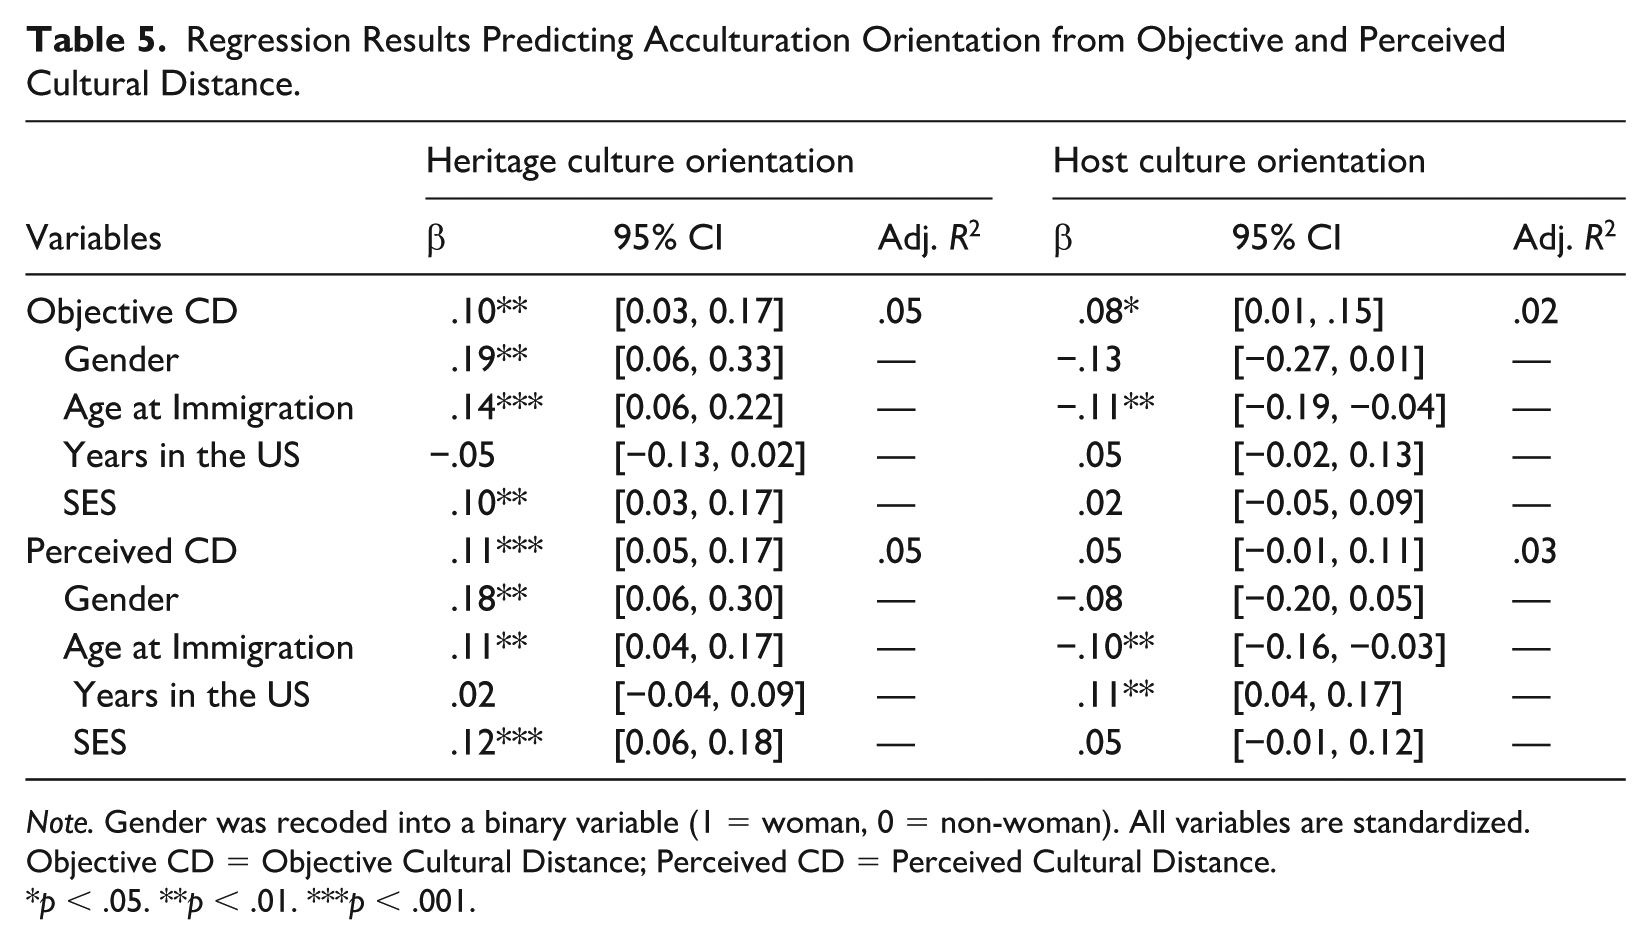
Note. Gender was recoded into a binary variable (1 = woman, 0 = non-woman). All variables are standardized. Objective CD = Objective Cultural Distance; Perceived CD = Perceived Cultural Distance.
*p < .05. **p < .01. ***p < .001.
Culture Shock
Our regression analyses revealed that both objective (β = .15, p < .001) and perceived cultural distance (β = .14, p < .001) were weakly associated with higher levels of reported culture shock. These results indicate that greater cultural dissimilarity, whether measured objectively or experienced subjectively, contributes to more difficulty adjusting to the host culture.
Psychological Adaptation, Homesickness, and Loneliness
Objective cultural distance was not significantly related to psychological adaptation (β = .02, p = .48), homesickness (β = .03, p = .32), and loneliness (β = −.03, p = .39). However, several demographic variables emerged as significant predictors across models. For example, greater SES (β = .12, p < .001) and more years spent in the host country (β = .14, p < .001) were weakly associated with better psychological adaptation, while being female predicted more homesickness (β = .18, p = .007) and loneliness (β = .15, p = .03).
Perceived cultural distance, in contrast, was significantly and weakly associated with poorer psychological adaptation (β = −.08, p = .02) and higher homesickness (β = .08, p = .01). However, it was not significantly related to loneliness (β = .05, p = .11). These findings highlight the psychological burden of perceived cultural dissimilarity, even when objective cultural differences may not show the same pattern.
Cultural Distance and Mental Health
Neither objective nor perceived cultural distance was significantly related to depressive symptoms (βs = .01 and .02, respectively) or anxiety (βs = .03 and .004, respectively). However, demographic variables were consistently predictive. For instance, in the objective cultural distance model, lower SES and having immigrated at an earlier age were associated with poorer mental health outcomes. Specifically, lower SES and earlier age at immigration predicted both more depressive symptoms (βs = −.31 and −.11, respectively) and anxiety (βs = −.22 and −.11, respectively) tendencies, whereas female gender was moderately linked to higher anxiety (β = .21, p = .002). A similar pattern emerged in the perceived cultural distance model, with lower SES, earlier age at immigration, female gender, and fewer years in the U.S. all predicting poorer mental health outcomes.
Cultural Distance and Physical Health
Objective cultural distance was negatively and weakly associated with self-reported physical health (β = −.16, p < .001), suggesting that individuals from more culturally distant countries reported worse physical health. Perceived cultural distance, however, was not significantly related to physical health (β = −.04, p = .22).
Gender, SES, and years spent in the host country also emerged as significant predictors: women (β = −.17, p = .01) and participants with lower SES (β = .11, p = .002) or longer duration in the host country (β = −.08, p = .04) tended to report worse physical health.
Cultural Distance and Acculturation Orientation
Heritage Culture Orientation
Greater objective cultural distance was significantly and weakly associated with stronger orientation toward one’s heritage culture (β = .10, p = .006), suggesting that immigrants from more culturally distant societies tended to retain stronger ties to their original culture. Perceived cultural distance showed a similar pattern (β = .11, p < .001).
In both models, gender (coded higher for women; βs = .19 and .18), earlier age of migration (βs = .14 and .11), and higher SES (βs = .10 and .12) were significant positive predictors of heritage orientation.
Host Culture Orientation
Contrary to our hypothesis, objective cultural distance was positively but weakly related to orientation toward the host culture (β = .08, p = .03). In contrast, perceived cultural distance did not significantly predict host culture orientation (β = .05, p = .12). Age of migration negatively predicted host orientation in both models (βs = −.11 and −.10), while years spent in the host country positively predicted host orientation in the perceived cultural distance model only (β = .11, p = .002).
Discussion
The present study examined how both perceived and objective cultural distance, with the latter measured using the Cultural Fixation Index (CFST; Muthukrishna et al., 2020), relate to immigrants’ acculturation orientations and well-being. Our findings revealed several noteworthy patterns. Overall, our results generally found that greater cultural distance was associated with worse adjustment outcomes, although the specific role of cultural distance on different measures of adjustment-related well-being differed depending on whether it was objectively or subjectively conceptualized.
Our findings suggest that perceived cultural distance was a robust predictor of several psychological outcomes. Specifically, greater perceived distance was associated with stronger heritage culture orientation, higher culture shock, poorer psychological adaptation, and greater homesickness. However, it was not related to host culture orientation, physical health, depressive symptoms or anxiety. These results suggest that perceived cultural distance reflects individuals’ subjective experience of cultural dissimilarity in psychologically meaningful ways, as it was more consistently associated with acculturation-related psychological outcomes such as psychological adjustment and homesickness. This aligns with previous research (e.g., Demes & Geeraert, 2014; Suanet & Van de Vijver, 2008), showing that perceptions of cultural difference are important determinants of acculturative stress and psychological well-being. This pattern likely arises because perceived distance captures individuals’ felt discrepancies and internal responses to cultural differences. This raises the possibility that measures of perceived cultural distance may themselves reflect perceived difficulties in acculturation, thereby confounding the relation between these variables.
In contrast, objective cultural distance was more predictive of physical health outcomes, although it was less predictive of measures of psychological distress, with the exception of culture shock. It was also more strongly associated with acculturation tendencies, particularly identification with both heritage and host cultures. The positive association between objective cultural distance and host culture orientation was surprising, as we assumed that people who are from more distant cultures would be less likely to adopt preferences for the host culture. To the extent that this finding is reliable, it may suggest that individuals from more culturally distant societies engage more deliberately with the host culture, as a proactive adaptation strategy among migrants facing larger cultural gaps. But this is purely speculative, and it is possible that the unexpected effect is a false positive. An advantage of the objective cultural distance measure is that it is not confounded by participants’ subjective impressions, which may color both their assessments of cultural distance and their acculturative experiences. Hence, it may provide a more direct assessment of the relation between cultural distance and acculturation-related challenges such as physical health.
Beyond their differences, the results also revealed overlap between the two measures of cultural distance. Perceived and objective cultural distance were moderately correlated (r = .34), suggesting that individuals’ subjective experiences of cultural differences partly align with cultural distances derived from population-level data. Moreover, both cultural distances were linked to increased experiences of culture shock and heritage culture orientation. The convergence of the results suggests that, despite their conceptual differences, the subjective and objective measures of cultural distance capture some shared aspects of migrants’ acculturation experiences.
Beyond cultural distance, several demographic variables were also consistently related to adjustment-related outcomes. For instance, higher socioeconomic status was associated with better adjustment overall, including better psychological adaptation and physical health, and lower loneliness, depressive symptoms, and anxiety. There were also clear gender differences, with women reporting poorer adjustment overall. More specifically, women reported poorer psychological adaptation, more homesickness and loneliness, higher depressive symptoms and anxiety, and poorer physical health. Age at immigration and time spent in the host country were also systematically related to adjustment outcomes. Consistent with prior research suggesting that people who immigrate earlier tend to acculturate more readily to the host culture, possibly because of greater developmental plasticity at younger ages (Cheung et al., 2010), our results showed that immigrating at an older age was associated with poorer psychological adaptation, greater culture shock and homesickness, stronger heritage culture orientation, and lower orientation toward the host culture, although it was also linked to fewer depressive symptoms and lower anxiety. Similarly, having spent more years in the United States was associated with better psychological adaptation, less culture shock, depression, anxiety, homesickness, and loneliness, as well as greater orientation toward the host culture. Together, these patterns highlight that demographic and life-course factors also play an important role in shaping immigrants’ acculturation experiences and well-being alongside cultural distance.
Overall, these findings support and add nuance to the common finding that greater cultural distance is associated with poorer adjustment. However, they also illustrate the importance of distinguishing between perceived and objective cultural distance. Importantly, we do not posit that one measure is inherently better than the other. Perceived distance may better capture the emotional and psychological aspects of acculturation, perhaps because the perception of cultural distance itself is shaped by people’s acculturation experiences, while objective distance is more predictive of physical health-related outcomes. These findings are also consistent with critiques of traditional acculturation research suggesting that cultural distance alone may not be a strong determinant of immigrant well-being, and that subjective experiences and contextual factors often play a more important role in shaping adjustment-related outcomes (Chirkov, 2009). It is also worth noting that the observed associations were generally small in magnitude (e.g., β < .20), which we therefore interpret as weak relationships. At the same time, small effects are relatively common in psychological research and may still be informative when studying complex processes such as acculturation (Funder & Ozer, 2019; Götz et al., 2022). Together, these two forms of cultural distance offer complementary but distinct insights into immigrants’ acculturation experience and examining both may provide a more comprehensive understanding of how immigrants adapt to a new cultural context. Future research could further explore how objective cultural distance relates to immigrants’ acculturation experiences alongside subjective perceptions and contextual factors such as socioeconomic status, migration circumstances, and time spent in the host country.
Measuring objective cultural distance using the CFST, adds a novel, empirically grounded perspective that covers a broader swath of cultural values than calculating distance with other cultural dimensions (e.g., Hofstede’s cultural dimensions). Rather than comparing countries on a small set of predefined dimensions, the CFST quantifies how different two cultures are by comparing the distribution of a large set of culturally relevant beliefs, values, and behaviors. The CFST can account for cultural variance both within and across populations, rather than focusing on mean differences, and thus allows for more accurate cross-cultural comparisons and strengthens theoretical models of cultural adaptation. Additionally, although this application was not examined in the present study, the CFST can also serve as an objective method to calculate the cultural distance between any societies, regions, or groups and is not limited cross-national comparisons. This flexibility can also help researchers in examining cultural variation more systematically across diverse populations, which makes CFST a promising tool for studying contexts beyond WEIRD populations by providing a standardized way to quantify cultural distance.
Practically, these findings highlight the importance of addressing both perceived and objective cultural distance in immigrant support services and integration policies. To improve outcomes such as psychological adjustment and homesickness, interventions may focus on reducing perceived cultural distance through strategies like fostering cross-cultural understanding and social support networks. At the same time, objective cultural gaps in values, norms, and behaviors may prove to be better addressed through immigrant orientation programs and culturally tailored health resources.
Limitations
Our conclusions are constrained by a number of limitations in our study. First, while the CFST offers a robust method for estimating objective cultural distance, the current index focuses on national-level cultural differences. We would expect that the measure would be even more sensitive at capturing cultural distance if it was applied across more granular cultural differences, such as the regional level. Future research would benefit from further exploring the use of CFST in acculturation research by examining within-country cultural variation to improve precision.
Second, as our study indicated, there are inherent trade-offs with each approach to measuring cultural distance. Perceived cultural distance captures personal experience but may be influenced by current emotional states or adaptation challenges, whereas objective cultural distance is less vulnerable to individual bias but does not account for individual variation within groups (e.g., treating everyone from a given country as the same although some individuals from the same country may fit better than others). These limitations, however, highlight the complementary nature of perceived and objective cultural distance measures.
Additionally, the sample may not fully represent the broader immigrant population in the United States. For example, recent estimates from Pew Research Center (2025) suggest that approximately 22% of immigrants in the United States were born in Mexico, whereas only 4% of the participants in the present sample were born in Mexico. These discrepancies suggest that the findings should be interpreted with caution when generalizing to the broader immigrant population, particularly groups that may be underrepresented on online research platforms.
Another limitation is that immigrants may move to the United States for a variety of reasons and under different circumstances, which can shape their acculturation experiences and adjustment outcomes. In addition, acculturation experiences may vary depending on the region of the United States that immigrants have settled into due to regional differences in demographic, cultural, and political contexts. We also acknowledge that acculturation is a multidirectional and dynamic process in which not only immigrants but also members of the host society interact in their experience of cultural change and adaptation (van der Zee & van Oudenhoven, 2022). Measures of objective cultural distance, including the CFST used in the present study, inevitably simplify complex and dynamic cultural processes, while culture is continuously negotiated across social contexts and cannot be fully captured by any single quantitative index. Objective cultural distance measures should therefore be interpreted as approximations of broad cultural differences.
Supplemental Material
sj-docx-1-jcc-10.1177_00220221261455895 – Supplemental material for Perceived versus Objective Cultural Distance: Differential Effects on Acculturation Experiences
Supplemental material, sj-docx-1-jcc-10.1177_00220221261455895 for Perceived versus Objective Cultural Distance: Differential Effects on Acculturation Experiences by Yangyilin Guo, Frankie Y. Zhong and Steven J. Heine in Journal of Cross-Cultural Psychology
Footnotes
Funding
The authors disclosed receipt of the following financial support for the research, authorship, and/or publication of this article: This research was funded by a grant from the Social Sciences and Humanities Research Council of Canada to Heine: 435-2019-0480.
Declaration of Conflicting Interests
The authors declared no potential conflicts of interest with respect to the research, authorship, and/or publication of this article.
Supplemental Material
Supplemental material for this article is available online.
Notes
References
Supplementary Material
Please find the following supplemental material available below.
For Open Access articles published under a Creative Commons License, all supplemental material carries the same license as the article it is associated with.
For non-Open Access articles published, all supplemental material carries a non-exclusive license, and permission requests for re-use of supplemental material or any part of supplemental material shall be sent directly to the copyright owner as specified in the copyright notice associated with the article.