
Abstract
Resin-modified glass ionomers (RMGI) set by at least 2 mechanisms dependent upon reactant diffusion prior to gelation. Each reaction’s kinetics and setting mechanism may rely on and/or compete with the other. In this study, we investigated RMGI setting reaction interactions using differential scanning calorimetry (DSC) by varying light-cure initiation times. A RMGI was analyzed with isothermal and dynamic temperature scan DSC with light-curing occurring immediately, or at 5 or 10 minutes after mixing as well as without light-activation. Results show that as time allowed for the acid-base reaction increased, the light-activation polymerization exotherm decreased. Conversely, analysis of DSC data suggests that earlier light-activation may limit the acid-base reaction and result in a different structured material. During early RMGI development, acid-base and light-polymerization reactions compete with and inhibit one another.
INTRODUCTION
Glass ionomers (GI), introduced in 1972 (Wilson and Kent, 1972), set via an acid-base reaction between polymers of polyacrylic acid and fluoro- aluminosilicate bases. Along with fluoride release, their main advantage is the unique ability to bond chemically to tooth structure. Disadvantages include low early strength and moisture sensitivity during setting. Resin-modified glass ionomers (RMGI) were developed in an attempt to improve mechanical properties, decrease setting time, and attenuate moisture sensitivity. Simplistically, RMGIs are a hybrid of glass ionomers and composite resin, and thus contain acid-base and polymerizable components. RMGIs are usually formulated from fluoro- aluminosilicate glasses, photo-initiators, polyacrylic acid, water, and a water- soluble methacrylate monomer, such as hydroxyethyl methacrylate (HEMA), which may or may not be grafted onto the polyacrylic acid. RMGIs release fluoride and bond chemically to tooth structure, as do conventional GI products, yet demonstrate early and increased strength (Mitra, 1991a,b; Coutinho et al., 2007).
Setting in glass ionomers is described as a series of overlapping stages (Wilson and Nicholson, 1993). Polyacrylic acid protons liberate metal ions and fluoride from the glass, forming a silica hydrogel around the glass surface. The rising aqueous phase pH causes polysalt precipitates to form from the migrating ions, which act as cross-links to the polyacrylic acid chains. Setting times approximate several minutes, although further maturation occurs over extended times (Pearson and Atkinson, 1991). Conversely, the resin reaction rate is much faster, although the complex, photo-initiated polymerization eventually results in a diffusion-controlled, polymer chain propagation as the concentration and mobility of monomer decrease amid the formation of the cross-linked matrix network (Lovell et al., 1999; Daronch et al., 2006). The final degree of conversion is dependent upon monomer mobility and diffusion (Daronch et al., 2006). Since RMGIs set by acid-base and polymerization reactions, and each mechanism depends upon reactant diffusion prior to gelation, it is plausible that the reaction kinetics and extents of each setting reaction/mechanism are influenced by each other. This investigation’s purpose was to determine, with differential scanning calorimetry (DSC), the setting reaction extent with various times at which light-activation is initiated after RMGI mixing. The hypotheses were that delay in RMGI light-activation (1) allows for greater acid-base reaction, (2) reduces resin polymerization extent, and (3) results in a RMGI of a different structure.
MATERIALS & METHODS
The RMGI material studied was Fuji II LC (GC America, Alsip, IL, USA; shade A2). The material was prepared according to the manufacturer’s instructions with a mechanical mixer (ProMix, Dentsply International, York, PA, USA) under dimmed conditions to reduce ambient light influence. Visible Light Activation (VLC) (Optilux 501; Kerr, Danbury, CT, USA) was performed for 20 sec as prescribed. Curing unit irradiance was 600 mW/cm2, as measured with a commercial radiometer (Model 100 Optilux Radiometer; Kerr).
Differential Scanning Calorimetry Analysis
Immediately after being mixed, the RMGI (112 ± 19 mg) was placed in a weighed aluminum crucible and transferred to a DSC (822e, Mettler-Toledo, Columbus, OH, USA) at 37°C, synchronized in time with mixing initiation. Four groups were investigated (n = 10/group): the first with VLC simultaneously with specimen placement on the DSC sensor, and 2 other groups with VLC occurring at 5 or 10 min after mixing. A fourth group (dark-cure) was evaluated without VLC. DSC measurements (Fig. 1A) initially consisted of isothermal condition (37°C) heat-flow evaluation for 30 min, to allow for measurement of polymerization and/or acid-base reaction exotherms. Next, forward and reverse dynamic temperature scans were conducted at 10°C/min between 37 and 240°C. Accordingly, this dynamic scan produced an endotherm that served as a relative indicator of glass-ionomer/resin material character, as reported previously (Khalil and Atkins, 1998). The final thermal segment was a 15-minute, 37°C isothermal period with VLC initiated 4 times for the determination of mean enthalpy contributed from the VLC process. This energy contribution was then subtracted from the initial VLC exotherm, yielding enthalpy from the polymerization reactions (Emami and Söderholm, 2005). DSC measurements, except during VLC, were conducted in a closed, air environment, with VLC conducted with the light guide tip approximately 1–2 mm from the test material surface. One trained operator (S.A.) conducted all DSC experiments, with a resultant final segment coefficient of variation of 5.9%. DSC data were analyzed with one-way analysis of variance (α = 0.05), followed by a Scheffé post hoc test when indicated.
Thermogravimetric Analysis/Fourier Transform Infrared Spectroscopy (TGA/FTIR) Analysis
For identification of the observed DSC thermal processes nature, TGA (Cahn TGA-131, Thermo Fisher Scientific, Inc., Waltham, MA, USA) coupled to FTIR (Mattson Research series, Thermo Fisher Scientific, Inc.) was used. This technique is useful in identifying thermal degradation products, thus providing insight into the original material structure (Wilkie, 1999). The same isothermal and dynamic temperature DSC protocol was followed. TGA/FTIR signal increase required the use of 3 RMGI capsules (~1 g), and IR spectra between 800 and 4000 cm−1 were collected from 16 scans with the spectral resolution fixed at 4 cm−1. Duplicate runs were conducted for each experimental group. Additional HEMA (Sigma-Aldrich Co., St. Louis, MO, USA) and polyacrylic acid (Cavity Conditioner; GC America, Inc.) were used as FTIR peak identification standards, introduced as liquids under the same thermal protocol as the RMGI material, allowing for FTIR spectra recording in the vapor phase.
RESULTS
VLC polymerization exotherm, acid-base reaction exotherm, and dynamic scan endotherm energies arising from the DSC analyses were calculated (Table). As the time allowed for the acid-base components to react increased, the VLC polymerization enthalpy exotherm significantly (p < 0.05) decreased. This was exhibited further with superimposition of VLC exotherms for typical immediate, 5-minute, and 10-minute delay group specimens (Fig. 1B). At the scale used (Fig. 1B), the acid-base reaction exotherm peak was slightly perceptible around the 3- to 4-minute mark for the delayed groups. An acid-base reaction exotherm for a dark-cure specimen was superimposed with the heat-flow curve of an immediate group specimen (Fig. 1C). The dark-cure specimen’s acid-base exotherm peak occurred 4.2 ± 0.3 min after mixing, with no similar acid-base reaction exotherm detected in the immediately cured specimens. The exotherm generated during the VLC process may accelerate the acid-base reaction, shifting it to earlier times, or the polymerization exotherm scale may obscure the acid-base reaction in the immediately cured specimens. However, a separate isothermal (47°C—the mean maximum temperature measured during the immediate photoactivation samples) analysis of dark-cure specimens (n = 3) revealed that the acid-base reaction shifted to approximately 2 min and should have been detectable, if present to even a fraction of the extent (Fig. 1C). Presumably, some acid-base reaction occurred, but was considerably reduced to below the DSC detection limit. With acid-base reaction enthalpy, no significant differences (p > 0.05) were observed, although a trend was observed with increased mean enthalpy with longer light-cure delay and dark cure. For the VLC polymerization, a linear relationship (R2 = 0.99) was observed between the mean VLC polymerization reaction exotherm and mean light-cure initiation time (Fig. 2).
Analysis of dynamic DSC data revealed a significant (p < 0.05) increase in decomposition endotherm enthalpy as the time allowed for the acid-base components to react increased (Table). Interestingly, the endotherm peak temperature was significantly greater (p < 0.05) for the immediate group compared with the other groups (Table, Fig. 1D). The % material weight losses during dynamic scans were 4.63 ± 0.87%, 4.37 ± 0.63%, 4.36 ± 0.74%, and 4.34 ± 0.55% for the dark-cure, immediately cured, 5-minute delay, and 10-minute delay groups, respectively. No significant difference (p > 0.05) was found among these percentages. VLC step analysis during the final isothermal DSC segment showed no significant difference (p > 0.05) from the first light exposure compared with both the second light exposure and the 2nd to 4th mean light exposures. This indicates that enthalpy only from VLC was recorded and was not from further HEMA polymerization, since the DSC dynamic scan volatilized residual HEMA, as shown below.
The FTIR spectra for the 4 experimental groups at 37, 100, 150, and 200°C during the TGA/FTIR dynamic scan analysis revealed multiple peaks (Fig. 3). Peaks at 1162 and 1192 cm−1 are attributed to the C-O-C asymmetric stretching of HEMA, with water evolution observed by the very broad structured peaks centered around 1600 and 3700 cm−1, obscuring the typical C=C stretch (1638 cm−1) usually used to quantify polymerization. Qualitatively, water was the most abundant decomposition product during the dynamic scan for all groups, presumed to be primarily from the developing RMGI bound fractions, although some contribution from polyacrylic acid degradation cannot be discounted, especially at higher temperatures (McNeill and Sadeghi, 1990). Of further interest is the relative HEMA increase observed in the dark-cure and delayed VLC groups, presumably from residual HEMA, since the degradation temperature of poly(HEMA) is above 200°C (Çaykara and Güuven, 1998).
DISCUSSION
The results indicate that RMGI acid-base and VLC polymerization reactions compete with and inhibit one another during early RMGI development, which has been postulated (Nicholson and Anstice, 1994a,b), but the true extent was unknown. The GI acid neutralization rate has been observed to be less in RMGIs, possibly due to glass particle silane coatings, water replacement with monomer, and/or lower polyacid levels (Young, 2002). Also, HEMA added to a GI formulation reduces the medium dielectric constant and renders polyacids more tightly coiled, hence slowing the acid-base reaction (Anstice and Nicholson, 1994). Prior to VLC, the acid neutralization process is diffusion-controlled, but after the photopolymer cross-linked network has formed, further acid-base reactant diffusion is significantly reduced (Young, 2002). Furthermore, the acid-base reaction rate has been shown to be slower in light-cured vs. dark-cured RMGIs (Eliades and Palaghias, 1993). However, exothermic enthalpy during photopolymerization could possibly increase GI component diffusion rates and accelerate the acid-base reaction, which is supported by the earlier acid-base reaction peak at 47°C as compared with 37°C. Overall, the current study showed that the VLC initiation time affected the acid-base reaction rate and extent. Conversely, the polymerization reaction was affected by the polar nature of the GI environment (Nicholson and Anstice, 1994a,b). Similarly, increasing RMGI opacity due to the progressing acid-base neutralization reaction (Wilson and Nicholson, 1993) would increase light attenuation, thereby affecting the polymerization reaction. Although polyacrylic acid addition reportedly increases pure HEMA polymerization rate and conversion (Andrzejewska et al., 2003), this fact cannot be entirely correlated to RMGIs, since pure HEMA lacks GI glass components and thus the acid-base reaction. With the RMGI in this study, HEMA conversion decreased with VLC delay, as evidenced by the polymerization exotherm energy decrease, which is directly related to percent conversion (Andrzejewska et al., 2003). Moreover, a curing efficiency decrease with some RMGIs was noted with FTIR when VLC was delayed for 20 min (Kakaboura et al., 1996).
Analysis of dynamic DSC data suggests that earlier VLC initiation limits the acid-base reaction and results in a material of variable structure dependent upon the time of initiation. Accordingly, the total mean endotherm enthalpy associated with decomposition significantly increased, and the endotherm peak temperature decreased with VLC delay as compared with that of the immediate group. Furthermore, TGA/FTIR analysis revealed that the dominant decomposition product was water, since delayed or absent VLC apparently allowed the acid-base reaction to proceed to a greater extent, resulting in more bound water observed to be liberated during the dynamic DSC scan. Reported decomposition GI and methacrylate endotherms are approximately 170 and 320°C, respectively (Khalil and Atkins, 1998; Nomura et al., 2002), so it appears that the decomposition endotherm temperatures observed in this RMGI may serve as a relative indicator of acid-base or resin material character. These findings can lend credence to the observed structural differences reported with a RMGI differentially exposed to light (Jevnikar et al., 1997). Whether RMGI phase separation occurs still remains a source for further study. A linear relationship (R2 = 0.99) existed between mean VLC polymerization reaction exotherm and mean time of VLC initiation. Although delays up to 10 min prior to VLC are clinically unlikely, analysis of the data indicates that even a small VLC delay may result in materials of various structures and characteristics. The relationship predicts that if VLC is delayed for 3 min and 15 sec (manufacturer’s stated working time), the resulting photopolymerization reaction would be approximately 85% of that of a material with immediate VLC. However, it is speculative if such polymerization reduction significantly affects the material properties. As mentioned below, most RMGI material characteristic research has explored RMGIs with or without VLC. Further research on the properties of RMGIs with delayed VLC is warranted.
The increasing weight loss trend with VLC absence is consistent with the TGA/FTIR analysis, which semi-quantitatively identified increased HEMA levels evolving from the material. However, it should be noted that the weight loss difference between the dark-cure and the other groups was only around 0.2%. Thus, water was still the greatest contributor to material weight loss during the dynamic DSC scan. Nevertheless, VLC delay was associated with residual HEMA that is potentially leachable from the material. HEMA release from RMGI materials has been observed (Hamid et al., 1998), which is not surprising given that the degree of conversion in Fuji II LC is approximately 60% with immediate VLC (Kakaboura et al., 1996). Depending upon RMGI product, HEMA release is greater when only dark-cured or if VLC duration was shorter than manufacturer recommendations (Palmer et al., 1999). No known studies have addressed HEMA release with respect to VLC initiation time. Although RMGI biocompatibility still requires clarification, in vitro reports have implicated HEMA monomer in cytotoxicity studies of certain RMGI materials (Oliva et al., 1996; Geurtsen, 2000).
Limited clinically relevant data exist examining the effect of delayed VLC on the properties and characteristics of RMGIs, since most studies have evaluated RMGI materials with or without VLC. With various protocols, VLC has affected diametral tensile strength (Li et al., 1995), water uptake (Jevnikar et al., 1997), wear rates (de Gee et al., 1998), fluoride release (Yoda et al., 2006), and erosion and compressive strength (Hegarty and Pearson, 1993), whereas bracket enamel bond strength was not affected (Ando et al., 2001). Although potentially deleterious, perhaps some properties, such as fluoride release, may be optimized, depending upon acid-base vs. resin-like character in the RMGI. Additionally, since RMGI tooth structure bond occurs via both micromechanical interlocking and chemical polyalkenoate-hydroxyapatite bonding (Coutinho et al., 2007), it is conceivable that a greater GI character in the RMGI may increase the chemical bonding nature, thereby increasing the bond’s durability (De Munck et al., 2004). This, though, remains highly speculative.
This research evaluated RMGI setting characteristics during the first hour. Although the acid-base reaction in RMGIs continues for longer time periods (Wan et al., 1999; Young et al., 2004), additional acid-base reactions would be expected to continue if not disturbed. However, given the apparent differential matrix development, the final acid-base reaction extent may vary, depending upon the time chosen for photopolymerization of the material after mixing, since, in a similar RMGI, significant reductions in the extent of acid-base reactions have been shown with VLC 20 min after mixing (Kakaboura et al., 1996). Similar results were reported in dual-cured composite resins (Rueggeberg and Caughman, 1993). Research over extended periods is needed to ascertain long-term matrix development, to include time-delayed RMGI material polymerization interaction with dentin (Tay et al., 2004) and to include different RMGI materials.
DSC Analysis Parameters Obtained from a RMGI with Various Times at Which Light-curing Is Initiated after Mixing*
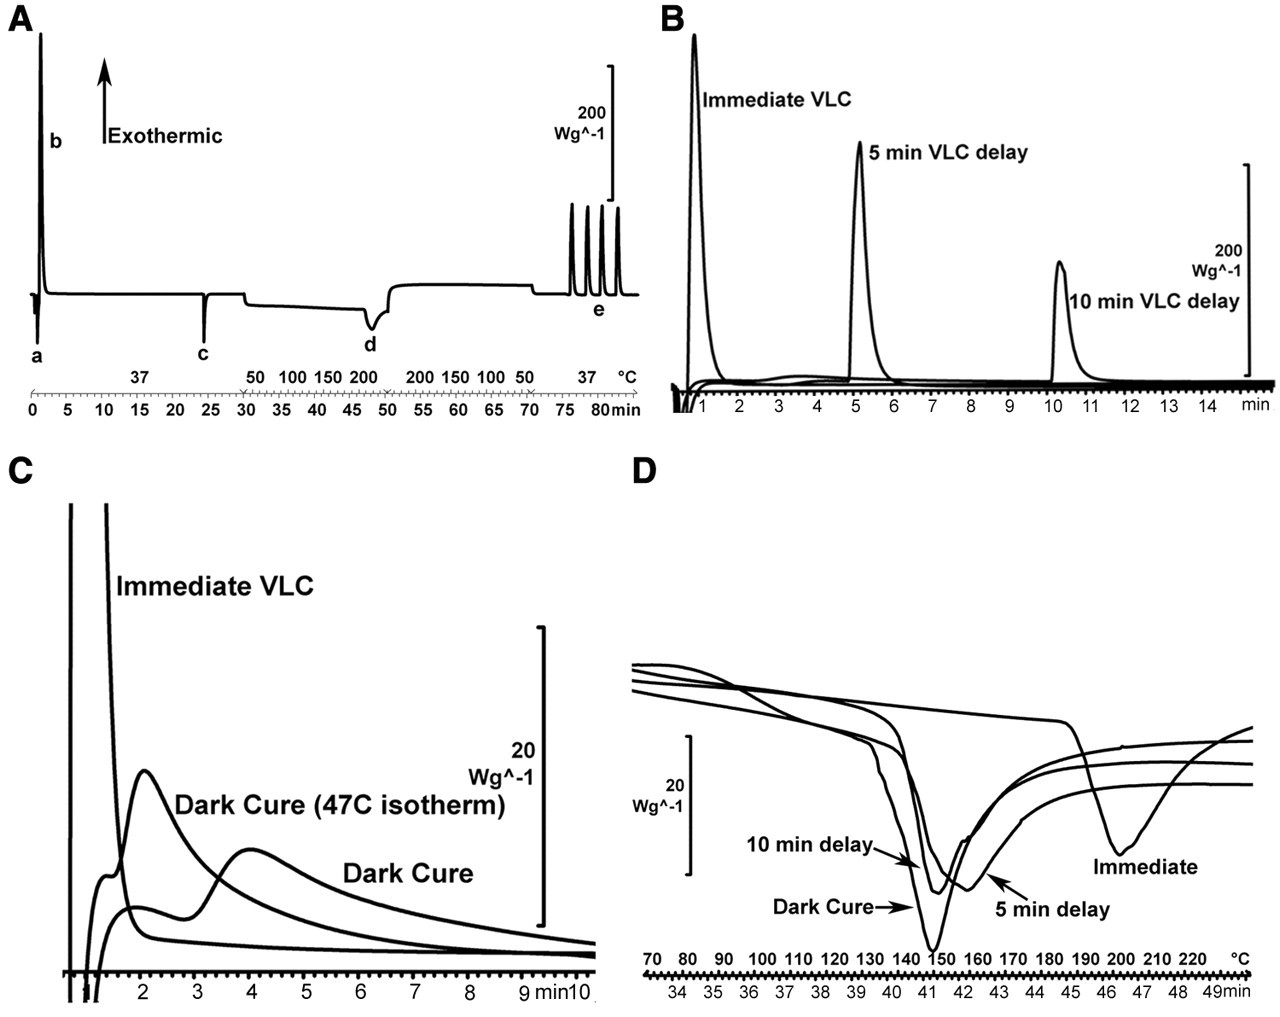
DSC thermograms of a RMGI with various times at which light-activation was initiated after mixing. (
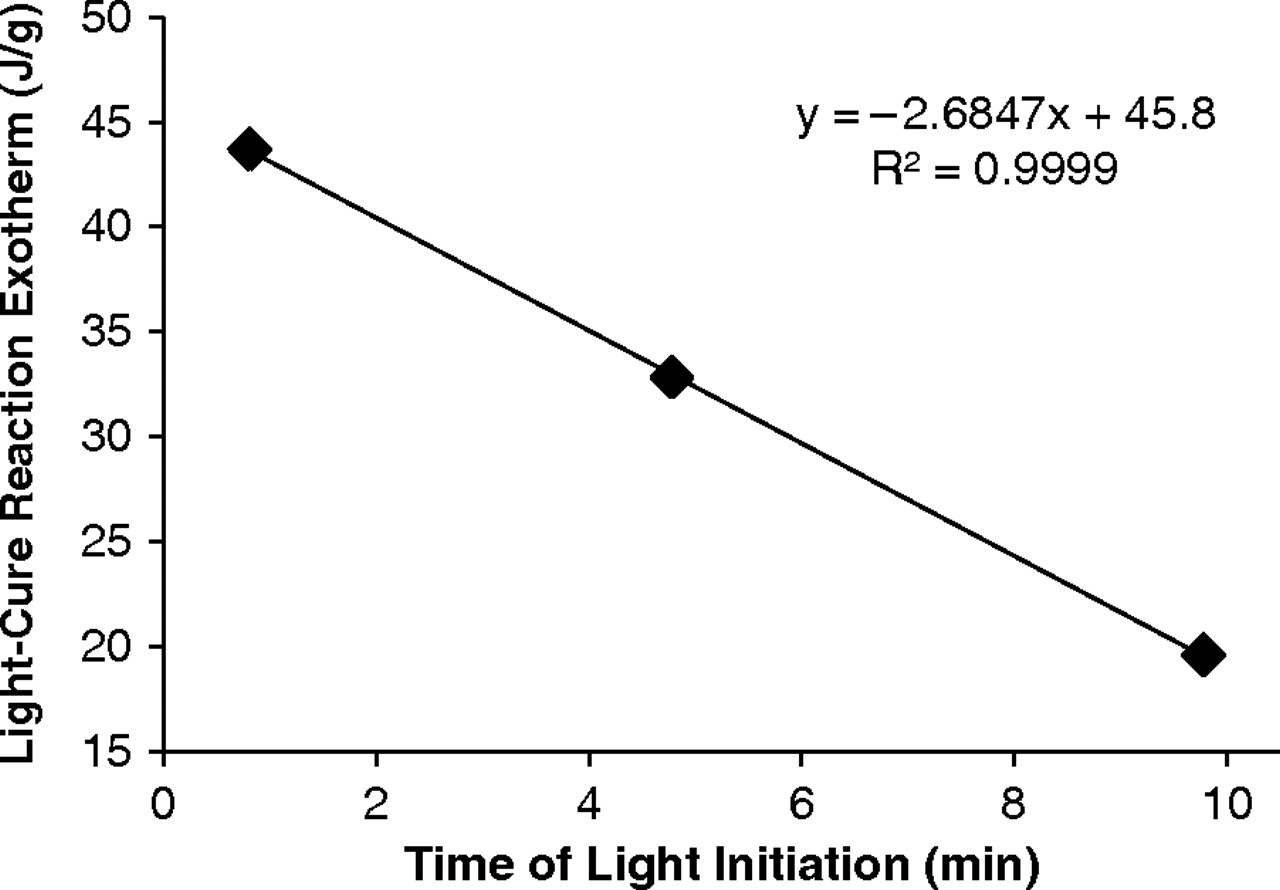
Mean light-cure reaction exotherm vs. mean time of light-cure initiation after mixing.
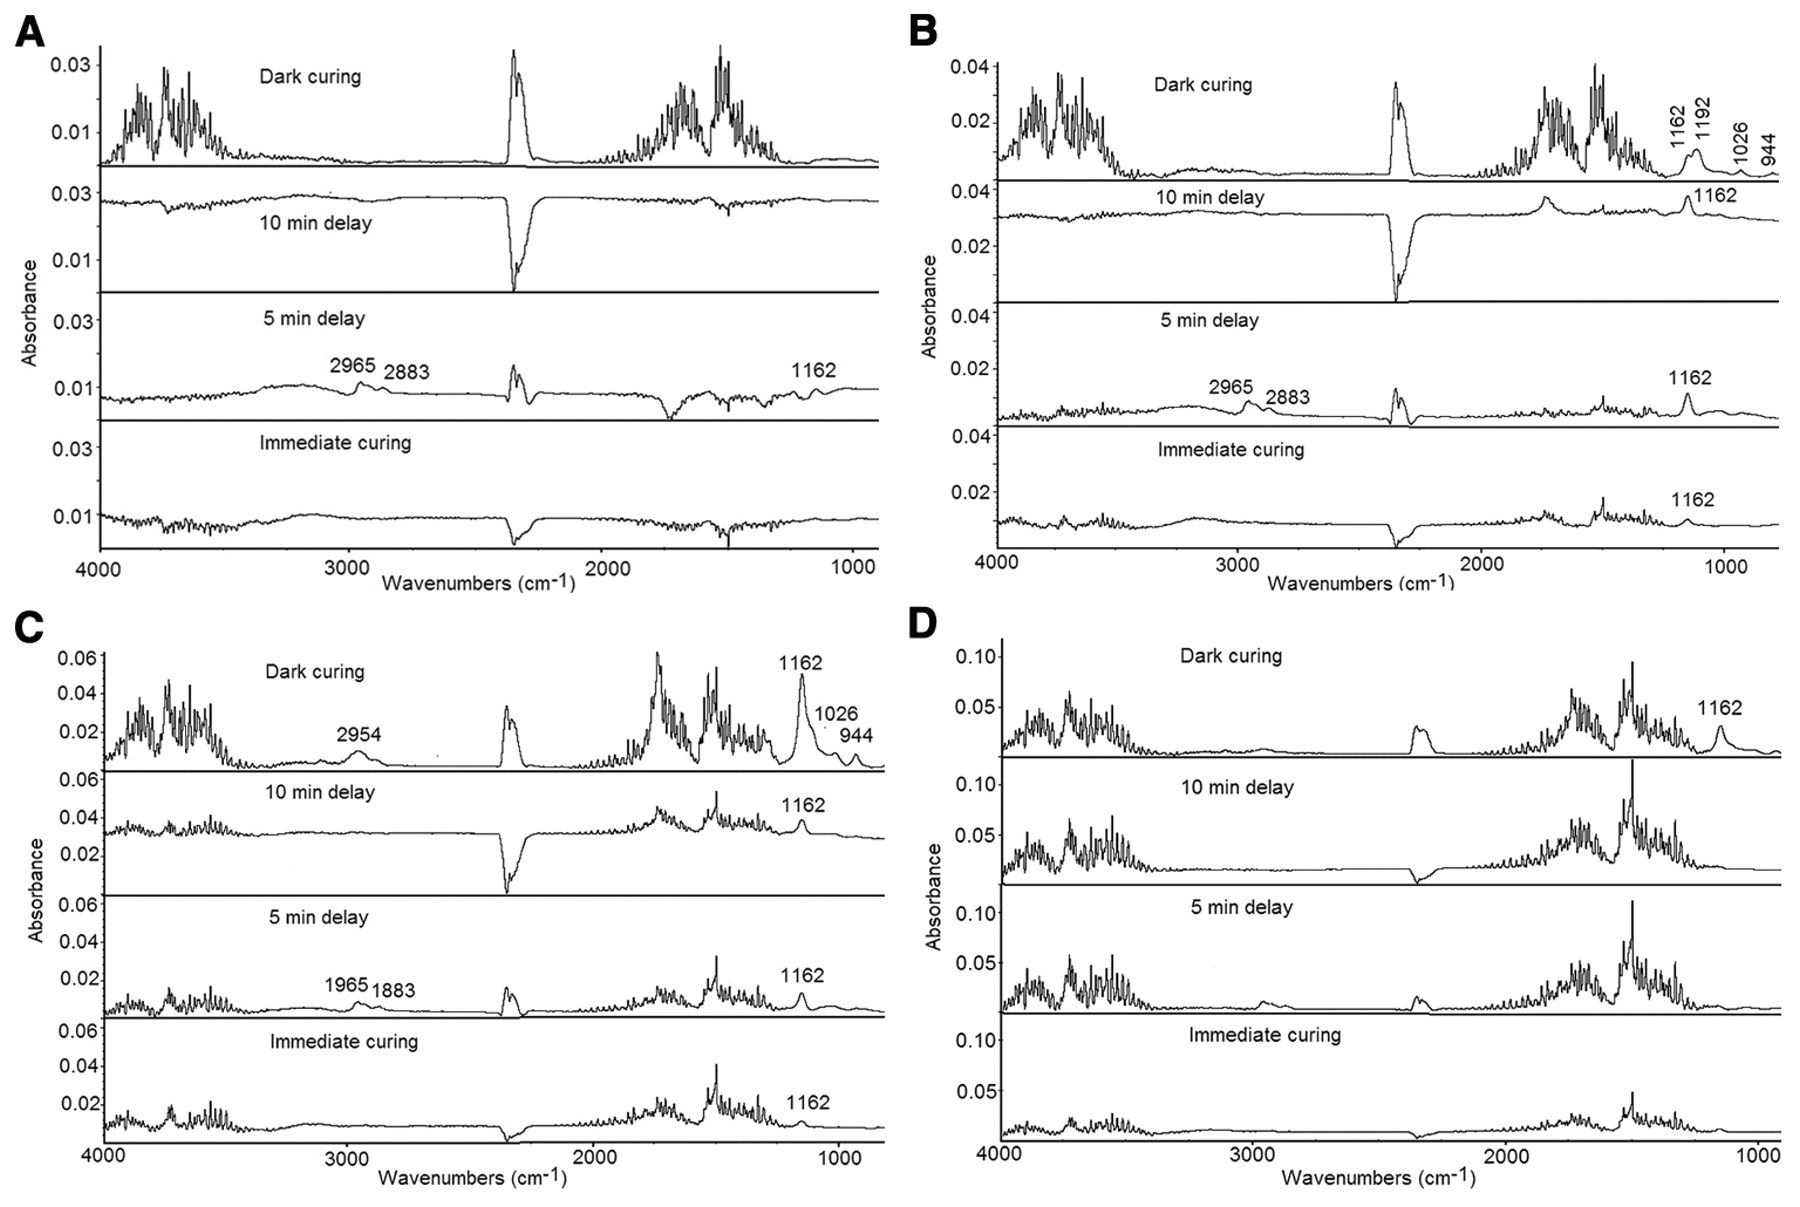
FTIR scans for the four experimental groups at
Footnotes
Acknowledgements
The authors thank GC America for providing materials. This project was supported by NIH/NIDCR R25 grant DE015282. The views expressed in this manuscript are expressly those of the authors and do not represent the opinions of the US Air Force, the Department of Defense, or the US Government.