
Abstract
This study detected tooth-composite interfacial debonding during composite restoration by means of acoustic emission (AE) analysis and investigated the effects of composite properties and adhesives on AE characteristics. The polymerization shrinkage, peak shrinkage rate, flexural modulus, and shrinkage stress of a methacrylate-based universal hybrid, a flowable, and a silorane-based composite were measured. Class I cavities on 49 extracted premolars were restored with 1 of the 3 composites and 1 of the following adhesives: 2 etch-and-rinse adhesives, 2 self-etch adhesives, and an adhesive for the silorane-based composite. AE analysis was done for 2,000 sec during light-curing. The silorane-based composite exhibited the lowest shrinkage (rate), the longest time to peak shrinkage rate, the lowest shrinkage stress, and the fewest AE events. AE events were detected immediately after the beginning of light-curing in most composite-adhesive combinations, but not until 40 sec after light-curing began for the silorane-based composite. AE events were concentrated at the initial stage of curing in self-etch adhesives compared with etch-and-rinse adhesives. Reducing the shrinkage (rate) of composites resulted in reduced shrinkage stress and less debonding, as evidenced by fewer AE events. AE is an effective technique for monitoring, in real time, the debonding kinetics at the tooth-composite interface.
Keywords
Introduction
Polymerization shrinkage accompanying the curing of dental composites remains a major concern. The polymerization shrinkage in a cavity can generate stresses within the material and the tooth structure. This stress may result in cuspal deflection, enamel microcracking, interfacial debonding, post-operative sensitivity, marginal discoloration, and secondary caries. The magnitude of the polymerization stress depends on the properties of the composite and clinical application factors, all of which can affect the degree and rate of polymerization (Braga et al., 2005; Kleverlaan and Feilzer, 2005).
Various clinical restorative techniques, such as incremental layering (Park et al., 2008), the use of low-modulus liners (Braga and Ferracane, 2004), and the control of curing-light intensity (Obici et al., 2002), have been proposed to reduce shrinkage stress. Recently, a composite containing silorane instead of methacrylate resin matrix has been introduced (Weinmann et al., 2005; Papadogiannis et al., 2009) for that purpose. However, concerns remain, and the measurement of shrinkage stress and its effect on marginal integrity continues to be studied aggressively.
The methods for measurement of polymerization shrinkage stress include the tensometer (Lee et al., 2007), photoelastic analysis (Kinomoto et al., 2000), finite element analysis (Ausiello et al., 2002), and the strain gauge method (Sakaguchi et al., 1992). The methods for assessment of the integrity of the bond between the tooth and composite include the microtensile bond strength test (Takemori et al., 1993), SEM imaging (Ciucchi et al., 1997), and dye penetration (Leevailoj et al., 2001). However, these methods are all destructive and evaluate only the outcome at the end of polymerization. Recently, non-destructive methods, such as micro-CT (De Santis et al., 2005), have been introduced. However, because of its lower resolution, this method cannot detect debonding at a submicron level. Further, none of these methods can be used to monitor debonding during composite curing in real time.
Acoustic emission (AE) is characterized by elastic waves produced when minor damage, such as microcracks and plastic deformation, is generated in a material by internal or external stress. The AE test is a non-destructive technique in which elastic waves propagate to the surface and are recorded by sensors coupled to the surface of the material (Hamstad, 1986; Lee et al., 2009). The versatile AE test has many industrial applications, such as assessing structural integrity or detecting flaws, and is used extensively as a research and quality control tool because of its high sensitivity and ability to provide real-time data at the moment fracture or damage occurs. In dentistry, it has been used to monitor the fracture of particulate and fiber-reinforced composite as well as ceramics (Kim and Okuno, 2002; Alander et al., 2004; Ereifej et al., 2008). Recently, AE was used to monitor debonding at the tooth-composite interface (Gu et al., 2009; Li et al., 2011), showing a clear relationship between the number of AE events and interfacial debonding, as well as the effects of composite properties and cavity geometry on the AE characteristics. To date, no research has reported on AE characteristics affected by different adhesives and light-curing protocols.
The objective of this study was to use the AE technique to detect interfacial debonding at the tooth-composite interface during composite curing and to investigate the effects of adhesive systems, light-curing methods, and composite properties on AE characteristics. The hypothesis to be tested was that composite-adhesive combinations that generate high contraction stress would be associated with a greater number of AE events and more evidence of interfacial failure during light-curing.
Materials & Methods
Materials
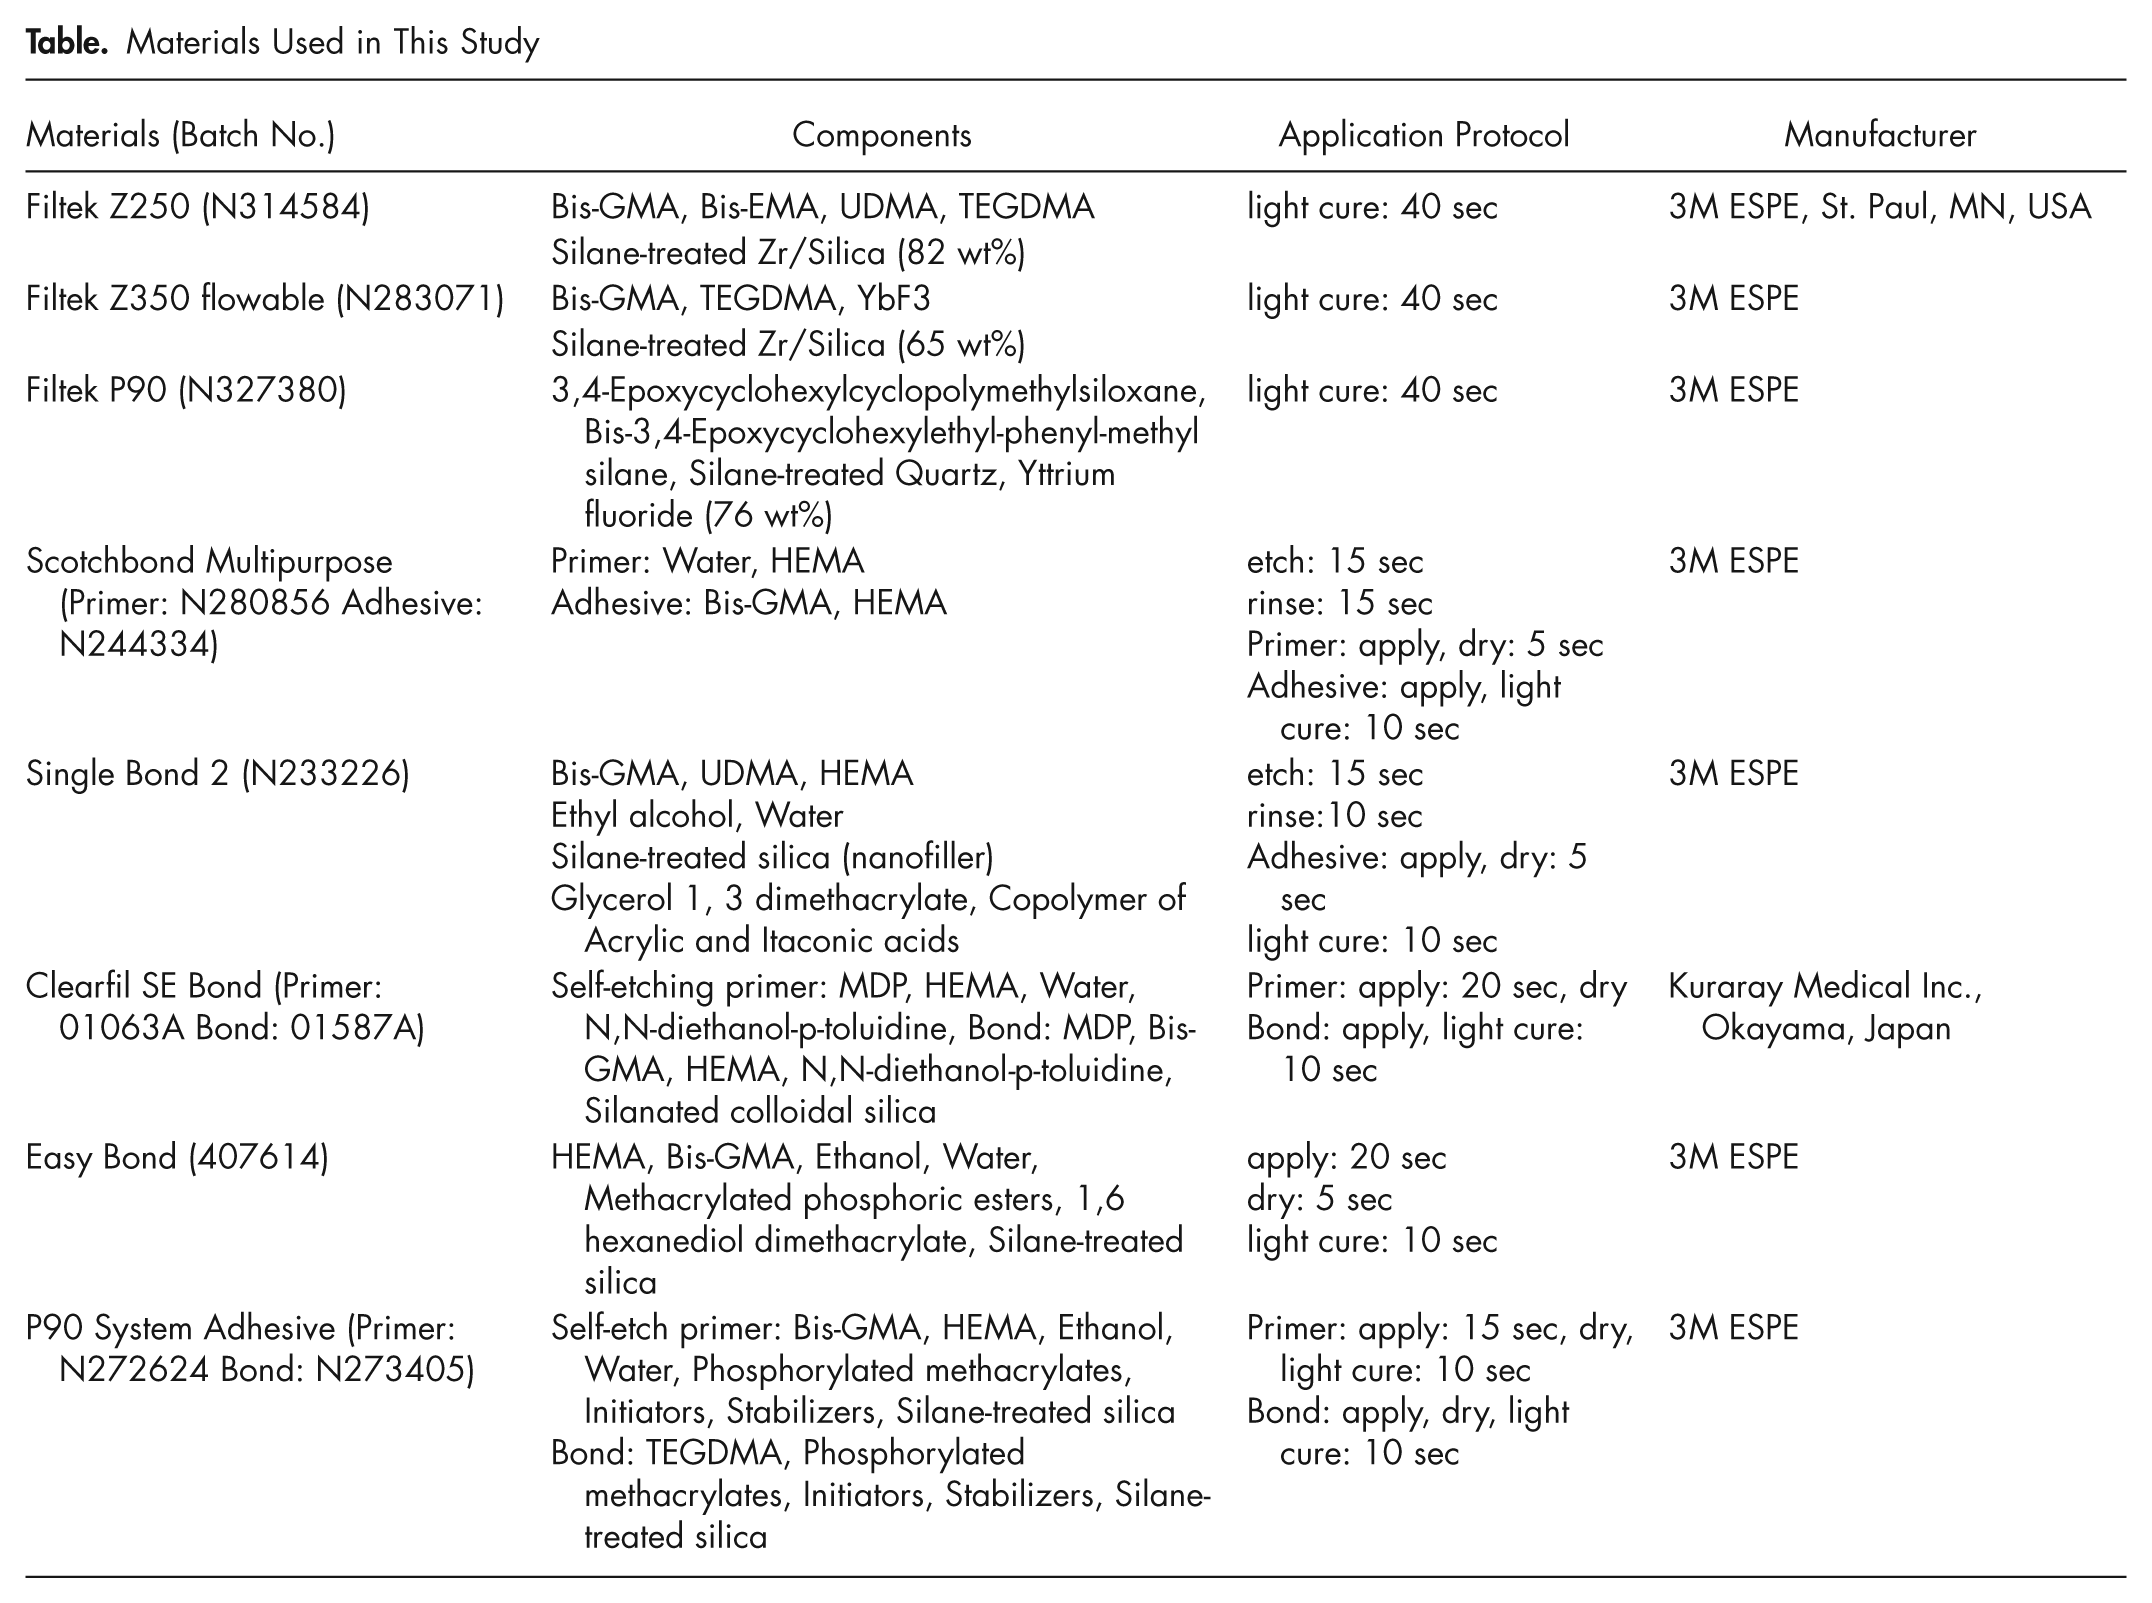
A methacrylate-based universal hybrid composite (Filtek-Z250), a flowable composite (Filtek-Z350 flowable), and a silorane-based composite (Filtek-P90) were investigated. Two etch-and-rinse adhesives (Scotchbond-Multipurpose and Single-Bond-2), 2 self-etch adhesives (Clearfil-SE-Bond and Easy-Bond), and P90-System-Adhesive were also used. The components, application protocols, and manufacturers of the materials are listed in the Table.
Materials Used in This Study
Polymerization Shrinkage of Composites
The shrinkage of the composites was measured by a technique based on Archimedes’ principle, as previously reported (Lee et al., 2005). This method allows for total shrinkage (%), shrinkage rate (% s-1), and time to peak shrinkage rate (s) to be determined (n = 5).
Flexural Modulus of Composites
Bar-type specimens (2×2×25 mm) were prepared in a stainless steel mold and light-cured in 3 overlapping sections for 40 sec each at 600 mW/cm2 (Elipar-Freelight-2, 3M ESPE, St. Paul, MN, USA) (n = 5). The flexural modulus was obtained in three-point bending on a universal testing machine (LF-plus, Ametek Inc., Largo, FL, USA) at a load rate of 0.5 mm/min (Kwon et al., 2012).
Polymerization Shrinkage Stress of Composites
We used the strain gauge method (Sakaguchi et al., 1992) to measure shrinkage stress.

(E, elastic modulus of brass; ϵ, strain; ro, outer diameter; ri, inner diameter; n = 5) (Riley et al., 1999).
Acoustic Emission (AE) Test
Specimen Preparation
Forty-nine extracted upper premolars were stored in 0.5% chloramine-T solution. The roots were horizontally resected at 5 mm below the CEJ, and class I cavities (BL-width, 3 mm; MD-length, 4 mm; Depth, 2 mm) were prepared. A 2-mm-diameter hole was made through the root in a mesio-distal direction so that the tooth could be attached to a slide glass with an elastic rubber band. Grease was applied between the tooth and the slide glass (Fig. 1). The teeth were divided into 7 groups. The adhesives were applied following manufacturer’s instructions, and composites were placed into the cavities in bulk.
Z250_SBMP
Cavities were acid-etched, rinsed, and dried. Scotchbond-Multipurpose was applied and light-cured for 10 sec. Z250 was filled and light-cured for 40 sec.
Z250_SB
Cavities were acid-etched, rinsed, and dried. Single-Bond-2 was applied and light-cured. Z250 was filled and light-cured.
Z250_CFSE
Clearfil-SE-Bond was applied and light-cured. Z250 was filled and light-cured.
Z250_EB
Easy-Bond was applied and light-cured. Z250 was filled and light-cured.
P90
P90-System-Adhesive was applied and light-cured. P90 was filled and light-cured.
Z350_SBMP
Cavities were acid-etched, rinsed, and dried. Scotchbond-Multipurpose was applied and light-cured. Z350 flowable was filled and light-cured.
Z250_Exp
Cavities were acid-etched, rinsed, and dried. Scotchbond-Multipurpose was applied and light-cured. Z250 was filled and light-cured by an “exponential mode”, in which the light intensity increased exponentially during the initial 5 sec, thereafter being cured with full intensity for 40 sec.
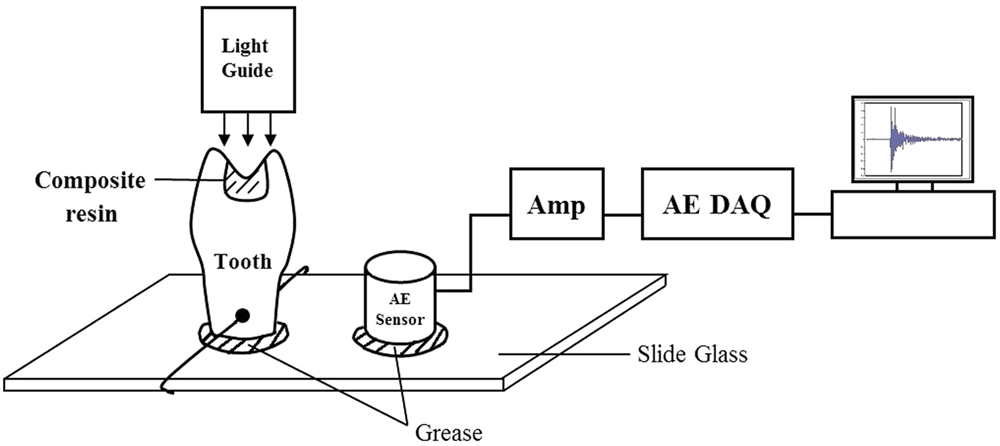
Schematic diagram of AE testing instrument. Polymerization shrinkage stress during light-curing of composite can cause debonding at the tooth-composite interface, which generates acoustic emission (AE) signals. The signals detected by the AE sensor, a piezoelectric ultrasonic transducer, are amplified and stored on a computer equipped with a data acquisition board (DAQ). The measurement parameters were: sampling rate, 2 MHz; duration, 2 ms; and threshold, 70 mV. AE signals were measured for 2,000 sec after the initiation of light-curing. AE data were analyzed with AE parameters such as event number, event time, and amplitude.
Acoustic Emission (AE) during Composite Curing
An AE sensor (M204A, Rectuson, Sungnam, Korea) was applied with grease to the glass slide holding the tooth and located 1 cm apart (Fig. 1). The AE sensor was attached to the glass, which served as a conductor of the AE signal, rather than to the tooth surface, to avoid the generation of false-positive signals that may result from the detachment of the sensor from the external surface of the tooth during the experiment. After the tooth was filled and a 20-second baseline was obtained, the specimen was light-cured for 40 sec at 600 mW/cm2 with an Elipar-Freelight-2 (3M ESPE). After being light-cured, the outer surface of the tooth was covered with wet gauze to avoid dehydration cracking.
The signals from the AE sensor were amplified (2,500 X) and stored on a computer equipped with a data acquisition board (USB-6361, National Instrument, Austin, TX, USA). AE signals were measured for 2,000 sec after the initiation of light-curing. AE data were analyzed with AE parameters such as event number, event time, and amplitude (Appendix Fig. 1).
Examination of the Tooth-Composite Interface
After the AE test, teeth were sectioned longitudinally in a bucco-lingual direction by means of a diamond saw (Isomet, Buehler, Chicago, IL, USA) to produce two 1-mm-thick specimens for each tooth. The sectioned surfaces were polished with a 1,200-grit polishing paper and acid-etched for 15 sec to remove the smear layer. Vinyl polysiloxane impressions were made of the sectioned surfaces, and epoxy replicas were made. The tooth-composite interface was examined in a SEM (S-4700, Hitachi, Tokyo, Japan).
Statistical Analysis
The data were analyzed by one-way ANOVA and Tukey’s post hoc test (α = 0.05).
Results
Polymerization Shrinkage of Composites
The shrinkage at 10 min of P90, Z250, and Z350 flowable was 1.65 ± 0.15%, 2.15 ± 0.13%, and 3.95 ± 0.06%, respectively. The peak shrinkage rate of P90 was the lowest (0.12% s-1), followed by Z250 (0.24% s-1) and Z350 flowable (0.45% s-1). The peak times were 6.01 sec for P90, 2.84 sec for Z250, and 3.37 sec for Z350 flowable.
Flexural Modulus of Composites
The flexural moduli of P90, Z250, and Z350 flowable were 7.65 ± 0.22 GPa, 9.43 ± 0.58 GPa, and 5.11 ± 0.53 GPa, respectively.
Polymerization Shrinkage Stress of Composites
The shrinkage stress of P90 (8.12 ± 0.37 MPa) was lower than that of Z250 (9.09 ± 0.27 MPa) and Z350 flowable (11.25 ± 0.35 MPa). The times to reach 1 MPa of shrinkage stress were 48.1 sec for P90, 17.1 sec for Z250, and 19.6 sec for Z350 flowable.
Acoustic Emission (AE) during Composite Curing
The mean numbers of AE events recorded were, from lowest to highest: P90 = 1.57 ± 1.51, Z250_Exp = 3.42 ± 1.99, Z250_SBMP = 3.71 ± 2.12, Z250_CFSE = 4.57 ± 2.23, Z250_SB = 4.71 ± 3.45, Z250_EB = 6.14 ± 1.86, and Z350_SBMP = 8.57 ± 4.76. The mean AE number of Z350_SBMP was greater than that of Z250_SBMP, P90, and Z250_Exp (p = 0.022, p = 0.000, p = 0.009, respectively). P90 showed significantly lower mean AE events than Z250_EB and Z350_SBMP (p = 0.022, p = 0.000) (Fig. 2A). The total cumulative number of AE events of all specimens (n = 7) in each group, from lowest to highest, was: P90 = 11, Z250_Exp = 24, Z250_SBMP = 26, Z250_CFSE = 32, Z250_SB = 33, Z250_EB = 43, and Z350_SBMP = 60.
In Z250_CFSE and Z250_EB, a high number of AE events was detected, especially within the initial 20 sec (Fig. 2B). In P90, AE events were initiated 40 sec after light exposure began, while in Z350_SBMP, a high number of AE events was detected continuously, beginning immediately after the initiation of light-curing (Appendix Fig. 2). Z250_Exp showed fewer AE events at the initial stage of curing compared with Z250_SBMP (p = 0.017).
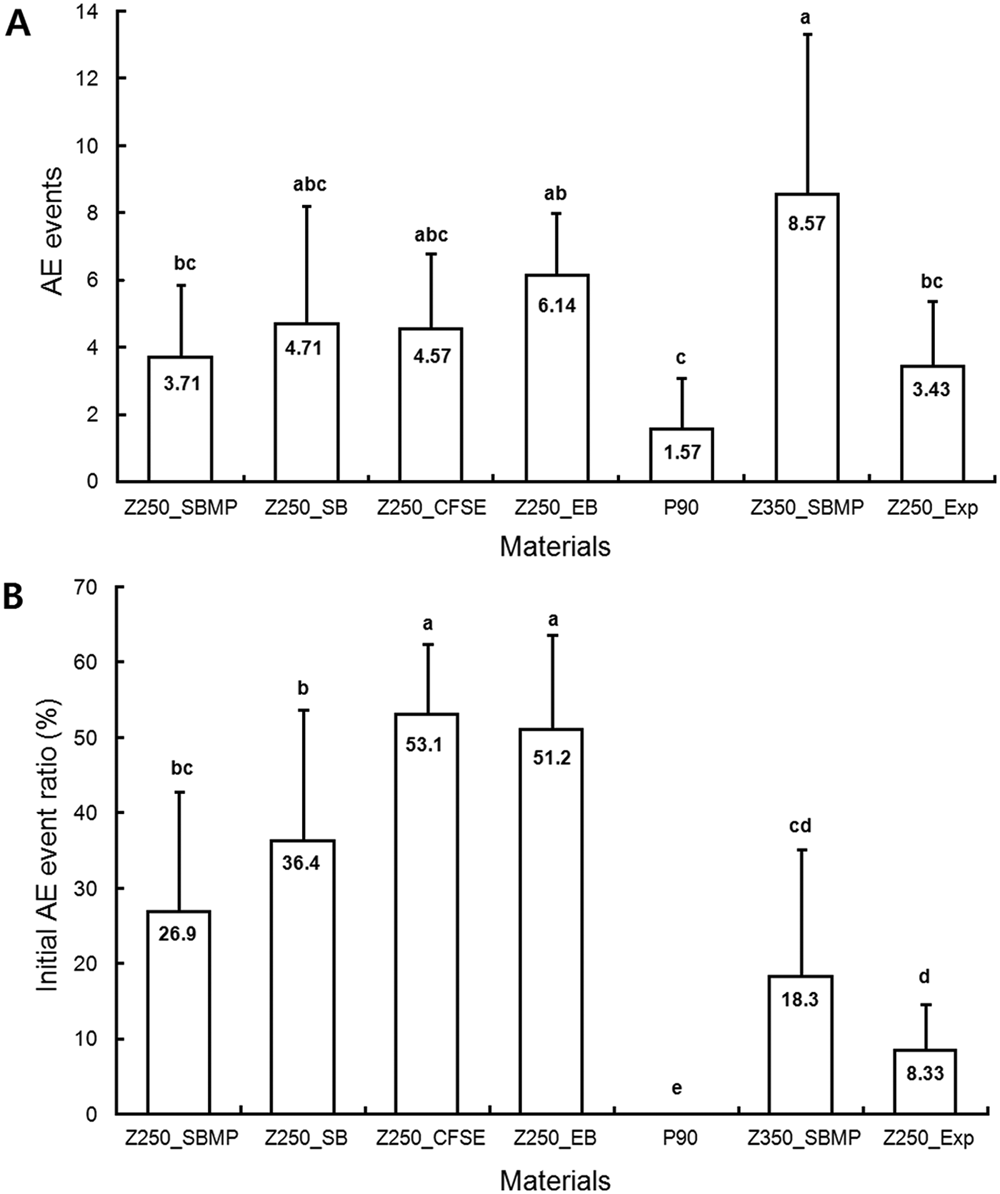
Mean AE event number and initial AE event ratio of each group.
SEM Images of the Tooth-Composite Interface
All the groups showed tight enamel-composite bonding (Fig. 3A), except Z250_EB (Fig. 3B). However, there were many gaps at the dentin-composite interface, mainly at the pulpal floor of the cavity. Z350_SBMP showed wider gaps at the dentin- composite interface compared with the other groups (Fig. 3C), while P90 showed narrower gaps (Fig. 3D).
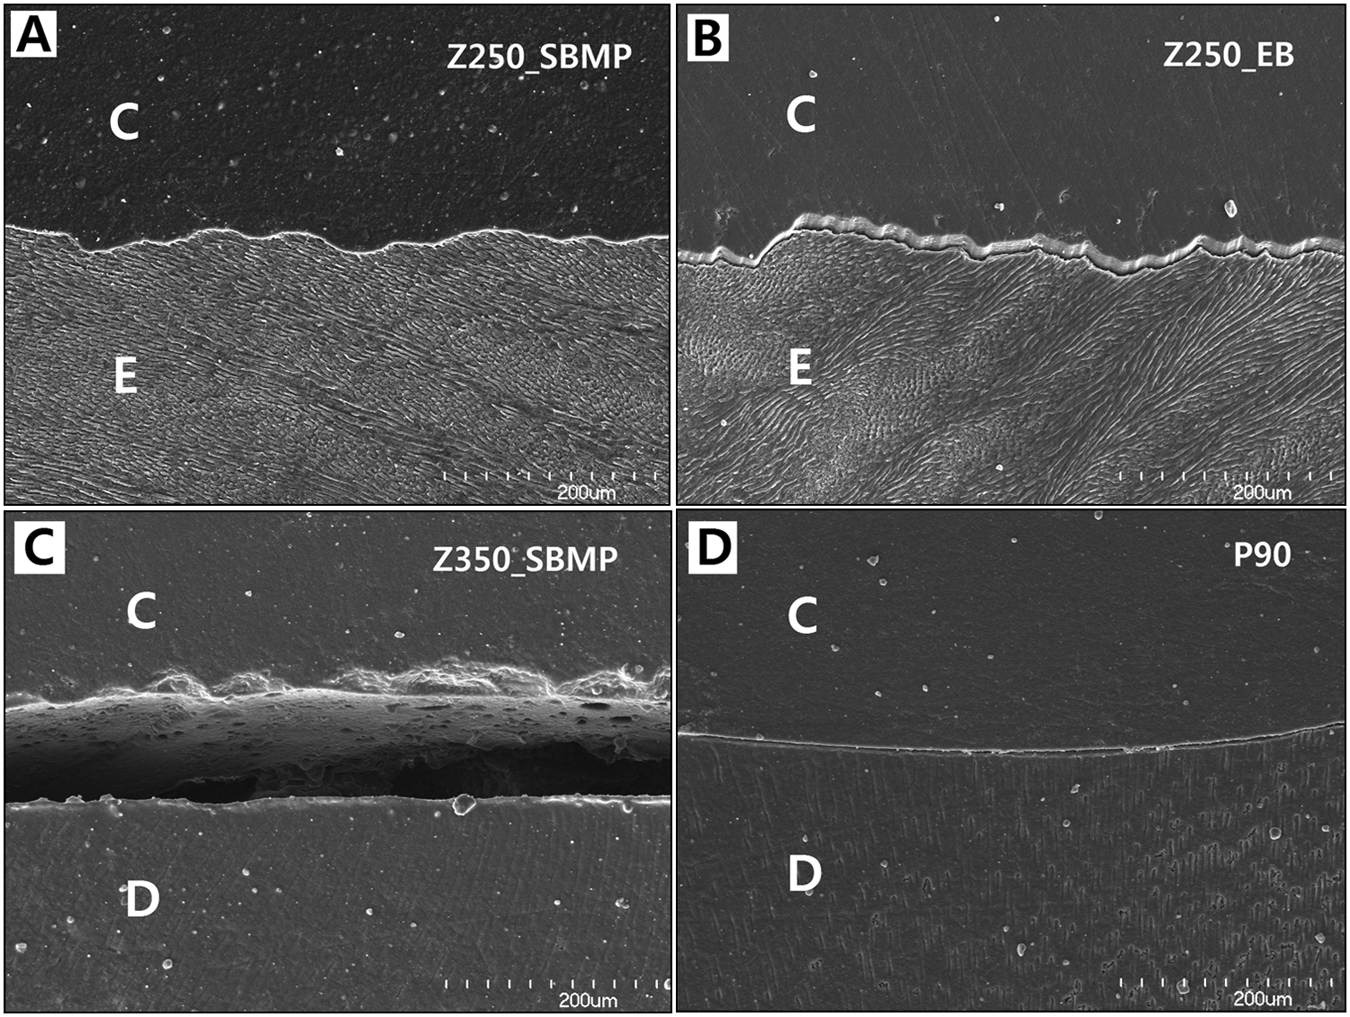
SEM images of the tooth-composite interface.
Discussion
The polymerization shrinkage stress of dental composites has been reported to range between 3.3 and 23.5 MPa (Kleverlaan and Feilzer, 2005). For successful dentin bonding, bond strength between the dental adhesive and the cavity wall should be higher than the shrinkage stress. As the composite polymerizes, the elastic modulus increases to a level that does not allow enough plastic deformation to compensate for the polymerization shrinkage (Dauvillier et al., 2000). Therefore, in areas where the shrinkage stress is higher than the bond strength, detectable acoustic waves can be generated at the very moment when interfacial debonding occurs. Preliminary studies up to 6 hrs showed that most AE events were generated within 20 min. Thus, the measurement time of this study was limited to 2,000 sec.
P90 exhibited the lowest shrinkage (rate), and the longest peak time, consistent with results of other studies (Weinmann et al., 2005; Papadogiannis et al., 2009). The reduced shrinkage and cure rate of P90 resulted in the lowest shrinkage stress of the 3 composites, despite the fact that P90 had intermediate flexure modulus. It is likely that the reduced shrinkage rate allows the growing polymer chain to relieve shrinkage stress by plastic flow.
The mean AE number for P90 was lower than that of Z250_SBMP and Z350_SBMP, and 2 P90 specimens produced no detectable AE events. This result corresponds to the SEM analysis in which P90 showed narrower gaps at the dentin-composite interface than the other groups (Fig. 3). In addition, the first AE event of P90 was generated at 40 sec after light exposure began (Appendix Fig. 2E), which coincided with the slower polymerization rate and the longest time to reach 1 MPa of shrinkage stress. In contrast, Z350 flowable, which had the most shrinkage and highest shrinkage rate, produced the highest shrinkage stress and generated the greatest number of AE events, which occurred continuously, beginning immediately after light-curing began (Appendix Fig. 2F). In conjunction with the interfacial SEM analysis showing the greatest debonding at the dentin- composite interface (Fig. 3C), the results indicate that the AE events detected in this study were induced by debonding at the tooth-composite interface generated by the polymerization shrinkage stress of the composites.
The exponential curing method, in which the light intensity is slowly increased during curing, was designed to slow the curing rate. Although no statistical difference was found in the mean numbers of AE events for Z250_SBMP and Z250_Exp, there was a difference in distribution, in that AE events were concentrated at the initial stage in Z250_SBMP, while Z250_Exp showed lower initial AE events (Fig. 2B, Appendix Figs. 2A, 2G). This provided some evidence that the reduction of initial curing rate by lowering the initial light intensity in Z250_Exp produced reduced stress at the initial stage, perhaps by enhanced flow capacity through delayed gelation (Obici et al., 2002).
The 4 adhesives in this study can be arranged in increasing order of the mean AE events as follows: Z250_SBMP, Z250_CFSE, Z250_SB, and Z250_EB. The adhesives were chosen due to differences in bond strengths as reported in previous studies (De Munck et al., 2005; Peumans et al., 2005), and though there were no significant differences in AE number, the AE pattern graphs (Appendix Fig. 2) and SEM analysis agree with previously reported bond strength results. In Z250_SBMP and Z250_SB, both involving etch-and-rinse adhesives, AE events were generated over a long time, i.e., beyond 1,200 sec., while, in Z250_CFSE and Z250_EB, involving self-etch adhesives, all AE events were generated before 500 sec, and a high number of AE events was detected within the initial 20 sec (Fig. 2B). It could be inferred that, with the etch-and-rinse adhesives, the relatively high expected bond strength resulted in good initial adhesion, followed by gradual interfacial debonding. In contrast, analysis of the AE data suggests that with the self-etch adhesives, interfacial debonding rapidly developed at the initial stages of curing, resulting in the relief of the shrinkage stress at the tooth-dentin interface after 500 sec, with few further events recorded. In addition, in Z250_CFSE and Z250_EB, strong signals with high amplitude were detected among the weak signals (Appendix Figs. 2C, 2D), indicating that severe detachments at the interface were generated. In the SEM images, when compared with other groups showing tight enamel-composite bonding, only Z250_EB showed the gap at the enamel-composite interface (Figs. 3A, 3B).
The AE method could detect debonding in real time; however, it could not identify where the debonding occurred, i.e., enamel or dentin, and in which portions of cavity walls, because the tooth-specimen size was too small for multiple sensors to be adopted. Within the limitations of this study, composites with lower shrinkage and slower polymerization reactions (which resulted in lower shrinkage stress) demonstrated fewer AE events, representative of fewer interfacial debonds, during cavity restoration. Different adhesive systems showed different AE generation patterns, with a trend toward fewer events with stronger adhesives. The AE test is an effective technique for monitoring the debonding kinetics at the tooth-composite interface during in vitro composite restoration in real time.
Footnotes
This study was supported by a grant (
The authors declare no potential conflicts of interest with respect to the authorship and/or publication of this article.
References
Supplementary Material
Please find the following supplemental material available below.
For Open Access articles published under a Creative Commons License, all supplemental material carries the same license as the article it is associated with.
For non-Open Access articles published, all supplemental material carries a non-exclusive license, and permission requests for re-use of supplemental material or any part of supplemental material shall be sent directly to the copyright owner as specified in the copyright notice associated with the article.