
Abstract
We aimed to assess the association between the roll-out of the national nursery toothbrushing program and a reduction in dental decay in five-year-old children in a Scotland-wide population study. The intervention was supervised toothbrushing in nurseries and distribution of fluoride toothpaste and toothbrushes for home use, measured as the percentage of nurseries participating in each health service administrative board area. The endpoint was mean d3mft in 99,071 five-year-old children, covering 7% to 25% of the relevant population (in various years), who participated in multiple cross-sectional dental epidemiology surveys in 1987 to 2009. The slope of the uptake in toothbrushing was correlated with the slope in the reduction of d3mft. The mean d3mft in Years -2 to 0 (relative to that in start-up Year 0) was 3.06, reducing to 2.07 in Years 10 to 12 (difference = -0.99; 95% CI -1.08, -0.90; p < 0.001). The uptake of toothbrushing correlated with the decline in d3mft (correlation = -0.64; -0.86, -0.16; p = 0.011). The result improved when one outlying Health Board was excluded (correlation = -0.90; -0.97, -0.70; p < 0.0001). An improvement in the dental health of five-year-olds was detected and is associated with the uptake of nursery toothbrushing.
Introduction
Oral health has been identified as an objective measure of child health (The Scottish Office, 1999). From the late 1980s and through the 1990s, some Health Boards in Scotland introduced local nursery toothbrushing programs, with various proportions of nurseries in each area being involved. In 2001-2002, funding became available at the national level for a standardized nursery toothbrushing program to be introduced across Scotland. Around this time, a national consultation on child oral health ended any thoughts that fluoridation of the public water supply would be introduced in Scotland (Scottish Executive, 2002), and an Action Plan for oral health improvement was developed (Scottish Executive, 2005). Subsequently, supervised toothbrushing became a main component of the Childsmile program, which developed as the national child oral health improvement program in 2006 (Scottish Executive, 2005; Macpherson et al., 2010).
In the last 30 years of the 20th century, the prevalence of dental decay across the world was reported to be almost universally declining, attributed to the introduction and widespread use of fluoride toothpaste during this period (Downer, 1998; Marthaler, 2004; Bagramian et al., 2009). United Kingdom trends in children’s dental caries had declined rapidly from the 1970s to the late 1980s (Todd and Dodd, 1985; Downer, 1998); however, by the 1990s, these improvements had begun to slow in Scotland, with children here having among the worst rates of dental decay in the UK (O’Brien, 1994) and Europe (WHO, 2012). Inequalities in dental decay were also emerging, with those from the lowest socio-economic groups bearing the greatest burden (Marthaler, 2004).
Cochrane reviews have demonstrated the effectiveness of brushing with fluoridated toothpaste for preventing caries in children (Marinho et al., 2003; Walsh et al., 2010). An earlier systematic review of school-based oral health education programs concluded that they could change behavior but had limited effect in preventing decay (Kay and Locker, 1996). These programs are also often singled out as evidence that education-based approaches can widen health inequalities (Schou and Wight, 1994; The Stationery Office, 2009). Since then, there has been some limited work assessing the effectiveness of toothbrushing programs in schools and nurseries (Curnow et al., 2002; Rong et al., 2003; Jackson et al., 2005); however, no formal evaluation of such programs has been undertaken on a country-wide scale.
Our aims were to test the hypothesis that the national nursery toothbrushing program roll-out would be associated with a reduction in caries in five-year-old children across Scotland and to assess any changes over time in the inequality in the distribution of dental caries.
Methods
Study Design
This population study involved multiple cross-sectional dental epidemiology surveys of five-year-old children in Scotland between 1987 and 2009. The intervention was daily supervised toothbrushing in nurseries and distribution, via nurseries, of fluoride toothpaste for home use, measured as the percentage of nurseries participating in the toothbrushing program at the Health Board level (see Appendix for further details). The endpoint was mean d3mft. A total of 99,071 anonymized d3mft records were analyzed (dental inspection years, 1987-2009 combined), with the numbers and proportions of the five-year-old children inspected ranging from 4,472 (7%) to 12,716 (25%).
Dental Data
We obtained d3mft data from the national dental surveys of five-year-olds [Scottish Health Boards’ Dental Epidemiological Program (1987-2000); National Dental Inspection Program (2003-2009) (SHBDEP, 2008; NDIP, 2012)]. The dental data were generated as part of the Scottish Government’s oral health monitoring system for schoolchildren, and no further ethical approval was required for the analysis. There is a choice to opt out of this program, but opt-in consent is not applicable. Each child’s home postcode was assigned a Carstairs socio-economic deprivation score – DepCat (McLoone, 2004) – with DepCat 1 being the most affluent, and DepCat 7 being the most deprived. Records of children with a missing deprivation score were excluded from analyses by deprivation category, but were included in all other analyses. Deprivation scores were not available prior to the 1993 dental inspection, and from 1993, 5.1% of records were without a DepCat score.
Nursery Toothbrushing Data
The percentages of nurseries in each Health Board participating in the toothbrushing program over time (the ‘intensity of toothbrushing’) were derived from various sources (Topping, 2002; Information Services Division, 2011) and supplemented with individual data requests from Health Boards.
‘Calendar year’ was transformed into time before or after the start of the toothbrushing intervention in each Health Board. For this to be accomplished, “Year zero” values were set for each Health Board: Year 0 was the last calendar year when none of the nurseries in the Health Board was toothbrushing. Consequently, “Year 1” was the first calendar year with some percentage of nurseries toothbrushing in the Health Board. Likewise, negative years indicated years prior to the toothbrushing intervention.
See the Appendix for more details on data.
Statistical Analysis
Mean d3mft values for Scotland and Health Boards were calculated for the years before and after the toothbrushing intervention, based on individual child-level data. Mean d3mft values were also calculated by deprivation categories (DepCat) at Scotland level. Thereafter, three-year mean values of d3mft were calculated to reduce the year-to-year variability. The years before and after intervention were grouped as follows: -10 to -9, -8 to -6, -5 to -3, -2 to 0 – reference period, 1 to 3, 4 to 6, 7 to 9, and 10 to 12. We ran t tests comparing mean d3mft for each three-year period and the mean d3mft for the reference period. This was undertaken for the overall Scottish population and for the most and least deprived sub-populations. In these analyses, the time period was shortened, since some Health Boards started their nursery toothbrushing programs very early or very late in comparison with the majority of Health Boards. We discarded the extreme positive and negative time periods for which the data were available for three or fewer Health Boards.
Next, we introduced the data on intensity of toothbrushing in nurseries (the percentage of nurseries participating in the toothbrushing program in each Health Board by year) and conducted further analysis that examined the association between toothbrushing intensity and dental decay. This is an aggregate analysis at the Health Board level and is effectively a meta-analysis. Since children attending nurseries are 3 to 4 yrs old (Care Inspectorate, 2011), and the earliest age covered by dental inspections in Scotland is 5 yrs, Health Boards mean d3mft data were lagged by −1 year. This makes the inspection and toothbrushing data more contemporaneous. Whereas the actual years when the five-year-olds’ dental inspections took place were 1987 to 2009, when lagged by −1 year they became 1986 to 2008. These lagged mean d3mft data and intensities of nursery toothbrushing were plotted against calendar year by Health Board.
For each Health Board, the available mean d3mft data were split into 2 periods: before the start of the toothbrushing intervention in nurseries, and after. In the post-intervention period, 2 sets of linear regression analyses were carried out for each Health Board. The mean d3mft of each board (as the response variable) was regressed against the appropriate time period on the x-axis. This was repeated with intensity of toothbrushing as the response variable. In this way, we produced sets of paired regression slopes for each board separately, to use as an analysis tool. We then correlated the post-intervention d3mft slopes against the toothbrushing intensity slopes using the Pearson correlation coefficient weighted by the population count of each Health Board. This correlation measures the strength of the association between the change in mean d3mft and the change in the intensity of toothbrushing over time in Health Boards.
Post-intervention d3mft slopes were plotted against toothbrushing intensity slopes, with the relevant population size of each Health Board represented by the size of the bubble (Appendix Fig. 1). The x and y axes represent estimated slopes (estimated regression coefficients or estimated beta) obtained from the fitted regression models. Appendix Fig. 1 presents the correlation of the 2 previously calculated slopes – for d3mft and toothbrushing intensity – by Health Board. All statistical analyses were carried out with SAS version 9.2 (SAS, Cary, NC, USA). This study conformed to STROBE guidelines for reporting observational studies (www.strobe-statement.org).
Results
The progress of the nursery toothbrushing program and mean d3mft indices over time are shown by Health Board in Fig. 1. Scottish Health Boards started their nursery toothbrushing programs in various years and had different patterns of program roll-out. Since the intensity of nursery toothbrushing program increases from Year 0, a reduction of mean d3mft is evident in Health Boards. Fig. 2 shows mean d3mft calculated by year pre- and post-intervention for overall Scotland data and by deprivation groups.
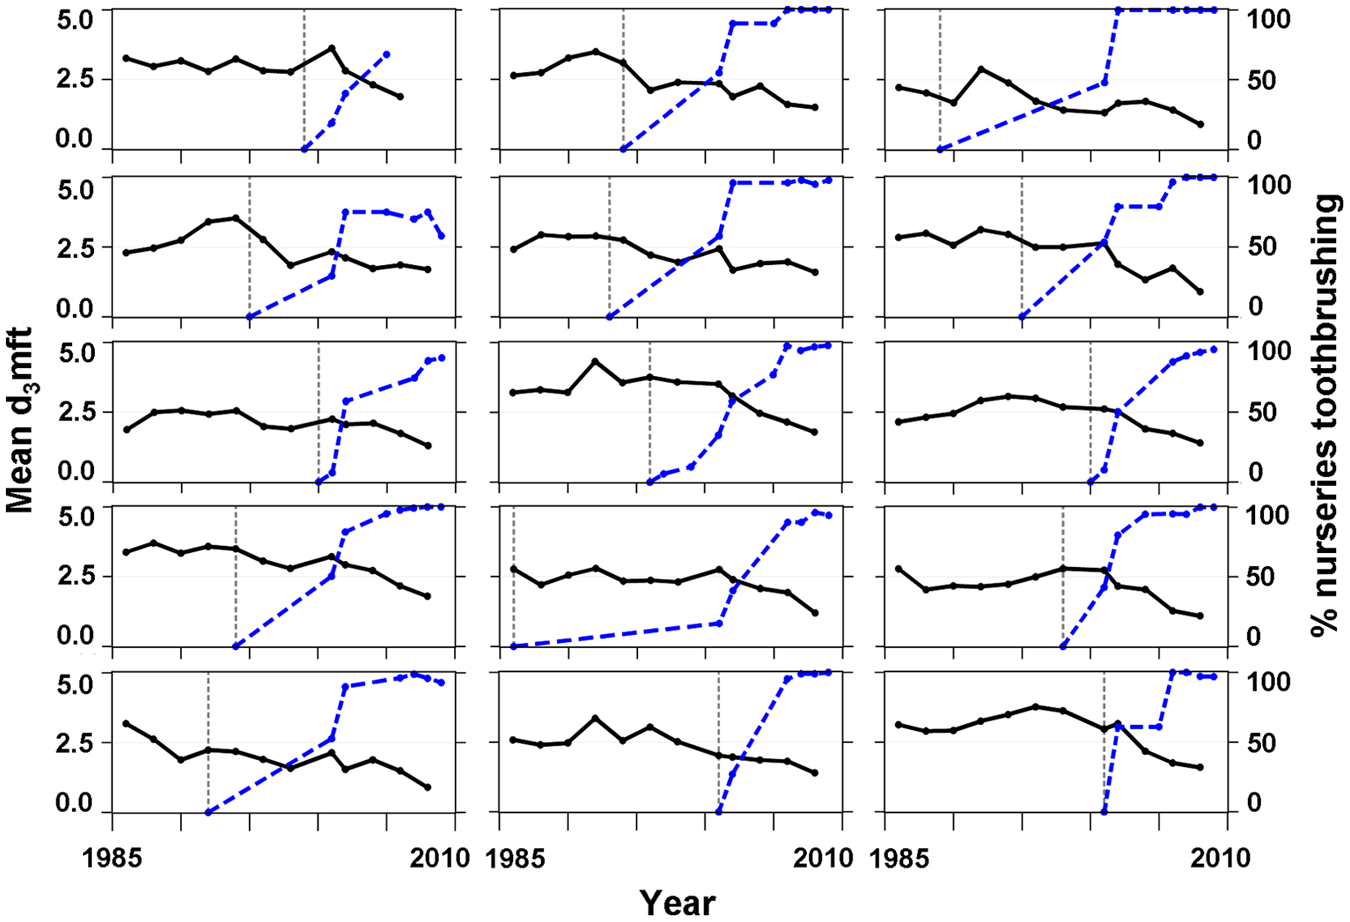
Mean d3mft and percentage of nurseries toothbrushing over time for 15 Health Boards, Scotland, 1986-2009. Mean d3mft indices are lagged by −1 year from the original dates of dental inspections. Solid line, mean d3mft; thick dotted line, percentage of nurseries participating in toothbrushing program; thin vertical dotted line, reference Year 0 (a year before the start of toothbrushing program).
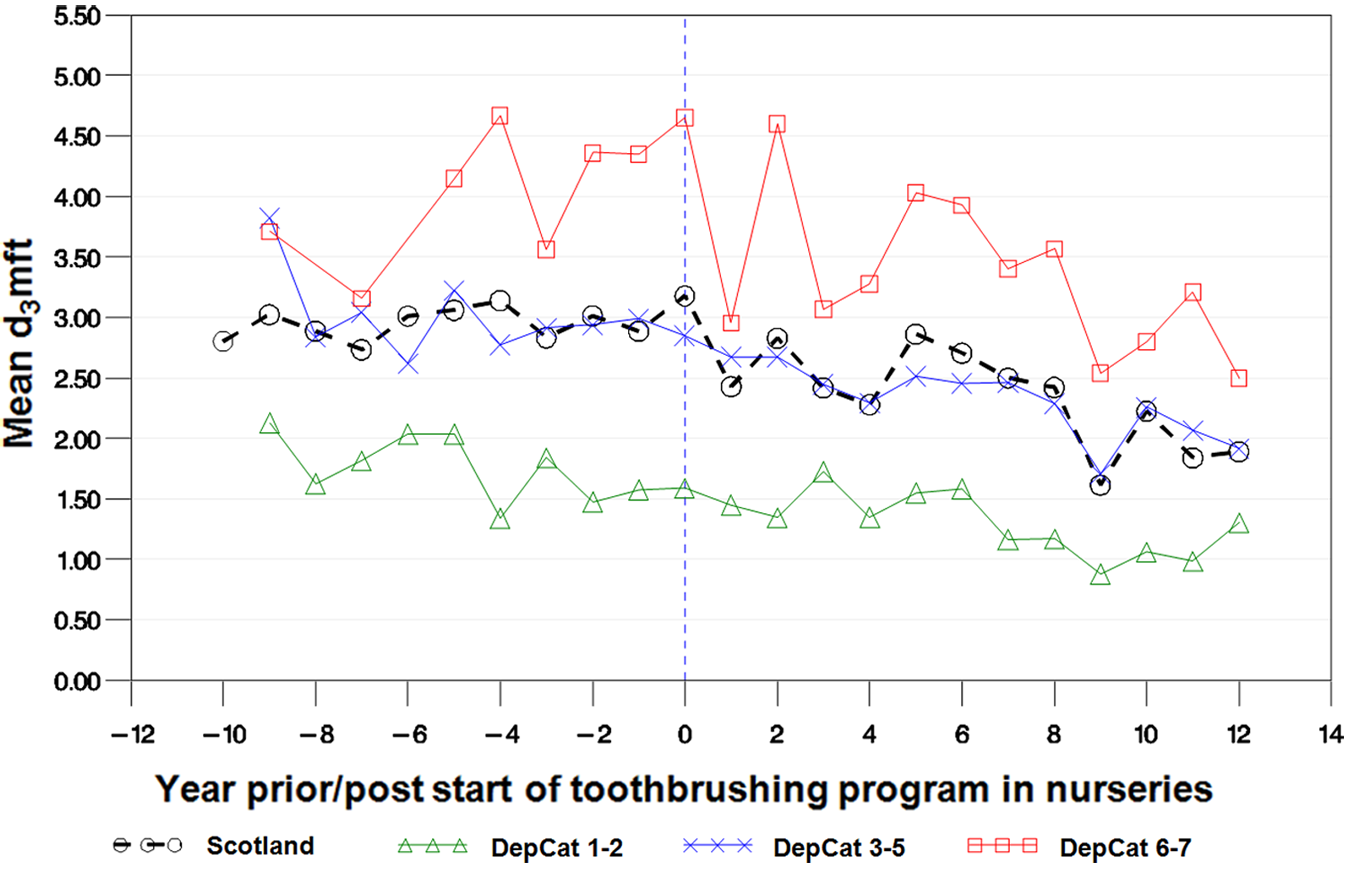
Mean d3mft by year pre/post start of nursery toothbrushing intervention, by deprivation score (DepCat, 1 = least deprived, 7 = most deprived), Scotland. Dotted vertical line is reference Year 0.
The results of the three-year means t tests for Scotland overall and for the least and most deprived areas (DepCat 1-2 and DepCat 6-7) are presented in Appendix Tables 1 and 2. The most deprived children showed a greater decrease in mean d3mft in the post-intervention periods compared with the least deprived children. In the post-intervention period DepCat 6-7, children’s mean d3mft decreased from 4.48 in the reference period (Year -2 to Year 0) to 2.77 in the period Year 10 to Year 12, whereas for DepCat 1-2 children, the decrease was less profound – from 1.52 to 1.10. For Scotland overall, i.e., the dataset combining records of children from all deprivation categories and children with the DepCat score missing, the mean d3mft index decreased from 3.06 to 2.07.
Appendix Fig. 1 presents the post-intervention d3mft slopes plotted against the toothbrushing slopes, by Health Board. The Appendix Fig. reveals a negative relationship between the post-intervention d3mft slopes and toothbrushing slopes. Pearson correlation coefficients weighted by Health Boards’ population sizes were calculated for the post-intervention mean d3mft slopes and for the proportion of nurseries’ toothbrushing slopes. Correlation coefficients were calculated with and without the outlying Health Board (NHS Tayside). The population weighted correlation coefficient for the whole dataset of 15 Health Boards was -0.64 (-0.86, -0.16), p = 0.011. After exclusion of NHS Tayside, the results improved to -0.90 (-0.97, -0.70), p < 0.0001.
Discussion
Results from the National Dental Inspection Program have shown a dramatic decline in caries in five-year-old children in Scotland in the past decade, during a time when nursery toothbrushing programs were being developed and rolled out in every Health Board across Scotland. Moreover, a corresponding reduction in absolute inequalities between dental caries rates in the most compared with the least deprived communities was observed. This is the first study to demonstrate the association between a supervised nursery toothbrushing program and a reduction in dental caries at a community- and country-wide level. This association is strengthened by the fact that prior to the commencement of the initiative, the secular trend was of increasing levels of dental decay in the five-year-old population.
Some Health Boards showed an increase in dental decay immediately after the introduction of the toothbrushing program. This can be explained by the fact that the effectiveness of the program in decreasing tooth decay in children was not immediate. We found a sharper decrease in decay levels when toothbrushing intensity reached around 50% (i.e., when half of all nursery schools in a Health Board were participating in the program).
The improvement in dental decay levels in Scotland is unlikely to have been part of a secular change. No such trend was observed for England and Wales. The explanation is also unlikely to be due to other sources of fluoride: Fluoride supplement use in Scotland is not recommended (SDCEP, 2010), and fluoride varnish programs did not commence until 2009, apart from a small pilot area (Turner et al., 2010). Moreover, despite numerous child health initiatives in Scotland over the past decade, no improvement in child health measures – such as the proportion of overweight five-year-old children and hospital admission figures (excluding dental) for zero- to five-year-olds – has occurred over the same period (Appendix Figs. 2 and 3). In contrast, the proportion of Scottish five-year-old children with obvious decay experience decreased over time. The lack of improvement in body mass index data and the recognized major challenges associated with achieving behavioral changes related to diet would suggest that increasing the provision of regular use of fluoridated toothpaste at nurseries and in the home has been the important factor associated with this health improvement.
The main limitation of this study was a lack of individual school- and child-level data relating to participation in the toothbrushing program. Nevertheless, one of the major strengths of the nursery brushing initiative is the fact that it is a national program, with uptake now reaching almost all nurseries in all Health Board areas. The development of national standards for this intervention and the regular monitoring against these standards have resulted in a consistent approach being applied across Scotland.
The overall aims of the Childsmile program are to improve child dental health and to reduce oral health inequalities. Although the toothbrushing program was a whole-population approach, one could hypothesize that this should have the most effect among the more deprived children, partly because of the high baseline dental decay levels in these children. Also, prior to the intervention, home toothbrushing was more likely to be carried out on a regular basis within more affluent families. The findings of this study support this hypothesis, since we observed a reduction in absolute inequalities, with the mean d3mft decreasing by 1.71 in the most deprived children, and by 0.43 in the least deprived children.
The association between post-intervention d3mft slopes and toothbrushing slopes is seen at the Scottish level and in 14 of the 15 Health Boards. The NHS Tayside phenomenon can be explained by the fact that there were other child oral health initiatives implemented in NHS Tayside prior to the start of the nursery toothbrushing program (Ballantyne-MacRitchie, 2000; Radford et al., 2000; Curnow et al., 2002; NHS Scotland, 2005). In addition to measuring the dental health of children over time, a health economic analysis is also required to calculate the costs associated with the nursery toothbrushing program and the potential savings associated with improving dental health. This work is currently under way.
In conclusion, a major improvement in the dental health and dental health inequalities of five-year-old children in Scotland has been seen over the past decade. This trend is likely to be due, to a large extent, to the introduction and uptake of the nursery toothbrushing program across Scotland. Child oral health has improved in the face of flat-lining trends in general child health indicators.
Footnotes
Acknowledgements
We thank NHS staff who conducted dental inspections, education staff, and the inspected children and their parents. We thank the National Childsmile Evaluation Board for their comments.
Childsmile is funded by the Scottish Government. Data collections were funded by the National Health Service (NHS).
The authors declare no potential conflicts of interest with respect to the research, authorship, and/or publication of this article.
References
Supplementary Material
Please find the following supplemental material available below.
For Open Access articles published under a Creative Commons License, all supplemental material carries the same license as the article it is associated with.
For non-Open Access articles published, all supplemental material carries a non-exclusive license, and permission requests for re-use of supplemental material or any part of supplemental material shall be sent directly to the copyright owner as specified in the copyright notice associated with the article.