






Abstract
Intraoperative detection of residual disease in oral cancer may reduce the high rate of recurrences. The aim of the present study was to evaluate the detection sensitivity of diffusion reflection (DR) measurements of bioconjugated gold nanorods (GNRs) to cancerous sites in a rat model of oral squamous cell carcinoma. We used hyperspectral spectroscopy and DR measurements of GNRs bioconjugated to slide specimens of rat tongues where squamous carcinoma was induced by 4NQO (4-nitroquinoline-N-oxide). Wistar-derived male rats were used: 6 were sacrificed at wk 32 to 37 following 4NQO administration (experimental rats), as were 2 control rats at wk 32 and 36. The detection results were compared with histopathology: 19 sites of cancerous changes were identified microscopically (11 invasive cancer and 8 carcinoma in situ [CIS]). The GNRs attached selectively to areas of carcinomatous changes with an intensity exceeding 17 intensity units at 780 nm (overall specificity, 97%; overall sensitivity, 87%) when the hyperspectral spectroscopy system was used. The resulting DR slopes of the reflected intensity showed an increase of >80% in areas of invasive cancer and an increase of >30% in the CIS sites. The resulting intensity units of the hyperspectral spectroscopy system in the invasive cancer significantly exceed those of the CIS (t test, p = .0002; Mann-Whitney, p = .0024). The results demonstrate a great potential of the direct DR scanning as a new and simple tool for detecting residual disease intraoperatively.
Introduction
Oral and oropharyngeal carcinomas are among the 10 most common cancers worldwide, with an estimated 400,000 new cases annually (Warnakulasuriya, 2009; International Agency for Research on Cancer, 2011). Despite advancement in surgical management and new treatment modalities, the prognosis did not improve much in the past decade, with five-year survival rates about 50% (Bagan and Scully, 2008; Liao et al., 2008) mainly due to locoregional recurrence, which may be the result of residual disease. The main goal of tumor resection is therefore to remove the tumor within clear margins. An intraoperative evaluation of residual disease is essential, as up to 22% of surgical margins were found to test positive (Cooper et al., 2004; Bernier et al., 2005; Nason et al., 2009). Only microscopic examination of frozen sections is a routine practice in assessing the margins of head and neck cancer resections (Ribeiro et al., 2003). However, freezing the tissue often disrupts morphology, making the interpretation difficult.
Nanoparticle-based contrast agents for molecular imaging have become a mainstay imaging tool for selectively detecting and imaging biological processes and diseases. Because of their nontoxicity to living cells (Eghtedari et al., 2008), biocompatibility, and favorable optical properties, such as an enhanced absorption cross section (El-Sayed 2001) and adjustable scattering properties (Jain et al., 2006), gold nanoparticles serve as promising agents for diagnostics and treatment of carcinoma (Copland et al., 2004; Popovtzer et al., 2008). We recently introduced a new method for cancer detection from the skin surface, based on diffusion reflection (DR) measurement of gold nanoparticles bioconjugated to anti–epidermal growth factor receptor (anti-EGFR) monoclonal antibody (Ankri et al., 2012a; Ankri et al., 2012b; Fixler and Ankri, 2013). This method presents a highly sensitive tool for noninvasive detection of abnormal tissues, such as in the head and neck.
The aim of the study was to evaluate the detection sensitivity of the DR measurements of bioconjugated gold nanoparticles to slides of tongue specimens obtained from a rat model of oral squamous cell carcinoma and to compare the results with the histopathologic findings.
Material & Methods
Carcinogen-induced Squamous Cell Carcinoma in Rat Tongue
4NQO (4-nitroquinoline-N-oxide) administered via drinking water is a well-established model of oral carcinogenesis in rats (Ohne et al., 1985; Dayan et al., 1997). Rats continuously exposed to 4NQO develop lesions on the tongue mucosa, which demonstrate microscopic changes ranging from benign hyperkeratosis to dysplasia and, eventually, squamous cell carcinoma.
The study group consisted of rats selected from a broad study on oral carcinogenesis consisting of 54 Wistar-derived male rats. The rats were 3 months old, weighing about 200 g; 5 rats were kept in each cage and fed standard pellets as was previously described (Dayan et al., 1997). The rats were randomly divided into 2 groups: experimental (45 rats) and control (9 rats). 4NQO (Fluka AG, Switzerland) was dissolved in tap water to a final concentration of 0.001%. Animals were carefully inspected daily and weighed twice a wk. Two rats from the experimental group were sacrificed with CO2 at two-week intervals; the experiment terminated at wk 37, and all the remaining animals were sacrificed. Tongues were dissected, and a longitudinal midlingual incision was made. All specimens were fixed in 10% buffered formalin and embedded in paraffin.
The protocol involving animals was approved by the Animal Committee of the Sackler Faculty of Medicine, Tel Aviv University, and conformed to procedures described in the guiding principles for the use of laboratory animals.
From each paraffin-embedded block, 5-µm sections were cut on a glass slide. Observation of hematoxylin and eosin–stained slides throughout the experimental period revealed progression from simple hyperkeratosis to varying degrees of dysplasia and, ultimately, invasive squamous cell carcinoma; foci of invasive cancer were demonstrated in all rats from wk 32 to 37 following the administration of the carcinogen. Selected for the study were 6 rats, one at each time point sacrificed at wk 32 through 37. In addition, 2 rats were selected as a control group each from wk 32 and 36. One section was prepared from each case; the unstained slides were submitted for the hyperspectral imaging and the DR experiments. Following the optical measurements, the same slides were stained with hematoxylin and eosin and evaluated histologically.
Hyperspectral Imaging System
Reflectance measurements of gold nanorods (GNRs) and tissues were captured with the hyperspectral imaging system (Nuance, CRi, Woburn, MA, USA). With this method, one can easily prove that the GNRs are presented in the tissue. A Halogen illumination (UN2-PSE100, Nikon, Japan), along with 40× objective (0.75 NA) and a 32-bit ultrasensitive charge-coupled device camera detector (N-MSI-EX), was used for imaging in RGB mode. Microscopy was performed with a Nikon 80i microscope. Images were acquired through the Nuance 2.1 software (Burlington, MA, USA), and the reflectance is presented as arbitrary intensity units (IU).
DR Measurements
A noninvasive optical technique was designed and built for DR measurements, as was previously described (Ankri et al., 2011). The setup included laser diodes with wavelengths of 650 and 780 nm as excitation sources. Irradiation was carried out with a 125-µm-diameter optic fiber to achieve a pencil-beam illumination (as described in detail in the appendix). The distance between the light source and the photodiode is ρ, and the initial distance was ~1 mm. A consecutive reflected light intensity (Γ) measurement was enabled via a micrometer plate attached to the optical fiber (see Appendix Figure).
The total scanned area was 60 × 30 mm for each slide, presenting 120 foci points. The reflected intensity, Γ(ρ), presenting units of volt per mm, was collected via a digital scope (Agilent Technologies, Mso7034a, Santa Clara, CA, USA), and data were processed with the LabView program (National Instruments, Austin, TX, USA).
GNRs: Fabrication and Targeting
GNRs were utilized as targeted contrast agents since they present the highest scattering and absorption properties compared with gold nanoshells or gold nanospheres (Jain et al., 2006). The GNRs were synthesized with the seed-mediated growth method (Nikoobakht and El-Sayed, 2003). Their size, shape, and uniformity were characterized through transmission electron microscopy. The resultant average shape was 52 × 13 nm, with narrow size distribution. The GNRs’ extinction coefficient spectrum was determined with a spectrophotometer, and the resultant extinction peak was 780 nm (Figure 1).
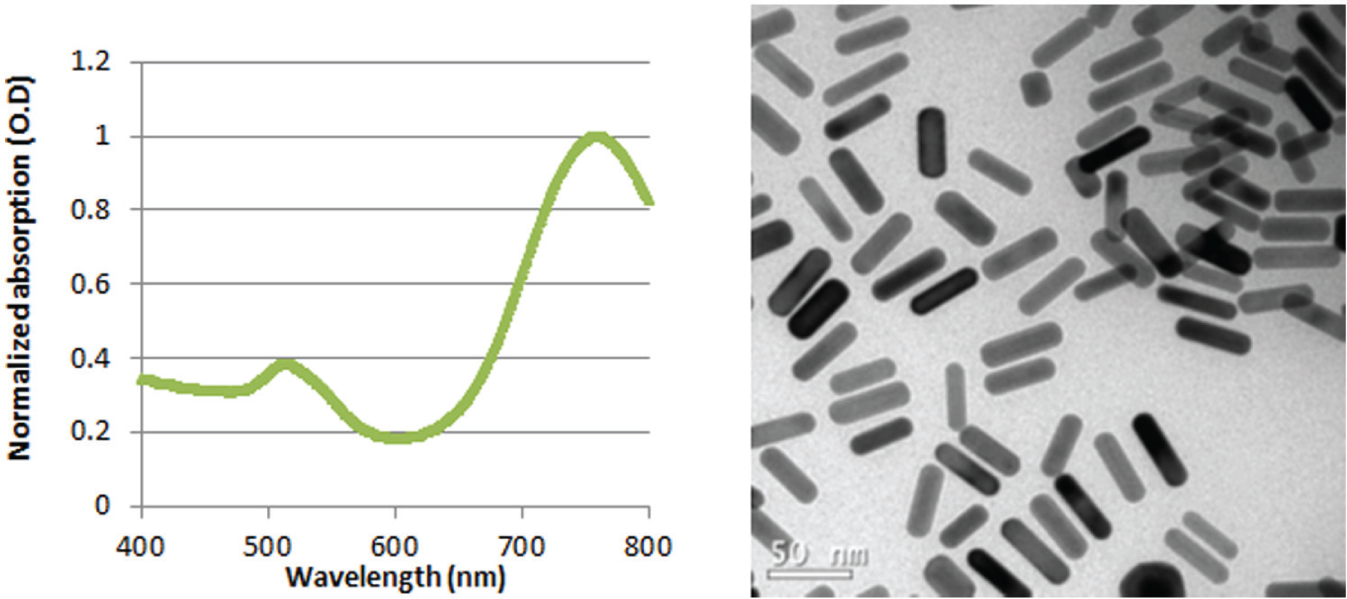
Spectrophotometeric gold nanorod properties. Left: Ultraviolet-visible absorption spectra of the gold nanorods. The absorption was normalized to the absorption value in the peak. Right: transmission electron microscopy images of the gold nanorods.
For the bioconjugation process, a protective layer of polyethylene-glycol was adsorbed on the surface of the GNRs to prevent aggregation (as described in the appendix). For cancer cell targeting, the heterofunctional polyethylene-glycol was covalently conjugated to an anti-EGFR monoclonal antibody (see appendix). Bioconjugation of the GNRs to the anti-EGFR antibody was achieved according to the method described by Lvov (Ai et al., 2002), using polystyrene sulfonate. Each slide was scanned before and after the GNRs were added for negative control.
On each unstained slide, the reflectance spectra and DR values were measured in rectangular areas of 6 × 2.5 mm (defined as a cell). The slides were viewed under hyperspectral microscopy and by the DR system, and the reflectance intensity (in IU) and slopes were measured and calculated for each cell. A grid with rectangular areas of 6 × 2.5 mm was attached to each slide, and the results of the optical measurements were recorded in an Excel file (Microsoft, Redmond, WA, USA). Then, the same slides were stained with hematoxylin and eosin, and the carcinomatous areas were drawn on the grid.
Statistics
Defining the Cut Point in IU of the Optical Measurements
Excel sheets corresponding to slides from 2 experimental rats were chosen, and the areas occupied by the cancerous changes (invasive and carcinoma in situ [CIS]) were drawn on the grid. All cells in the grid that included some parts of the drawn areas or that were adjacent to these cells were excluded. The remaining cells were considered “normal.” Maximum value (upward rounding) of the reflected intensity was defined as a cut point.
Validation of the Cut Point
The results of the IU optical measurements of slides from the 2 healthy control rats were used to define specificity. The specificity was defined as the proportion of grid cells in control slides in which the value of intensity was below the cut point. Slides from the experimental rats were analyzed for defining sensitivity. The sensitivity was defined as the proportion of cancerous areas that had at least 1 grid cell above the cut point.
Comparing Invasive Cancer and CIS
The cells in the cancerous areas were classified according to type of cancer: invasive cancer and CIS. Each area was represented by 1 value of DR, calculated as the mean values of the cells in the area that have DR above the threshold. If the maximum value in a cancer area was below the threshold, it was assigned to the area. If 2 tumors were in 1 grid cell, only 1 value of reflected intensity was used for both. The comparison of IU and DR among all 3 categories was done through 1-way analysis of variance. Comparison of IU between invasive cancer and CIS was done through t test and Wilcoxon (Mann-Whitney) rank-sum test. All p values are 2-sided. The calculations were done with STATA 12 SE software (StataCorp, College Station, TX, USA).
Results
Microscopic examination of the slides from the experimental rats detected 19 foci of carcinomatous changes; of these, 11 were invasive cancer and 8 were CIS. Hyperspectral imaging (Figure 2) and DR measurements at 780 and 650 nm (Figure 3) were performed on 6 slides from the experimental rats and on 2 slides from the control rats.
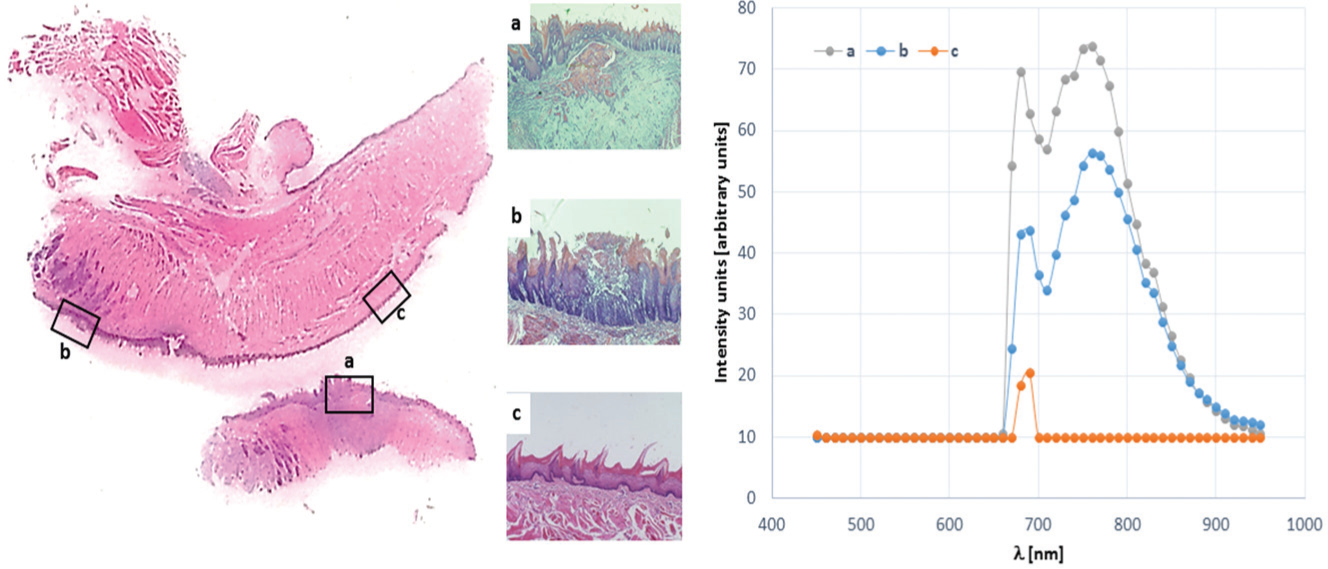
Reflectance spectra (intensity units) and the corresponding histopathology of an experimental rat tongue at wk 37. High reflectance at 780 nm was found in areas identified histologically as squamous cell carcinoma (area a) and moderate reflectance in areas of carcinoma in situ (area b). The normal epithelium (area c) found to lack the reflectance spectrum at 780 nm.
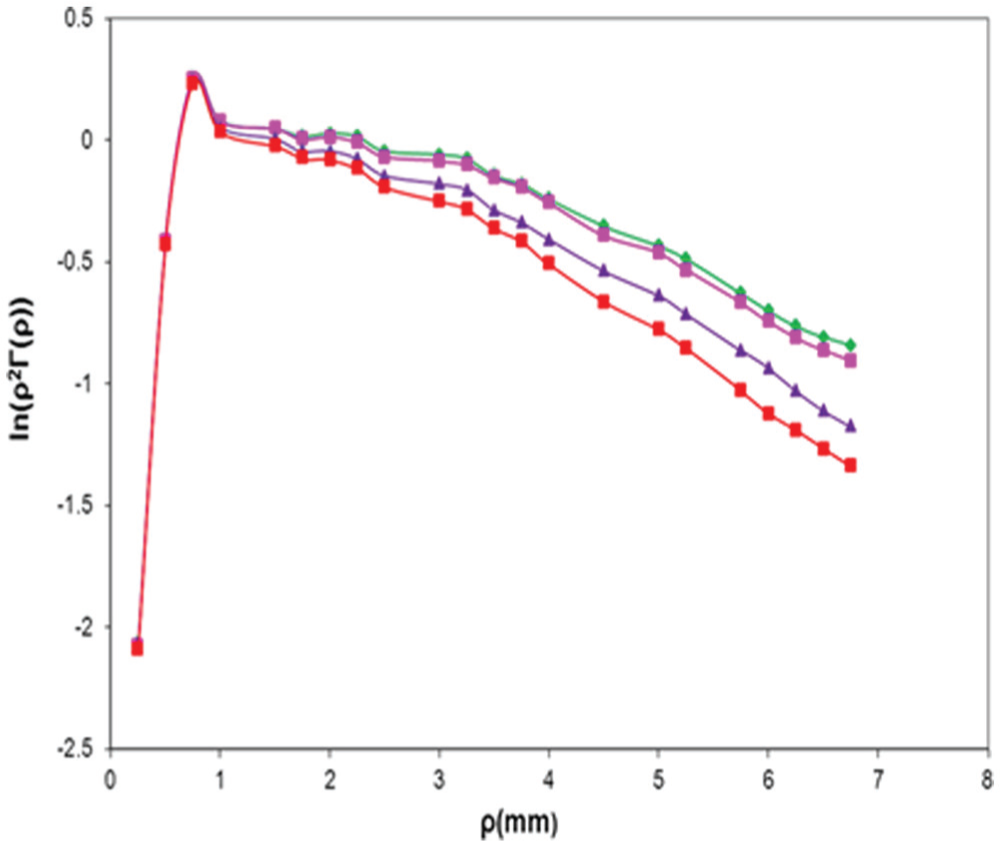
Diffusion reflection intensities (in semilogarithmic scale) as a function of the distance between the detector and the light source, at different sites in the tissue. The rhombus (green), triangle (purple), and square (red) are for areas a, b, and c presented in Figure 2, respectively. The pink square is the diffusion reflection result of area a, measured at 650 nm.
Experimental Results from the Hyperspectral Imaging System
Figure 2 presents an example for the reflectance spectra (IU) and the corresponding histopathology of an experimental rat tongue at wk 37. High reflectance at the GNRs’ peak wavelength (780 nm) was found in areas identified histologically as squamous cell carcinoma (Figure 2, area a, 57.11 IU) and moderate IU values in areas of CIS (Figure 2, area b, 35.3 IU). The normal epithelium (Figure 2, area c) was found to have similar values (10 ± 0.3 IU) as the control slides (9.64 ± 2.36 IU).
Cut Point of the Hyperspectral Imaging
Examination of the 2 experimental slides for defining the cut-point value revealed 193 cells in “normal” areas. The maximum reflectance intensity value was 16.49 IU (9.64 ± 2.36 IU, minimum = 3 IU); thus, the cut point for the hyperspectral imaging system was defined as 17 IU.
Specificity of the Hyperspectral Imaging
Examination of the slides from the 2 healthy control rats revealed 240 cells, with only 5 cells having intensity above 17 IU (but still < 22 IU), leading to specificity of 98%. The 5 false-positive cells were on 1 slide in 1 column in 5 adjacent rows.
Sensitivity of the Hyperspectral Imaging
There were 19 cancerous sites (11 invasive and 8 in situ). Two couples of CIS shared 1 cell, leading to 6 cells with CIS. One couple of invasive cancer shared 1 cell, leading to 10 areas with invasive cancer. In 4 invasive tumors areas more than 1 tumor per cell with intensity above threshold was detected. In sum, 14 of 16 pathologic regions had at least 1 grid cell with intensity above the threshold of 17 IU, leading to sensitivity of 87.5%.
Comparison of Invasive Cancer and CIS
The resulting IU of the hyperspectral reflected intensity in the invasive cancer and the CIS differed significantly. The average intensity of detected cells in the invasive sites was 54.01 ± 4.15 IU (95% confidence interval = 44.62, 63.4), while the mean value in the in situ sites was 24.6 ± 3.95 IU (95% confidence interval = 14.44, 34.75) (Table). The difference between invasive and in situ sites was highly significant (t test, p = .0002; Mann-Whitney, p = .0024).
DR Slope and Hyperspectral Imaging Results of Invasive Oropharyngeal Squamous Cell Carcinoma, Carcinoma In Situ, and Control

DR, diffusion reflection; IU, intensity unit.
Analysis of variance.
Experimental Results from the DR System
The resulted slopes of the DR are presented in a semilogarithmic scale (Figure 3) showing an increase of 88% (from 0.33 ± 0.02 to 0.622 ± 0.03) in areas occupied by invasive cancer and an increase of 36% (from 0.33 ± 0.02 to 0.45 ± 0.04) in the CIS sites, compared with the slope of the control. The slopes of the reflectance intensity of the control tissue, as well as for an area irradiated with 650-nm illumination, presented no change. The resulted slopes were 0.33 ± 0.04 and 0.33 ± 0.02, respectively (Figure 3, Table).
Discussion
The results of the current study present the power of direct DR scanning as a novel method in identifying carcinomatous changes in tissue sections. The results are promising, as all the invasive cancer sites were detected and, in most, the intensity was much above the threshold. Two small CIS sites were not detected, leading to 87.5% overall sensitivity and the “pessimistic” sensitivity of 75%. This study demonstrates our approach to define a cut point. Specificity of the method with the cut point was validated on independent slides and came out very high. The false-positive detection on 1 of the control slides formed a compact region; however, the intensity was only slightly above the cut point and could be the result of an artifact at the edge of the tissue, as is sometimes seen in immunohistochemical staining.
Only a few methods are available for identification of residual cancer at the resection bed (Muldoon et al., 2008; Gareau, 2009; Gareau et al., 2009; Muldoon et al., 2010). The main drawback of these methods is the background fluorescence noise. A wide-field fluorescence-structured illumination microscope has recently been developed allowing segmentation of nuclei from heterogeneous tissues in the presence of considerable background fluorescence (Fu et al., 2013). Most of these techniques, however, are based on fluorescence measurements not directed on the cancer cell itself but on estimated differences of tissue illumination and reflection. Moreover, these studies were mainly tested on resected tissue or on archival material; visualization of tissue fluorescence in the in vivo bleeding resection bed is somewhat problematic.
The present study suggests a novel cancer detection technique that utilizes the unique absorption properties of GNRs in the near-infrared region. The ability to specifically deliver and target a high concentration of GNRs exclusively to the tumor significantly changes the optical properties of the tumor (by more than 80% for invasive cancer and by more than 30% for CIS), enabling the discrimination between cancerous and noncancerous tissues.
Dysregulation of the EGFR is one of the most frequently studied molecular events leading to oral carcinogenesis (Todd and Wong, 1999). Overexpression of EGFR is a common event in many human solid tumors and is frequently observed in human oral cancers (Todd and Wong, 1999). To evaluate the specificity of the interaction between the antibody-coated GNRs and the oropharyngeal squamous cell carcinoma cells (which overexpress the EGFR), 2 types of GNRs were introduced to the cells. The first was specifically coated with anti-EGFR antibody, while the second, which was used as a negative control, was coated with a nonspecific antibody (anti-rabbit IgG). Flame atomic absorption spectroscopy measurements quantitatively demonstrated that the active tumor targeting (anti-EGFR-coated GNRs) was significantly more specific than the control experiment (anti-rabbit IgG-coated GNRs) (Reuveni et al, 2011). These results correlate well with previously published studies reporting that head and neck squamous cell carcinoma express from 2 × 10⁴ to 2 × 10⁶ EGFRs per cell (Stanton et al., 1994; Ankri et al., 2012b).
The results of the present study clearly demonstrate the power of direct DR scanning in identifying carcinomatous changes in tissue sections. The DR measurements are objective and not dependent on the qualification of a technician, and they have fewer interpretation errors. We expect this nonionizing optical detection method to provide a highly sensitive, simple, and inexpensive tool for intraoperative cancer detection. Further studies using in vivo models are required to validate the results of the study.
Footnotes

References
Supplementary Material
Please find the following supplemental material available below.
For Open Access articles published under a Creative Commons License, all supplemental material carries the same license as the article it is associated with.
For non-Open Access articles published, all supplemental material carries a non-exclusive license, and permission requests for re-use of supplemental material or any part of supplemental material shall be sent directly to the copyright owner as specified in the copyright notice associated with the article.
