
Abstract
Analytic approaches confined to fold-change comparisons of gene expression patterns between states of health and disease are unable to distinguish between primary causal disease drivers and secondary noncausal events. Genome-wide reverse engineering approaches can facilitate the identification of candidate genes that may distinguish between causal and associative interactions and may account for the emergence or maintenance of pathologic phenotypes. In this work, we used the algorithm for the reconstruction of accurate cellular networks (ARACNE) to analyze a large gene expression profile data set (313 gingival tissue samples from a cross-sectional study of 120 periodontitis patients) obtained from clinically healthy (n = 70) or periodontitis-affected (n = 243) gingival sites. The generated transcriptional regulatory network of the gingival interactome was subsequently interrogated with the master regulator inference algorithm (MARINA) and gene expression signature data from healthy and periodontitis-affected gingiva. Our analyses identified 41 consensus master regulator genes (MRs), the regulons of which comprised between 25 and 833 genes. Regulons of 7 MRs (HCLS1, ZNF823, XBP1, ZNF750, RORA, TFAP2C, and ZNF57) included >500 genes each. Gene set enrichment analysis indicated differential expression of these regulons in gingival health versus disease with a type 1 error between 2% and 0.5% and with >80% of the regulon genes in the leading edge. Ingenuity pathway analysis showed significant enrichment of 36 regulons for several pathways, while 6 regulons (those of MRs HCLS1, IKZF3, ETS1, NHLH2, POU2F2, and VAV1) were enriched for >10 pathways. Pathways related to immune system signaling and development were the ones most frequently enriched across all regulons. The unbiased analysis of genome-wide regulatory networks can enhance our understanding of the pathobiology of human periodontitis and, after appropriate validation, ultimately identify target molecules of diagnostic, prognostic, or therapeutic value.
Introduction
A comprehensive mapping of the repertoire of molecular interactions (interactome) in a cell or tissue sample provides an integrated overview of regulatory programs in real time and is increasingly useful in the dissection of biological processes in the context of several diseases (Rhodes et al. 2005; Lefebvre et al. 2010; Aubry et al. 2015). While analytic approaches limited to a comparison of fold-change differences in gene expression between states of health and disease are unable to distinguish between primary causal disease drivers and secondary non-causal (passenger) events, genome-wide reverse engineering approaches can enable the identification of candidate genes that may bolster causal interpretations arising from transcriptomic studies and help to explain the emergence or maintenance of pathologic phenotypes (Basso et al. 2005; Carro et al. 2010). Such context-specific, regulatory, model-based methodologies support the integrative, unbiased interrogation of large data sets and facilitate the study of their global behavior rather than focus on the effects of individual genes. Importantly, these approaches can lead to the identification of master regulators (MRs)—genes whose function is central to the development of a specific pathophysiologic phenotype while discarding the majority of passenger genes.
In our earlier work, we provided comprehensive descriptions of the gingival transcriptome in periodontal health, experimentally induced gingivitis, and periodontitis (Demmer et al. 2008; Jönsson et al. 2011). We demonstrated that distinct patterns of subgingival microbial colonization associate with discernible gene expression signatures in the adjacent gingival tissues (Papapanou et al. 2009). Despite limited molecular differences among lesions from chronic or aggressive periodontitis (Kebschull et al. 2013), gingival tissue transcriptomes identified 2 clusters of patients (Kebschull et al. 2014) who differed with respect to periodontitis extent and severity, levels of specific subgingival microbiota, and serum IgG antibody responses to selected bacteria.
In this work, we used the algorithm for the reconstruction of accurate cellular networks (ARACNE; Basso et al. 2005; Margolin, Nemenman, et al. 2006; Margolin, Wang, et al. 2006) to analyze our large-scale gene expression profile data set (GSE16134) obtained from clinically healthy or periodontitis-affected gingival tissues. This analysis yielded the transcriptional regulatory network of the human gingival interactome (i.e., the genome-wide repertoire of transcription factor–target gene interactions in the gingival tissues). This regulatory network model was then interrogated by means of the master regulator inference algorithm (MARINA; Carro et al. 2010; Della Gatta et al. 2012) using expression data from healthy and periodontitis-affected gingiva to identify candidate MRs—genes that either may lead to disruption of tissue homeostasis and “drive” the transition from gingival health to disease or are responsible for sustaining gingival pathology. This unbiased analysis of genome-wide regulatory networks can enhance our understanding of the pathobiology of human periodontitis and, after appropriate external validation, ultimately identify target molecules of diagnostic, prognostic, or therapeutic value.
Materials and Methods
Patients, Phenotyping, Sample Collection, and Transcriptomes
The sample cohort comprised 120 periodontitis patients, otherwise healthy nonsmokers, recruited at the College of Dental Medicine, Columbia University; 65 patients were diagnosed with chronic periodontitis and 55 with aggressive, per established criteria (Armitage 1999). The study conforms to the STROBE guidelines and was approved by the Columbia University Institutional Review Board. Gingival tissue samples (313 in total) comprising interdental papillae were collected from periodontitis-affected sites (243 samples; 2 from each of 117 patients and 3 from each of 3 patients) and clinically healthy sites (70 samples, a single sample from each). Inclusion criteria, tissue sample characteristics, demographic data, processing of samples, and analyses of the tissue transcriptomes have been published (Kebschull et al. 2013). The transcriptomic data set is available through GSE16134.
Regulatory Network Construction: ARACNE
We used the ARACNE (Basso et al. 2005; Margolin, Nemenman, et al. 2006; Margolin, Wang, et al. 2006) to construct a regulatory interactome from the RNA expression data set. ARACNE computes a measure of coexpression termed mutual information between all pairs of genes across a set of expression data and subsequently constructs a network where nodes represent genes and edges represent putative regulatory interactions. The algorithm then uses an information theory approach termed data processing inequality (Cover and Thomas 2006) to eliminate edges that are artifacts—those that result from cascades or pathways of transcriptional interactions that lead to correlated expression of 2 genes that do not directly interact. The interactome was constructed with reference to 1,617 previously identified transcription factors and other transcriptional regulatory elements (collectively referred to as TFs; Lefebvre et al. 2010). The resulting network identifies a list of genes that are regulatory targets for each TF.
Array quality control and data processing were carried out through R/Bioconductor (Gentleman et al. 2004), and profiles were normalized with gcrma. To exclude uninformative probes from the analysis, the probe set of 54,675 was trimmed by 1) removing all control probes; 2) retaining, among the multiple probes that mapped to the same EntrezGeneID, only the probe with the highest variance across the entire data set; and 3) retaining 50% of the remaining probes with the highest variance across the data set, in addition to the 1,617 probes representing the selected TFs. This process resulted in a total of 10,794 probes, and the normalized log expression values for these were exported as a data matrix for further analysis.
We used bootstrapping to generate a consensus ARACNE network (Basso et al. 2005). Arrays were randomly selected from the data set to generate a series of “bootstrap” data sets, each of which was independently used to generate a series of bootstrap networks and then combined through a permutation-based significance test of each edge to arrive at a consensus network.
To construct the bootstrapped networks, we created 100 subsets, each comprising 120 gene expression profiles generated by randomly selecting 1 profile from every patient. Random numbers were generated through the random package in R. ARACNE was run through the adaptive partitioning algorithm option. A permutation test was then used to generate a consensus network from the 100 bootstrapped networks via a P value <10-6.
MR Identification: MARINA
We next used the MARINA (Carro et al. 2010; Della Gatta et al. 2012) to interrogate the consensus interactome generated by ARACNE to identify TFs that act as MRs of the differential gene expression profiles between periodontal health and periodontitis. Given an interactome and a set of expression data representing 2 phenotypes, MARINA uses gene set enrichment analysis (GSEA; Subramanian et al. 2005) to analyze the enrichment of each TF regulon with respect to differential expression between the phenotypes. A further extension of MARINA termed shadow analysis (Lefebvre et al. 2010) was used to eliminate false-positive TFs.
The GSEA step in MARINA employs a permutation-based method to assess statistical significance of the regulon enrichment in which the sample phenotypes are randomly shuffled. An underlying assumption for this computation is that each observation is biologically independent; thus, inclusion of technical replicates in a nonuniform manner could lead to bias in the permutation analysis. Given that the available data set of 313 gene expression profiles from healthy and periodontitis-affected tissues included ≥2 samples from each donor (i.e., did not entirely consist of biologically independent observations), we ran MARINA on a number of random subsets, each comprising different arrays from each patient, and then obtained a consensus list of MRs. We reasoned that true-positive MRs would be identified irrespective of the subset of samples used; therefore, this consensus list would better allow us to leverage the power of the complete data set to exclude false positives.
Specifically, the gcrma-normalized data were further corrected for batch effects via ComBat (Johnson et al. 2007), and 3 apparent outlier samples were removed from further analysis (see Appendix). We then created 20 randomly selected subsets, each one formed as follows: 1) we randomly selected 70% of the participants (i.e., 84 patients) and 42 health-associated (control) transcriptomic profiles from them (note that control profiles were available from 70 patients only; as such, if the random set did not include 42 control profiles, it was discarded); 2) we randomly selected 42 periodontitis-associated profiles from the remaining 42 patients. Subsequently, we ran MARINA independently on each subset. The consensus list of MRs included 1) all MRs that emerged as statistically significant in all 20 lists and 2) those that appeared in ≥90% of the lists (i.e., 18) and had a P value ≤ the highest P value of the MRs present on all 20 lists. The latter approach was used to account for the existence of false-negative findings.
Functional Analysis
Differential gene expression between periodontitis-affected and healthy gingival tissues was estimated from normalized expression data in R via the limma package (Smyth 2004) and modeled with a correlation term to account for multiple samples harvested from the same patient. For each TF, a table of differential gene expression was uploaded to Ingenuity IPA (QIAGEN) for further functional analysis.
Comparison with Previous Findings and External Validation
To identify MRs potentially contributing to the different phenotypes of 2 patient clusters identified in our earlier work (Kebschull et al. 2014), we selected those genes among the 2,837 differentially expressed probes between the clusters that were either 1) differentially regulated in periodontitis-affected versus healthy tissues in one cluster but not in the other or 2) upregulated in periodontitis versus healthy in one cluster and downregulated in the other. We used a Fisher’s exact test to examine whether any MR regulons were significantly enriched for any genes in the above subset.
We initiated an external validation of the emerging MRs using publicly accessible ChIP-Seq data (ENCODE Project Consortium 2012). NarrowPeak files with transcription factor binding sites for MRs included in the database were obtained from https://genome.ucsc.edu/ENCODE/dataMatrix/encodeChipMatrixHuman.html and annotated with HOMER (Heinz et al. 2010). The annotated binding sites were assessed for overlap with the regulon genes.
Results
Gingival Tissue Regulatory Interactome in Periodontitis
The ARACNE-generated, consensus regulatory network comprised 10,286 nodes and 209,851 edges with statistically significant mutual information (P ≤ 10-6). The network included 1,478 TFs and 8,912 transcriptionally associated target genes. The regulons of 239 of the identified TFs contained <20 genes each and were excluded from further analysis.
MR Analysis
Interrogation of the above regulatory network through MARINA and 20 randomly selected subsets of expression profiles identified a total of 139 potential MRs (range, 66 to 80 MRs/subset); 37 MRs were identified in all 20 analyses, with a maximum P ≤ 0.008. The consensus MR list also included an additional 4 MRs with P ≤ 0.008 that were identified in >90% (n = 18) of the analyses.
The Figure contains scatter plots showing the number of MARINA runs in which the putative MR was identified as significant, along with the associated GSEA parameters. The upper left panel plots the P value identifying consensus MRs from the 20 MARINA runs. The remaining panels show that these MRs were consistently associated with higher scores in key GSEA metrics (odds ratio, median absolute net enrichment score, and percentage of genes in the leading edge).
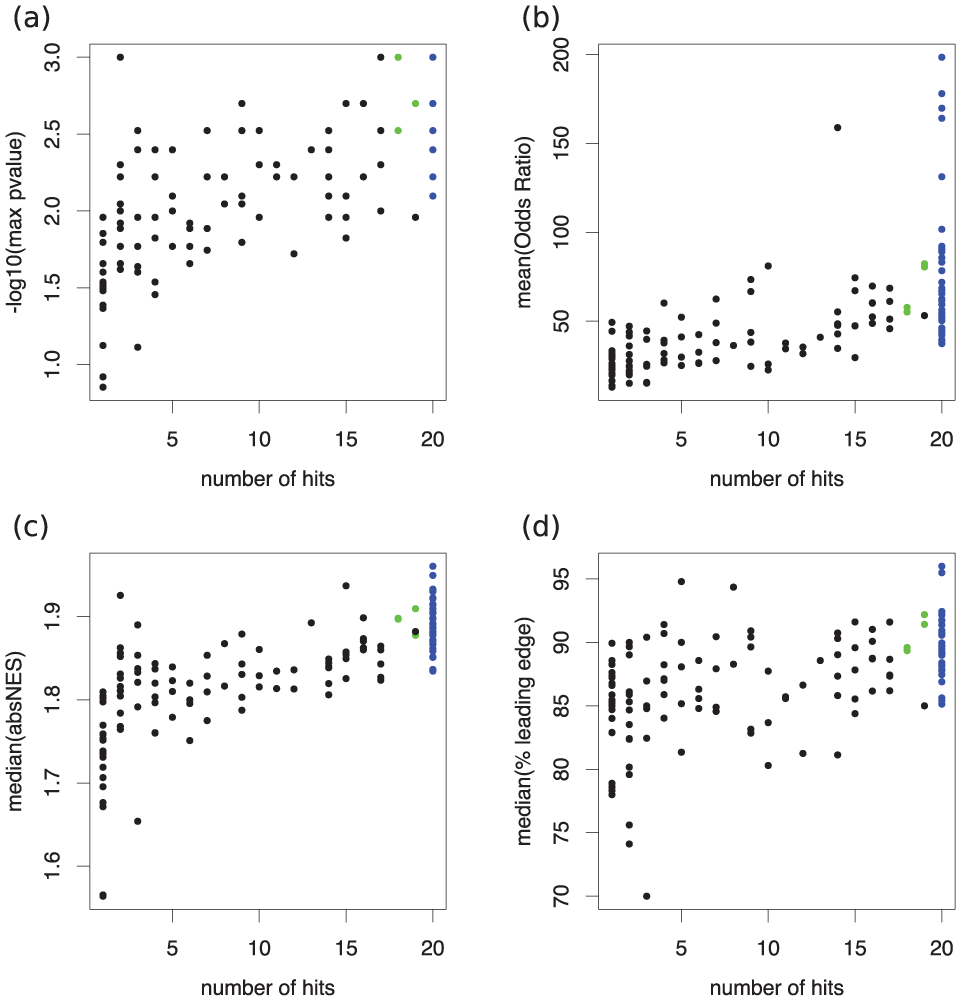
To identify master regulator (MR) genes, MARINA (master regulator inference algorithm) was run on 20 random subsets and a consensus list of MRs generated (see Materials and Methods for details). The upper left panel (
Table 1 shows details of the 41 MRs and summarizes their GSEA statistics. Regulon size varied between 25 and 833 genes. For all GSEA analyses run, >80% of all regulon genes were in the leading edge (details in Appendix Table 1).
41 Master Regulators Identified in the Gingival Tissues.
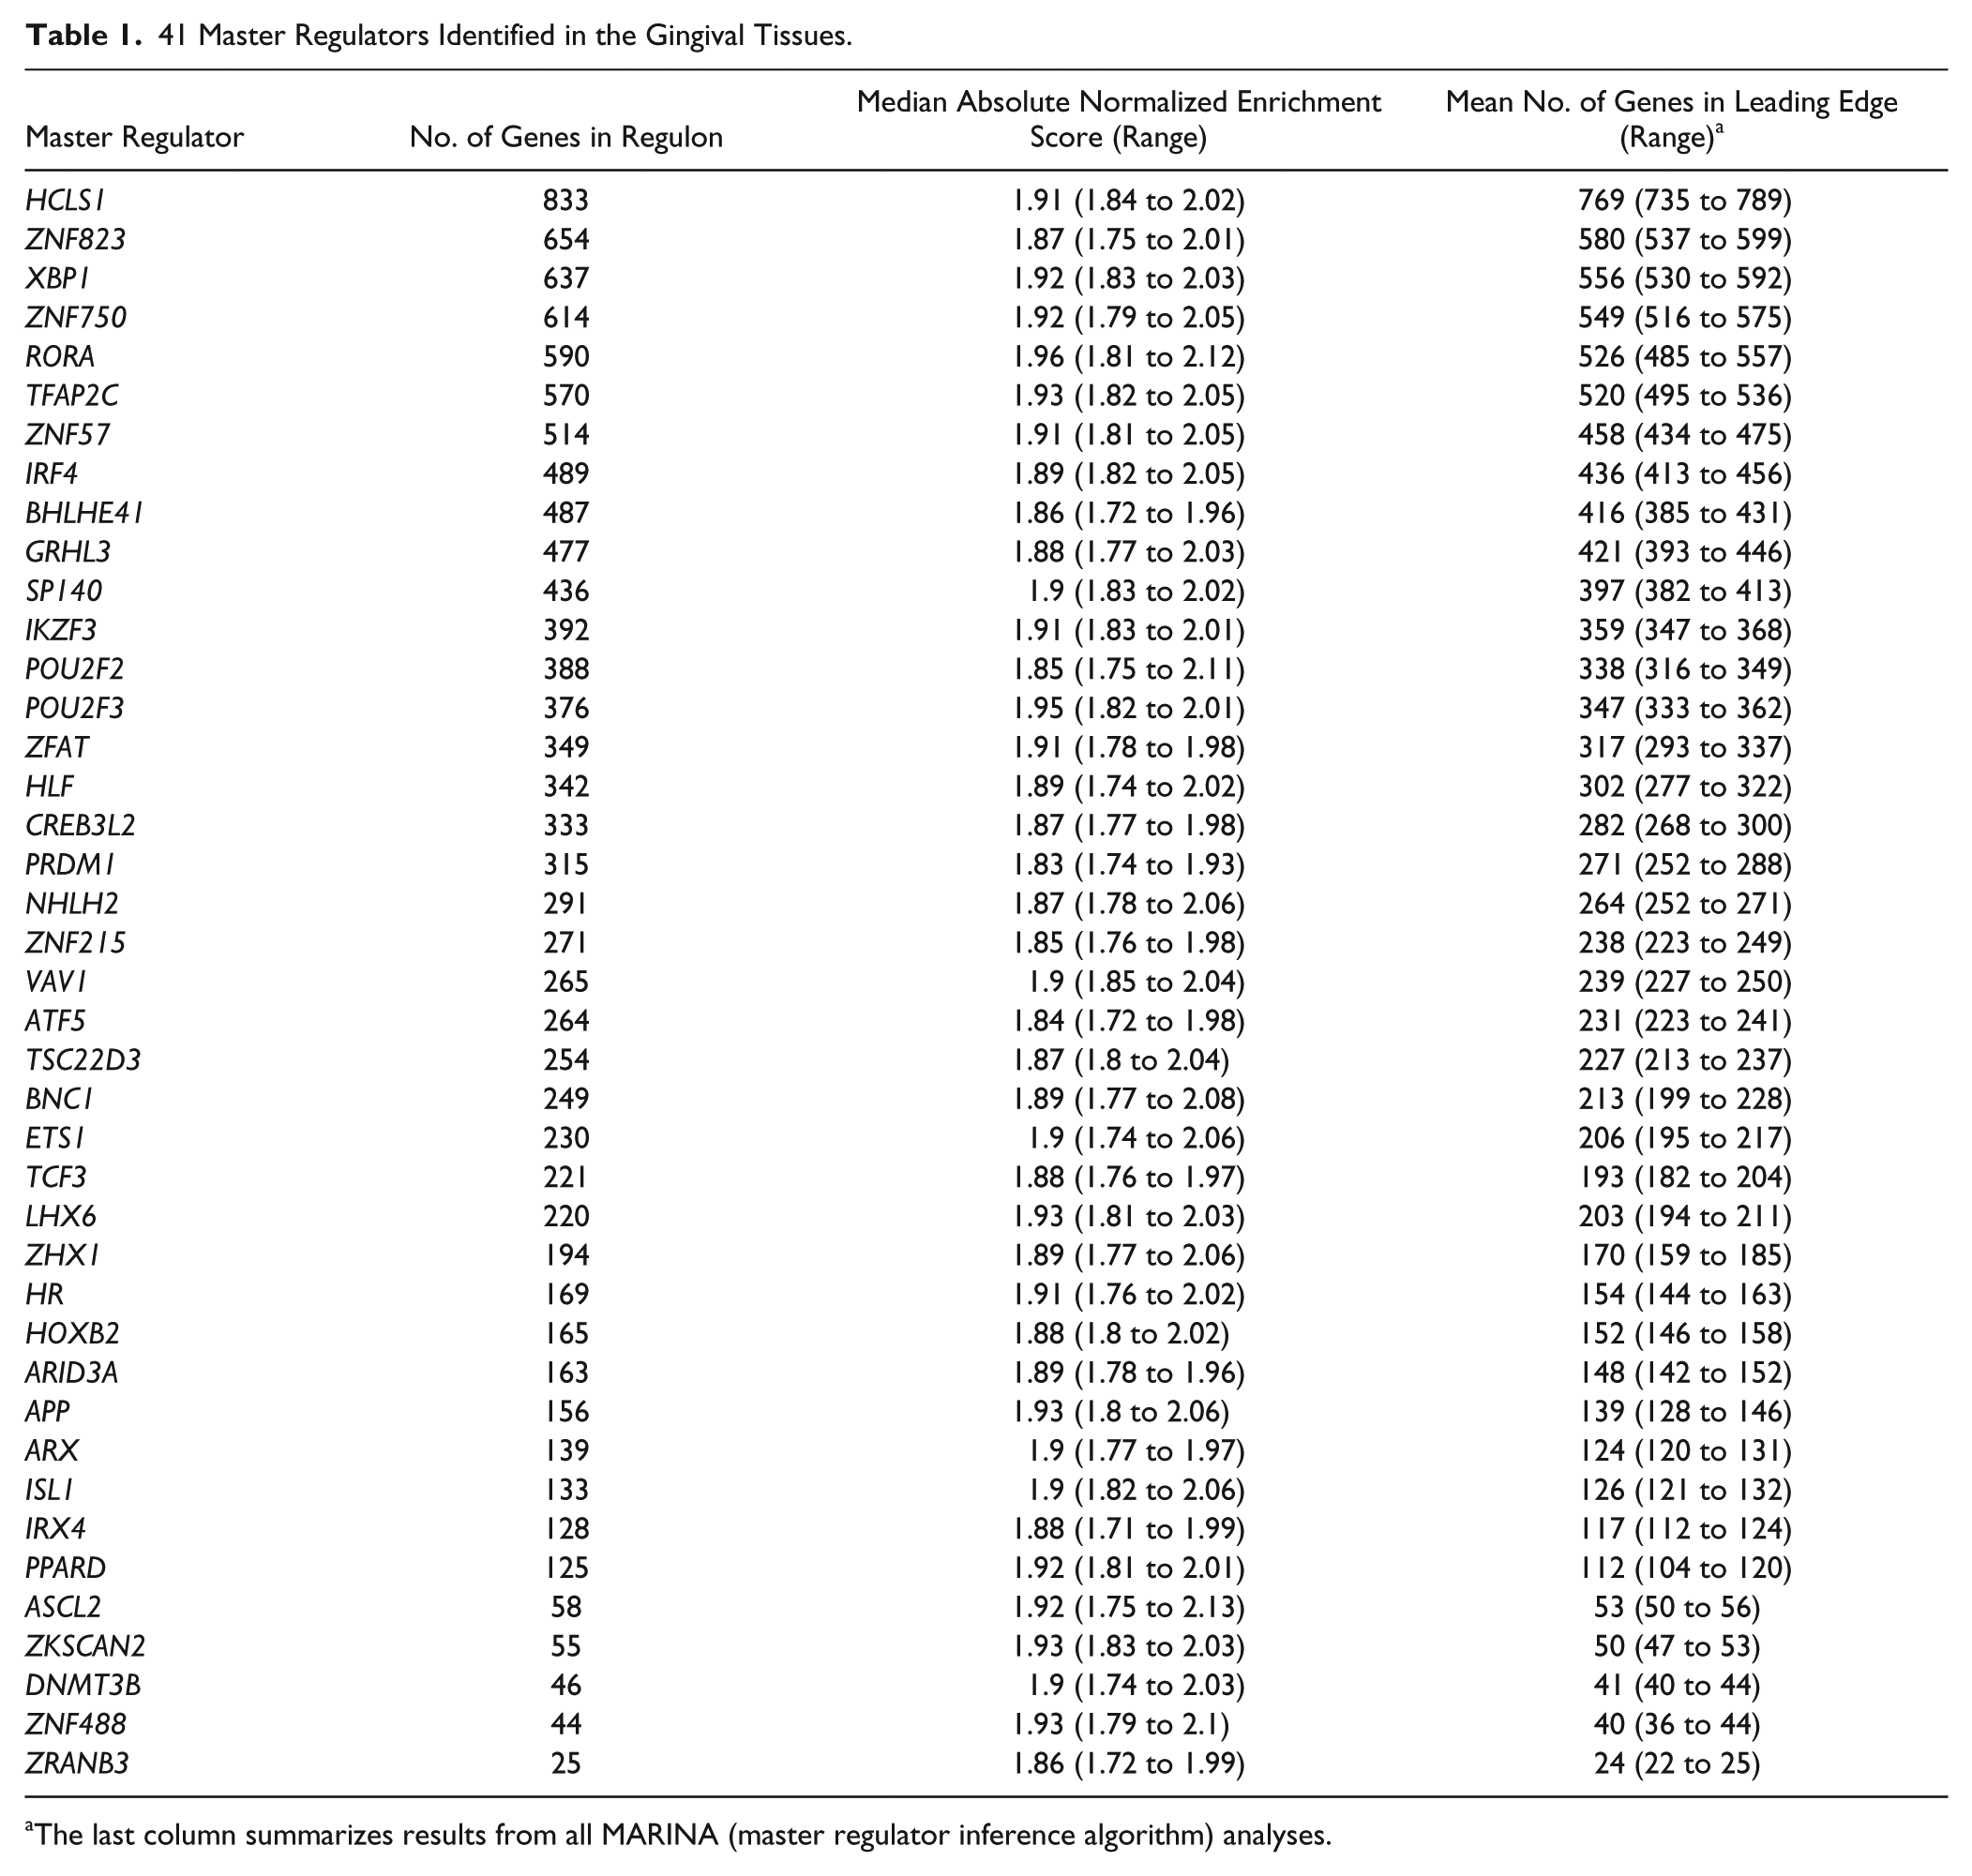
The last column summarizes results from all MARINA (master regulator inference algorithm) analyses.
Functional Analysis
All regulon genes were uploaded to Ingenuity Pathway Analysis with their differential gene expression values in periodontitis-affected versus healthy tissues and the associated false discovery rates. The core analysis workflow was used to identify pathways that were enriched for genes in each regulon. Pathways were considered significantly enriched if the false discovery rate was ≤0.05. A total of 120 Ingenuity canonical pathways were enriched in ≥1 regulons. Ingenuity pathway analysis of 5 regulons (those of MRs ASCL2, DNMT3B, HR, PPARD, TFAP2C) resulted in no enriched pathways; 30 regulons were associated with 1 to 10 enriched pathways; 4 regulons (of VAV1, POY2F2, NHLH2, ETS1) were associated with 12 to 22 enriched pathways; and the regulons of IKZF3 and HCLS1 were associated with 54 and 90 enriched pathways, respectively. Table 2 also lists the most significant pathways associated with each regulon (details in Appendix Table 2). Table 3 lists the 10 most commonly enriched pathways across all regulons and their respective MRs. The majority of these pathways were related to immune system signaling or development.
Significantly Enriched Pathways in 36 Regulons of the 41 Master Regulators.
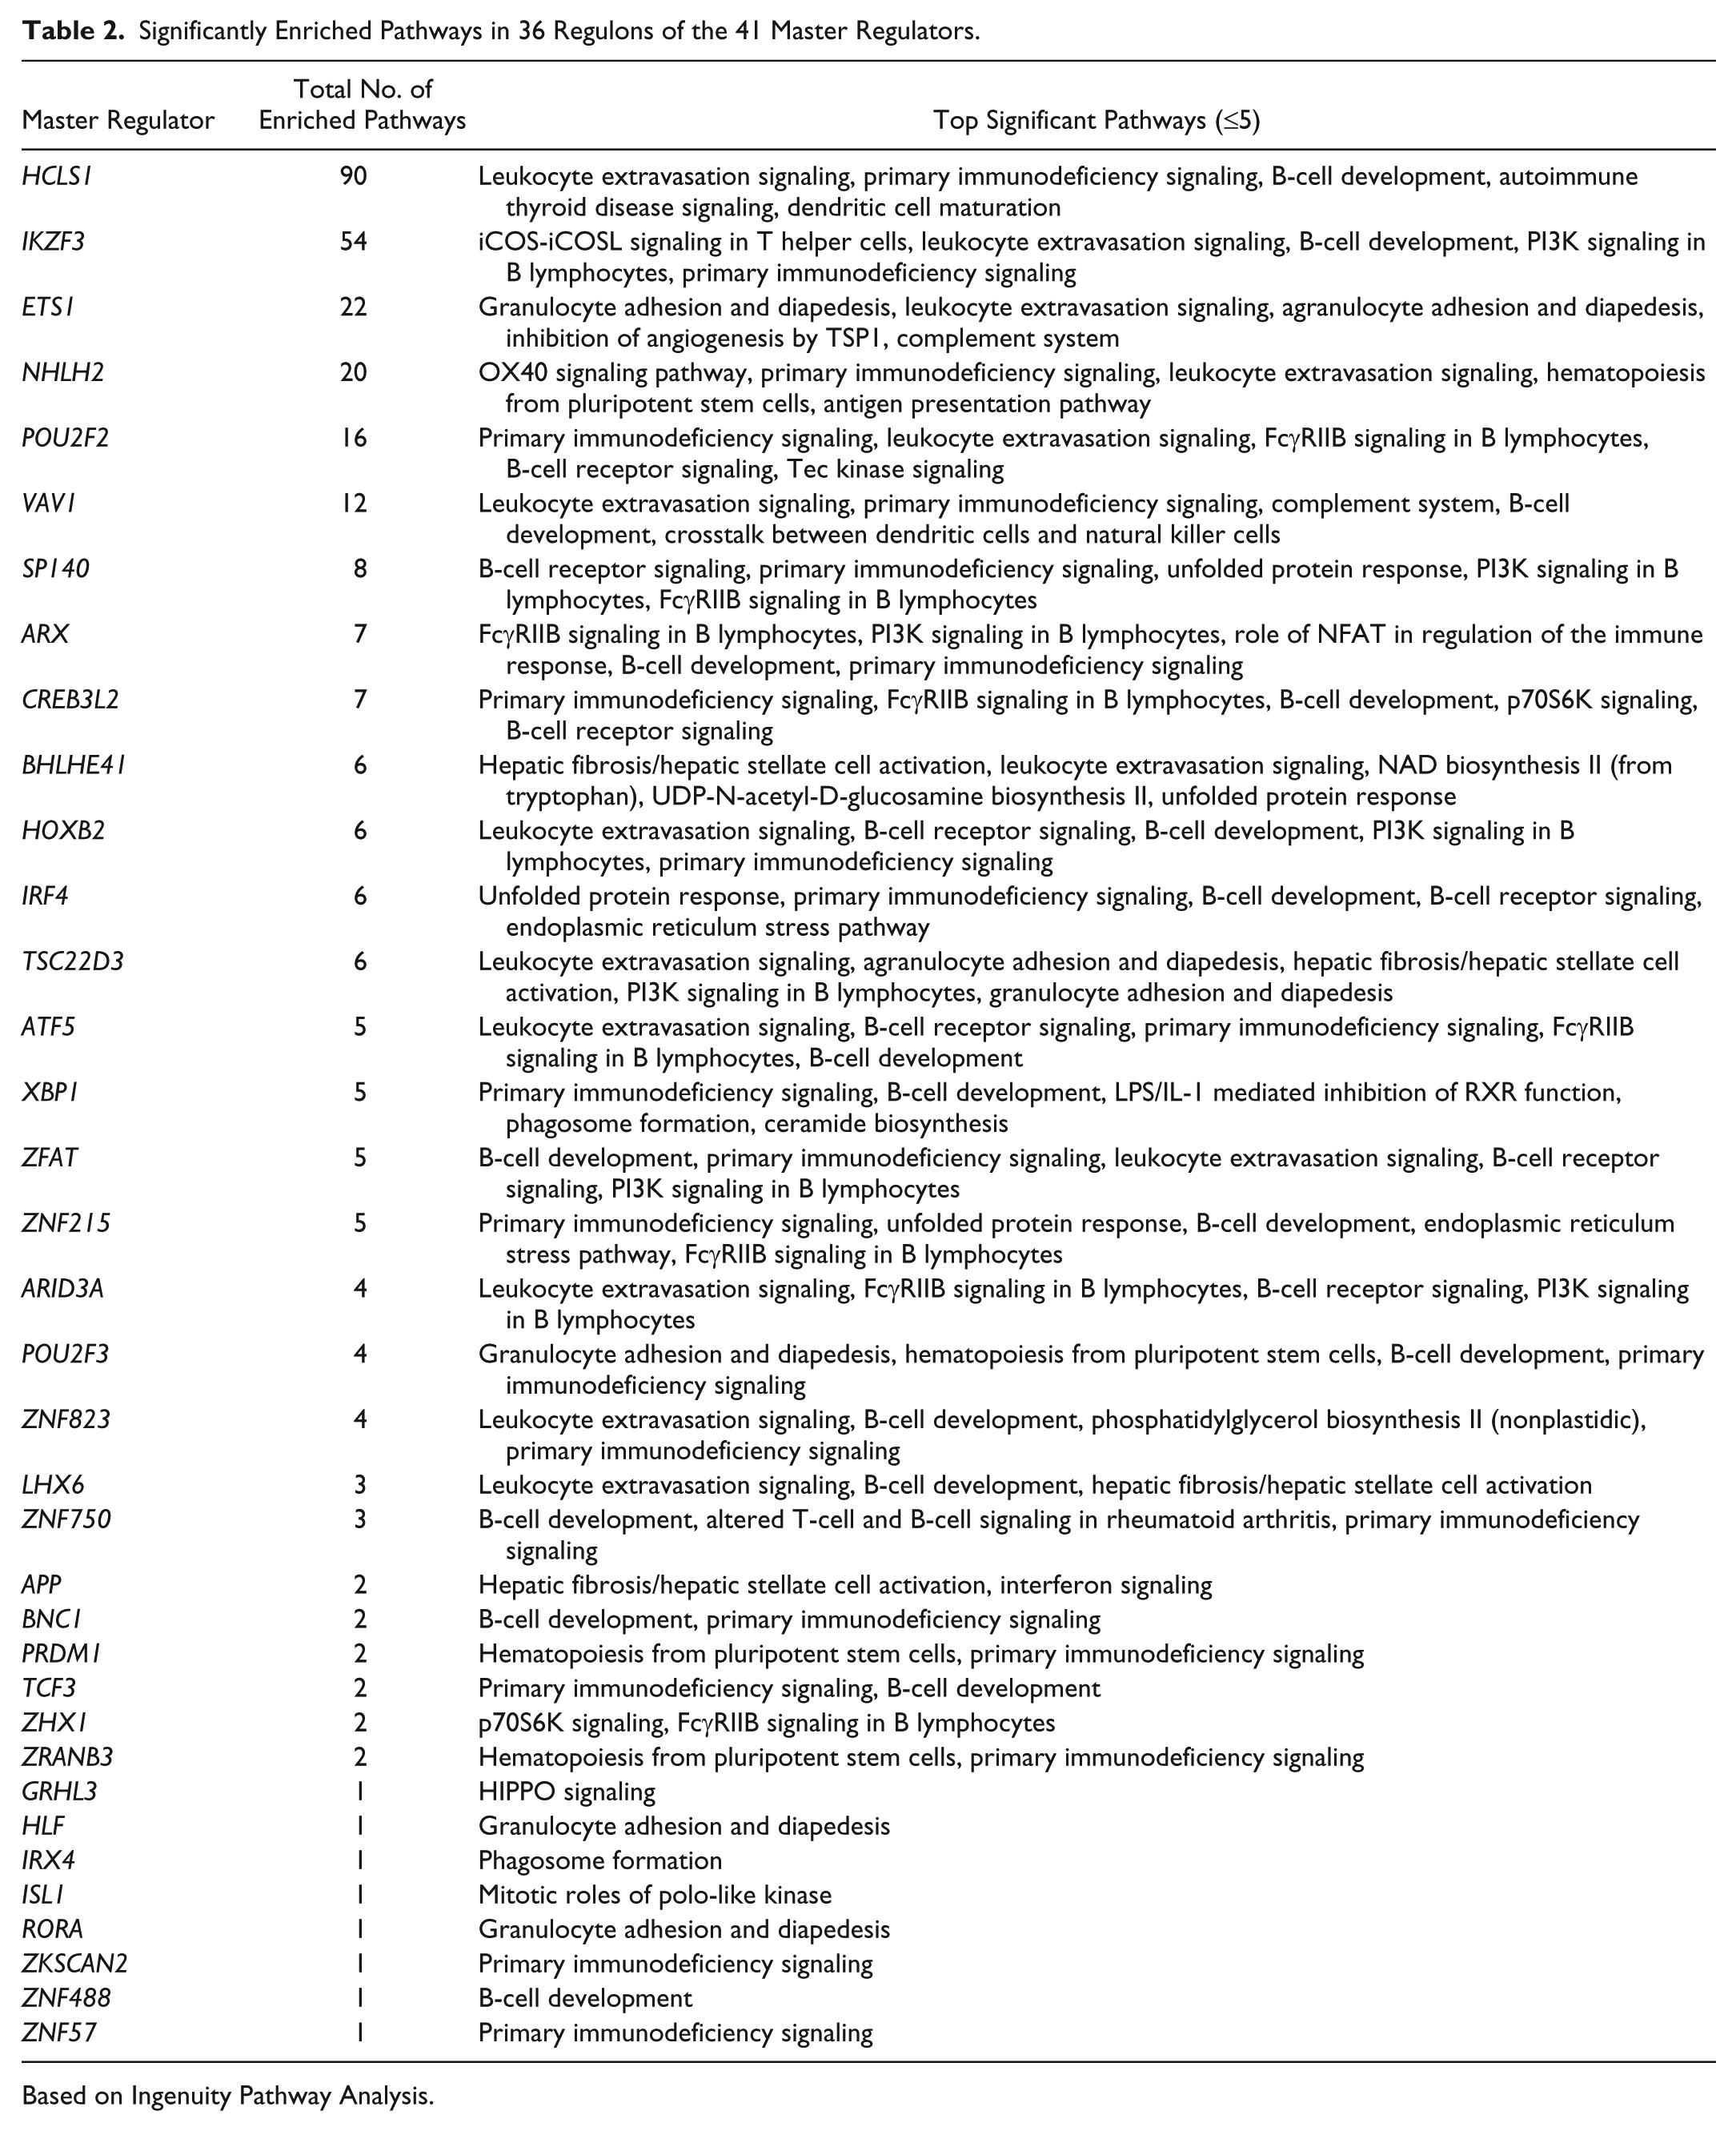
Based on Ingenuity Pathway Analysis.
10 Most Commonly Enriched Pathways.
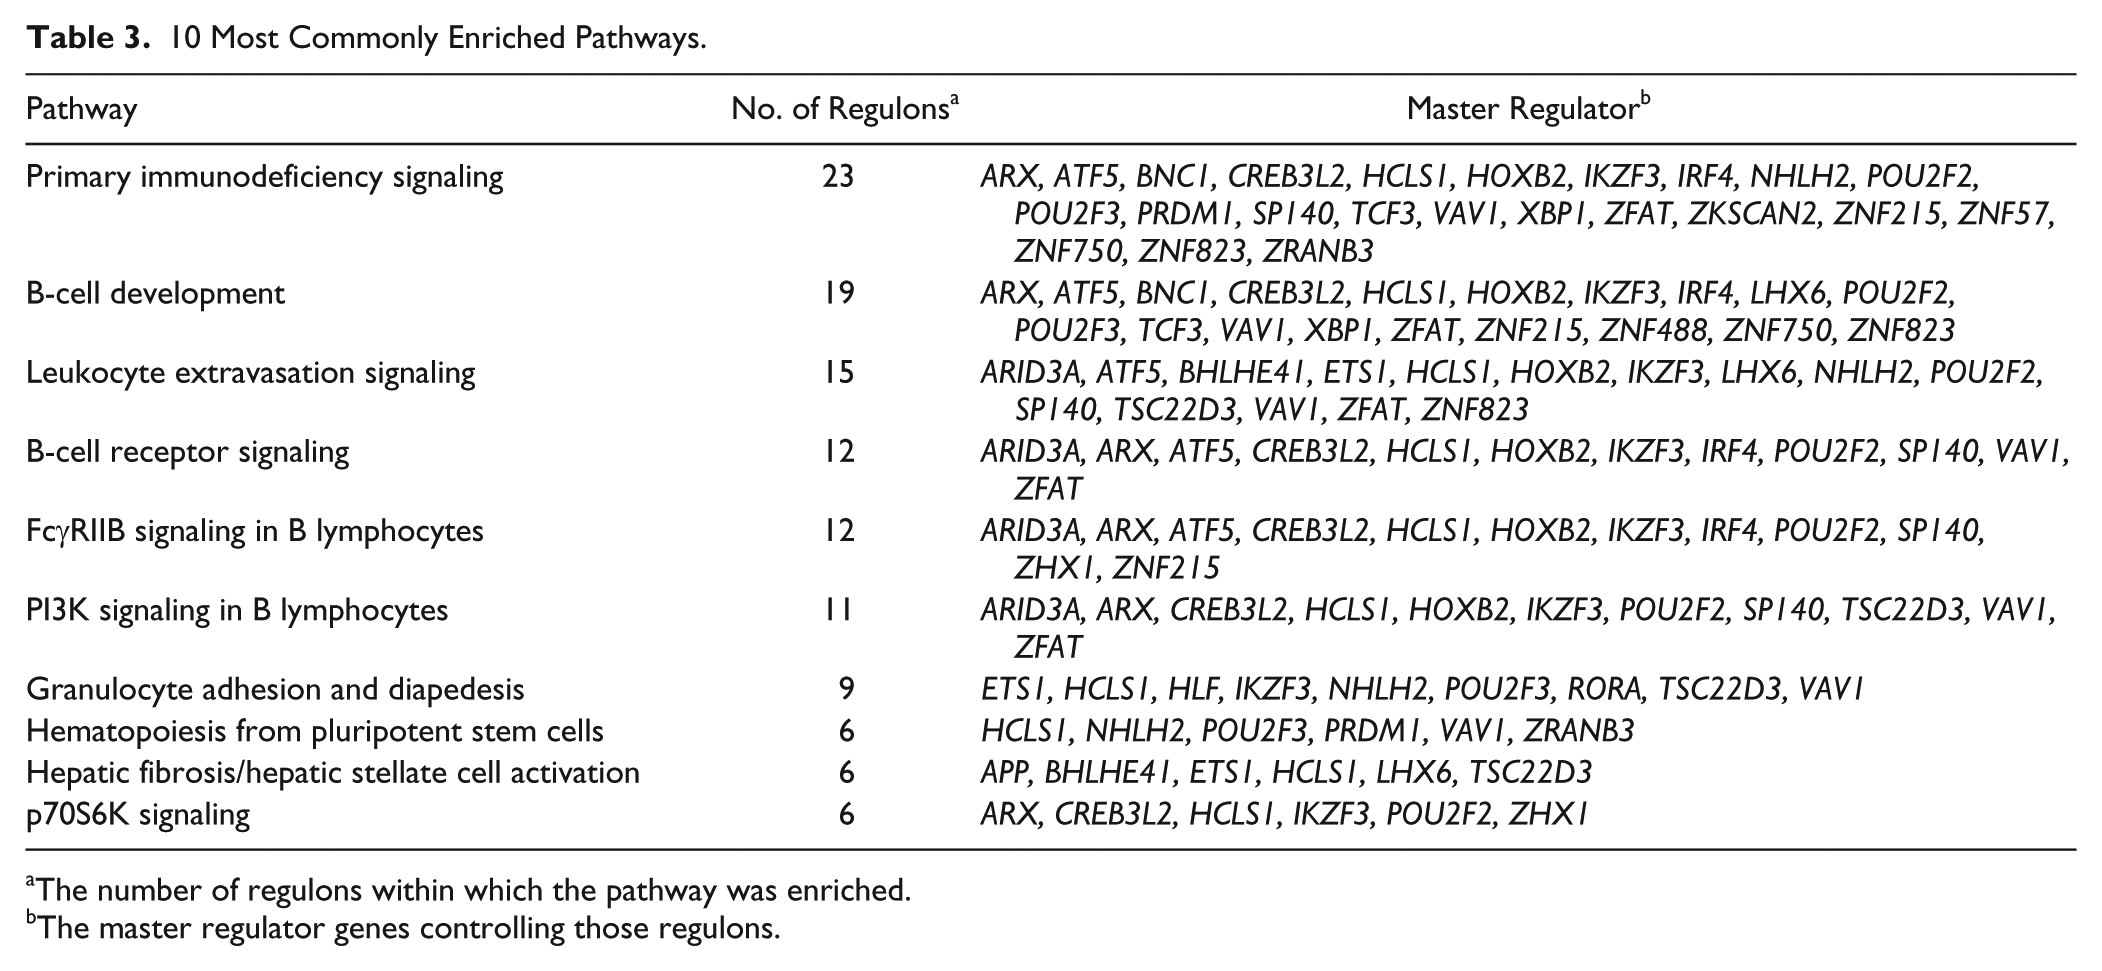
The number of regulons within which the pathway was enriched.
The master regulator genes controlling those regulons.
Comparison with Previous Findings and External Validation
We examined whether any of the identified MRs were relevant to the distinction between the 2 clusters of periodontitis patients identified in our previous work (Kebschull et al. 2014). The 2,837 differentially regulated probes between the 2 clusters corresponded with 1,976 unique genes, of which 1,940 were represented in the set of 10,794 genes selected for use in the ARACNE and MARINA analyses; 586 of these fulfilled the criteria described above as potentially contributing to the distinct phenotype. Table 4 lists the 17 MRs identified through Fisher’s exact test whose regulons were significantly enriched (Benjamini-Hochberg corrected P < 0.05) for the subset of genes relevant to the clustering.
Master Regulators Whose Regulons Were Significantly Enriched.
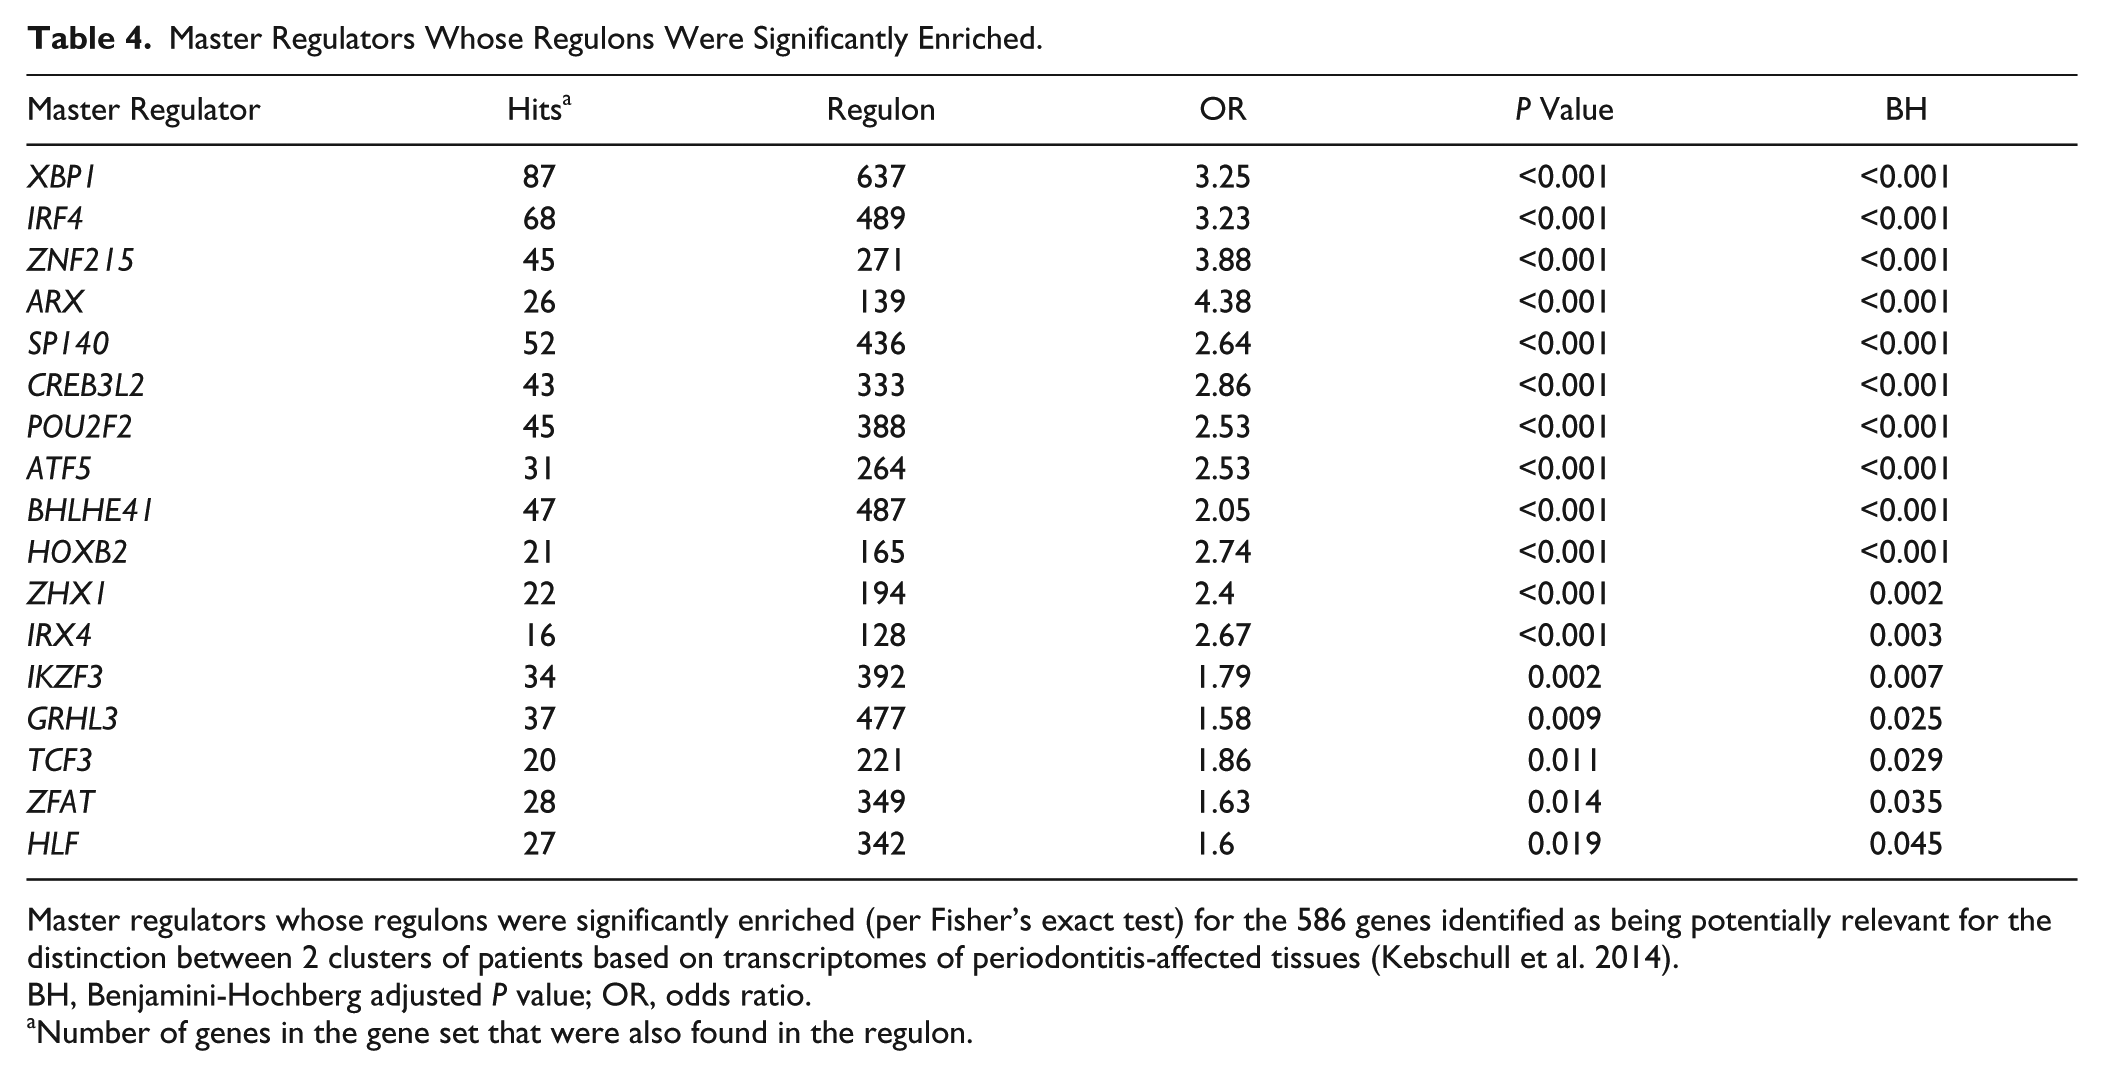
Master regulators whose regulons were significantly enriched (per Fisher’s exact test) for the 586 genes identified as being potentially relevant for the distinction between 2 clusters of patients based on transcriptomes of periodontitis-affected tissues (Kebschull et al. 2014).
BH, Benjamini-Hochberg adjusted P value; OR, odds ratio.
Number of genes in the gene set that were also found in the regulon.
For our in silico external validation, we identified ChIP-Seq data from 10 individual experiments related to binding sites of 7 of the identified MRs (ARID3A, ETS1, IRF4, POU2F2, PRDM1, TCF3, and TFAP2C). The extent of overlap of these with the identified MR regulons ranged from 12% to 78% (Appendix Table 4).
Discussion
To the best of our knowledge, this is the first study using a genome-wide reverse engineering approach to identify MR genes for human periodontitis. After constructing the transcriptional regulatory network of the gingival interactome, we interrogated it with gene expression signatures from healthy and periodontitis-affected gingival tissues to identify MRs (i.e., upstream genes with potential regulatory roles in periodontitis pathobiology). Our work significantly narrows the field of candidate pivotal genes in the pathobiology of periodontitis and informs the conduct of subsequent focused external validation studies.
As shown in the Figure and Table 1, repeated interrogation of the ARACNE-generated cellular networks in 20 random gene expression data sets based on MARINA resulted in robust and consistent findings, given that 37 of the 41 emerging MRs were identified in all 20 runs. Moreover, GSEA analysis showed that the likelihood that the regulons of these MRs would appear as differentially expressed in gingival health versus disease due to chance alone ranged between 2% and 0.5% (mean odds ratio between 50 and 200). Furthermore, the median absolute normalized enrichment score (a weighted Kolmogorov-Smirnov-like statistic) exceeded 1.8, again indicating low probability for type 1 error. The percentage of regulon genes in the leading edge (i.e., the “core” of each gene set that accounted for the enrichment signal) exceeded 80% for all MRs.
The size of the regulons of these consensus MRs varied significantly and exceeded 100 genes for 36 of the 41 MRs, while regulons of 7 MRs—those of hematopoietic cell–specific Lyn substrate 1 (HCLS1); zinc finger proteins (ZNF) 823, 750, and 57; X-box binding protein 1 (XBP1); RAR-related orphan receptor A (RORA); and transcription factor AP-2 gamma (TFAP2C)—included >500 genes each. However, what is likely more revealing of the potential impact of an MR on the development of a particular phenotype than the size of its regulon is the extent to which specific gene pathways are enriched among the genes in the regulon. Ingenuity pathway analysis showed that the regulons of 36 of the 41 consensus MRs were significantly enriched for several pathways and that 6 of them—those for MRs HCLS1, IKZF3 (IKAROS family zinc finger 3), ETS1 (v-ets avian erythroblastosis virus E26 oncogene homolog 1), NHLH2 (nescient helix-loop-helix 2), POU2F2 (POU class 2 homeobox 2), and VAV1 (vav guanine nucleotide exchange factor 1)—were enriched for >10 pathways. Another feature reflecting the “potency” of an MR is the functional diversity of the enriched pathways encountered within its regulon. Pathways related to immune system signaling and development (e.g., primary immunodeficiency signaling, B-cell development, leukocyte extravasation signaling, B-cell receptor signaling, FcγRIIB and PI3K signaling in B-lymphocytes, and granulocyte adhesion and diapedesis) were the ones most frequently enriched across regulons. We used color-coded contingency tables and dendrograms (data not shown) to further examine the overlap of genes among these enriched pathways, and we observed that particular sets of genes within each regulon were indeed frequently encountered among different enriched pathways. However, among 6 enriched pathways encountered within the regulon of BHLHE41—basic helix-loop-helix family, member E41, a gene involved in the control of cell-specific differentiation (Stevens et al. 2008) but also in circadian rhythm (Pellegrino et al. 2014)—only 2 included overlapping regulon genes. Likewise, dendrograms showed a robust segregation of enriched pathways in the regulons of IKZF3 and HCLS1, suggesting their potential to simultaneously regulate functionally diverse processes.
Interestingly, a number of MRs identified in our work was found to be associated with periodontitis in genome-wide association studies. In a gene-centric analysis from the ARIC study (Rhodin et al. 2014), BNC1 (basonuclein 1; a regulator of keratinocyte proliferation and rRNA transcription), HR (hair growth associated; a transcriptional corepressor of multiple nuclear receptors), and VAV1 (a guanine nucleotide exchange factor involved in T- and B-cell development and activation, as well as in extravasation and migration of neutrophils in inflamed microvasculature; Phillipson et al. 2009) were among the genes associated with chronic periodontitis at subthreshold levels of significance (P < 0.05). In the same study, VAV1 was listed as the sixth-most strongly associated gene with moderate periodontitis (P = 4.4E-05), as were LHX6 (LIM home box protein 6; a transcriptional regulator of differentiation and development of neural and lymphoid cells) and DNMT3B (DNA [cytosine-5-]-methyltransferase 3 beta; a CpG methylation-promoting epigenetic modifier). Another recent genome-wide association study from Japan (Shimizu et al. 2015) identified IRF4 (interferon regulatory factor 4; a regulator of Toll-like receptor signaling) as being associated with periodontitis (P = 4.4E-04).
In addition, the in silico validation of our findings based on available ENCODE data for 7 MRs showed a substantial overlap between binding sites identified in ChIP-Seq experiments and regulon genes in our work, despite the fact that the ENCODE data originated from in vitro experiments using cell lines.
We acknowledge some important limitations of our work. Because of the cross-sectional nature of our genomic data set, the gingival lesions subjected to transcriptomic analyses encompassed a range of stages of periodontitis, including progression, quiescence, or repair. Moreover, the observed gene expression profiles in healthy and periodontitis-affected gingival samples are collectively attributed to heterogeneous cellular populations and inevitably influenced by the transcriptional signatures of prevalent/predominant cell types in health (e.g., epithelial cells and fibroblasts) and disease (“invading” inflammatory cells). Therefore, the identified MRs may be involved either in the transition from states of gingival health to periodontitis or in the maintenance of a state of established periodontal pathology. However, note that in our previous work that examined sequential gene activation during the induction and resolution of experimental gingivitis in an independent group of periodontally healthy volunteers (Jönsson et al. 2011), several MRs (including HCLS1, IKZF3, ETS1, NHLH2, POU2F3, RORA, XBP1, and TFAP2C) were found to be differentially expressed over time. Nevertheless, additional studies will be required to validate our findings (mechanistic experimentation involving knockout/knockdown cells or animals, confirmation of expression in independent patient cohorts, and longitudinal observations to distinguish MRs responsible for periodontitis induction versus maintenance of a pathologic phenotype) and ultimately assess their value as diagnostic, prognostic, or therapeutic targets in human periodontitis.
Author Contributions
A.D. Sawle, contributed to data acquisition, analysis, and interpretation, drafted the manuscript; M. Kebschull contributed to conception, design, data acquisition, analysis, and interpretation, critically revised the manuscript; R.T. Demmer contributed to conception and design, critically revised the manuscript; P.N. Papapanou, contributed to conception, design, data acquisition, analysis and interpretation, drafted and critically revised the manuscript. All authors gave final approval and agree to be accountable for all aspects of the work.
Footnotes
This work was supported by grants from the National Institutes of Health/National Institute of Dental and Craniofacial Research (DE015649, DE021820, DE024735) and by an unrestricted gift from Colgate-Palmolive Inc. to P.N.P.
The authors declare no potential conflicts of interest with respect to the authorship and/or publication of this article.
References
Supplementary Material
Please find the following supplemental material available below.
For Open Access articles published under a Creative Commons License, all supplemental material carries the same license as the article it is associated with.
For non-Open Access articles published, all supplemental material carries a non-exclusive license, and permission requests for re-use of supplemental material or any part of supplemental material shall be sent directly to the copyright owner as specified in the copyright notice associated with the article.