
Abstract
To improve patient dental care, it is necessary to identify possible risk factors for the failing of restorations. This practice-based cohort study investigated the performance and influence of possible risk factors at the level of the practice, patient, tooth, and restoration on survival of direct class II restorations. Electronic patient files from 11 Dutch general practices were collected, and 31,472 restorations placed between January 2015 and October 2017 were analyzed. Kaplan-Meier statistics were performed; annual failure rates (AFRs) were calculated; and variables were assessed by multivariable Cox regression analysis. The observation time of restorations varied from 0 to 2.7 y, resulting in a mean AFR of 7.8% at 2 y. However, wide variation in AFRs existed among the operators, varying between 3.6% and 11.4%. A wide range of patient-related variables is related to a high risk for reintervention: patient age (elderly: hazard ratio [HR], 1.372), general health (medically compromised: HR, 1.478), periodontal status (periodontal problems: HR, 1.207), caries risk and risk for parafunctional habits (high: HR, 1.687), restorations in molar teeth (HR, 1.383), restorations placed in endodontically treated teeth (HR, 1.890), and multisurface restorations (≥4 surfaces: HR, 1.345). Restorations placed due to fracture were more prone to fail than restorations placed due to caries. When patient-related risk factors were excluded, remaining risk factors considerably changed in their effect and significance: the effect of operator, age of the patient, and endodontic treatment increased; the effect of the diagnosis decreased; and the socioeconomic status became significant (high: HR, 0.873). This study demonstrated that a wide variation of risk factors on the practice, patient, and tooth levels influences the survival of class II restorations. To provide personalized dental care, it is important to identify and record potential risk factors. Therefore, we recommend further clinical studies to include these patient risk factors in data collection and analysis.
Introduction
Knowledge about factors influencing survival of direct class II restorations can improve patient care. Most clinical studies published on dental restorations aimed to evaluate the performance of new materials and techniques, often in a selected patient group from university clinics, with underpowering and too short observation times identified as possible problems (Opdam et al. 2018). Systematic reviews based on these type of studies resulted in excellent survival rates for composite restorations (Heintze and Rousson 2012).
Furthermore, in the last decade, there is increasing support for acknowledging that materials and their properties are not the decisive factors in restoration survival (Demarco et al. 2012). Clinical retrospective and practice-based studies were published showing that patient-related factors, such as caries risk and bruxism (Opdam et al. 2007; Opdam et al. 2010; van de Sande et al. 2013) as well as socioeconomic status (SES; Correa et al. 2013; Collares et al. 2018), are variables of main importance in restoration survival. Systematic reviews including patient-related risk factors showed that their influence on restoration performance is not only significant but also relevant, demonstrating hazard ratios (HRs) from 2.5 to 8.3 (Opdam et al. 2014; van de Sande et al. 2016). Besides patient-related factors, dentist factors, such as personal skills and treatment decisions (Laegreid et al. 2014; Laske et al. 2016a; Collares et al. 2017) and health insurance policies (Khalaf et al. 2014), may play a significant role in the survival of restorations placed in general practice as well.
To improve patient dental care, it is necessary to identify possible risk factors for the failing of restorations. Therefore, we set up a study to investigate a large data set of restorations placed in a general practice environment and general population, but most important, it included a wide range of possible variables on the patient level. There were reports published on these big data (Lucarotti et al. 2005; Laske et al. 2016a; Raedel et al. 2017); however, these studies were hampered by their retrospective nature and their failure to include possible risk factors for restoration performance in the analysis, as general dental practitioners (GDPs) did not include these factors in the patient files.
The growing tendency toward more personalized care in dentistry (Garcia et al. 2013) and the public demand for transparency and shared decision making (Main and Adair 2015) drive the need for GDPs to extend information in electronic patient files (EPFs) as well as identify risk factors on the patient level. In the Netherlands, a country where almost all dental practices use EPFs and patients are loyal to their GDPs, it was possible to analyze restoration performance for identification of possible risk factors for survival.
The aim of this study was to investigate the influence of possible risk factors—at the level of practice, patient, tooth, and restoration—on the longevity of direct class II restorations.
Materials and Methods
Inclusion and Data Collection
Data from EPFs of general practices joining a practice-based research group were the basis of this cohort study. Data on direct class II restorations placed between January 1, 2015, and January 10, 2017, were digitally extracted, transformed into anonymized Excel files, and sent to the researchers with an application designed by the involved software firm (Exquise). Data validation was performed by visiting all practices and checking 200 randomly selected patient files on data transition failures. Exclusion criteria were as follows:
Practitioners with <250 restorations
Patients not visiting for check-ups at least once a year
Restorations with missing data on restorative materials or patients’ zip codes
The study design and protocol were approved by the local ethics committee (METC; CMO Arnhem-Nijmegen file 2015-1565).
Outcome Parameters
Dates of class II restoration placement, last check-up visits, and reintervention were recorded. When no intervention was performed on a restoration, it was considered successful and censored at the last check-up date. When a new restoration was placed in the same tooth, including ≥1 surfaces of the previous restoration, this was defined as an intervention on the restoration and considered a failure. Regardless of the diagnosis, extraction, endodontic, and prosthetic treatments were considered as failures. Exceptions were as follows:
Restorative interventions in the first month were ignored, and initial restoration observation was censored.
When a crown was placed within 1.5 y after initial direct restoration, this restoration likely served as a base for a crown placement and was censored.
When a mesial occlusal restoration was placed as the first restoration and the intervention treatment was a distal occlusal restoration, analysis for the initial restoration was censored, as many mesial and distal occlusal restorations are likely independent restorations (box type).
Independent Variables
On a practice level, the individual practitioner who placed the restoration was coded. On a patient level, sex, age, SES, general health score, periodontal status, oral hygiene (based on the amount of plaque: poor/average/good), caries risk (low/high), presence of parafunctional habits (yes/no), and the presence of a removable denture (yes/no) were recorded. Patients were divided into 6 age groups. SES scores were provided by the Dutch Central Office for Statistics based on zip code; 3,546 areas were ranked; and patients were categorized into low, medium, and high SES. General health status was based on the classification of the American Society of Anesthesiologists (Doyle and Garmon 2017): healthy (score 1), medically compromised (score 2), and severely medically compromised (score ≥3). Periodontal status was based on the Dutch Periodontal Screening Index (Van der Velden 2009) resulting in scores A (bleeding on probing and/or calculus), B (pockets 4 to 5 mm without recession), and C (pockets 4 to 5 mm with recession or pockets ≥6 mm). High caries risk was scored according to the presence of active lesions, number of new caries lesions (≥1 new caries lesions in the last year), and frequent sugar consumption. Low risk was assigned to patients without active lesions and new caries lesions (last restoration due to caries ≥2 y ago) and with sufficient plaque control (Mettes et al. 2010). Due to the lack of guidelines and protocols, the assessment of parafunctional habits was based on the following question: Is there nonphysiologic wear visible on teeth or restorations? This item also considered indicators such as exposed dentin, distinctive wear facets, fractures of restorations or teeth, and hypertrophic chewing muscles.
On the tooth level, tooth number, number of restored surfaces, existing endodontic treatment (yes/no), applied restorative material, adhesive system used, and diagnosis for placing restorations were recorded. The dental practitioners were invited by the software to select the best matching diagnosis from a list:
Caries on unrestored surface
Caries on previously restored surface
Fracture of the tooth or restoration
Wear of the tooth or restoration
Fracture prevention
Restoration after endodontic treatment
Aesthetic demands
Orthodontic retainer
Dislodged restoration
Insufficient proximal contact
Poor marginal adaptation
Trauma
Cracked tooth
GDPs were completely free to use restorative materials at their discretion. From January 12, 2015, until January 2, 2017, the Clearfil Majesty ES-2 hybrid resin composite, Clearfil SE Bond, and Clearfil Protect Bond (all from Kuraray Noritake) were provided to the practitioners for free. Treatments were regularly carried out with the assistance of a dental nurse, and only a few practitioners used rubber dam isolation during restoration placement.
Statistical Analysis
Statistical analyses were performed with SPSS 22 (IBM) and R 3.4.0. Longevity of restorations was explored with survival tables and Kaplan-Meier graphs. Based on the survival tables, mean annual failure rates over 2 y (AFR2) were calculated according to the following formula: AFR2 (%) =
To explore impact of risk factors on restoration survival, a multilevel Cox regression analysis was conducted with clustering of data for patients with multiple restorations. The method described by Chuang et al. (2001) to produce statistically valid standard errors for the estimates of survival was performed.
To investigate the impact of patient-related factors on direct restoration survival, the Cox regression was repeated with the individual patient characteristics excluded from the analysis, except for the age factor. When the P value of an independent variable in both Cox regressions met the significance level of <5%, the percentage difference between the HRs was calculated by the following formula: y = [(x/z) – 1] × 100, in which y expresses the percentage difference, x is the HR of the significant independent variable in the multiple Cox regression with the patient factors excluded, and z is the HR of the significant independent variable in the multiple Cox regression with the patient factors included.
Chi-square tests were used (P ≤ 0.05) to calculate the relation between diagnosis for placing a restoration and the patient’s risk profile.
Results
Restorations placed by 22 GDPs (13 men, 9 women) in 11 practices were included: mean age, 44.4 y (95% CI, 31.7 to 57.1); mean time since graduation, 17.2 y (95% CI, 6.7 to 27.7). In advance, restorations were excluded due to missing zip code (n = 5), missing data on restorative material (7,697 restorations), no yearly follow-up (378 patients), or placement by practitioners who performed <250 restorations (714 restorations). Included in the final data set were a total of 31,472 class II restorations placed in 14,909 patients (7,377 male; 7,532 female; mean age, 44.1 y). The mean number of included restorations per patient was 2.11 (95% CI, 1.34 to 2.88). The observation period varied between 0 and 33 mo (mean observation time, 9.2 mo). The collected data from these patients were considered homogeneous and suitable for multivariable regression analysis.
The mean calculated AFR2 was 7.8% (95% CI, 7.6% to 8.0%), and survival was 85.1% after 2 y. Table 1 shows the diagnoses for the intervention performed first. New direct restoration placement due to caries was the most common intervention, followed by an endodontic treatment.
Diagnoses of the First Performed Interventions.
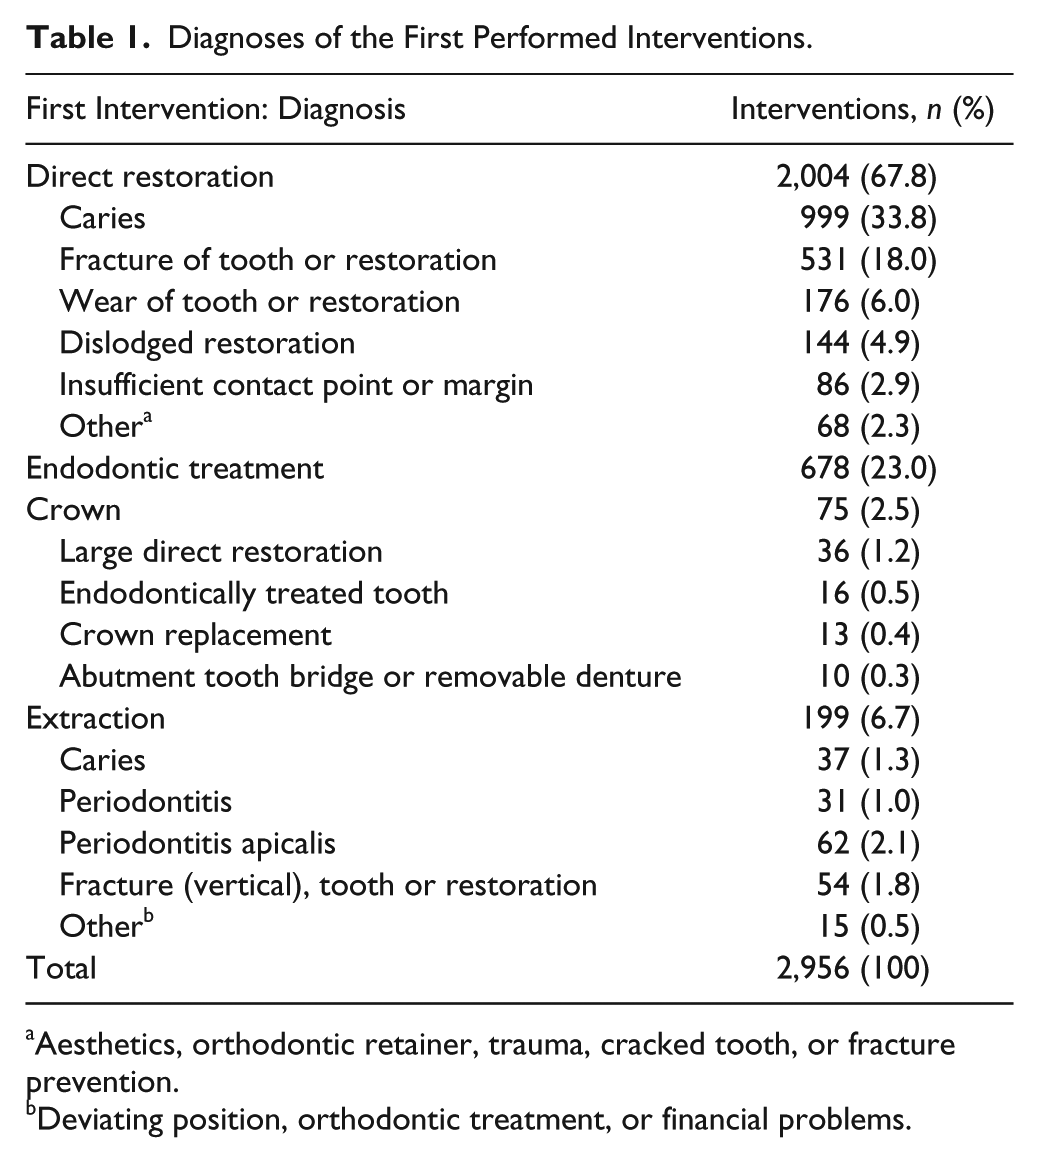
Aesthetics, orthodontic retainer, trauma, cracked tooth, or fracture prevention.
Deviating position, orthodontic treatment, or financial problems.
Table 2 describes the results of the descriptive statistics; annual failure rates (after 2 y); the adjusted multivariable regression analysis for the practice-, patient-, tooth-, and restoration-related variables; and the regressions analysis with the exclusion of individual patient factors.
Statistical Analysis of Practice-, Patient-, and Tooth/Restoration-Related Variables on Restoration Survival.
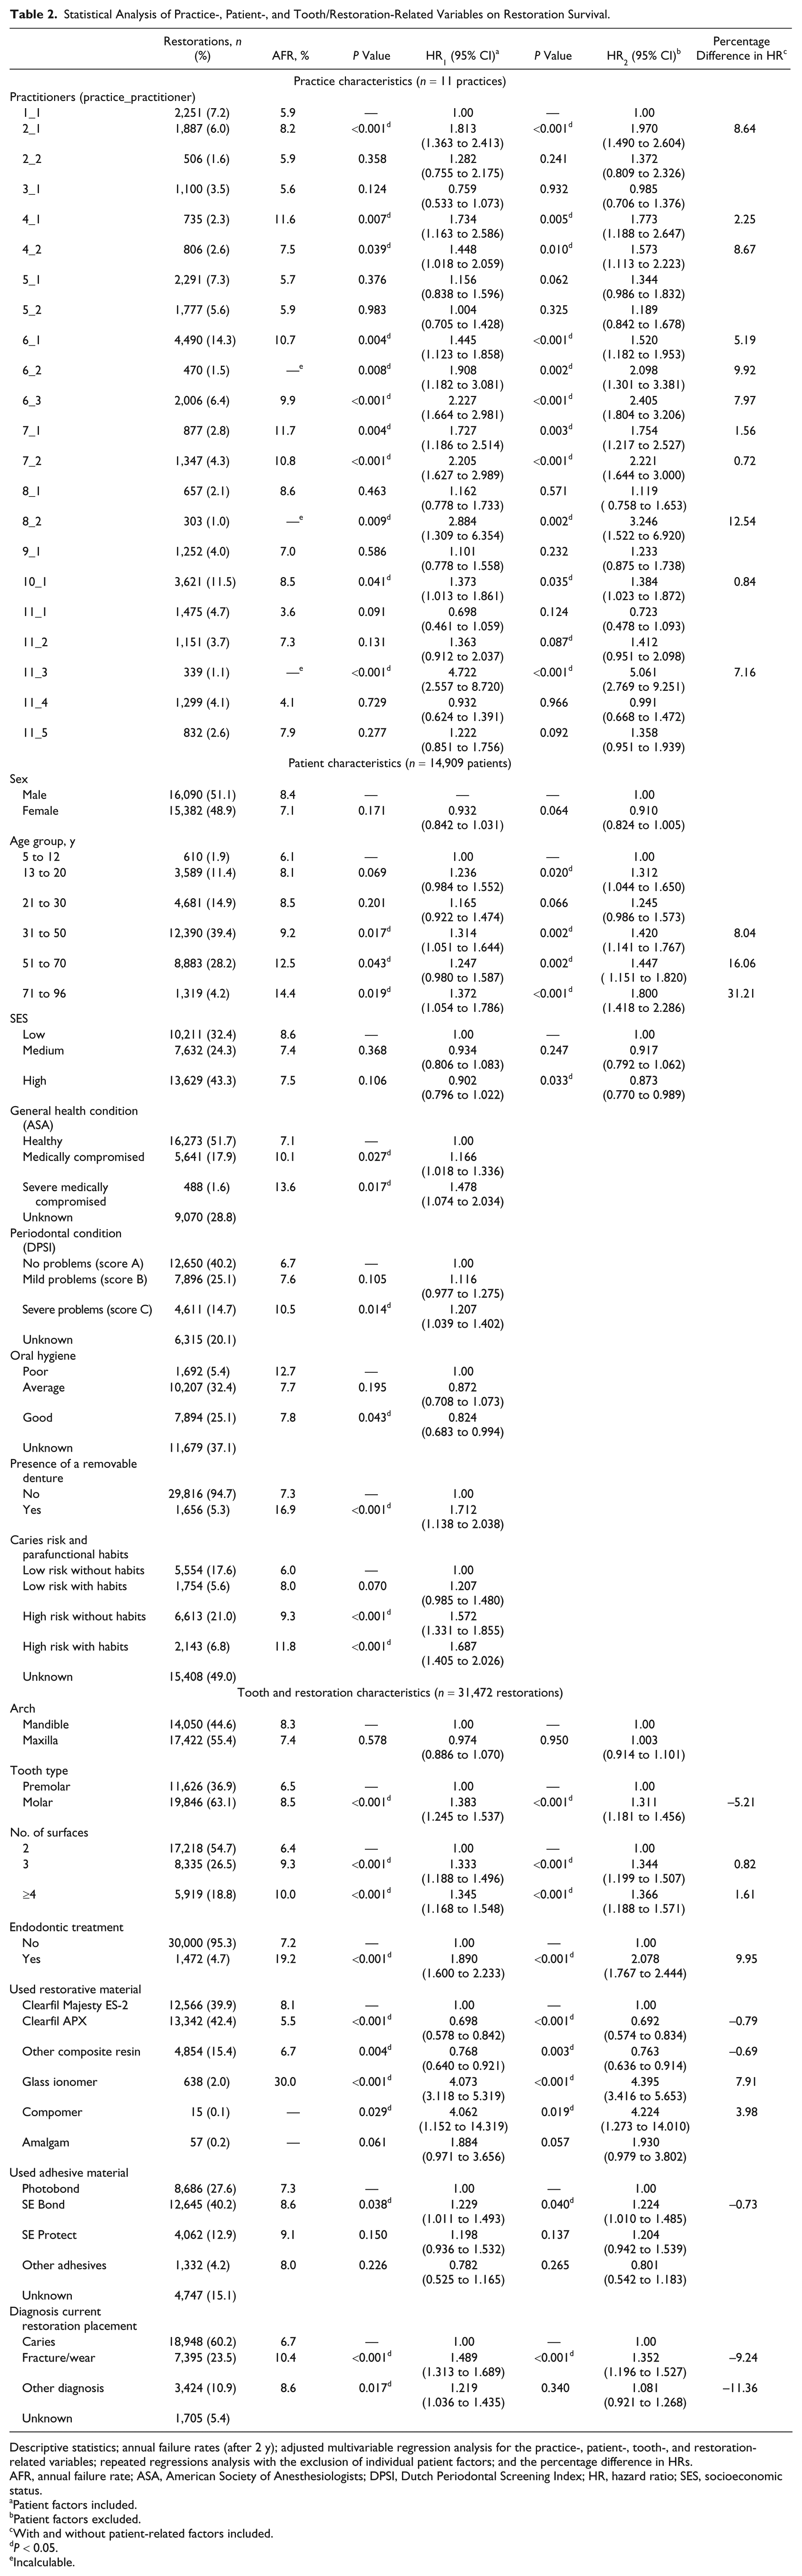
Descriptive statistics; annual failure rates (after 2 y); adjusted multivariable regression analysis for the practice-, patient-, tooth-, and restoration-related variables; repeated regressions analysis with the exclusion of individual patient factors; and the percentage difference in HRs.
AFR, annual failure rate; ASA, American Society of Anesthesiologists; DPSI, Dutch Periodontal Screening Index; HR, hazard ratio; SES, socioeconomic status.
Patient factors included.
Patient factors excluded.
With and without patient-related factors included.
P < 0.05.
Incalculable.
Practice/Operator-Related Factors
Wide variations in AFR2 and HR were found among practitioners and practices. AFR2 among practitioners ranged from 3.6% to 11.7%. The practitioner effect on restoration survival strengthened when individual patients factors were eliminated from the regression analysis.
Patient-Related Factors
Children and adolescents showed the longest restoration survival, while a shorter survival was found for elderly. Restorations placed in medically compromised patients or patients with considerable periodontal disease were more susceptible for failure. A high caries risk (HR = 1.572) and the presence of parafunctional habits (HR = 1.207) resulted in a higher risk for restoration failure, which further increased for patients having both these risk factors (HR = 1.687). Figure 1 shows the Kaplan-Meier graphs of these 4 risk groups. The presence of a partial or full removable denture also strongly compromised restoration survival.
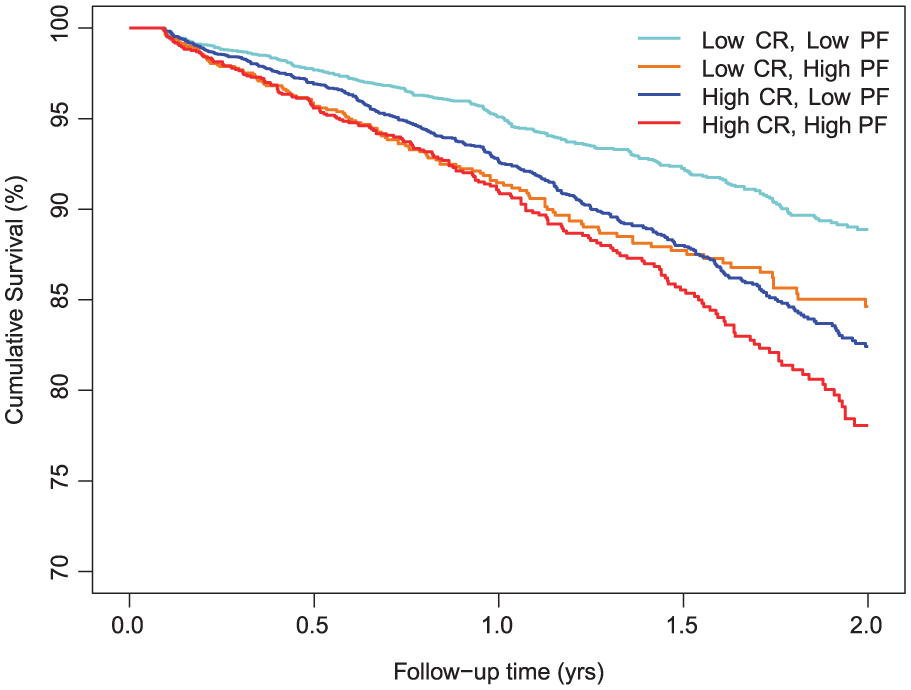
Survival graph of restorations divided by caries risk (CR) and presence of parafunctional habits (PF).
Comparing the HRs from the Cox regression with and without individual patient factors included showed that the effect of patient age on restoration survival increased when other individual patient factors were eliminated from the regression.
Table 3 shows that almost 78% of all restorations within the high caries–risk group were placed due to caries. Moreover, almost 46% of all restorations within the group of patients with parafunctional habits and a low caries risk profile were placed due to fracture or wear (χ2 test, P < 0.001).
Percentages of the Diagnoses of Current Restoration Placement among the Risk Groups (Caries and Parafunctional Habits).
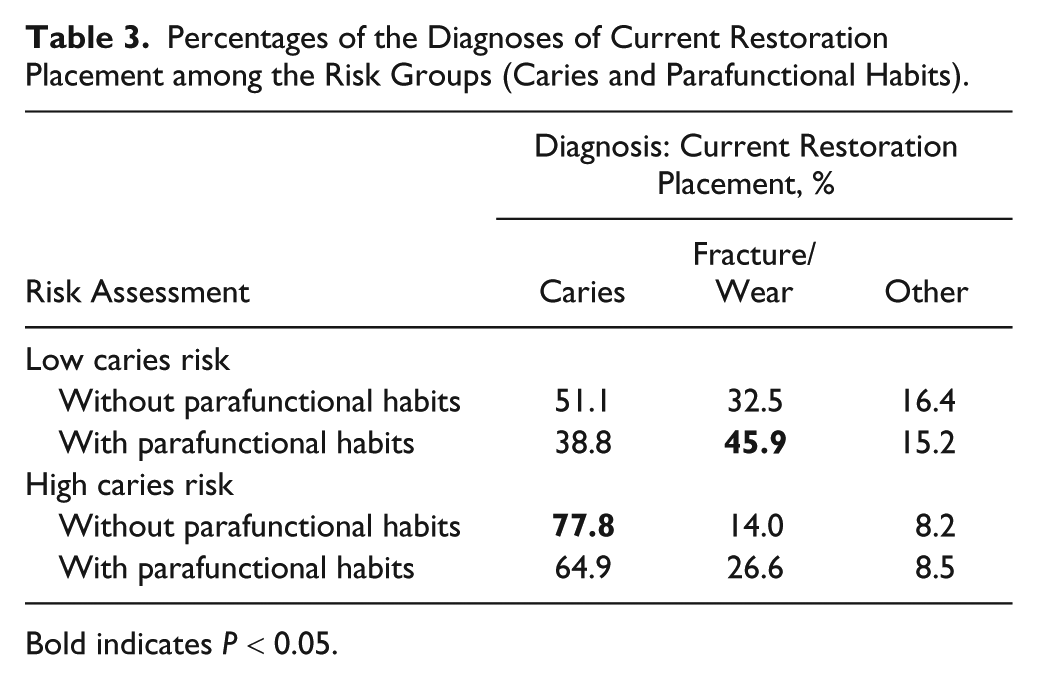
Bold indicates P < 0.05.
Tooth/Restoration-Related Factors
Restorations showed better survival in premolars than in molars (HR = 1.383). Most restorations were 2-surface restorations, and the AFR2 and HR increased with an increasing number of surfaces. The AFR2 was 7.2% for nonendodontically treated teeth and 19.2% for endodontically treated teeth (HR = 1.890). In the Cox regression, the highly filled composite resin APX (Kuraray Noritake) showed the lowest AFR2 (5.5%) and the lowest risk for failure. Restorations placed with the 3-step etch-and-rinse adhesive Photobond/SA Primer (Kuraray Noritake) performed better than those placed with self-etching SE Bond (HR = 1.229). Moreover, restorations placed due to fracture were more prone to fail than restorations placed due to caries (HR = 1.489). Table 4 shows that the most frequent diagnosis for an intervention on a restoration placed due to caries is an endodontic treatment (χ2 test, P < 0.001). Restorations that were placed due to fracture or wear most likely failed due to fractures or wear again (χ2 test, P < 0.001).
Percentages of the Diagnoses of Current Restoration Placement in Relation to the Diagnoses of the First Intervention.
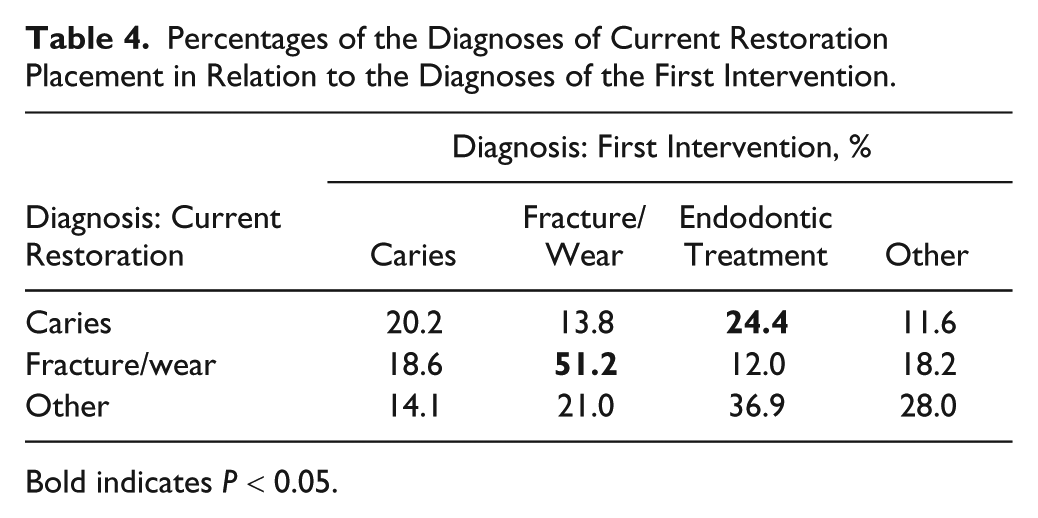
Bold indicates P < 0.05.
Comparing HRs from the Cox regression with and without individual patient factors included showed a divided effect on tooth- and restoration-related factors. The influence of an endodontic treatment on restoration survival increased when patient characteristics were excluded, while the effect of the diagnoses decreased.
Discussion
This practice-based cohort study is the first to extensively evaluate the clinical performance of direct restorations related to a variety of potential risk factors. The results showed that the operator, individual patient risk factors (e.g., age, general health score, periodontal status, caries risk, and risk for parafunctional habits), tooth-related factors, and the diagnosis of the restoration all influence direct restoration survival.
In this study, we were capable of extracting extensive data from the patient files. However, many EPFs were incompletely documented and resulted in missing data, which is a limitation of this study. Traditionally, EPFs in dentistry were mainly used for billing purposes and limited to tooth number and surfaces as obligatory data. For this study, operators were invited and encouraged to complete EPFs with risk assessment, applied materials, and diagnosis of the restoration. As could be expected, dentists did not succeed in collecting all required data for all patients and treatments. The imputation of missing data as performed in this analysis was considered the best choice for dealing with this shortcoming. Performing analyses on complete cases only would likely result in exclusion bias and loss of power.
Still we have to be careful about interpreting results, as many grounds for bias are included, such as differences among practitioners in risk assessments, treatment choices, and EPF handling, as well as the operator and evaluator being the same person. Moreover, this study, with a relatively short observation time, may suffer from “data pollution,” caused by temporary restorations and specific declaration aspects related to the reimbursement system in the Netherlands. Especially for research purposes, calibration and accurateness among operators should be done more extensively, but we chose a gradual process of dentists being encouraged and educated to improve their assessments and clinical handling based on the results of their own work.
The main finding of this study is that a plethora of risk factors, especially patient-related variables, is associated with restoration failure. Previous studies identified several of these risk factors, such as SES (Correa et al. 2013), general health, periodontal status (Adolphi et al. 2007), oral hygiene (Kopperud et al. 2012), high caries risk (Kopperud et al. 2012; van de Sande et al. 2013), and parafunctional habits (van de Sande et al. 2013; Pallesen and van Dijken 2015). Moreover, restoration size (Lucarotti et al. 2014; Laske et al. 2016b) and the presence of an endodontic treatment (Laske et al. 2016b) were found as risk factors for survival.
A wide range in operator AFR2 was found, varying between 3.6% and 11.7%, an effect that was confirmed in the Cox regression. This is remarkable in that all included dentists are motivated above average to provide high-quality care. As indicated in our previous retrospective study (Laske et al. 2016b), the observed differences may be related to operator skills, clinical experience, sex, and age, but it could also be related to practice organization, intervention choices by the dentists, and different patient needs and demands. The number of dentists was too low to investigate on dentist-related variables, such as age and university. More extensive data collection and further research are needed on these aspects.
An interesting finding is that by leaving out the patient-related risk factors, remaining risk factors considerably changed in their effect and significance. Many risk factors seemed to be interrelated, and their effect changed depending on the other risk factors in the analysis. Illustrative is the effect of SES, which demonstrated significance between high and low levels in the absence of patient-related risk factors in the analysis (Table 2), suggesting that the excluded variables are incorporated in the SES. When patient factors were excluded, the effect of the operator increased, suggesting that profiles of the patients were different among practitioners such that the dentist effect could be due to some patient-related risks that were unmeasured or not yet identified. These findings reinforce the need to identify, record, and include as many potential risk factors in the statistical analysis.
In this study, there was a clear relation between the diagnosis for restoration failure and the risk group, as shown in Tables 3 and 4. This indicates that the risk assessment as performed by the GDP makes sense, and dentists are able to identify these risks, although differences among dentists are likely to occur. The further-increased failure rate when both parafunctional habits and caries were present was also demonstrated by van de Sande et al. (2013). However, deep caries lesions, when restored, may result in early failure due to pulpitis complaints resulting in an endodontic treatment, which is a well-known early failure in restorative dentistry (Opdam et al. 2014). Therefore, the considerably high amount of endodontic failures related to caries seems logical and related to the short observation time of the present study.
Generally, this study showed a considerably higher failure rate than that found in many controlled clinical studies. Although we should take into consideration that the pressure of routine general dentistry could have reduced the quality of placed restorations, a likely factor that explains the higher failure rate is that 65.4% of the patients assessed on risk factors were scored as high risk for caries and/or parafunctional habits. Another study based on the same patient population (Signori et al. 2018) found that the majority of restorative work by these practitioners was performed on patients with high caries risk. A much higher AFR can be expected in a nonstudy setting as compared with a controlled trial in a university clinic, where such high-risk patients are often excluded in data analysis (Opdam et al. 2018). Signori et al. (2018) also showed that many restorations replaced due to caries indeed had caries lesions in need of restorative treatment. Some discolored margins might be overdiagnosed as caries, but we expect that this number will be limited. Differences among restorative materials were also identified in this study, especially compomer and glass ionomer restorations, which showed shorter survival than that of composite restorations. However, amalgam was hardly used (n = 57), and compomer and glass ionomer were often used for temporary fillings. Future analysis with an extended observation time focusing on composite restorations may show more accurate survival data and would be more appropriate to discuss at that moment.
This study demonstrated that a wide variation of risk factors on the practice, patient, and tooth levels influences the survival of class II restorations. To provide personalized oral health care, it is important to identify and record potential risk factors and adjust a treatment to the needs of the patient. Further clinical studies on dental treatment results should preferably include these risk factors in data collection and analysis. Especially for future randomized clinical trials on specific questions (e.g., comparison of 2 materials), it seems imperative to include these patient variables and deal with the risk factors in a multivariable analysis. As an alternative, patients with specific risk factors could be excluded to create a homogeneous patient population, but this might reduce the clinical relevance of the study.
Author Contributions
M. Laske, contributed to conception, design, data acquisition, analysis, and interpretation, drafted and critically revised the manuscript; N.J.M. Opdam, contributed to conception, design, data acquisition and interpretation, drafted and critically revised the manuscript; E.M. Bronkhorst, contributed to design, data analysis and interpretation, drafted and critically revised the manuscript; J.C.C. Braspenning, contributed to design and data interpretation, drafted and critically revised the manuscript; M.C.D.N.J.M. Huysmans, contributed to conception, design, and data interpretation, drafted and critically revised the manuscript. All authors gave final approval and agree to be accountable for all aspects of the work.
Footnotes
Acknowledgements
We acknowledge the general dental practices for putting their data at our disposal and for participating in the practice network meetings. We and the general dental practitioners thank Kuraray Europe Benelux for providing Majesty ES-2, SE Bond, and SE Protect. We also thank Exquise for making it possible to extract the data digitally from the electronic patient files.
The authors received no financial support and declare no potential conflicts of interest with respect to the authorship and/or publication of this article.