
Abstract
The identification of metal ions and particles in the vicinity of failed implants has raised the concern that biomedical titanium alloys undergo corrosion in healthy and infected tissues. Various surface modifications and coatings have been investigated to prevent the deterioration and biocorrosion of titanium alloys but so far with limited success. Graphene is a cytocompatible atom-thick film made of carbon atoms. It has a very high surface area and can be deposited onto metal objects with complex shapes. As the carbon lattice has a very small pore size, graphene has promising impermeability capacity. Here, we show that graphene coating can effectively protect Ti-6Al-4V from corrosion. Graphene nanocoatings were produced on Ti-6Al-4V grade 5 and 23 discs and subjected to corrosive challenge (0.5M NaCl supplemented with 2-ppm fluoride, pH of 2.0) up to 30 d. The linear polarization resistance curves and electrochemical impedance spectroscopy analysis showed that the graphene-coated samples presented higher corrosion resistance and electrochemical stability at all time points. Moreover, the corrosion rate of the graphene-coated samples was very low and stable (~0.001 mm/y), whereas that of the uncoated controls increased up to 16 and 5 times for grade 5 and 23 (~0.091 mm/y) at the end point, respectively. The surface oxidation, degradation (e.g., crevice defects), and leaching of Ti, Al, and V ions observed in the uncoated controls were prevented by the graphene nanocoating. The Raman mappings confirmed that the graphene nanocoating presented high structural stability and resistance to mechanical stresses and chemical degradation, keeping >99% of coverage after corrosion challenge. Our findings open the avenues for the use of graphene as anticorrosion coatings for metal biomedical alloys and implantable devices.
Keywords
Introduction
Titanium and its alloys (e.g., Ti-6Al-4V) are used for the fabrication of biomedical and dental implantable devices owing to their ability to integrate with native bone and their high mechanical properties (Liu et al. 2017). A meta-analysis showed cumulative survival rates (without intervention) for dental implants of approximately 76% over 6 y (Iqbal and Kim 2007). Patient factors (infection or inflammation) are major causes for failure. Nevertheless, implant-related issues such as superficial modification, design, fracture, and overloading also decrease success rate (Appendix). Concern has been increasing about impurities in the alloy, irregularities in the oxide layer, functional stresses, and friction during treatment of diseased implant sites, which can increase fatigue, wear, degradation, and crevice corrosion (Sridhar et al. 2016; Hedberg 2018; Sikora et al. 2018). Additionally, implants can be exposed to biofilms that reduce the environmental pH through oxygen-coupled metabolic activities (Fukushima et al. 2014). These factors challenge the passivation of titanium-based implants, thereby promoting its deterioration (Fretwurst et al. 2016; Hedberg 2018).
Recent clinical studies suggest that titanium implants release ions and metal oxide nanoparticles into neighboring tissues, even in the absence of wear and despite being regarded as virtually insoluble. These can be associated with foreign bodies’ reactions that lead to unhealthy tissues (Fretwurst et al. 2016; Fretwurst et al. 2018). A postmortem study with 4 human subjects confirmed the presence of titanium particles in the jawbone marrow tissues in the vicinity of dental implants (He et al. 2016). A pilot study with 12 patients with peri-implantitis showed traces of titanium in soft and hard tissue biopsies with proinflammatory M1 macrophages and lymphocytes (Fretwurst et al. 2016). A study that evaluated the submucosal plaque from 30 patients showed that implants with peri-implantitis had larger levels of titanium (ng/µL of plaque) as compared with healthy ones (Safioti et al. 2017). A pilot study with 30 patients observed traces of metal in epithelial cells and macrophages in cytologic smears of peri-implant mucosa of patients with and without peri-implantitis (Olmedo et al. 2013). Peri-implant deep soft tissue biopsies from 3 patients (2 biopsies each) presented traces of titanium (7.3 to 38.9 μM) as shown by inductive coupled plasma–atomic emission spectroscopy (ICP-AES; Pettersson et al. 2017). These observations may be potential contributors to undesired tissue reactions and bone loss around implants (Fretwurst et al. 2018).
Various surface modifications have been attempted to prevent the corrosion and deterioration of titanium but had limited success. For instance, nitrogen ion implantation decreases the corrosion rate (CR) of titanium alloys but fails to prevent ion release (133 ng/cm2 at 1,000 h in isotonic chloride solution, pH 7.4; Ion et al. 2014). Hydroxyapatite-based coatings alter the original implant architecture, present unfavorable mechanical properties, and can detach over time (Borsari et al. 2005; Duan et al. 2012). The positive of metal-binding peptides is critically dependent on their concentration and delivery methods (Muruve et al. 2017). Hence, the development of reproducible and stable coatings that prevent corrosion and metallic ion release is of considerable interest.
Graphene is a 2-dimensional hexagonal monolayer (0.335 nm thick) of carbon atoms that can be synthesized in pure form (Geim and Novoselov 2007). Pristine graphene can be produced by chemical vapor deposition, a scalable method of producing large-scale, high-quality graphene (Kauling et al. 2018). Graphene film is cytocompatible and promotes osteoblastic differentiation (Morin et al. 2017; Xie et al. 2017; Dubey et al. 2018; Xie et al. 2019). It can be transferred via several techniques onto different substrates (e.g., dental implants, locking and compression plates) and materials (e.g., titanium alloys, stainless steel; Morin et al. 2017; Rodriguez et al. 2017). Graphene retains its integrity and structural characteristics even upon exposure to water, biomolecules, and human cells (Velický et al. 2015; Morin et al. 2017).
Graphene has promising characteristics for anticorrosion applications. Its hexagonal sp2 atomic network of carbon atoms is 0.335 nm thick and is separated by 1.42 Å with a lattice constant of 2.46 Å (Gass et al. 2008). Given the van der Waals radius of carbon (0.11 nm), the geometric pore size of the hexagon is 0.064 nm, which is smaller than the van der Waals diameters of hydrogen and helium (0.28 and 0.314 nm, respectively; Berry 2013), thereby accounting for graphene’s impermeability. Moreover, the repelling field created by the high electron density (π cloud) does not allow the passage of molecules even at 5 atm at room temperature (Bunch et al. 2008). These characteristics provide graphene promising potential to prevent the corrosion and degradation of biomedical titanium alloys. Here, we show that the application of graphene-based nanocoating prevents the corrosion, ion leaching, and electrochemical degradation of Ti-6Al-4V grades 5 and 23.
Materials and Methods
Graphene Production and Sample and Corrosion Medium Preparation
Ti-6Al-4V alloy was used as it allows one to assess 3 elements (Ti, Al, and V) at once, improving the robustness of the assessments. To confirm that the protective potential from the graphene nanocoating is not grade specific, we tested 2 grades—namely, 5 (ASTM F1472) and 23 (ASTM F136). Grade 23 has low oxygen content (≤0.13%), which confers higher fracture toughness, improved ductility, but decreased tensile strength.
Disc-shaped specimens (12-mm diameter, 1-mm thickness; United Performance Metals) were polished up to P2500 SiC at 20 N (PlanarMet 300 and CarbiMet; Buehler) to an arithmetic roughness average (Ra) of 0.05 ± 0.02 µm, as determined by contact profilometry (Surftest-SJ-500/P; Mitutoyo). The samples were cleaned in an ultrasonic bath with acetone (30 min) and deionized water (15 min) and kept in desiccator for 24 h. Graphene was manufactured by chemical vapor deposition on a copper foil (10 × 2.5 cm2) with a custom-built furnace in a class 1,000 cleanroom (Agarwalla et al. 2019). The successful production of graphene on copper and its transfer on both sides of Ti-6Al-4V discs were confirmed by Raman spectroscopy (WITec). The graphene-coated discs were labeled Gp5 and Gp23, and the controls (uncoated) were C5 and C23. The manufacturing, transfer, and characterization methods are available in the Appendix.
To select a corrosion solution, we performed a preliminary study where C5 and C23 were soaked in different solutions for 30 d, and elemental release (titanium, aluminum, and vanadium) was checked with ICP-AES (Optima 5300DV, Perkin Elmer; methodology and results in the Appendix). The most corrosive medium was selected for subsequent assays—namely, NaCl/F (0.5M NaCl, analytic grade [Sigma-Aldrich]; 2-ppm fluoride [Specpure F ion chromatography standard solution; VWR International]; pH, 2.0 ± 0.2).
Characterization of Anticorrosion Potential
The graphene-coated and control samples were soaked in corrosion medium for 30 d to assess the changes in surface morphology and elemental composition of the alloys. Changes in Ra were recorded with a stylus profilometer (Mitutoyo), and data reliability was confirmed by the Raman spectra obtained before and after the measurements (Appendix Fig. 5). The surfaces were imaged with a field emission scanning electron microscope (JSM-6701F; JEOL) in secondary electron and backscattering electron mode with 20-kV beam voltage at 3,000 magnification, and the surface elemental composition for titanium, aluminum, vanadium, and oxygen was identified by energy-dispersive x-ray (INCAEnergy+; Oxford Instruments). Surface wettability was determined by water contact angle with an automatic drop shape analyzer (DSA25; KRÜSS GmbH). The corrosion solution was characterized for pH variation (Orion; Thermo Fisher Scientific) and elemental release. The methodologies and results are available here and in the Appendix.
The electrochemical properties were determined for the samples exposed to the corrosion medium up to 14 d with linear polarization resistance curves and electrochemical impedance spectroscopy (EIS), as described in the Appendix. Briefly, a 3-electrode system was used with Ag/AgCl as the reference electrode. Linear polarization resistance was performed from −1.5 to 1.2 V at a scan rate of 0.2 mV/s. EIS was performed at an open circuit potential (OCP) from 10 kHz to 0.01 MHz.
Statistical Analysis
Three independent samples were used for all tests. The data were normally distributed (Shapiro-Wilk normality test). Statistical analyses were performed with a 1-sample t test (control vs. graphene-coated discs for the same grades) and a paired t test (pre- vs. postimmersion), with a preset significance level of 5% (SPSS 22.0; IBM).
Results
Graphene Nanocoating Characterization
The successful growth of graphene and its transfer onto Ti-6Al-4V discs were confirmed by Raman spectroscopy (Appendix Figs. 2A and 8). To this end, the G and 2D peaks were identified and mapped from 5 random 30-µm2 areas. Copper can elicit toxic reactions and interfere with electrochemical measurements. The x-ray photoelectron spectroscopy results confirmed that the graphene film was free of copper residues after ammonium persulfate etching (Appendix Fig. 2B). The coverage yield was ≥99% for a single transfer procedure for both grades. The I2D:IG ratio from the mappings was >1.8, which is a characteristic of single-layer graphene (Appendix Table 2).
Electrochemical Analysis
The anodic and cathodic polarization curves and electrochemical parameters from the Tafel analysis are shown in Figure 1 and Table 1. First, the graphene nanocoating shifted the OCP anodically by 0.50 ± 0.07 V for Gp5 and by 0.47 ± 0.10 V for Gp23 (where the error represents the standard deviation) relative to that of the reference samples C5 and C23 (uncoated). A similar trend was observed for anodic OCP at all immersion periods for the graphene-coated samples (Fig. 1A–C). Second, a well-defined course of anodic polarization (i.e., constant corrosion current density [jcorr] over a decade range of tested anodic voltage) suggested passivity of both graphene-coated samples.
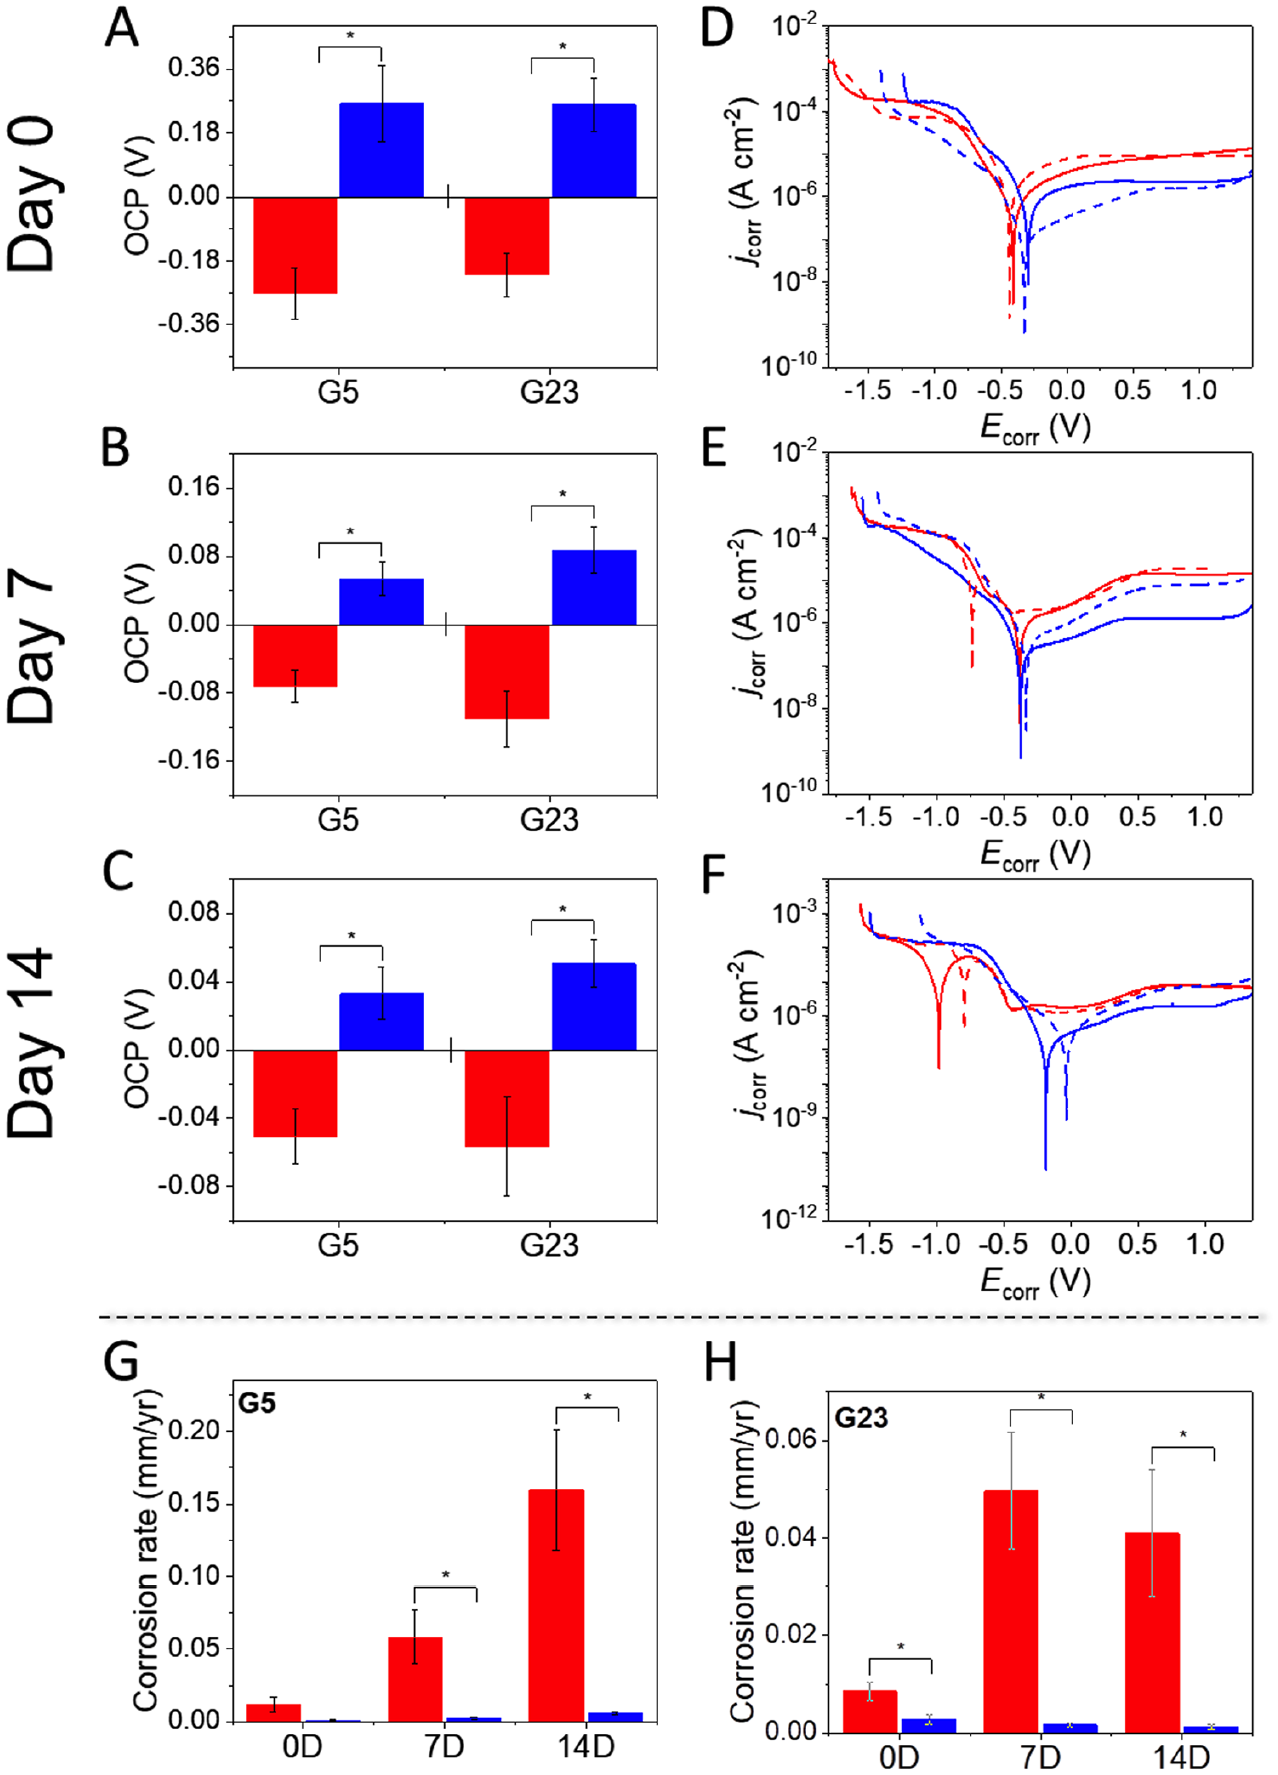
Open circuit potential (OCP) of Ti-6Al-4V grade 5 (G5) and grade 23 (G23) with graphene nanocoating (blue) and uncoated controls (red). The graphene-coated samples presented anodic OCP at all the immersion periods (
Tafel Analysis and Simulated Parameters of Electrochemical Elements at 0-, 7-, and 14-d Immersion in Corrosion Media.
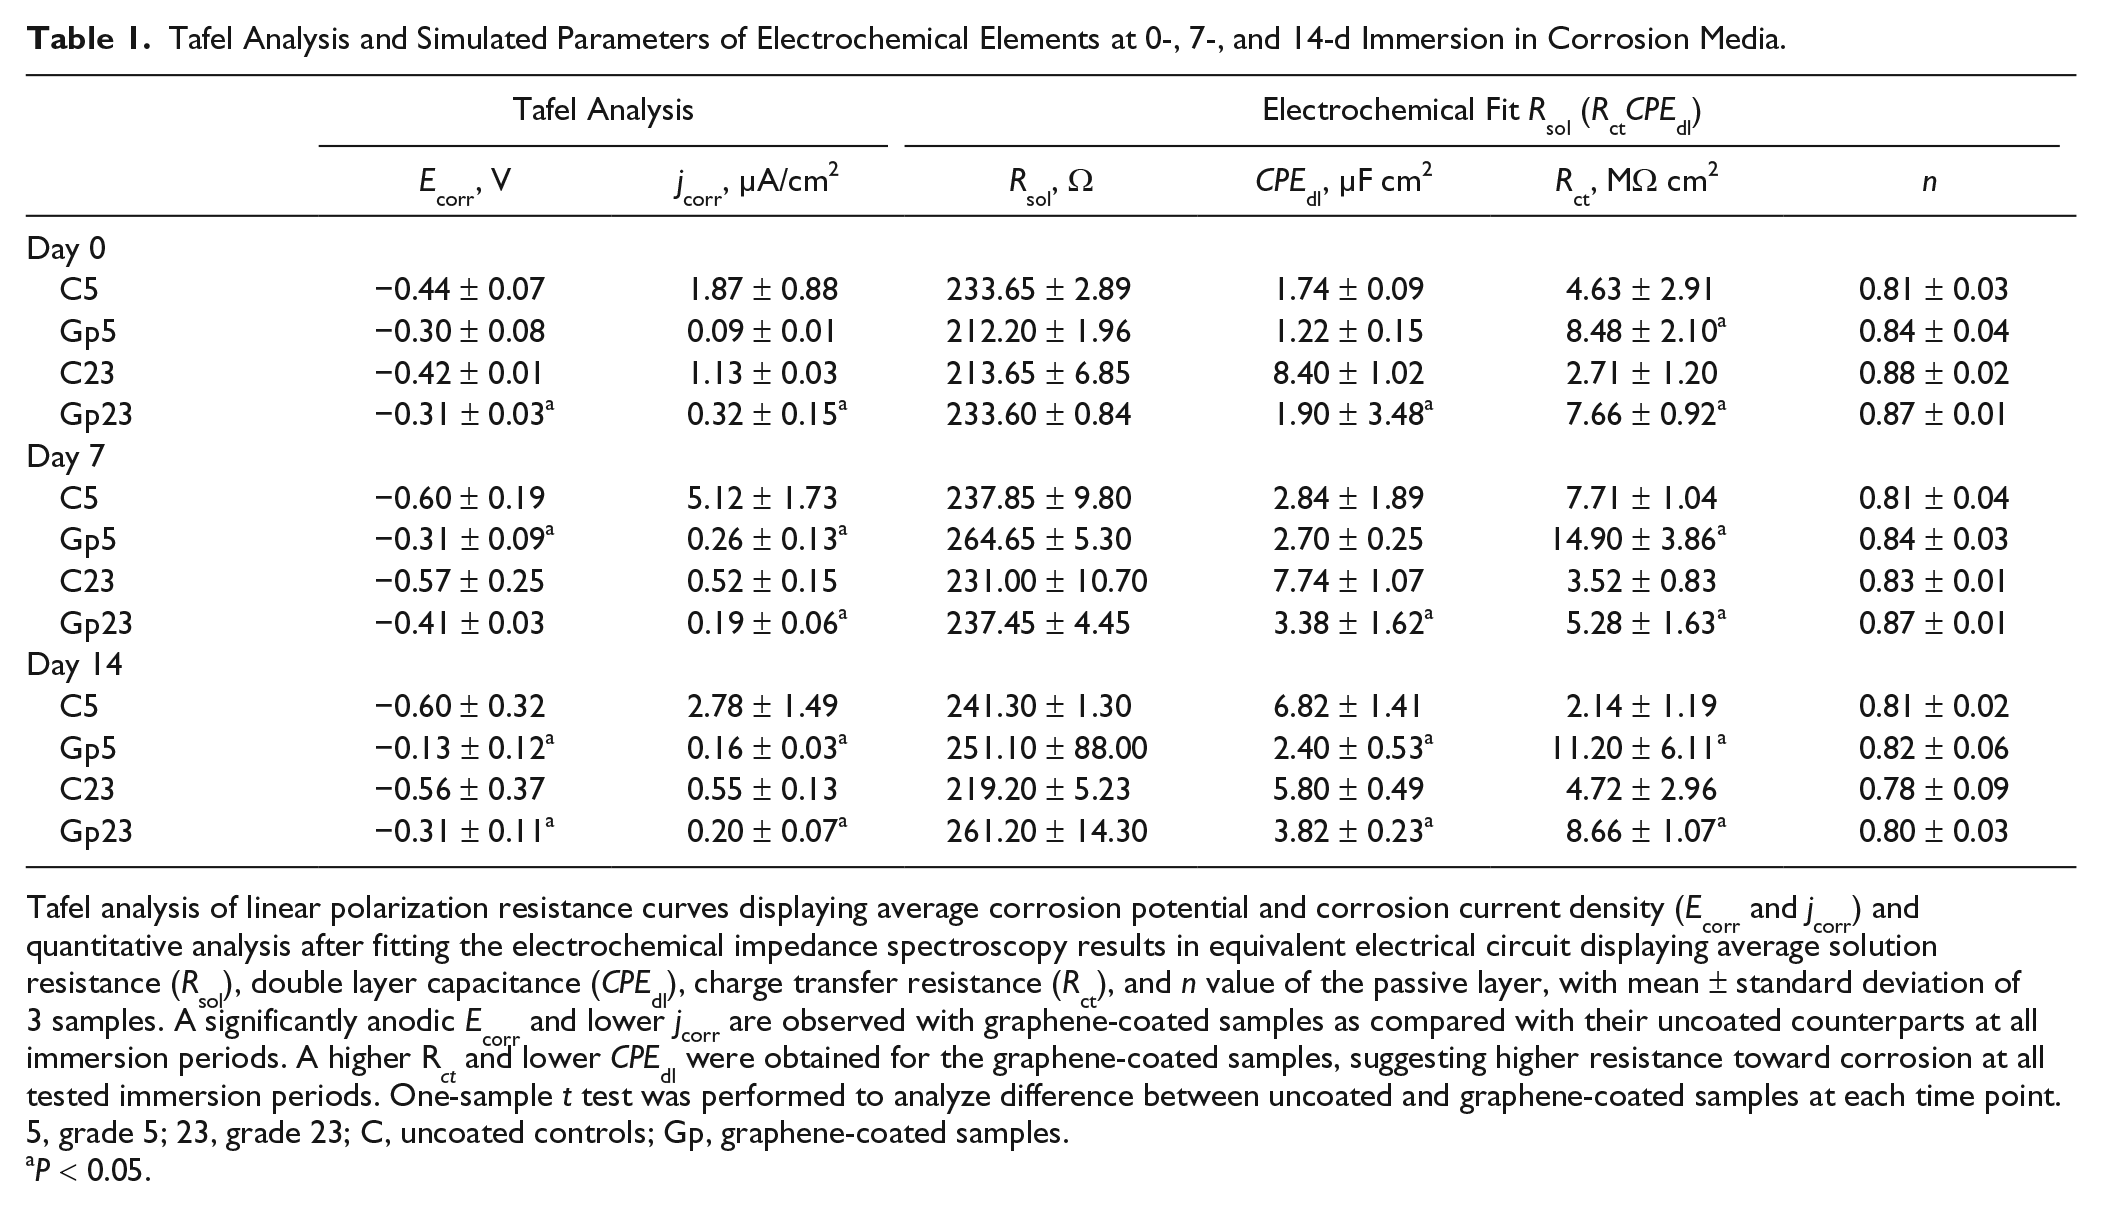
Tafel analysis of linear polarization resistance curves displaying average corrosion potential and corrosion current density (Ecorr and jcorr) and quantitative analysis after fitting the electrochemical impedance spectroscopy results in equivalent electrical circuit displaying average solution resistance (Rsol), double layer capacitance (CPEdl), charge transfer resistance (Rct), and n value of the passive layer, with mean ± standard deviation of 3 samples. A significantly anodic Ecorr and lower jcorr are observed with graphene-coated samples as compared with their uncoated counterparts at all immersion periods. A higher R ct and lower CPEdl were obtained for the graphene-coated samples, suggesting higher resistance toward corrosion at all tested immersion periods. One-sample t test was performed to analyze difference between uncoated and graphene-coated samples at each time point.
5, grade 5; 23, grade 23; C, uncoated controls; Gp, graphene-coated samples.
P < 0.05.
We observed an anodic shift in the corrosion potential (Ecorr, intersection of anodic and cathodic arms of polarization curve) of the graphene-coated groups (–0.30 ± 0.08 V for Gp5 and −0.31 ± 0.03 V for Gp23) as compared with those of their uncoated counterparts (Fig. 1D and Table 1). Corresponding to these relatively positive Ecorr, a decrease in jcorr was observed in the graphene-coated samples (~1.7 µA/cm² for Gp5 and 0.8 µA/cm² for Gp23; Table 1). Similar trends were seen after 7 and 14 d of the samples’ immersion in the corrosion medium; Ecorr was maintained at −0.20 V for Gp5 and −0.35 V for Gp23 (Fig. 1E, F, and Table 1). The anodic OCP and Ecorr and the decrease in jcorr at all time points indicated that the graphene-coated samples were thermodynamically stable and more noble and resilient against corrosion as compared with the controls.
CR, which is the amount of metal loss per year in thickness of a material, was determined with Tafel analysis of the polarization curves. A substantial reduction in CR was observed in the presence of the graphene nanocoatings. At 0 d, the CR value was approximately thrice lower in Gp5 and Gp23 as compared with the uncoated samples. After 14 d, the CR of the graphene-coated samples was low and stable (~0.001 mm/y), whereas that of C5 and C23 (controls) increased by 16 and 5 times, respectively (~0.091 mm/y; Fig. 1G, H).
We also performed EIS, which can identify the diffusion-limited reactions and capacitive behavior of materials. The samples were subjected to small sinusoidal currents at different fixed frequencies, and the response was recorded as impedance at each frequency. The EIS data were used to create Bode and Nyquist plots with negative phase angle (θ): a Bode plot shows explicit frequency, thereby enabling the identification of small impedances in the presence of large impedances, whereas a Nyquist plot shows unobvious frequency. The graphene-coated samples presented a higher impedance and higher θ even at the low frequency of 10 mHz as compared with the uncoated samples at the tested time points. In addition, an extended and constant θ was observed for Gp5 and Gp23, which was close to −90°, indicating the presence of a thin passive layer (Fig. 2A-F). An equivalent electrical circuit for the single passive layer was used to calculate the actual EIS response of the electrochemical cell (Fig. 2G). Gp5 and Gp23 presented lower capacitance (CPEdl: 1.22 ± 0.15 and 1.90 ± 3.48 µF cm2, respectively) and higher charge transfer resistance (Rct: 8.48 ± 2.10 and 7.66 ± 0.92 MΩ cm2) as compared with the uncoated samples at 0 d (Table 1). A similar trend was observed up to the 14th day of immersion. These results confirmed the high resistance to corrosion and electrochemical stability of the graphene nanocoating.
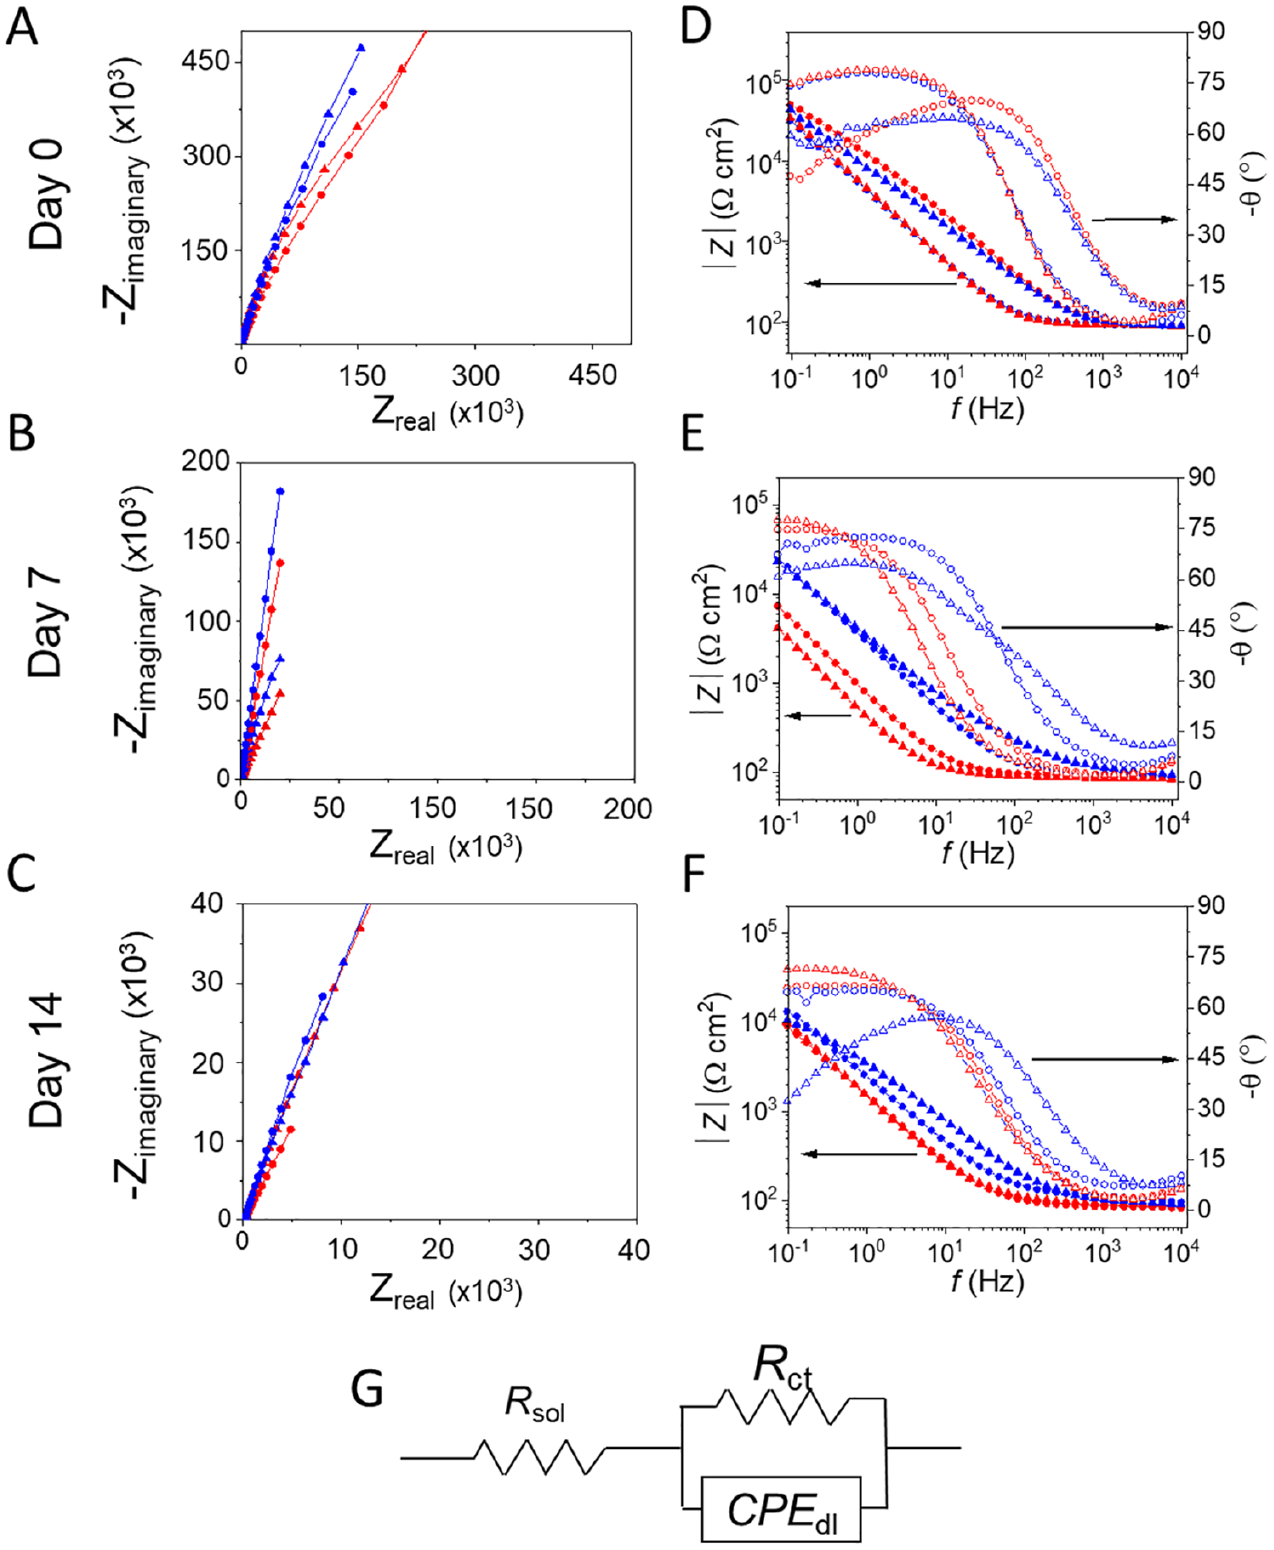
Electrochemical impedance spectroscopy: (
Structural and Chemical Stability of Graphene Nanocoating and Control
The nanocoatings’ stability was determined by assessing their structural characteristics and elemental composition after 30 d of the corrosion experiment. The arithmetic averages of roughness (Ra) for C5 and C23 (0.36 ± 0.14 and 0.51 ± 0.20 µm, respectively) were significantly higher than those of Gp5 and Gp23 (0.09 ± 0.02 and 0.12 ± 0.04 µm). The contact angles (Fig. 3B) of Gp5 and Gp23 (63° and 66°) were significantly higher than those of the corresponding controls (42° and 55°). We also quantified the elemental release after storing the samples in the corrosion medium. The ICP-AES results showed high levels of Ti, Al, and V ions leached from the uncoated samples. Conversely, the graphene nanocoating prevented the leaching of Ti and V ions, and the amount of leached Al ions was significantly lower than that of the uncoated samples (Fig. 3C). Furthermore, the pH change of the corrosion solution was significantly lower for the graphene-coated samples than for the controls (Appendix Fig. 7). The SEM images (Fig. 3D) show voids on the surface of the uncoated groups (black arrows in C5 and C23); by contrast, the morphology of the graphene-coated samples remained similar to the preimmersion morphology. The backscattering electron mode images (Appendix Fig. 6) show significant intergranular dissolution in the controls postimmersion.
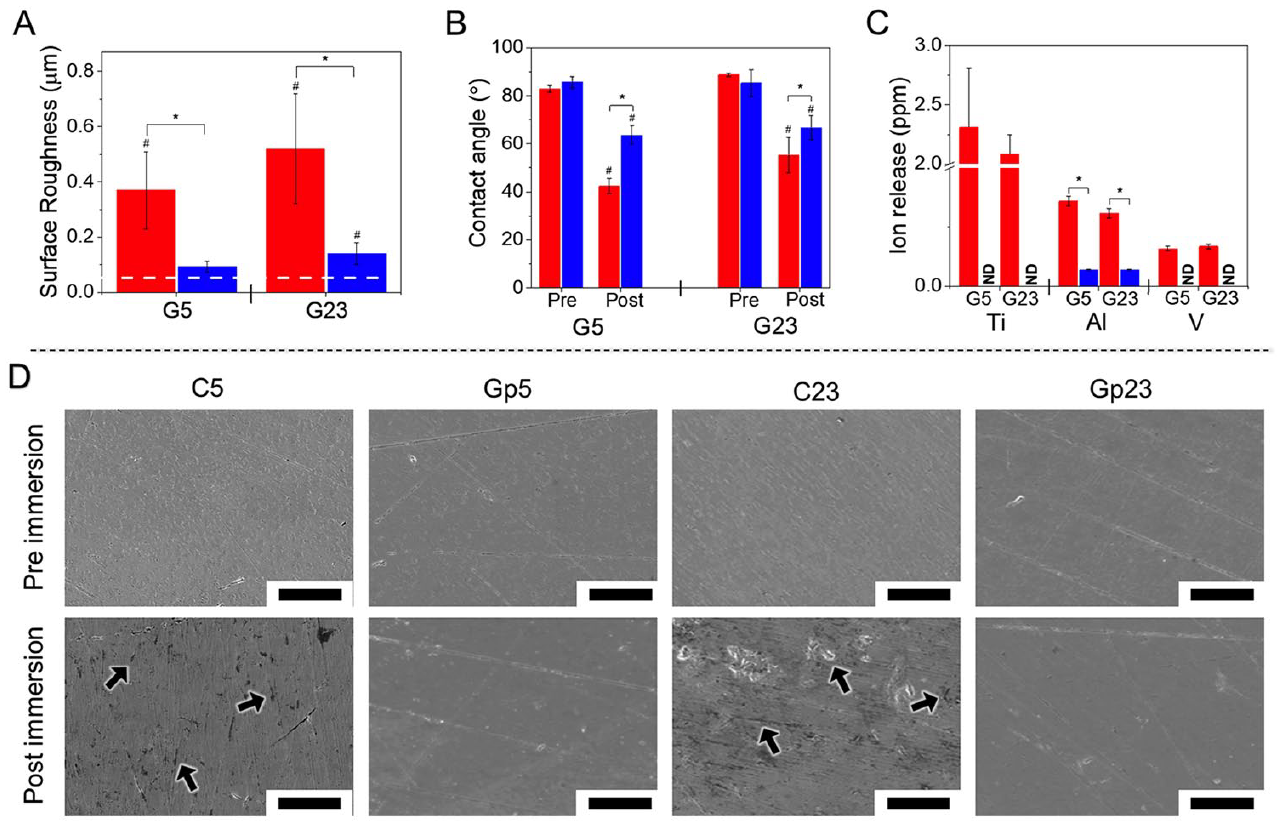
Graphene-coated Ti-6Al-4V keeps elemental composition and surface characteristics after corrosion challenge. Surface and chemical characteristics were characterized after soaking the graphene-coated samples and controls for 30 d in corrosion media. The surface roughness was determined by using contact profilometry and showed significantly higher Ra for the uncoated controls as compared with graphene-coated samples. Dashed line represents surface roughness at day 0 (
The surface elemental composition of the alloying elements was determined by energy-dispersive x-ray before and after the 30 d corrosion experiment (Table 2). We observed significant reductions in the wt% of the alloying elements and an increase in oxygen content only for C5 and C23 (6.16 ± 0.46 and 8.69 ± 1.96 wt%, respectively). The graphene-coated samples kept the original compositions of approximately 90%, 5.9%, and 3.8% for Ti, Al, and V. The graphene nanocoating’s stability was evaluated by Raman spectroscopy. The mappings displayed no decrease in the total area coated by graphene (≥99% in all cases), and the coating maintained the integrity and structural Raman characteristics (Appendix Fig. 8 and Appendix Table 2). These findings suggest that the graphene nanocoating was highly resistant and stable during acidic corrosion.
Surface Elemental Analysis of Uncoated Controls and Graphene-Coated Samples after 30-d Immersion in Corrosion Media.
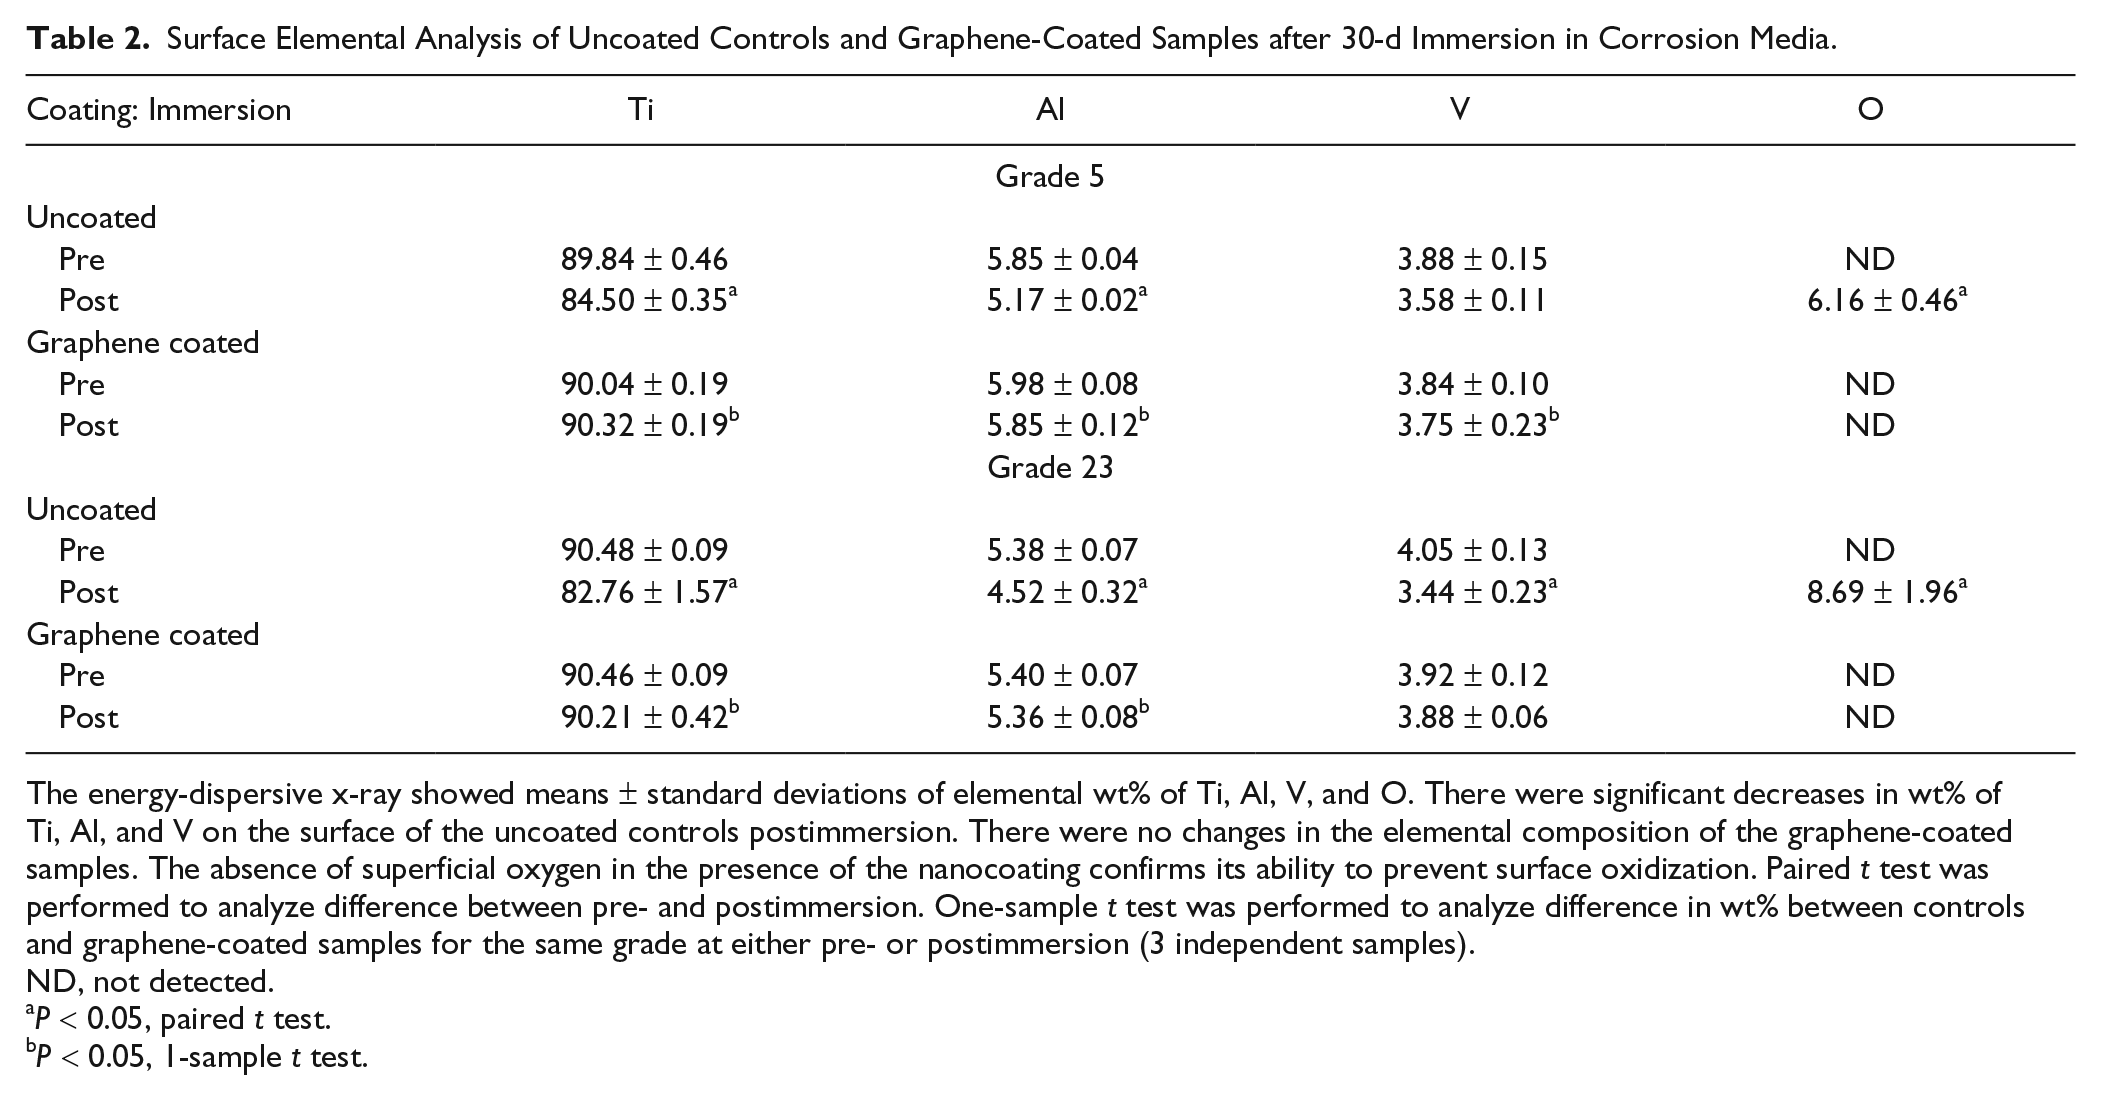
The energy-dispersive x-ray showed means ± standard deviations of elemental wt% of Ti, Al, V, and O. There were significant decreases in wt% of Ti, Al, and V on the surface of the uncoated controls postimmersion. There were no changes in the elemental composition of the graphene-coated samples. The absence of superficial oxygen in the presence of the nanocoating confirms its ability to prevent surface oxidization. Paired t test was performed to analyze difference between pre- and postimmersion. One-sample t test was performed to analyze difference in wt% between controls and graphene-coated samples for the same grade at either pre- or postimmersion (3 independent samples).
ND, not detected.
P < 0.05, paired t test.
P < 0.05, 1-sample t test.
These findings indicated that the graphene nanocoating maintained its structural characteristics and the chemical composition of Ti-6Al-4V even after the corrosion experiment.
Discussion
Exposure of implants to several corrosion-contributing factors can promote the release of metal ions into peri-implant tissues (Palmquist et al. 2010; Olmedo et al. 2013; Fretwurst et al. 2016; Pettersson et al. 2017; Fretwurst et al. 2018; Hedberg 2018). Metal by-products can induce apoptosis, oxidative damage to the cells, and defective gene expression (Wang et al. 2003; Polyzois et al. 2012). Hence, the development of strategies that minimize the biocorrosion of titanium implants is of considerable interest. Here, we demonstrate that an atom-thick graphene coating prevented the corrosion of Ti-6Al-4V alloy.
First, we assessed the electrochemical behavior of controls and graphene-coated specimens via linear polarization resistance curves after different immersion periods. A noble OCP, anodic shift in Ecorr, and low jcorr are associated with decreased CR (Floyd et al. 2007). The graphene-coated samples presented positive Ecorr and low jcorr even after 14 d in the corrosion medium (Fig. 1 and Table 1); therefore, they had lower anodic dissolution as compared with the uncoated samples. These observations, with the constantly low CR of ~0.001 mm/y (Fig. 1G, H), validated the electrochemical stability of the graphene nanocoating. Conversely, C5 and C23 presented a negative Ecorr (−0.60 and −0.55 V) and high CR (up to 0.160 mm/y in C5).
After the corrosion challenge, the uncoated samples presented increased superficial oxygen (Table 2). Although oxygen content is often associated with the formation of protective TiO2, studies have shown a greater driving force for the formation of Al2O3 in the outer layers of the alloy, which has higher negative free energy and is more prone to ion migration as compared with TiO2 (Browne and Gregson 1994; Zwilling et al. 1999). This may be the reason for the more negative Ecorr and high jcorr and CR observed for C5 (0.16 mm/y) and C23 (0.04 mm/y) despite an increase in superficial oxygen (Table 2 and Fig. 2E, F). Remarkably, the graphene nanocoating was effective against corrosion, as indicated by Gp5’s and Gp23’s retention of their surface characteristics (Fig. 3D, Appendix Fig. 8). Moreover, no superficial oxygen (Table 2) was detected; hence, the nanocoating can prevent oxidation. Finally, the nanocoating restricted metallic ion leaching, and the amount of Al ions detected was merely a fraction of that observed on the controls (Fig. 3C). The proportionately higher release of Al can be explained by the lower dielectric constant and reduced isolating effect of Al2O3 that increase the ion flow as compared with TiO2 (Browne and Gregson 1994). This may happen at uncoated parts that account for 0.5% of the total sample area (black pixels in Appendix Fig. 8).
The electrochemical nature of the graphene nanocoating was assessed with EIS. The higher impedances observed with the graphene nanocoating (vs. controls) confirmed that this atom-thick film protected Ti-6Al-4V against corrosion (Fig. 2A–F). The Bode phase angle plot shows that θ is close to −90° and extended over a wide range of intermediate frequencies at 0 and 7 d, signifying the near-capacitive response of graphene nanocoating. A quantitative analysis of the impedance data (Table 1) was obtained from an equivalent electrical circuit (Fig. 2G) proposed for single-layer passive films (Gonzalez and Mirza-Rosca 1999). A consistent Rsol of approximately 210 to 230 Ω was observed for all groups, indicating an electrochemically stable system. In this analysis, a low CPEdl and a high Rct implied a stable and highly corrosion-resistant behavior. Remarkably, the Rct values for the graphene-coated samples were approximately twice the value for the uncoated samples at all tested time points due to the impermeability of graphene, which resisted the exchange of electrons at the coating-electrolyte interface. The anticorrosion potential of graphene can be attributed to the delocalized s, px, and py orbitals, which do not allow the passage of small molecules (Berry 2013; Böhm 2014). The high impedance and Rct confirmed passive behavior with high electrochemical stability and verified the potential of graphene as a corrosion-resistant nanocoating for metallic implants.
Finally, we characterized the graphene nanocoating by Raman spectroscopy after the samples’ 30th day in the corrosion solution. The mappings (Appendix Fig. 8 and Table 2) show that the coverage area remained >99%. Moreover, the ID/IG ratio of the graphene nanocoatings did not increase; hence, the corrosion experiment did not produce defects in the carbon lattice. Previous studies suggested that metal atoms can diffuse into graphene lattice and form graphene/metal carbides at these sites (Morin et al. 2017; Xu et al. 2018). This atomic interlocking could explain, at least in part, the high stability of the graphene nanocoating after the corrosion challenge.
Despite the promising results, this work has limitations. Static corrosion experiments are widely used to assess the corrosion of biomaterials, but they do not take into consideration the mechanical stresses that occur during material functioning. Moreover, the time points cannot be directly correlated to the implant service time. Our corrosion solution did not directly resemble oral fluids. Nevertheless, NaCl/F has been reported to be an efficient electrolytic solution for testing the corrosion properties of titanium-based materials (Kalisz et al. 2016). Finally, the disc-shaped specimens were not analog to implants, but their specific shape and size allowed for reproducible quantification of the phenomena observed. Hence, we opted for an experimental setup with extremely harsh conditions and a long period of evaluation to ensure the integrity, stability, and anticorrosion potential of the graphene nanocoating. Despite these limitations, our findings confirmed that the graphene nanocoating is a barrier that effectively prevents the corrosion and degradation of Ti-6Al-4V.
Conclusion
The identification of metal ions and particles in the vicinity of failed implants has raised concerns that titanium alloys can undergo corrosion in healthy and diseased environments. Graphene is a cytocompatible atom-thick film made of carbon atoms. As the carbon lattice has a very small pore size, graphene has promising impermeability. Here, we showed that a graphene nanocoating had high corrosion resistance and prevented the corrosion, ion leaching, and degradation of Ti-6Al-4V of grades 5 and 23. Moreover, the graphene nanocoating presented high electrochemical and structural stability. Our findings open avenues for the use of graphene as anticorrosion coating for titanium implantable devices.
Author Contributions
R. Malhotra, contributed to conception, design, data acquisition, analysis, and interpretation, drafted and critically revised the manuscript; Y.M. Han, J.L.P. Morin, R.J.J. Chew, contributed to design, data acquisition, analysis, and interpretation, drafted and critically revised the manuscript; E.K. Luong-Van, contributed to design, data analysis and interpretation, drafted and critically revised the manuscript; A.H. Castro Neto, C.A. Nijhuis, V. Rosa, contributed to conception, design, data analysis and interpretation, drafted and critically revised the manuscript. All authors gave final approval and agree to be accountable for all aspects of the work.
Supplemental Material
DS_10.1177_0022034519897003 – Supplemental material for Inhibiting Corrosion of Biomedical-Grade Ti-6Al-4V Alloys with Graphene Nanocoating
Supplemental material, DS_10.1177_0022034519897003 for Inhibiting Corrosion of Biomedical-Grade Ti-6Al-4V Alloys with Graphene Nanocoating by R. Malhotra, Y.M. Han, J.L.P. Morin, E.K. Luong-Van, R.J.J. Chew, A.H. Castro Neto, C.A. Nijhuis and V. Rosa in Journal of Dental Research
Footnotes
Acknowledgements
The authors thank Dr. Francisco Javier Rodríguez-Lozano from the University of Murcia for the support provided for elemental characterization.
A supplemental appendix to this article is available online.
This research was supported by grants from the National University Health System, Singapore (NUHSRO/2016/ 132/NUHS O-CRG Oct/25, R-221-000-109-733), and Singapore Ministry of Education, Singapore (Academic Research Fund Tier 1, R-221-000-132-114).
The authors declare no potential conflicts of interest with respect to the authorship and/or publication of this article.
References
Supplementary Material
Please find the following supplemental material available below.
For Open Access articles published under a Creative Commons License, all supplemental material carries the same license as the article it is associated with.
For non-Open Access articles published, all supplemental material carries a non-exclusive license, and permission requests for re-use of supplemental material or any part of supplemental material shall be sent directly to the copyright owner as specified in the copyright notice associated with the article.