
Abstract
Development of dentition is a commonly studied process as a representative of the development of ectodermal derivates. A key step is the formation of a signaling center called the enamel knot (EK), which organizes tooth crown formation. In the mouse lower jaw, the anterior part of the tooth-forming region undergoes a series of complex events before the first molar primary EK can form more posteriorly and the tooth can progress through the cap stage. Although much is known about the molecular factors involved in tooth development, disentangling their specific roles is difficult. In this study, we circumvented this problem by isolating the posterior part of the tooth-forming region at embryonic day 13.5 and cultivating it in vitro. By treating them with molecules activating or inhibiting Sonic hedgehog (Shh) and fibroblast growth factor (Fgf) pathways, we demonstrate that Shh plays the role of an inhibitor of EK formation, and we suggest that the FGF pathways may have both positive and negative roles, as seen in hair. By RNA-sequencing of the cultivated isolates after 0, 16, or 24 h in vitro, respectively, we screened for genes whose expression varies with EK and cap formation and pointed to Cdkn2b and Sema3b as 2 promising candidates in this process.
Keywords
Introduction
Tooth development is characterized by a complex series of reciprocal interactions occurring between the epithelium and the underlying cranial neural crest–derived mesenchyme. The tooth germ progresses through several stages (bud, cap, and bell) until it reaches the final shape (Peterkova et al. 2014). Processes driving the morphogenesis to the final stage are controlled by signaling centers called enamel knots (EKs) made of nonproliferating cells, which form through activation–inhibition mechanisms and express ligands for different signaling pathways, includi ng Sonic hedgehog (Shh), fibroblast growth factors (Fgfs), Wnts, and bone morphogenetic proteins (Bmps) (Jernvall et al. 1994; Vaahtokari et al. 1996; Thesleff et al. 2001; Sadier et al. 2019).
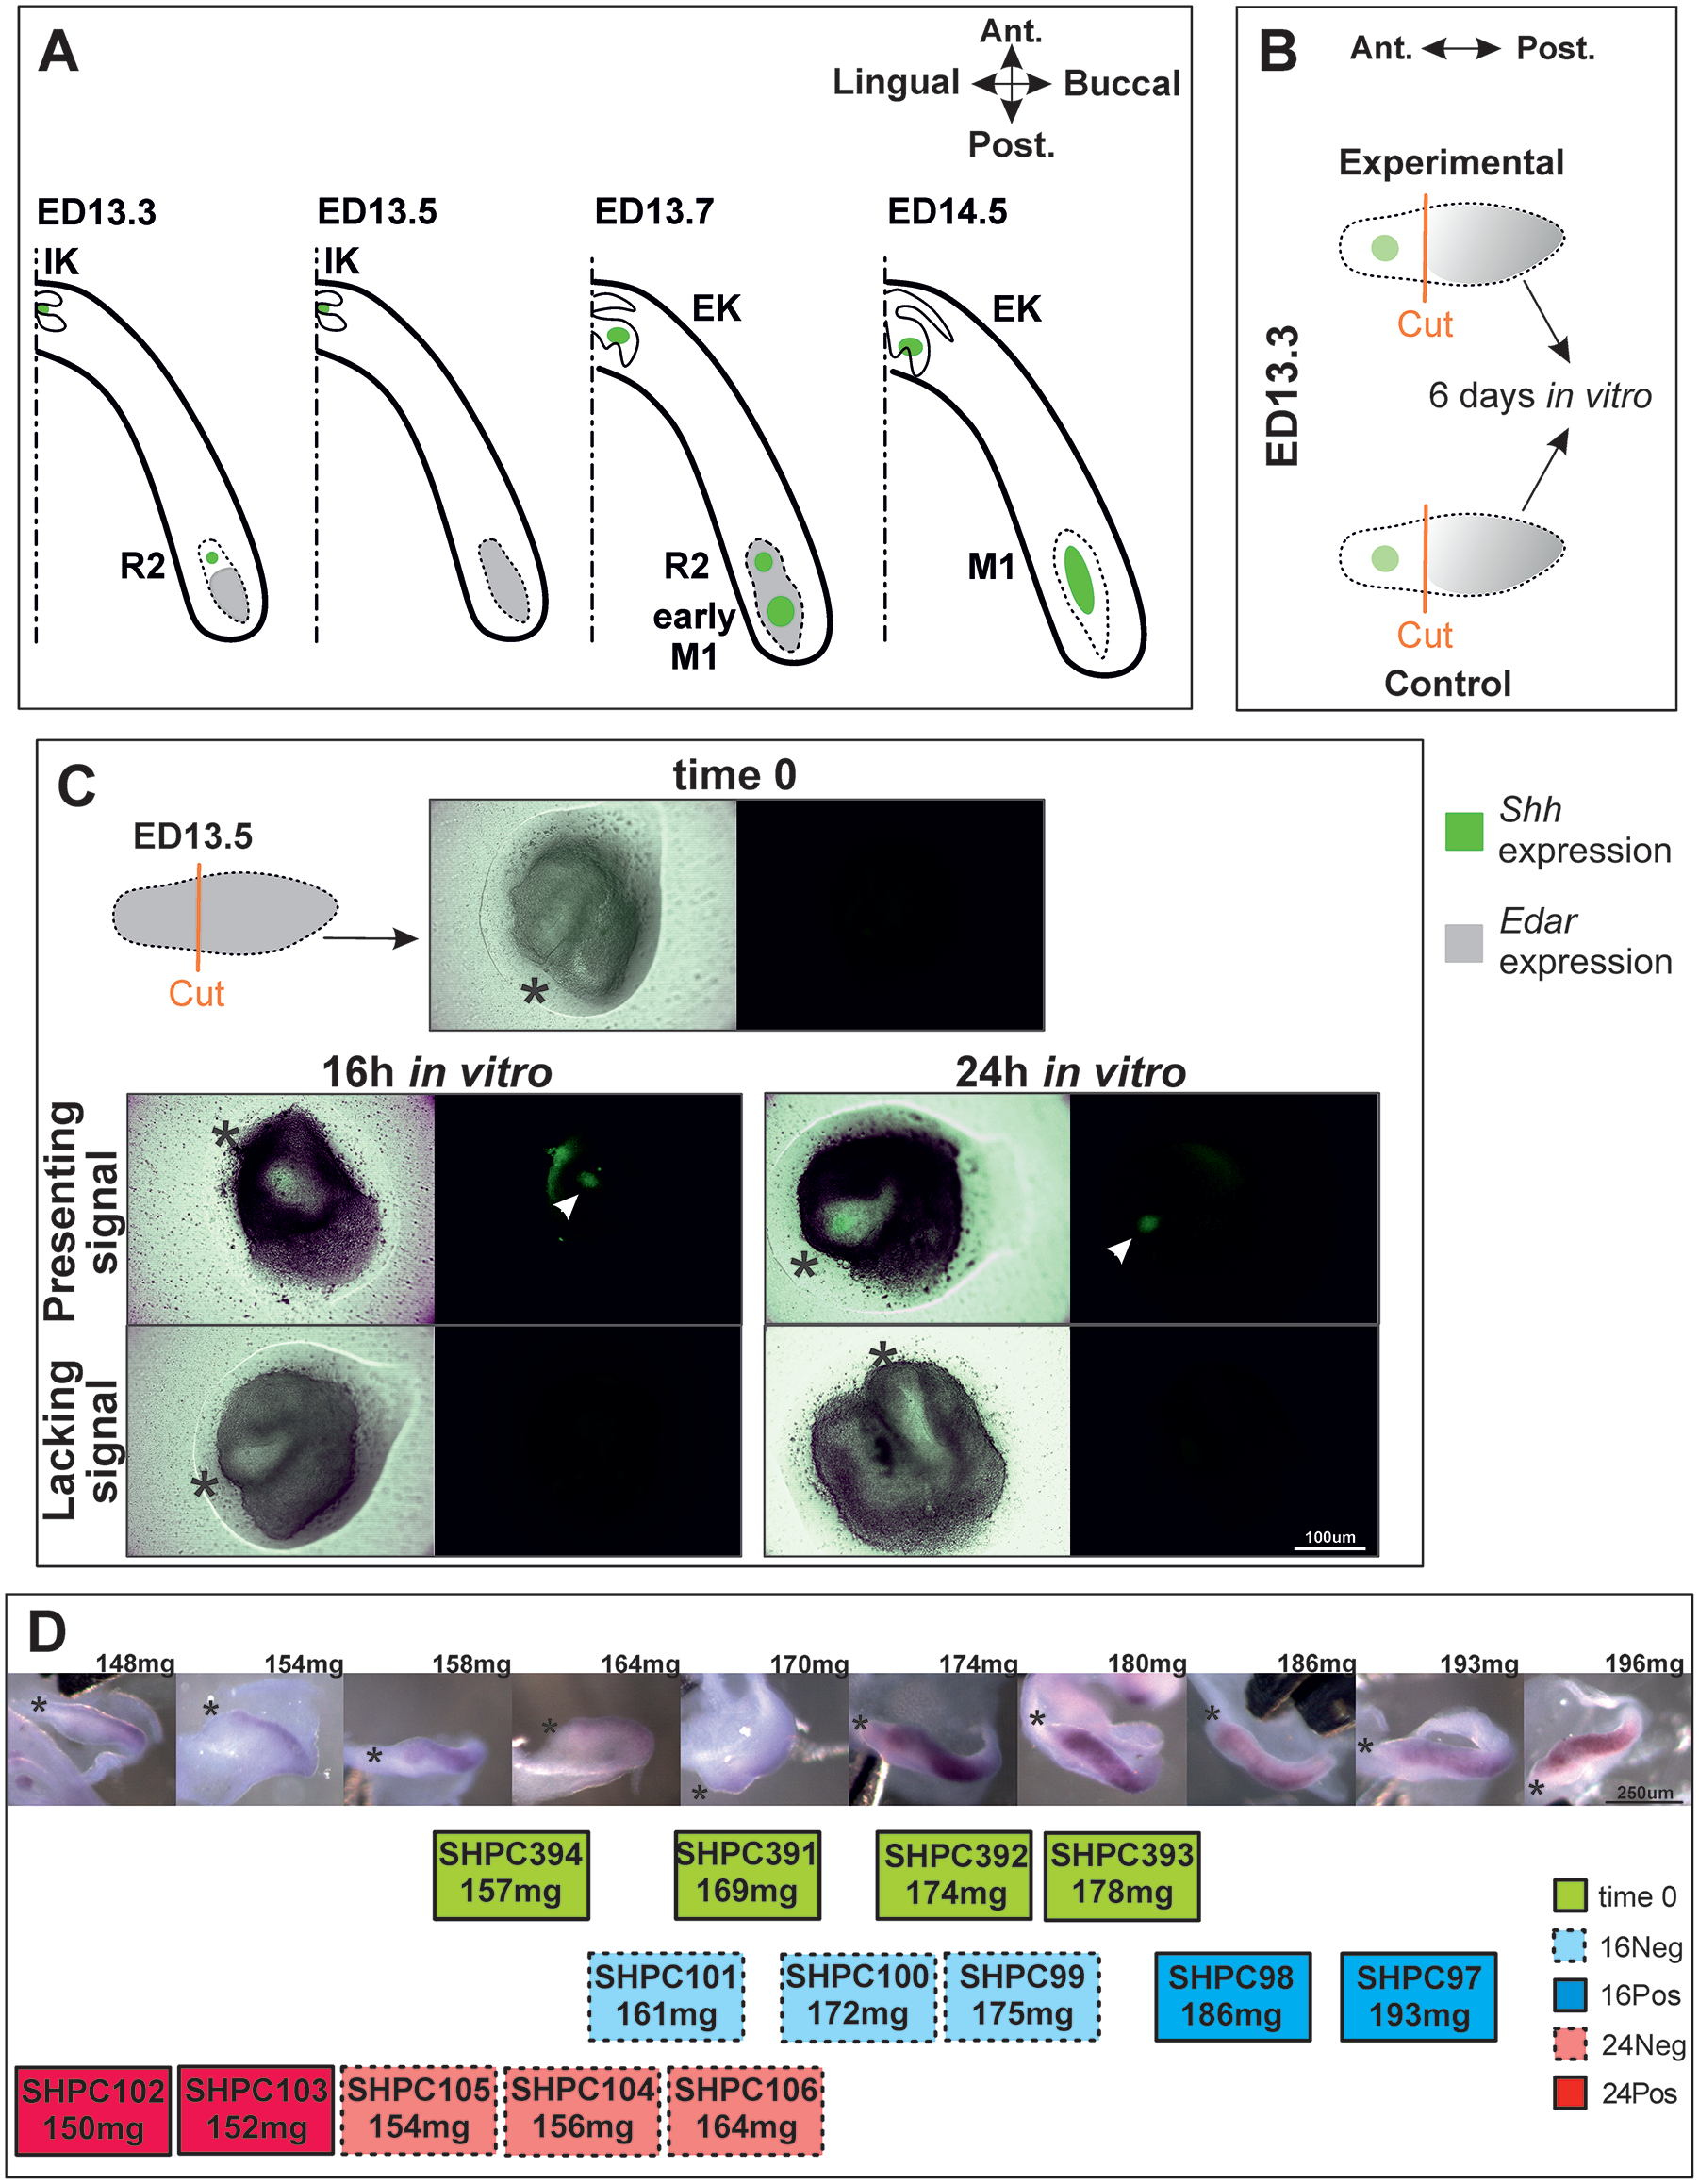
Mouse odontogenesis is commonly used as a model for dental developmental studies. Mouse dentition is highly specialized and reduced, but developmental stages are comparable to those of other vertebrate species, including humans (Streelman et al. 2003). In the embryonic jaw, signaling centers appear in a series anteroposteriorly having different fates. They can relate to progressive tooth primordia, giving rise to prospective functional teeth, or they can relate to regressive tooth primordia transiently playing intermediate roles in the functional tooth row establishment (Prochazka et al. 2010; Hovorakova et al. 2011; Hovorakova et al. 2013; Lochovska et al. 2015; Ahtiainen et al. 2016; Du et al. 2017; Sadier et al. 2019; Mogollón et al. 2021). Two such transient structures called the mesial segment (MS) and rudiment 2 (R2) anticipate formation of first molar (M1) (Peterkova et al. 2006). Their corresponding signaling centers showed complex dynamics (Prochazka et al. 2010; Lochovska et al. 2015; Sadier et al. 2019; Mogollón et al. 2021). The MS signaling center is patterned at embryonic day (ED) 11.5 and later erased. Its initiating role was confirmed recently, and it was therefore named the “initiation knot” (Mogollón et al. 2021). At ED12.5, the R2 signaling center is patterned and transiently erased as a third wave of activation occurs in the posterior growing dental region (Sadier et al. 2019). This leads to the patterning of a third, even more posterior, signaling center, called the “early M1 signaling center.” Finally, after the reappearance of the R2 signaling center, these 2 neighboring signaling centers fuse to form EK, and M1 cap transition occurs (Fig. 1A). These complex dynamics of signaling centers in the molar row result in a composite lower first molar primary enamel knot (pEK) and paradoxical behaviors of the system (Sadier et al. 2019), making it difficult to disentangle which molecular players are directly involved in EK formation and/or its maturation in a functional organizing center.
Experimental background and the design used in the present study. (
In this research, we used in vitro cultivation of ED13.5 posterior parts of the CD1/Shh/EGFP+ molar-forming region to obtain a much simpler setting. This eliminated the anterior region of R2 influence, leaving an activated posterior part, where no signaling center has been patterned yet (as monitored with Edar expression) but that can rapidly form an EK following separate cultivation (as shown previously in Sadier et al. 2019). With this we created more simple conditions, in which a recordable (enhanced green fluorescent protein; EGFP) signaling center is established de novo, in vitro. With this setting, we provide here new specific results on the regulatory role of Fgf and Shh pathways in EK establishment and persistence by silencing or overactivating these pathways at this very specific place and stage with small-molecule inhibitors and activators. Moreover, using RNAseq of ED13.5 M1 posterior parts cultured in vitro for 0, 16, and 24 h, respectively, we revealed new potential players involved in EK and cap formation.
Materials and Methods
To visualize sites of Shh expression and follow EK formation, CD1 mice were crossed with B6.Cg-Shhtm1(EGFP/cre)Cjt/J mice (JAX#005622, The Jackson Laboratory), carrying a fusion GFP-CRE protein inserted at the Shh ATG and disrupting the coding sequence. Lower M1 germs of CD1/Shh/EGFP+ mouse embryos were bilaterally dissected at ED13.3 at the bud stage preceding EK formation (n = 32). M1 primordia were split, and the posterior parts were cultured in vitro with molecules affecting Fgf or Shh pathways, respectively (Fig. 1B). The same approach (14 posterior M1 explants harvested at ED13.5 and cultured in vitro for 0, 16, or 24 h) was used for RNA sequencing to find candidates involved in M1 EK and cap formation (Fig. 1C, D). Analyzed quantified genes exhibiting absolute expression log2-fold change (Lfc) greater than 1 and statistical significance (padj < 0.05) were considered as differentially expressed genes (DEGs). Selected candidates revealed by RNA-Seq analysis were validated using RNAscope in CD1/Shh/EGFP+ embryos and negative controls at ED13.5 and 14.5.
Data are available at https://www.ebi.ac.uk/biostudies/arrayexpress/studies/E-MTAB-13997.
The detailed materials and methods are presented in the appendix. The animal study conformed with the ARRIVE guidelines for the use of laboratory animals.
Results
Experimental Inhibition of the Fgf Pathway and Activation of the Fgf and Shh Pathways Disrupted EK Formation and Arrested Tooth Development in the Posterior M1 Region
First, we aimed to test the role of the Fgf and Shh pathways for EK formation, in a setting where the competition with previously formed structures is removed. We thus explanted the posterior part of the M1 region at ED13.5, a stage at which it is competent to form a new EK (Sadier et al. 2019), and we altered the Fgf and Shh pathways in vitro (Fig. 1B). We used a Shh/EGFPCre+ strain crossed to CD1 mice to be able to follow EK formation with EGFP.
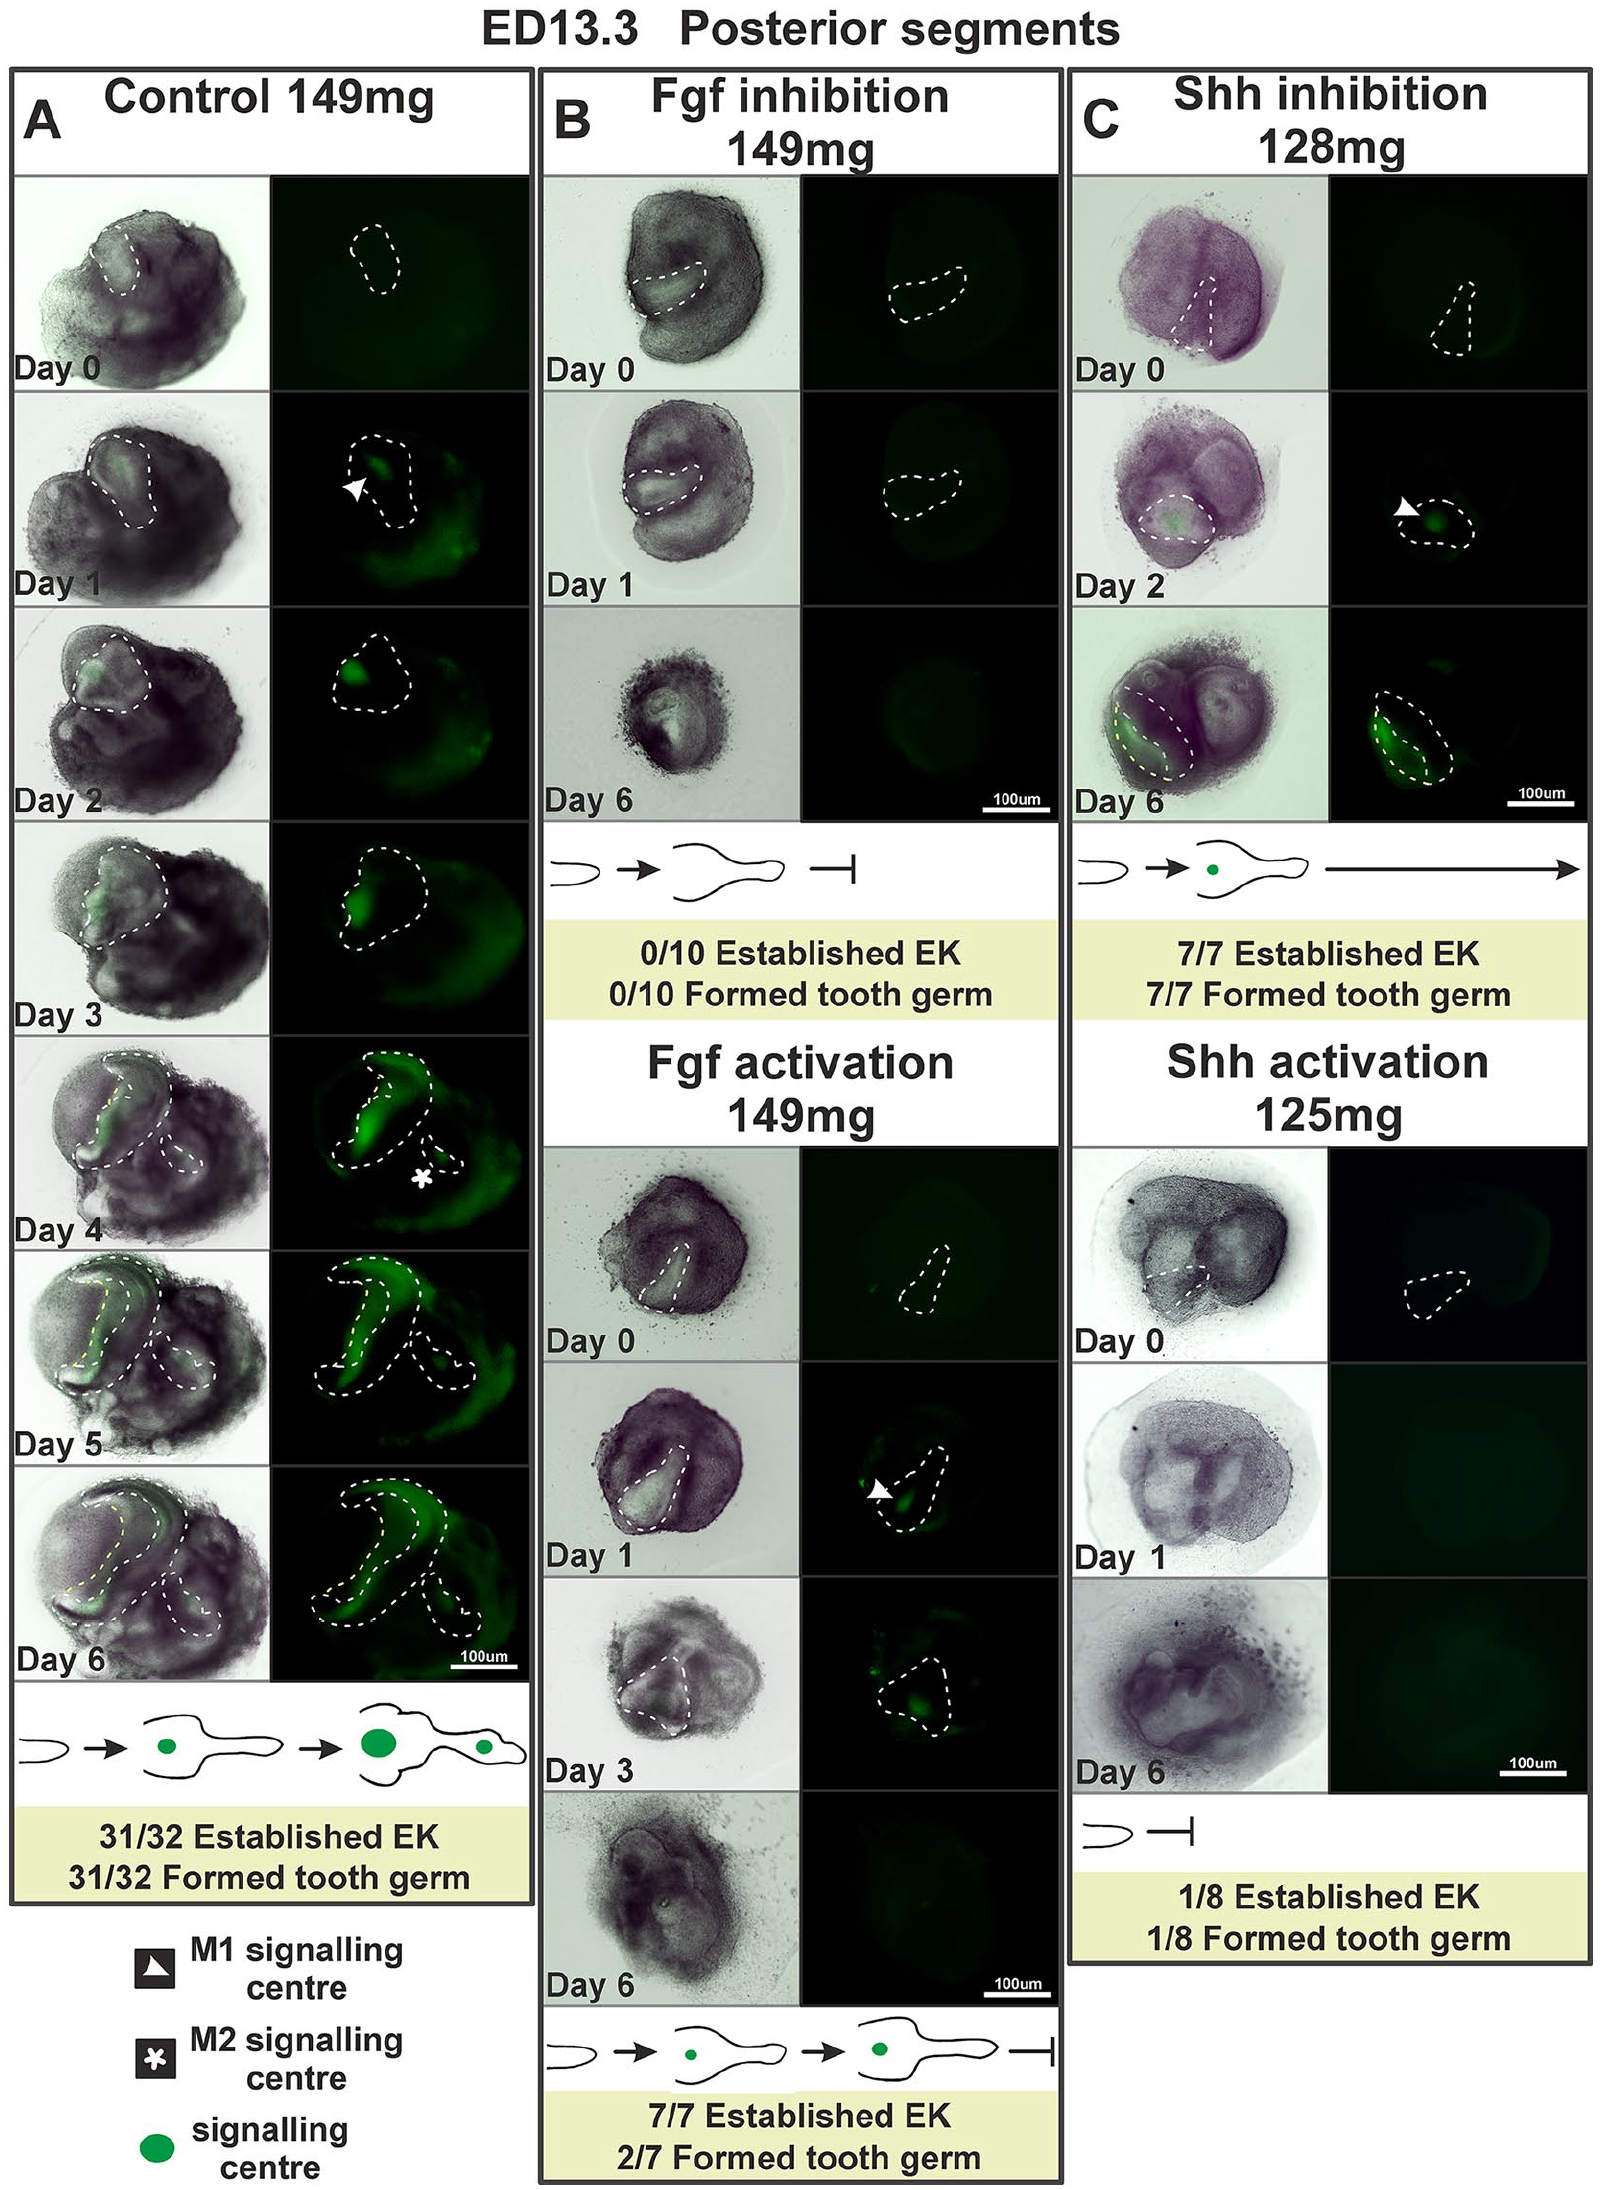
After Fgf inhibition (SU 5402), the posterior M1 explants seemed to proceed in their development to form a tooth germ shortly after day 0, but these tooth germs did not form any signaling centers, and their growth was arrested at culturing day 3 (Fig. 2A, B).
In vitro experimental manipulation of posterior segments of the molar-forming region at embryonic day (ED) 13.3. (
Interestingly, Fgf activation (SUN 11602) resulted in the appearance of signaling centers at day 1 or 2, but only 2 of 7 explants reached the bell stage. The EKs of the remaining explants seemed to be smaller (even if the EK size differences between the treated and control explants were not significant; Appendix Table 1) compared with the controls, and after 1 or 2 days, they disappeared. This was followed by an arrest of the explant in its development (Fig. 2A, B).
Experimental cultures with inhibited Shh (cyclopamine) were able to develop M1 EK in all 7 cases similarly to the control group (7 out of 7), and their size did not differ from that of controls (Appendix Table 1). However, morphologically, the tooth germs seemed abnormal after 6 days in vitro compared with controls (Fig. 2A, C).
In experimental cultures with activated Shh (purmorphamine), only 1 explant out of 8 was able to develop M1 EK and reached the bell stage considerably delayed in comparison with controls. The other 7 posterior experimental explants did not develop EKs and were arrested in their development shortly after day 0 (Fig. 2A, C).
RNA Sequencing Design to Reveal Novel Candidates Involved in the Establishment of EK and M1 Cap Formation
Next, we set up a transcriptomic design comparing a posterior part of M1, which is ready to form an EK, with a posterior tissue that has recently formed an EK. Our objective was to reveal new candidates specifically regulated during this bud-to-cap transition.
Because the timing of development is dependent on the genetic background (Hayden et al. 2020) and could be specific in CD1/Shh/EGFP+ embryos, we first performed in situ hybridization with the Edar gene to identify the precise time window when the dental lamina is activated upstream of M1 EK formation (Fig. 1D). Harvesting at ED13.5 provided CD1/Shh/EGFP+ embryos in the right time window. We performed RNA sequencing on uncultivated posterior parts and on posterior parts cultivated for 16 or 24 h (Fig. 1C). How far the explants at 16 and 24 h are on the way to establish their EKs was evaluated according to the presence of the EGFP signal and later confirmed with EK marker expression (see below) (Fig. 3).
RNA sequencing data analysis. (
Posterior M1 Explants Cultured for 16 or 24 h Differed Significantly in Their Gene Expressions from Time 0 and Expressed pEK Markers Confirming Tooth Formation
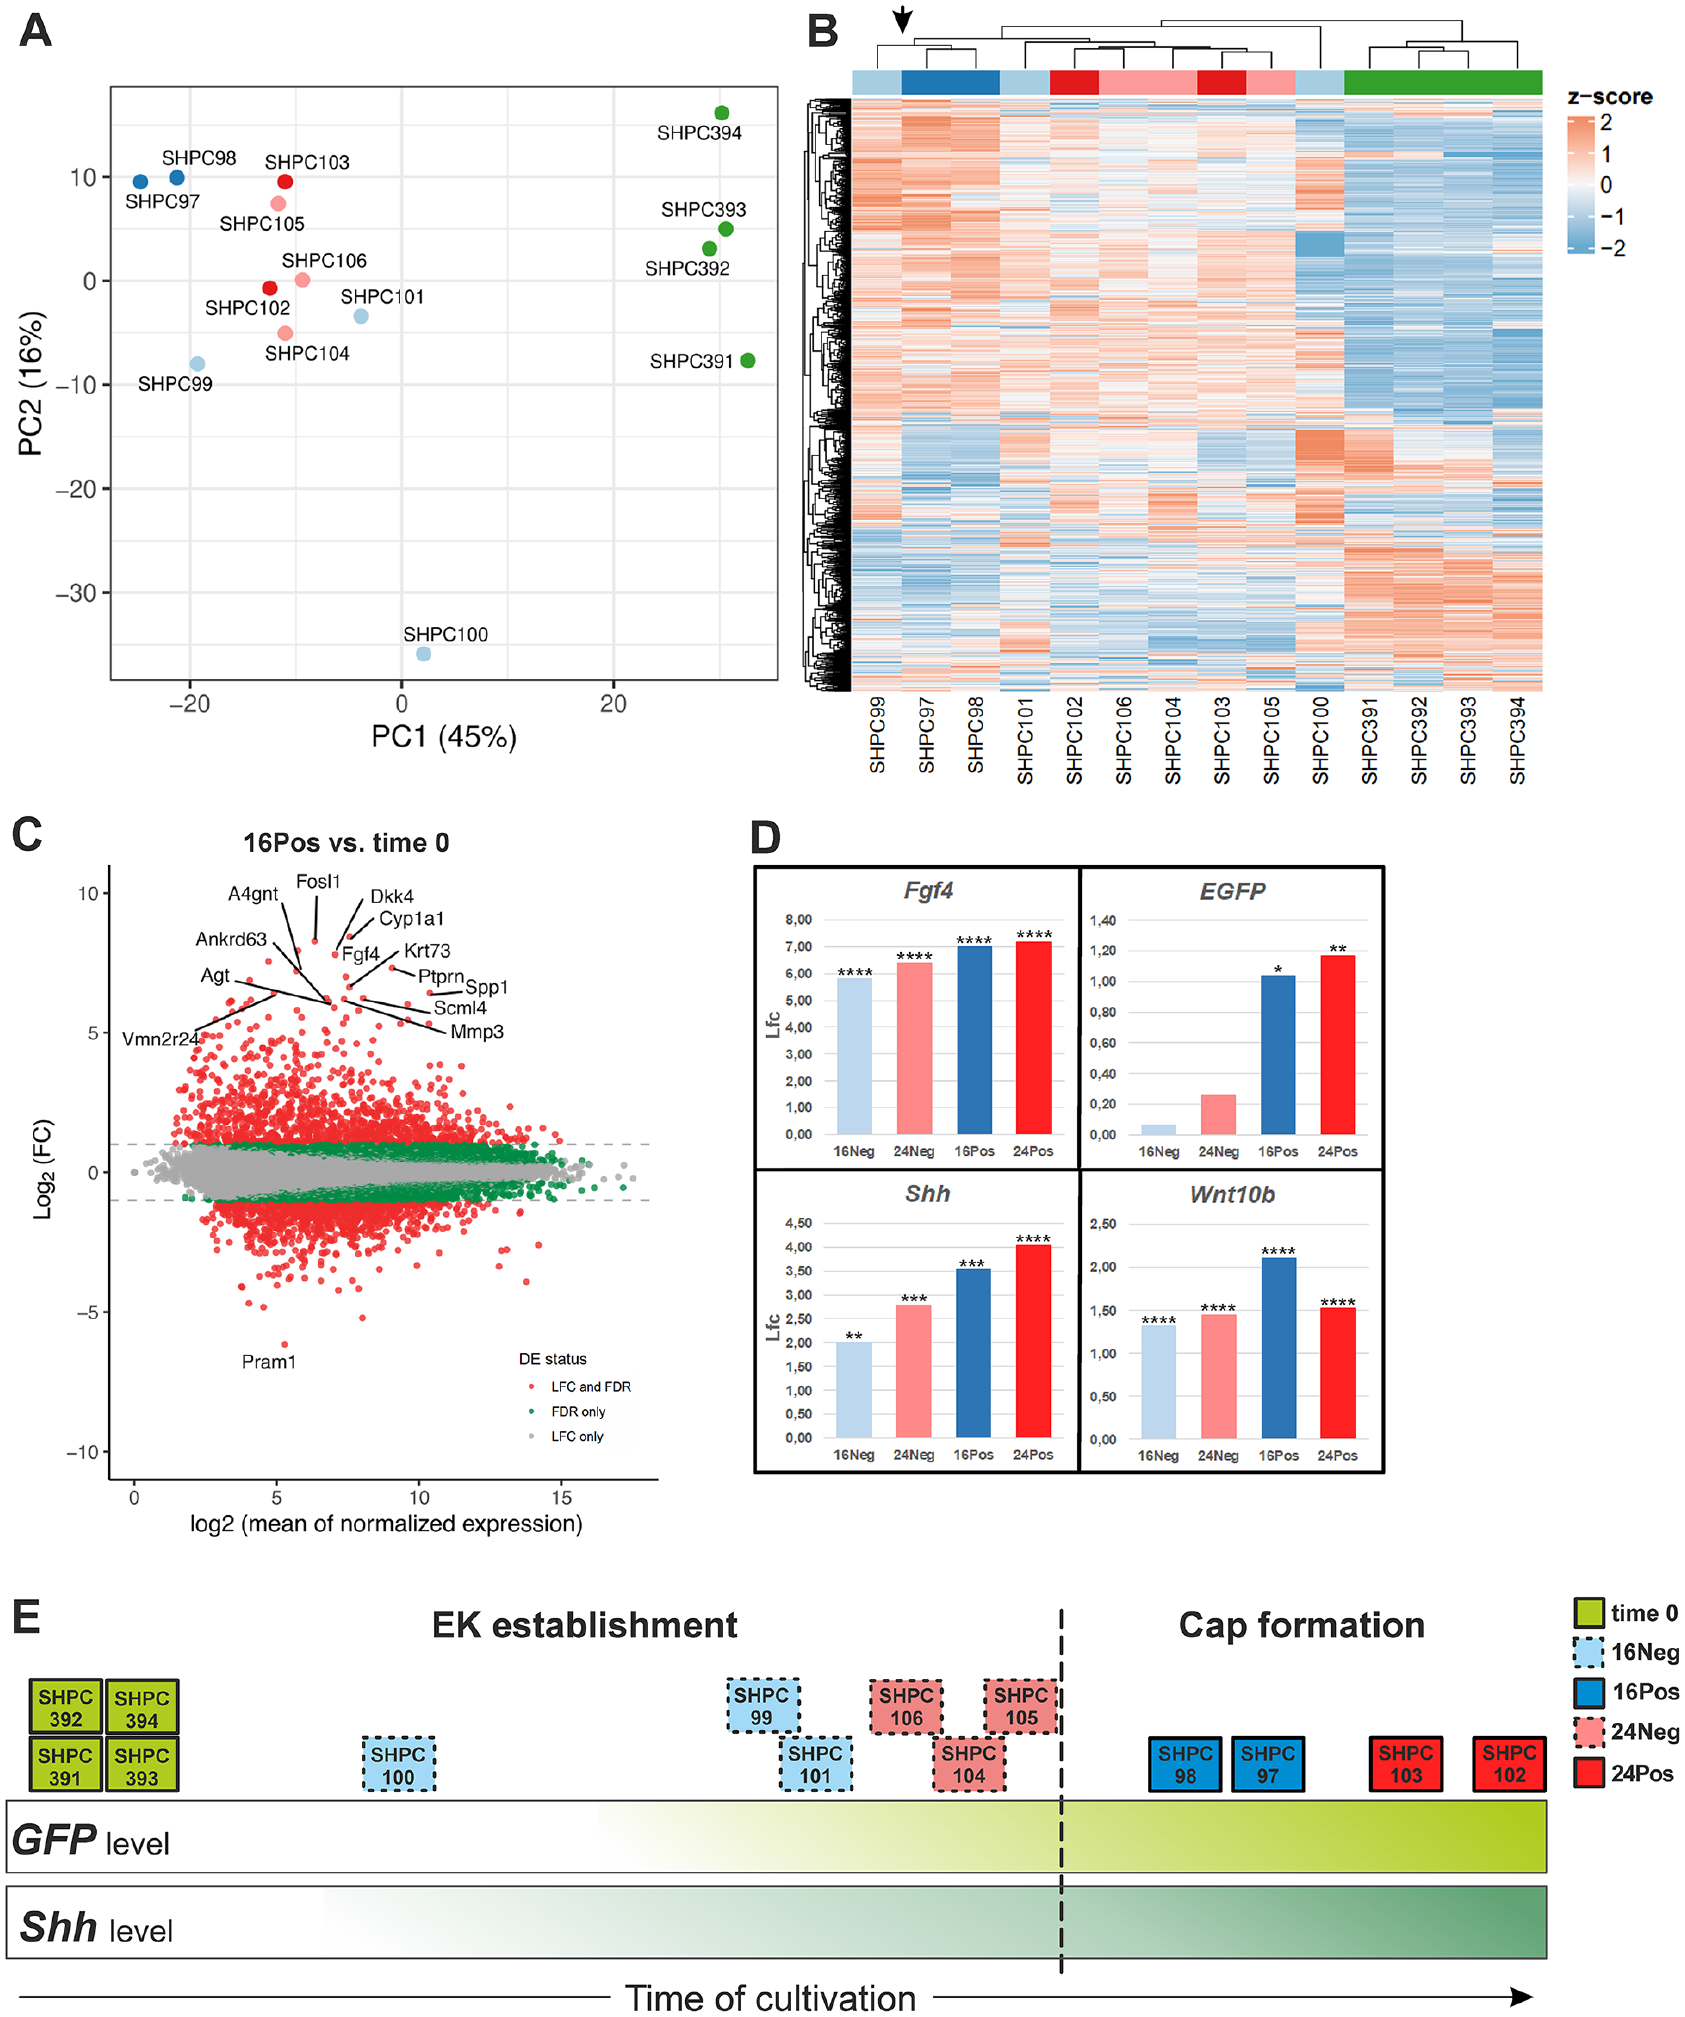
The analysis of all in vitro cultured posterior M1 segment samples showed that cultured samples (except for SHPC100, which showed a contamination by nondental tissues; Fig. 3A) clustered together differing from time 0 group along the principal component 1 (PC1) axis (Fig. 3A). Cultured samples showed significant DEGs with Lfc > 1 in profile compared with the samples in the time 0 group, consistent with large transcriptional changes following the process of culturing and the progression of tooth formation in culture (Figs. 3B , Appendix Fig. 1).
Genes known to play a role in pEK signaling, such as Fgf4, Shh, and Wnt10b and the EGFP transcript, were significantly upregulated in all cultured groups when compared with time 0 (Fig. 3D). Individual profiles indicated that the 4 pEK markers had been turned on in all cultured explants except that of SHPC100, which was likely delayed due to the contamination by nondental tissue (Appendix Fig. 2, see also Fig. 3A, intermediate position on PC1). In less advanced samples (without detectable EGFP), this can be explained by taking into account that EGFP needs to accumulate and fold to allow visual detection.
We could observe slightly different dynamics in gene expression between these markers (Fig. 3D, Appendix Fig. 2), but they document that positive samples are developmentally more advanced than negative samples are. Moreover, among both negative and positive samples, the 24 h samples appeared slightly more advanced than the 16 h samples did.
We concluded that the sampling reflected different stages from early stages of EK establishment (in negative samples, especially at 16 h) to later stages when EK has been well established and cap formation (likely) proceeds (in positive samples, especially at 24 h) (Fig. 3E).
A Screen to Identify New Candidates for EK and Cap Formation
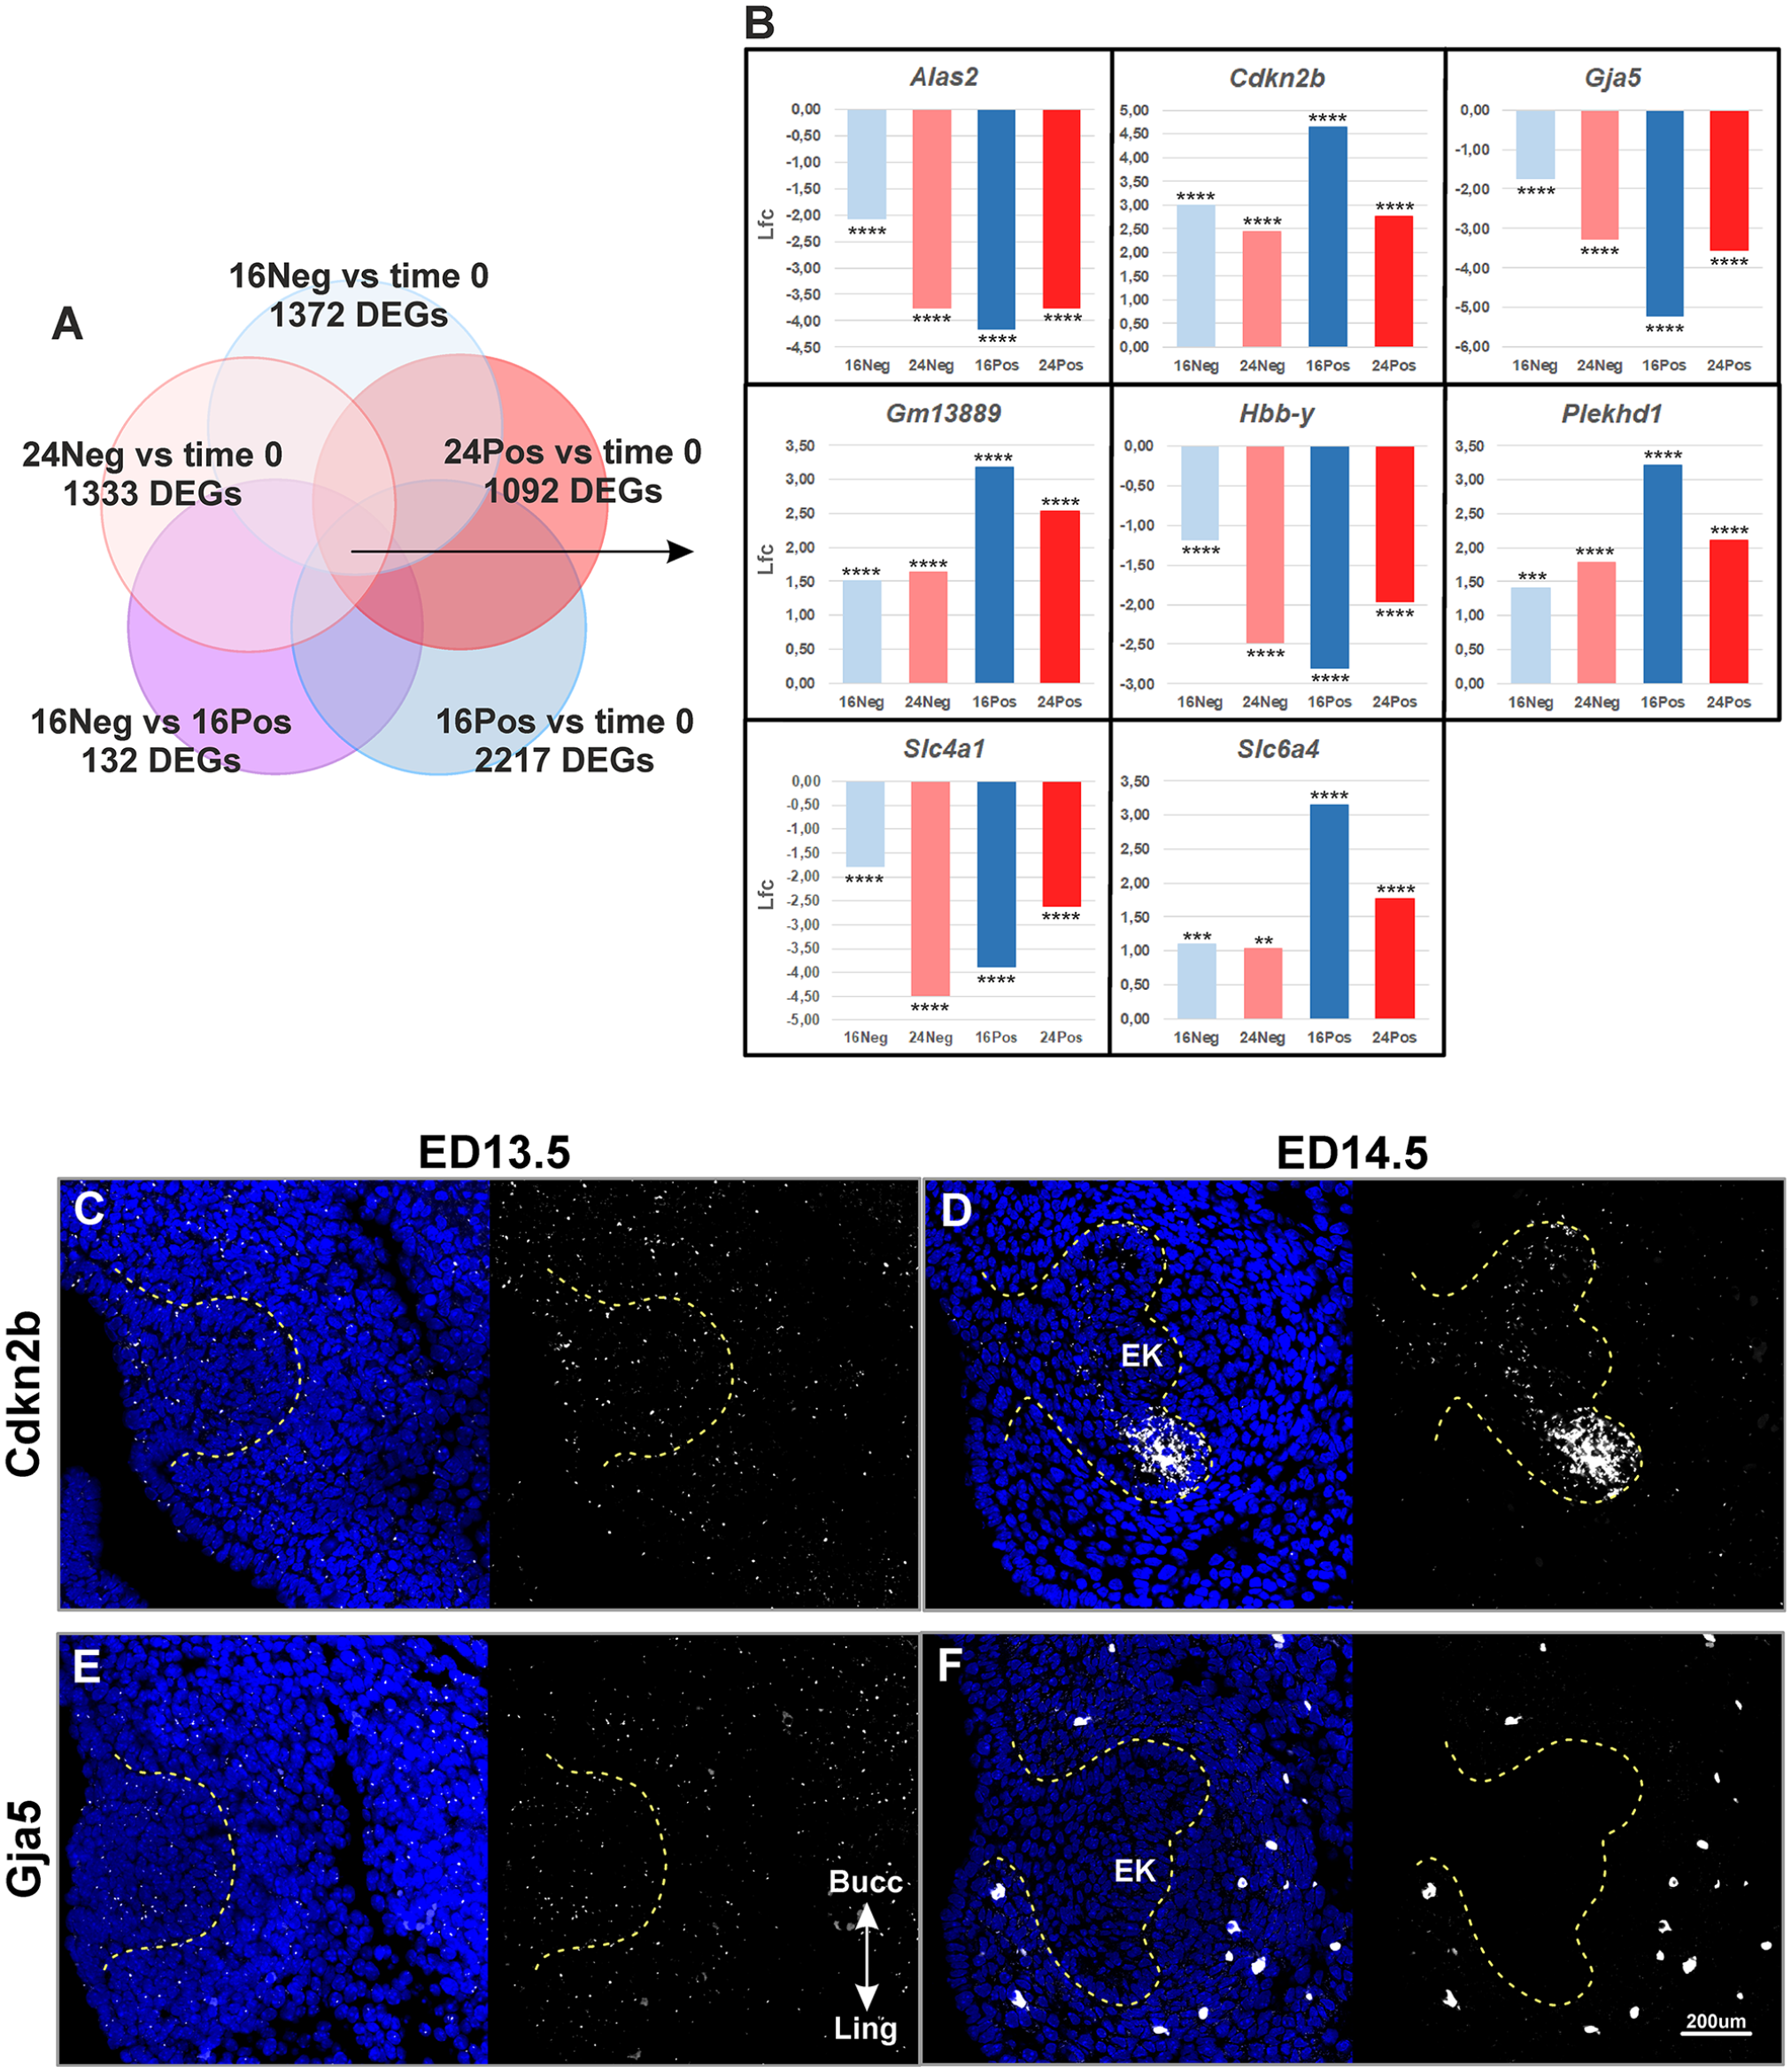
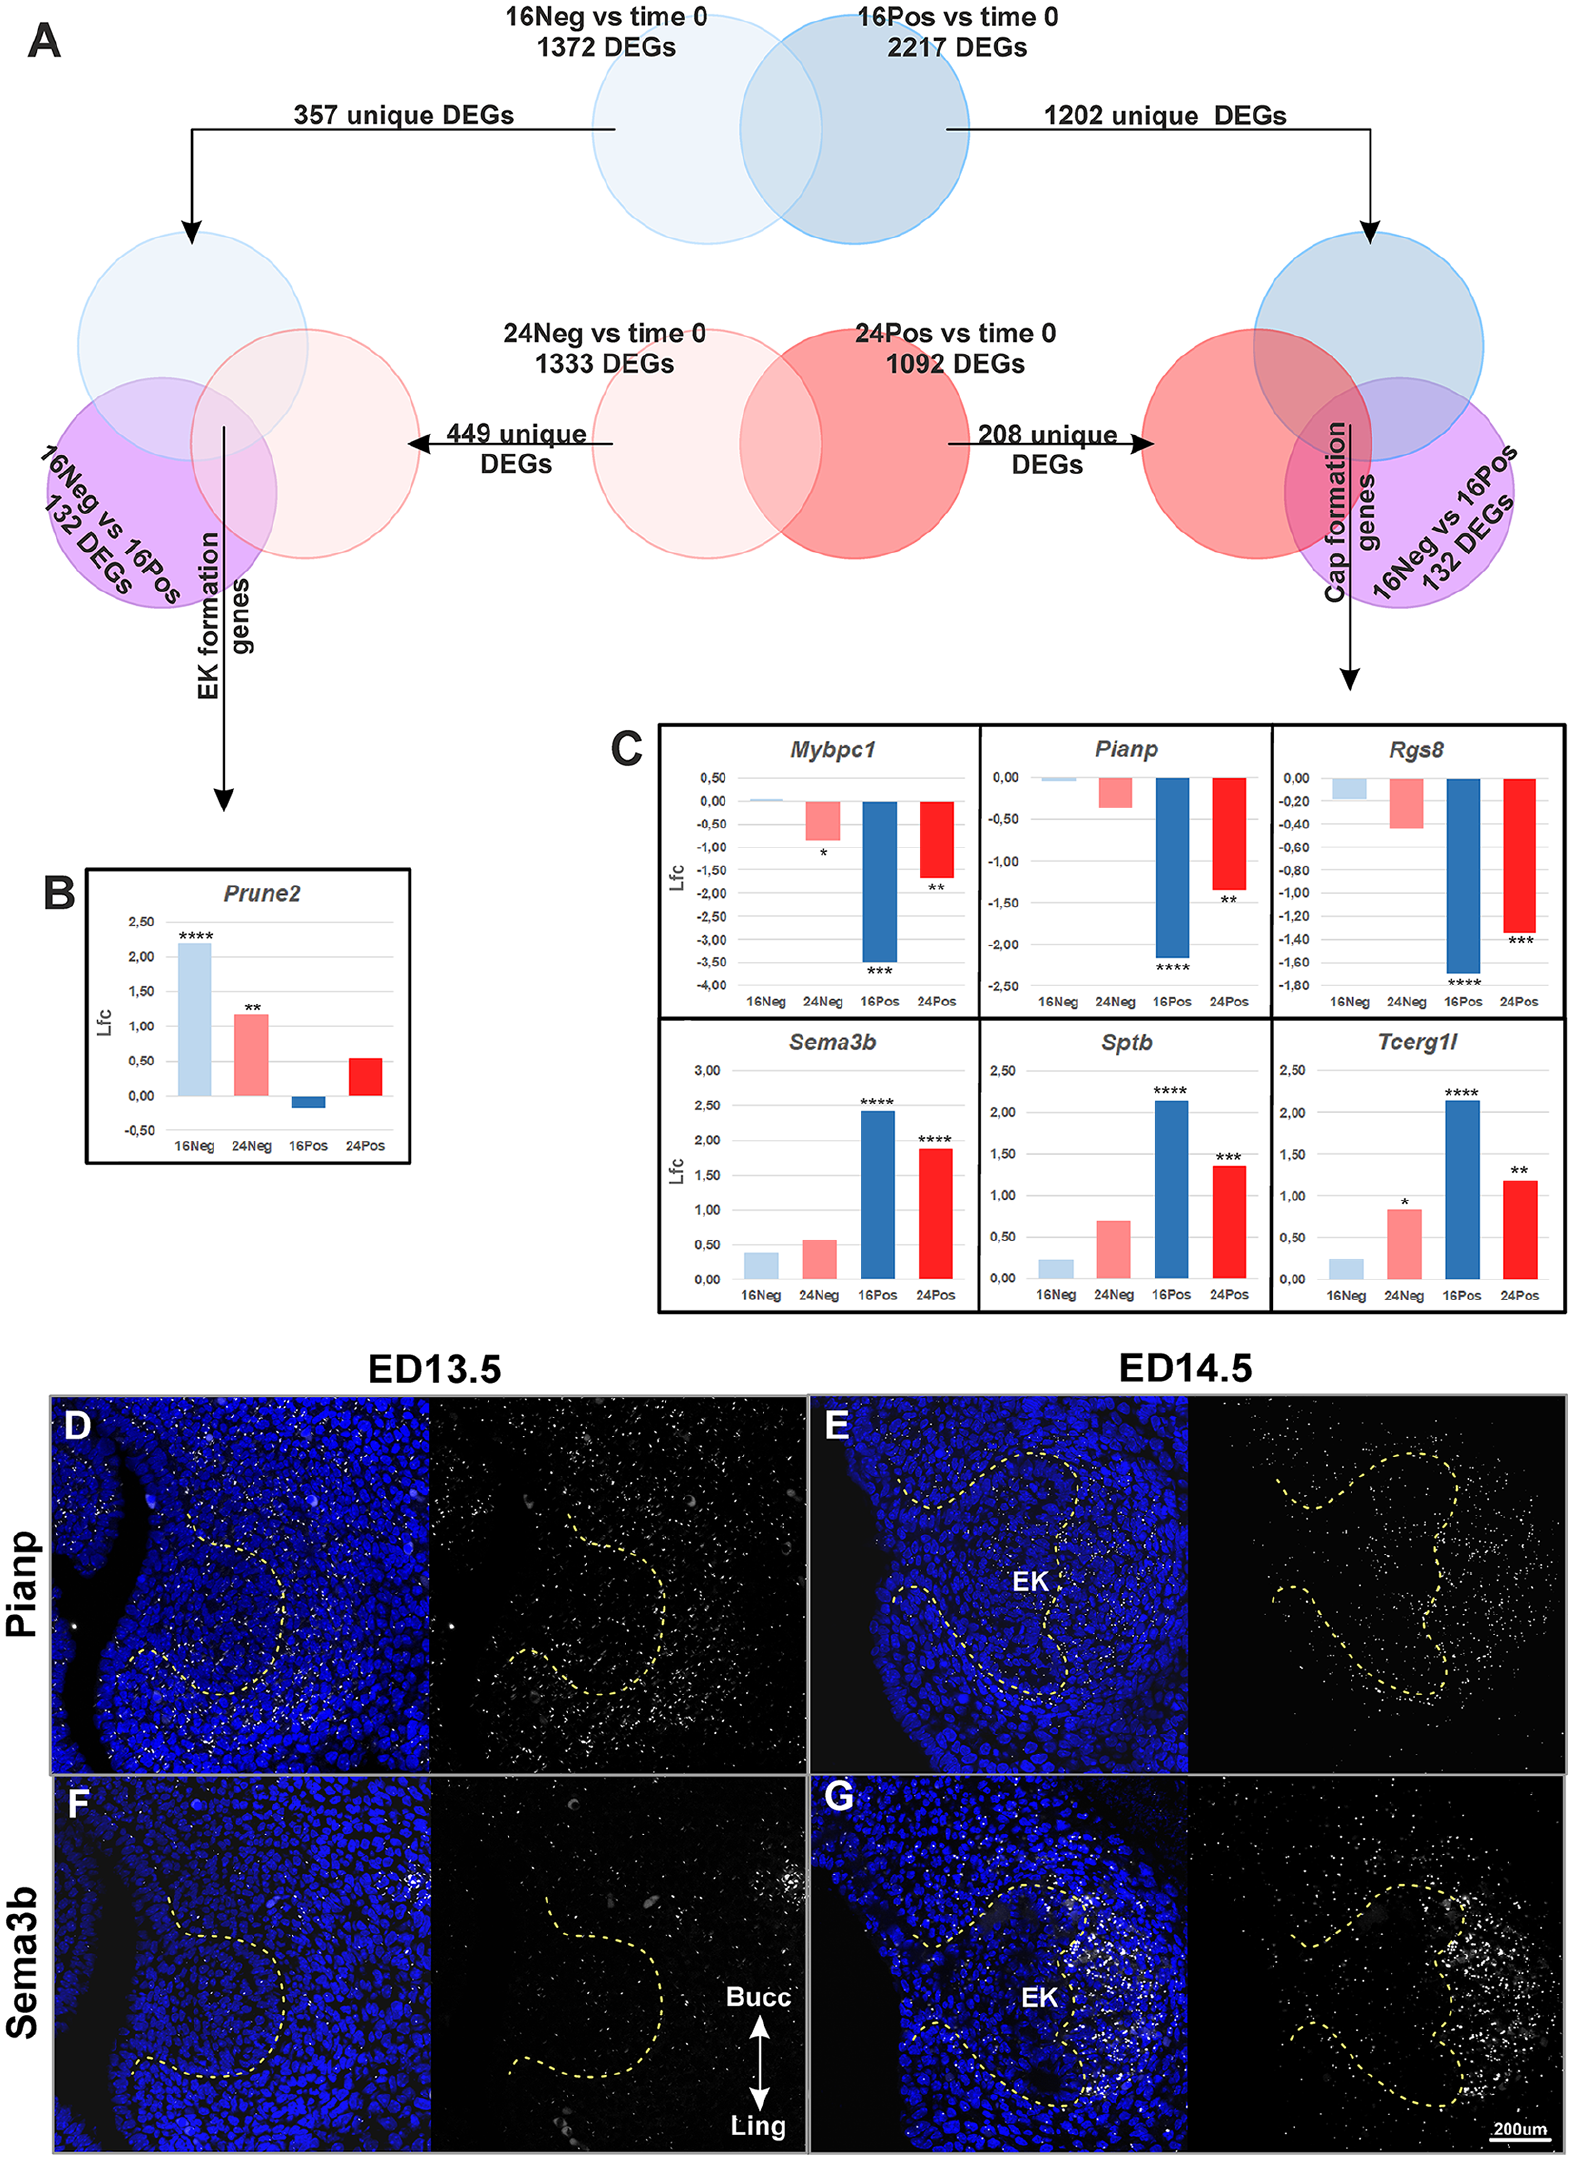
Even though our dataset contains valuable temporal information on tooth formation, the time of cultivation likely introduces confounding effects. Therefore, to screen for new candidate genes while mitigating for these confounding effects, we focused on the comparison of negative (Neg) and positive (Pos) samples at a given time of cultivation. The most dramatic developmental changes occurred between 16Neg and 16Pos samples, with 132 DEGs with an Lfc > 1 (26 upregulated and 106 downregulated) (Appendix Fig. 1C, arrow in Fig. 3B). In contrast, 24Neg and 24Pos samples did not show any statistically significant DEGs with an Lfc > 1. Next, we therefore focus on the 16Neg versus 16Pos comparison (Figs. 4 and 5) as the best comparison to capture genes involved in EK formation and cap transition, and we narrow down the list by imposing further constraints on the temporal dynamics from time 0.
Candidate genes related to both enamel knot (EK) establishment and maturation. (
Candidate genes more specifically involved in enamel knot (EK) establishment or early maturation. (
New Candidates Involved in M1 EK and Cap Formation
First, we searched for genes that were also differentially expressed in all time 0 comparisons (Lfc > 1) (Fig. 4A). We detected 8 overlapping DEGs: Alas2, Cdkn2b, Gja5, Gm13889, Hbb-y, Plekhd1, Slc4a1, and Slc6a4 (Fig. 4B, Appendix Fig. 3). In the 16Pos samples, these genes all tended to reach peak or trough when the EK had been firmly established, but they maintained a marked up- or downregulation relative to time 0 all through tooth formation in culture.
Second, we wished to more specifically reveal genes with early or late temporal regulation during tooth formation. To distinguish such regulation from possible in vitro regulations caused by time spent in culture, we used the selection scheme in Figure 5A. First, we removed the DEGs present in both 16Pos versus time 0 and 16Neg versus time 0 comparisons, as they may just reflect a 16 h cultivation and similarly for 24 h comparisons. Then, we further imposed that interesting genes should be regulated early, that is, DEGs in comparisons including the developmentally early samples 16Neg and 24Neg (left part in Fig. 5A), or instead regulated late (right part in Fig. 5A), that is, DEGs in comparisons including the developmentally older samples 16Pos and 24Pos. This strategy led to 1 early regulated gene, Prune2 (Fig. 5B, Appendix Fig. 4A) and 6 late regulated genes: Mybpc1, Pianp, Rgs8, Sema3b, Sptb, and Tcerg1l (Fig. 5C, Appendix Fig. 4B).
Cdkn2b and Sema3b Are Promising Candidates Based on RNAscope Validation
We selected several genes for RNAscope validation. To ensure that neither Shh heterozygosity nor cultivation conditions could be responsible for the observed regulation in RNAseq data, we compared expression at bud (ED13.5) and cap (ED14.5) stages in vivo, in control tooth germs on top of CD1/Shh/EGFP+ tooth germs (Appendix Figs. 5–7).
Several genes showed discrepancies with the RNAseq data. Gja5 was not downregulated at ED14.5 as expected (Fig. 4E, F; Appendix Figs. 6, 7D–F). Instead, its expression was upregulated in the mesenchyme at E14.5, detected in the appearing blood vessels. The discrepancy between RNAseq and RNAscope data is therefore likely due to the fact that vasculogenesis does not proceed properly in culture. The case of Rgs8 looked similar, although RNAscope data were less clear (Appendix Figs. 6, 7M–O). Finally, Prune2 regulation could not be confirmed, possibly because of very transient upregulation as seen in the RNAseq data (Appendix Fig. 4A). Pianp showed expression restriction between ED13.5 (whole mesenchyme) and ED14.5 (forming dental papilla and follicle only) (Fig. 5D, E), which seems inconsistent with the very sharp downregulation seen in the RNAseq data.
Two genes were fully consistent with RNAseq data. Cdkn2b was clearly upregulated in the early cap, with expression in the forming lingual cervical loop (Fig. 4C, D). Sema3b was upregulated, with marked expression in the dental mesenchyme at the cap stage (Fig. 5F, G).
Discussion
In this study, we took advantage of our precisely defined staging of tooth development as well as the visual detection of EK. Our samples were harvested at ED13.3 to 13.5, when the activation in the posterior region of the dental epithelium of the growing mandible is followed by a restriction of signaling to the prospective pEK of M1 (Sadier et al. 2019). We revealed new candidates related to EK and early cap formation.
Alteration of Fgf and Shh Pathways Led to Abnormalities in EK Establishment and M1 Germ Formation
Fgf and Shh pathways play numerous roles throughout tooth development (Du et al. 2018; Hosoya et al. 2020). Shh is produced in signaling centers of the tooth germs and diffuses in the adjacent tissues including the mesenchyme to regulate cap morphogenesis (Hardcastle et al. 1998; Dassule et al. 2000; Ohazama et al. 2009). Fgf ligands and receptors are part of the reciprocal communication of epithelium and mesenchyme that regulate progression to the cap stage in R2 and M1 (Klein et al. 2006). Fgfs produced by pEK support cell proliferation in the adjacent region (Kettunen and Thesleff 1998), while Fgfs produced in the mesenchyme support pEK formation (Klein et al. 2006). Defects in both pathways abolish the repression of R2 and lead to supernumerary tooth formation anterior to M1 (Lochovska et al. 2015). Given the competitive antagonism between R2 and M1 as revealed in Sadier et al. (2019), we wished to test the role of these pathways in our simplified setting, where the competition has been removed and a cap forms de novo from a bud stage.
Shh pathway inhibition allowed EK formation and further tooth development. However, tooth primordia were reduced and altered in their shape. Similarly, dental epithelium conditional Shh KOs were able to develop teeth but with severe morphological abnormalities and size reduction (Dassule et al. 2000). More interestingly, Shh pathway overactivation led to a failure of tooth germ development. This is very similar to results obtained in palatal rugae (Economou et al. 2012), where Shh plays the role of Turing inhibitor, and overactivation negatively feedbacks on Shh expression and arrests rugae patterning. Thus, our results obtained in our unique, simplified setting demonstrate that Shh plays the role of an inhibitor when an EK forms de novo in the invaginated bud, in absence of competition with R2.
Inhibiting the Fgf pathway compromised EK formation, and the explant arrested its development. A similar effect was observed in zebrafish tooth germs (Jackman et al. 2004). This is consistent with arrested development at the bud stage in Fgfr mutants (de Moerlooze et al. 2000) or delayed M1 pEK establishment and invagination of the cervical loops in transgenic mice with a downregulated Fgf pathway (Marangoni et al. 2019). Interestingly, Fgf activation allowed EK establishment, but it led to the arrest of tooth development in most explants (Fig. 2, Appendix Table 1). Longer overactivation finally led to EK disappearance. A negative effect of the Fgf pathway activation is observed in Sprouty mutants, where M1 pEK is delayed, but this can be interpreted in terms of the competition between R2 and M1 (Lochovska et al. 2015). To our knowledge, the negative effect we see here was not reported before. Of course, we cannot rule out that this is an unspecific effect of the small molecule used in this study. However, in hair, both Fgf disruption and Fgf overactivation also lead to morphogenesis arrest (Glover et al. 2017). Therefore, future studies may confirm that the right balance of Fgf signaling is necessary for correct formation and maintenance of EKs, independently of the competition with R2 seen in the wild-type mouse lower molar.
New Candidate Genes for Early Vasculogenesis in Teeth
Among the 132 candidate genes revealed in this study, we focused on genes whose expression changed by more than 2-fold in cultivated samples compared with time 0. These regulations could also be “artificially” induced by in vitro conditions. This is obviously the case for Alas2 and Hbb-y, the known erythrocytes markers (Li et al. 2019), whose downregulation is consistent with a lack of vasculogenesis in culture. We had selected Gja5 (CX40) for validation because connexins, including Gja5, were related to a skin and feather patterning (Watanabe and Kondo 2012; Tseng et al. 2024), but it is also important for circulatory system development (Márquez et al. 2023). RNAscope results suggested it is an early marker of endothelial cells resembling markers initiating vasculogenesis in the tooth germ (Vegfr2 and CD34) (Sunohara et al. 2024). This explains why we captured this gene as downregulated in vitro. Pianp evincing validation not consistent with RNAseq data was also discovered as a gene expressed in endothelial cells (Géraud et al. 2010). This suggests that, possibly, other actors of the earliest steps of tooth vasculogenesis remain to be discovered in our dataset.
New Candidate Genes Related to EK and Cap Formation
We also identified 2 interesting new candidates for EK and cap formation. Cdkn2b (p15) was described as a cell-cycle regulator inducing cycle arrest in the G1 phase due to transforming growth factor–β (TGFβ) signaling (Hannon and Beach 1994). In teeth, Cdkn2b (as well as Cdkn1a [p21]) were upregulated in smad7 KO, in which hyperactivated TGFβ signaling led to smaller molars, possibly through the upregulation of these cell-cycle inhibitors (Liu et al. 2019). RNAscope showed that Cdkn2b found in the lingual cervical loop has a different pattern from Cdkn1a detected previously in EK (Jernvall et al. 1994). It may therefore play a role in lingual cervical loop formation or in the prospective formation of the lingual secondary EK.
Sema3b is another promising candidate. First, its upregulation was confirmed and is specific to the young dental papilla (Fig. 5G, Appendix Figs. 6, 7P–R). Second, 2 other Semaphorin proteins were already shown to be essential in the developing tooth germ (Lallier 2004; Mammoto et al. 2011). Sema3a is expressed in the tooth under the control of epithelium–mesenchyme interactions and provides instructive information for molar innervation, but tooth formation appeared normal in the KO (Kettunen et al. 2005). In our case, Sema3a expression (Appendix Fig. 8) reached the lowest level in 16Pos. More interestingly, another member of the semaphorin family, Sema3f, was shown to be responsible for mesenchyme condensation during odontogenesis in an interplay with Fgf8 (Mammoto et al. 2011). In our analysis, the expression of Sema3f did not differ significantly (Appendix Fig. 8), but it is questionable whether Sema3b could play a similar role in mesenchyme condensation during EK formation.
In conclusion, 2 genes, Cdkn2b and Sema3b, clearly showed expression patterns suggestive of a role in EK and/or M1 cap formation and deserve further functional investigation. Furthermore, other genes from our lists remain to be validated.
Author Contributions
K. Steklikova, contributed to data acquisition, analysis, and interpretation, drafted and critically revised the manuscript; L. Dalecka, contributed to data acquisition and analysis, critically revised the manuscript; J. Kubovciak, contributed to data analysis, critically revised the manuscript; C. Corneloup, contributed to data acquisition, critically revised the manuscript; S. Pantalacci, contributed to conception and design, data analysis and interpretation, critically revised the manuscript; M. Hovorakova, contributed to conception and design, data analysis and interpretation, drafted and critically revised the manuscript. All authors gave final approval and agree to be accountable for all aspects of the work.
Supplemental Material
sj-docx-1-jdr-10.1177_00220345251316834 – Supplemental material for Factors Involved in Enamel Knot Establishment and Cap Formation
Supplemental material, sj-docx-1-jdr-10.1177_00220345251316834 for Factors Involved in Enamel Knot Establishment and Cap Formation by K. Steklikova, L. Dalecka, J. Kubovciak, C. Corneloup, S. Pantalacci and M. Hovorakova in Journal of Dental Research
Footnotes
Acknowledgements
We thank the reviewers for their valuable contribution in improving the quality of this study.
Declaration of Conflicting Interests
The authors declared no potential conflicts of interest with respect to the research, authorship, and/or publication of this article.
Funding
The authors disclosed receipt of the following financial support for the research, authorship, and/or publication of this article: The study was supported by the Charles University Grant Agency Project: GAUK 1312820, ELIXIR CZ research infrastructure (MEYS grant No: LM2023055), the COOPERATIO Program of Charles University, Prague, Czech Republic (207036-10 Morphological Disciplines of Medicine/LF1), the Ministry of Education, Youth and Sports and Campus France Czech-France Mobility Project Czech Republic-France researcher exchange (Nr. 8J19FR032, Campus France 42781RH), and the Barrande Fellowship Programme for short-term missions of PhD students in France. Claudine Corneloup’s salary was supported by Ecole Normale Supérieure de Lyon and Sophie Pantalacci’s salary by CNRS.
A supplemental appendix to this article is available online.
References
Supplementary Material
Please find the following supplemental material available below.
For Open Access articles published under a Creative Commons License, all supplemental material carries the same license as the article it is associated with.
For non-Open Access articles published, all supplemental material carries a non-exclusive license, and permission requests for re-use of supplemental material or any part of supplemental material shall be sent directly to the copyright owner as specified in the copyright notice associated with the article.