
Abstract
Malocclusion is a common oral health problem with a strong hereditary component. Previous genetic studies were limited by small sample sizes and low genomic coverage. To address these limitations, we conducted a genome-wide association study (GWAS) using array-based genotype data in 5 large, multiancestral cohorts. The study included 3,405 participants from the United States and its territories, the Philippines, Colombia, and Nigeria. Class II malocclusion was defined as an Angle’s class II molar relationship with an overjet >3.5 mm, class III malocclusion as an Angle’s class III molar relationship with a negative overjet, and class I malocclusion (controls) as an Angle’s class I molar relationship with an overjet of 0 to 3.5 mm. In the vertical plane, an anterior open bite of any magnitude was classified as “open bite,” while an overbite >3.5 mm was classified as “deep bite,” with controls having an overbite of 0 to 3.5 mm. Multiplanar malocclusion included cases with both sagittal and vertical discrepancies, with controls having an Angle’s class I molar relationship, an overjet of 0 to 3.5 mm, and an overbite of 0 to 3.5 mm. GWAS for each phenotype was conducted within individual cohorts before meta-analysis. We identified genome-wide significant associations (P ≤ 5E-08) at 11q22.3 (rs372564249, odds ratio [OR] = 3.12) and 3p24.3 (rs13060317, OR = 2.4) for class II and multiplanar malocclusion, respectively. Additionally, we observed a near-significant signal at 12q15 (rs1261646, OR = 1.9, P = 6.2 × 10⁻⁸) for class II malocclusion and a suggestive association at 1p21.3 (rs7541224, OR = 2.0, P = 1.7 × 10⁻⁷) for class III malocclusion. The 11q22.3 and 3p24.3 loci were QTLs for the PDGFD and SGO1-AS1 genes, and transcriptomic data showed consistent expression of these genes during facial development. These findings provide valuable insights into malocclusion etiology and lay the groundwork for genetic risk score development.
Introduction
Malocclusion is the third most prevalent oral disease, following dental caries and periodontitis (Alhammadi et al 2018). Its prevalence varies across populations and age groups, affecting between 39% and 93% of adolescents and teenagers worldwide (Cenzato et al 2021). Individuals with moderate to severe malocclusion often experience limited masticatory function, increased risk of periodontal disease, speech difficulties, and an unaesthetic facial appearance, which significantly impact self-esteem and overall oral health–related quality of life (Masood et al 2013; Oliver et al 2023; Zhou et al 2024). Malocclusion can be of dental or skeletal etiology or a combination of both (Mageet 2016). Depending on the affected plane in space, malocclusion can also be classified into sagittal (e.g., class II or increased overjet and class III or negative overjet, also known as underbite), vertical (e.g., open bite and deep bite), and transverse (e.g., posterior crossbite and scissors bite) (Rodríguez-Olivos et al 2022). Among these, the classification of malocclusion in the sagittal plane currently serves as the primary framework for orthodontic diagnosis and treatment planning, with more severe skeletal malocclusions requiring surgical correction (Qamaruddin et al 2018).
Malocclusion can be assessed using various measures, such as Angle’s classification, overjet, and overbite (Tang and Wei 1993). Angle’s classification, based on the relationship of the first permanent molars, is one of the most widely used systems for classifying malocclusion (Angle 1899). Class I, or ideal occlusion, occurs when the mesiobuccal cusp of the upper first molar occludes in the buccal groove of the lower first molar. In class II, the mesiobuccal cusp of the upper first molar occludes anterior to the buccal groove of the lower first molar, whereas in class III, it occludes posterior to the buccal groove of the lower first molar. Although originally developed to describe occlusal relationships of the dentition, Angle’s classification was later expanded to characterize skeletal intermaxillary relationships in the same plane, since sagittal dental occlusal relationships are often dictated by the relative position of the maxilla and mandible (Ngan and Moon 2015).
Like other complex traits, the etiology of malocclusion is multifactorial, involving an intricate interplay between genetic and environmental factors (Moreno Uribe and Miller 2015). Family-based studies have demonstrated a strong familial predisposition to malocclusion, with heritability estimates of 53% for overbite and 28% for overjet (Townsend et al 2009; Shrikant et al 2011). Early candidate gene studies of malocclusion explored associations between biologically plausible genes and various malocclusion phenotypes (Gershater et al 2021). Several studies have focused on the genetics of skeletal class III malocclusion or its common phenotypic expression, mandibular prognathism (see Appendix Table A). These studies used genomic technologies with limited coverage, such as microsatellite markers or Tag single-nucleotide polymorphisms (SNPs) within known craniofacial candidate genes, and were conducted with small sample sizes, focusing on specific populations. The low resolution of microsatellite markers (Jorgenson and Witte 2007) has limited the ability to identify risk loci and unravel new biological mechanisms underlying the etiology of malocclusion. More recently, family-based studies using whole-exome sequencing technology have reported potentially causal gene variants for class III malocclusion or mandibular prognathism (see Appendix Table A). While these reports have also been informative, the mutations identified are highly specific to the families studied. To address these limitations, we conducted genome-wide association studies (GWASs) on common nonsyndromic malocclusion phenotypes, leveraging array-based genotype data to identify novel loci and genes associated with malocclusion in 5 large, multiancestral cohorts. GWAS is an unbiased and powerful approach for detecting common variants by scanning millions of SNPs (genotyped or imputed) across the genome and, when applied to ancestrally diverse populations, enhances generalizability (McCarthy et al 2008).
Methods
Study Population and Recruitment
The study included participants from 5 cohorts: the Center for Oral Health Research in Appalachia cohorts 1 and 2 (COHRA1 and COHRA2), the Iowa Fluoride Study (IFS), Dental Strategies Concentrating on Risk Evaluation (DentalSCORE), and the Pittsburgh Orofacial Cleft Studies cohort 2 (POFC2). In total, there were 7,397 participants from the 5 cohorts, comprising individuals from the northern Appalachian region of the United States (West Virginia and Pennsylvania), Iowa, the Philippines, Colombia, Puerto Rico, and Nigeria (Appendix Table 1), respectively. Of these, 1,498 participants younger than 13 y were excluded to minimize the risk of misclassification, as the maxilla and mandible are still undergoing active growth during this period (Costello et al 2012). In addition, 1,096 participants with a history of orthodontic treatment and 1,398 with syndromic conditions or a family history of orofacial clefts were excluded, leaving 3,405 participants included in these analyses (Appendix Table 2a–d). Further details, including the inclusion criteria across study cohorts, are provided in the supplemental material (Appendix Notes 1).
Data Collection
Informed consent (or assent with parental consent from children) was obtained in accordance with the recruiting study protocol. Malocclusion data and demographic information, such as age, sex, and self-reported race, were collected. Malocclusion data were collected through dental examinations conducted by dentists or research dental hygienists, who underwent calibration at least annually (Appendix Notes 2). Angle’s classification was assessed clinically through intraoral examination and categorized as Angle’s class I, class II, or class III. Dental overbite was evaluated by measuring the level of overlap between the maxillary and mandibular incisors using a periodontal probe and was classified as deep bite, open bite, or normal overbite. Dental overjet was measured using a periodontal probe placed perpendicular to the facial surface of the mandibular central incisor and was recorded as overjet >3.5 mm, overjet 0 to 3.5 mm, or negative overjet (see Appendix Notes 2 for details on coding and harmonization of data across cohorts). Additional tooth-specific malocclusion measures, including tooth malposition (available only in the COHRA1 and COHRA2 datasets), crowding/spacing, or posterior crossbite and scissors bite (available only in the POFC dataset), were collected but not included in the analysis.
Phenotype Definitions
Class II malocclusion was defined as an Angle’s class II molar relationship with an overjet >3.5 mm, while class III malocclusion was defined as an Angle’s class III molar relationship with a negative overjet. Class I malocclusion was defined as an Angle’s class I molar relationship with an overjet of 0 to 3.5 mm and served as the control group for comparisons with the class II and III malocclusion groups. The lack of lateral cephalometric images and/or photographs of the head or face for each study participant precluded the confirmation of a skeletal contribution to the malocclusion phenotypes.
Regarding malocclusion phenotypes in the vertical plane, individuals with an anterior open bite of any magnitude were classified as “open bite” cases, while those with an overbite >3.5 mm were classified as “deep bite” cases. Individuals with an overbite of 0 to 3.5 mm served as controls. The sagittal and vertical classifications were treated as distinct phenotypes.
Multiplanar malocclusion was defined as a combination of sagittal (Angle’s class II or Angle’s class III molar relationship with their corresponding overjet) and vertical (open bite or deep bite) discrepancies. Controls for multiplanar malocclusion were individuals with an Angle’s class I molar relationship, an overjet of 0 to 3.5 mm, and an overbite of 0 to 3.5 mm.
Genotyping
Genotyping was performed in 3 batches at the Center for Inherited Disease Research (CIDR) using Illumina Infinium microarray platforms. Standard quality control procedures were applied (Laurie et al 2010). All genotyped data were imputed together using the TOPMed ver2 reference panel. Postimputation, approximately 9.9 million variants (imputation quality score [INFO] >0.3 and minor allele count [MAC] ≥20 or minor allele frequency [MAF] ≥0.01) passed quality control and were included in downstream analyses.
Statistical Analysis
Genome-wide single-variant association tests were performed using imputed dosage data in a logistic mixed-model framework implemented in SAIGE (Zhou et al 2018), accounting for relatedness and population structure. Analyses were adjusted for age and sex where applicable. Association testing incorporated the leave-one-chromosome-out (LOCO) scheme (Yang et al 2014) and saddlepoint approximation to address proximal contamination and case-control imbalance.
GWAS was conducted separately within each cohort prior to meta-analysis. Variants included in meta-analyses were restricted to those present across all contributing cohorts for each phenotype. Cohort-specific summary statistics were adjusted using genomic control, and fixed-effects meta-analyses were performed using METAL (Willer et al 2010). Quantile–quantile (Q-Q) plots were generated to evaluate residual stratification. Additional details are provided in Appendix Notes 1 of the supplementary methods.
Variant Annotation
We examined all GWAS-significant and suggestive associations using the UCSC Genome Browser to identify the genomic loci for the associated variants (https://genome.ucsc.edu/). LocusZoom (http://locuszoom.org/) was used to generate regional plots around the top associated loci. Additionally, we utilized GTEx (https://www.gtexportal.org/home) and RegulomeDB (https://regulomedb.org/regulome-search/) to assess whether any of the associated SNPs were located within regulatory elements or influenced gene expression. Furthermore, we leveraged craniofacial tissue bulk RNA sequencing (RNA-seq) and single-nucleus RNA expression data (Yankee et al 2023) to evaluate the expression of the genes identified at the top-associated loci in relevant craniofacial tissues during human facial development.
Results
The meta-analysis included 207 class II cases and 1,074 controls across 3 cohorts (COHRA1, COHRA2, and DentalSCORE), 169 class III cases and 759 controls across 2 cohorts (COHRA1 and POFC2), 105 open bite cases and 2,713 controls across 4 cohorts (COHRA1, COHRA2, IFS, and POFC2), 113 deep bite cases and 3,056 controls across all 5 cohorts, and 158 multiplanar malocclusion cases and 1,546 controls across all 5 cohorts (Fig. 1). Genome-wide significance was set at 5E-08, and the suggestive significance threshold was set at 5E-05. Power calculations are provided in Appendix Notes 3.
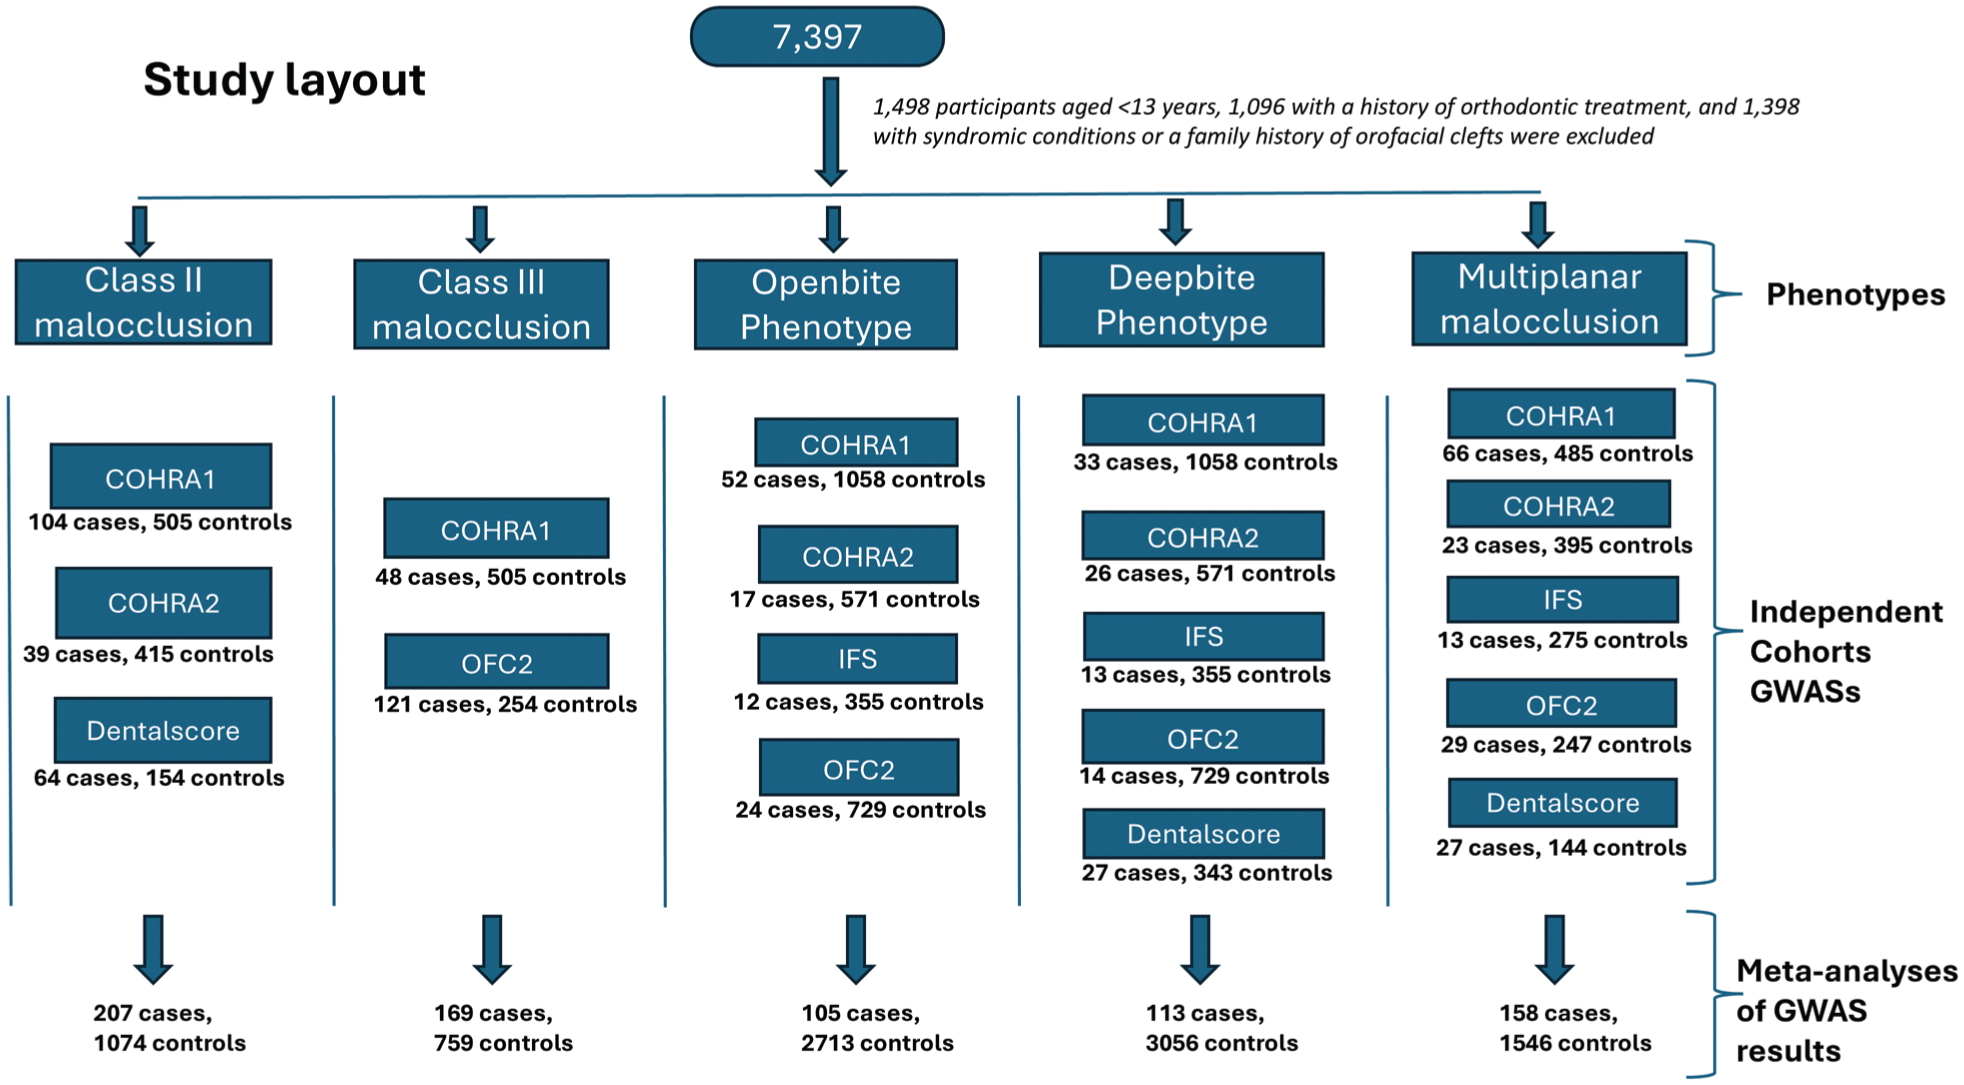
Summarized flowchart for the study layout.
We identified a genome-wide significant association with class II malocclusion at the 11q22.3 locus (rs372564249) in the intron of the PDGFD gene (odds ratio [OR] = 3.12, P = 4.2 × 10⁻⁸) and a near-significant association at 12q15 (rs1261646) in the intron of the noncoding RNA gene PRANCR (OR = 1.9, P = 6.2 × 10⁻⁸). For class III malocclusion, we observed a suggestive association at 1p21.3 (rs7541224) near the PLPPR5 gene (OR = 2.0, P = 1.7 × 10⁻⁷). The 3p24.3 locus (rs13060317) in the intron of the long noncoding RNA SGO1-AS1 showed a genome-wide significant association with multiplanar malocclusion (OR = 2.4, P = 3 × 10⁻⁸) (Table 1 and Fig. 2).
Meta-Analysis Results Showing the Lead SNPs Associated with Different Malocclusion Phenotypes, Human Dec. 2013 (GRch38/hg38_dbSNP Release 155).
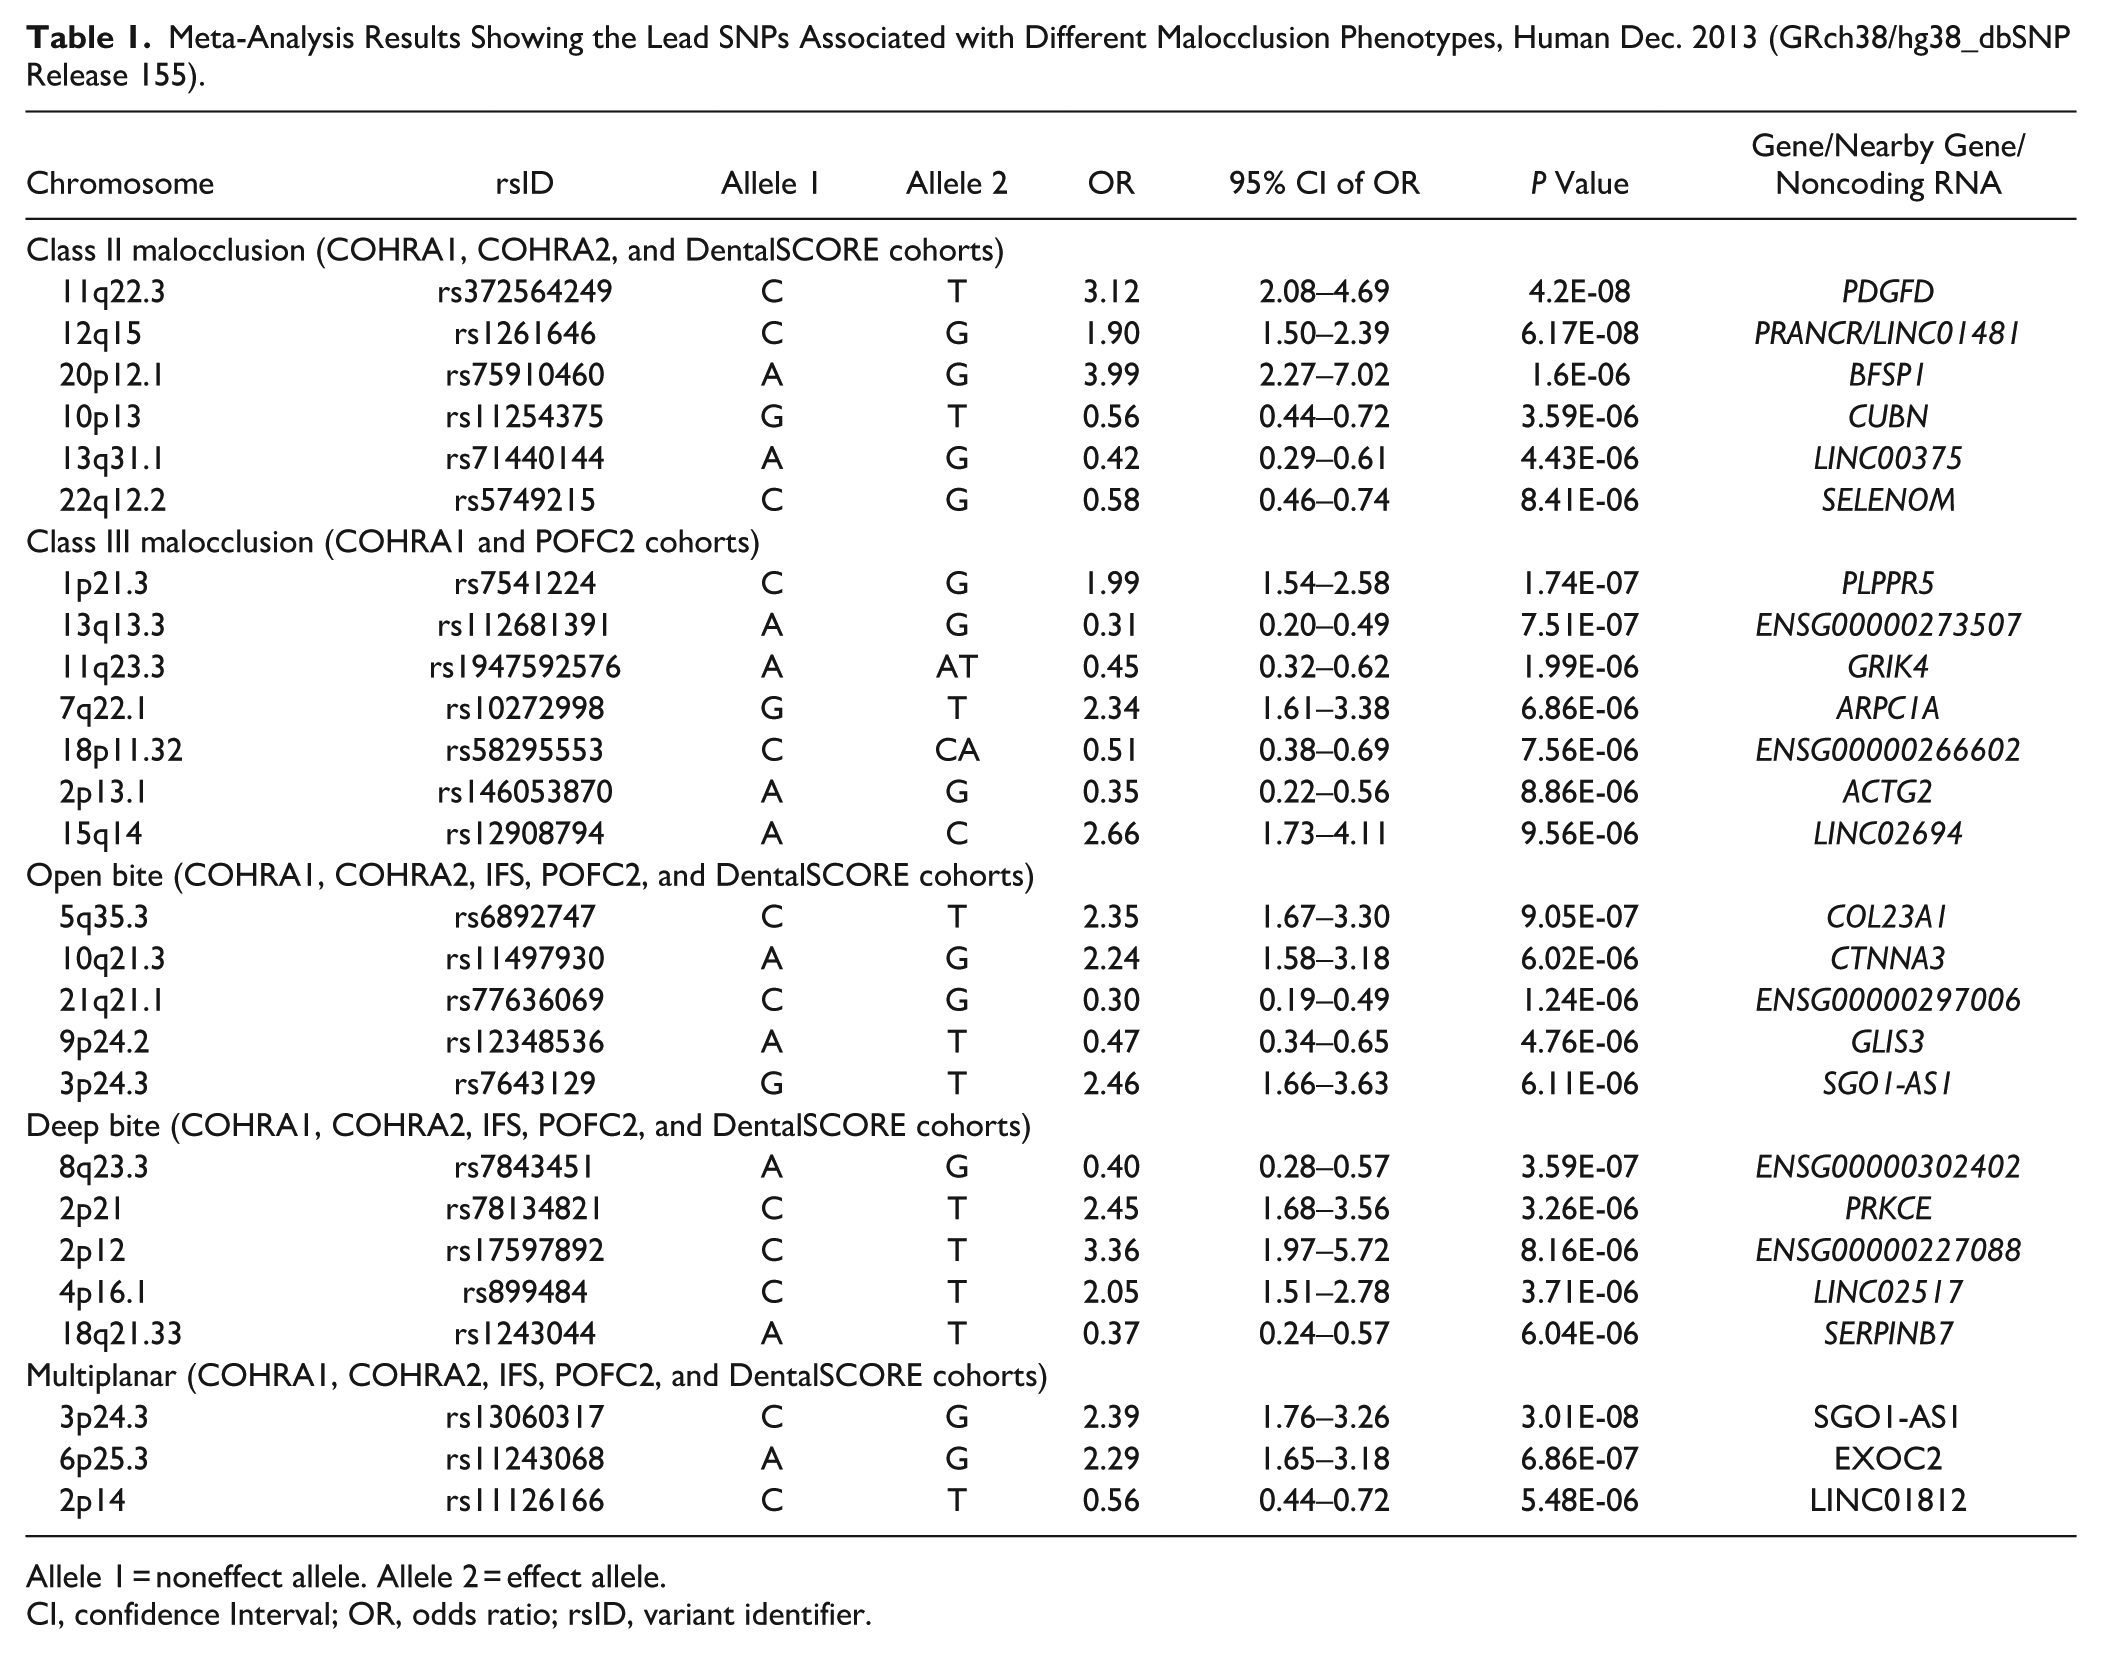
Allele 1 = noneffect allele. Allele 2 = effect allele.
CI, confidence Interval; OR, odds ratio; rsID, variant identifier.
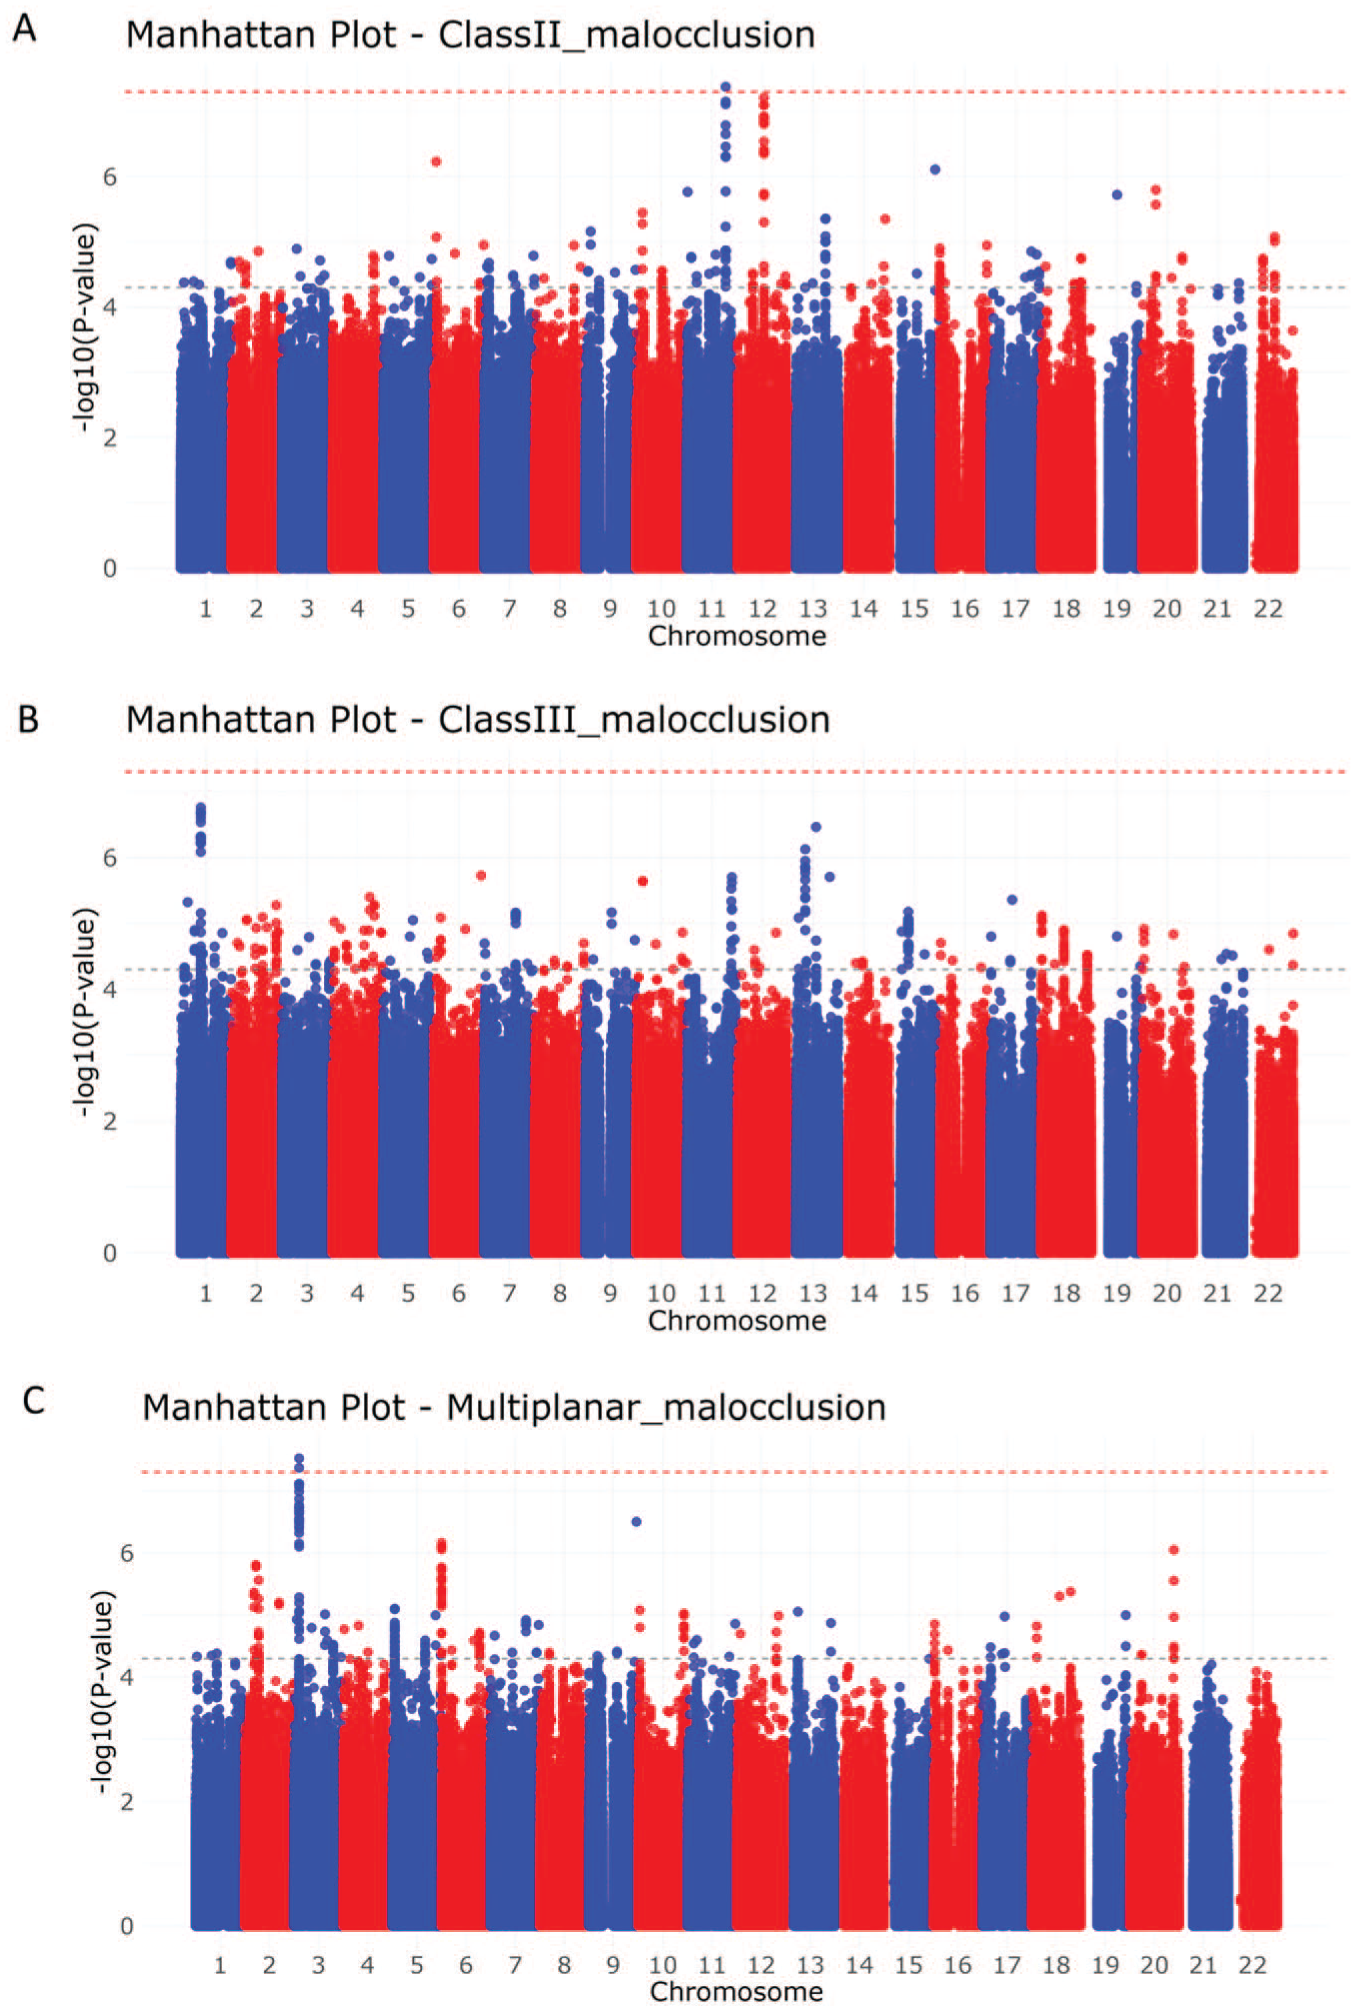
Manhattan plots for the meta-analysis results for (A) class II malocclusion, (B) class III malocclusion, and (C) multiplanar malocclusion.
Several other loci showed suggestive associations (P ≤ 5 × 10⁻⁵) across the different malocclusion phenotypes (Table 1 and Appendix Fig. 3). The Q-Q plots generated for the P value distributions showed no evidence of residual stratification, with genomic inflation factors ranging from λ = 1.006 to 1.07 in the individual cohort GWAS analyses and from λ = 0.99 to 1.02 in the meta-analyses (Appendix Fig. 4). We further performed meta-analyses including all variants present in at least 2 cohorts. No additional variants outside the loci identified in analyses restricted to variants shared across all included cohorts (by phenotype) reached genome-wide significance (Appendix Fig. 2).
The top associated loci at 11q22.3, 12q15, 1p21.3, and 3p24.3 (Fig. 3) were in QTLs for the PDGFD, PRANCR, SNX7, and SGO1-AS1 genes, respectively (Appendix Fig. 7). At 11q22.3, the risk allele (T) of the lead SNP rs372564249 (C/T) was in strong linkage disequilibrium with rs78383143 (R2 = 0.96), and this locus was identified as both an expression QTL (eQTL) and splice QTL (sQTL) for PDGFD. The lead SNP at 12q15 was identified as an eQTL for PRANCR. Similarly, the lead SNPs at the 1p21.3 and 3p24.3 loci were identified as eQTLs for SNX7 and SGO1-AS1, respectively. Additionally, bulk RNA-seq data from developing human craniofacial tissues showed consistent expression of these genes across Carnegie stages (CS) 13 to 22, corresponding to approximately 4 to 8 wk postfertilization. Single-nucleus RNA sequencing (snRNA-seq) data from CS20 embryos (~49 d postconception) further confirmed their expression across major craniofacial cell populations (Appendix Figs. 5 and 6).
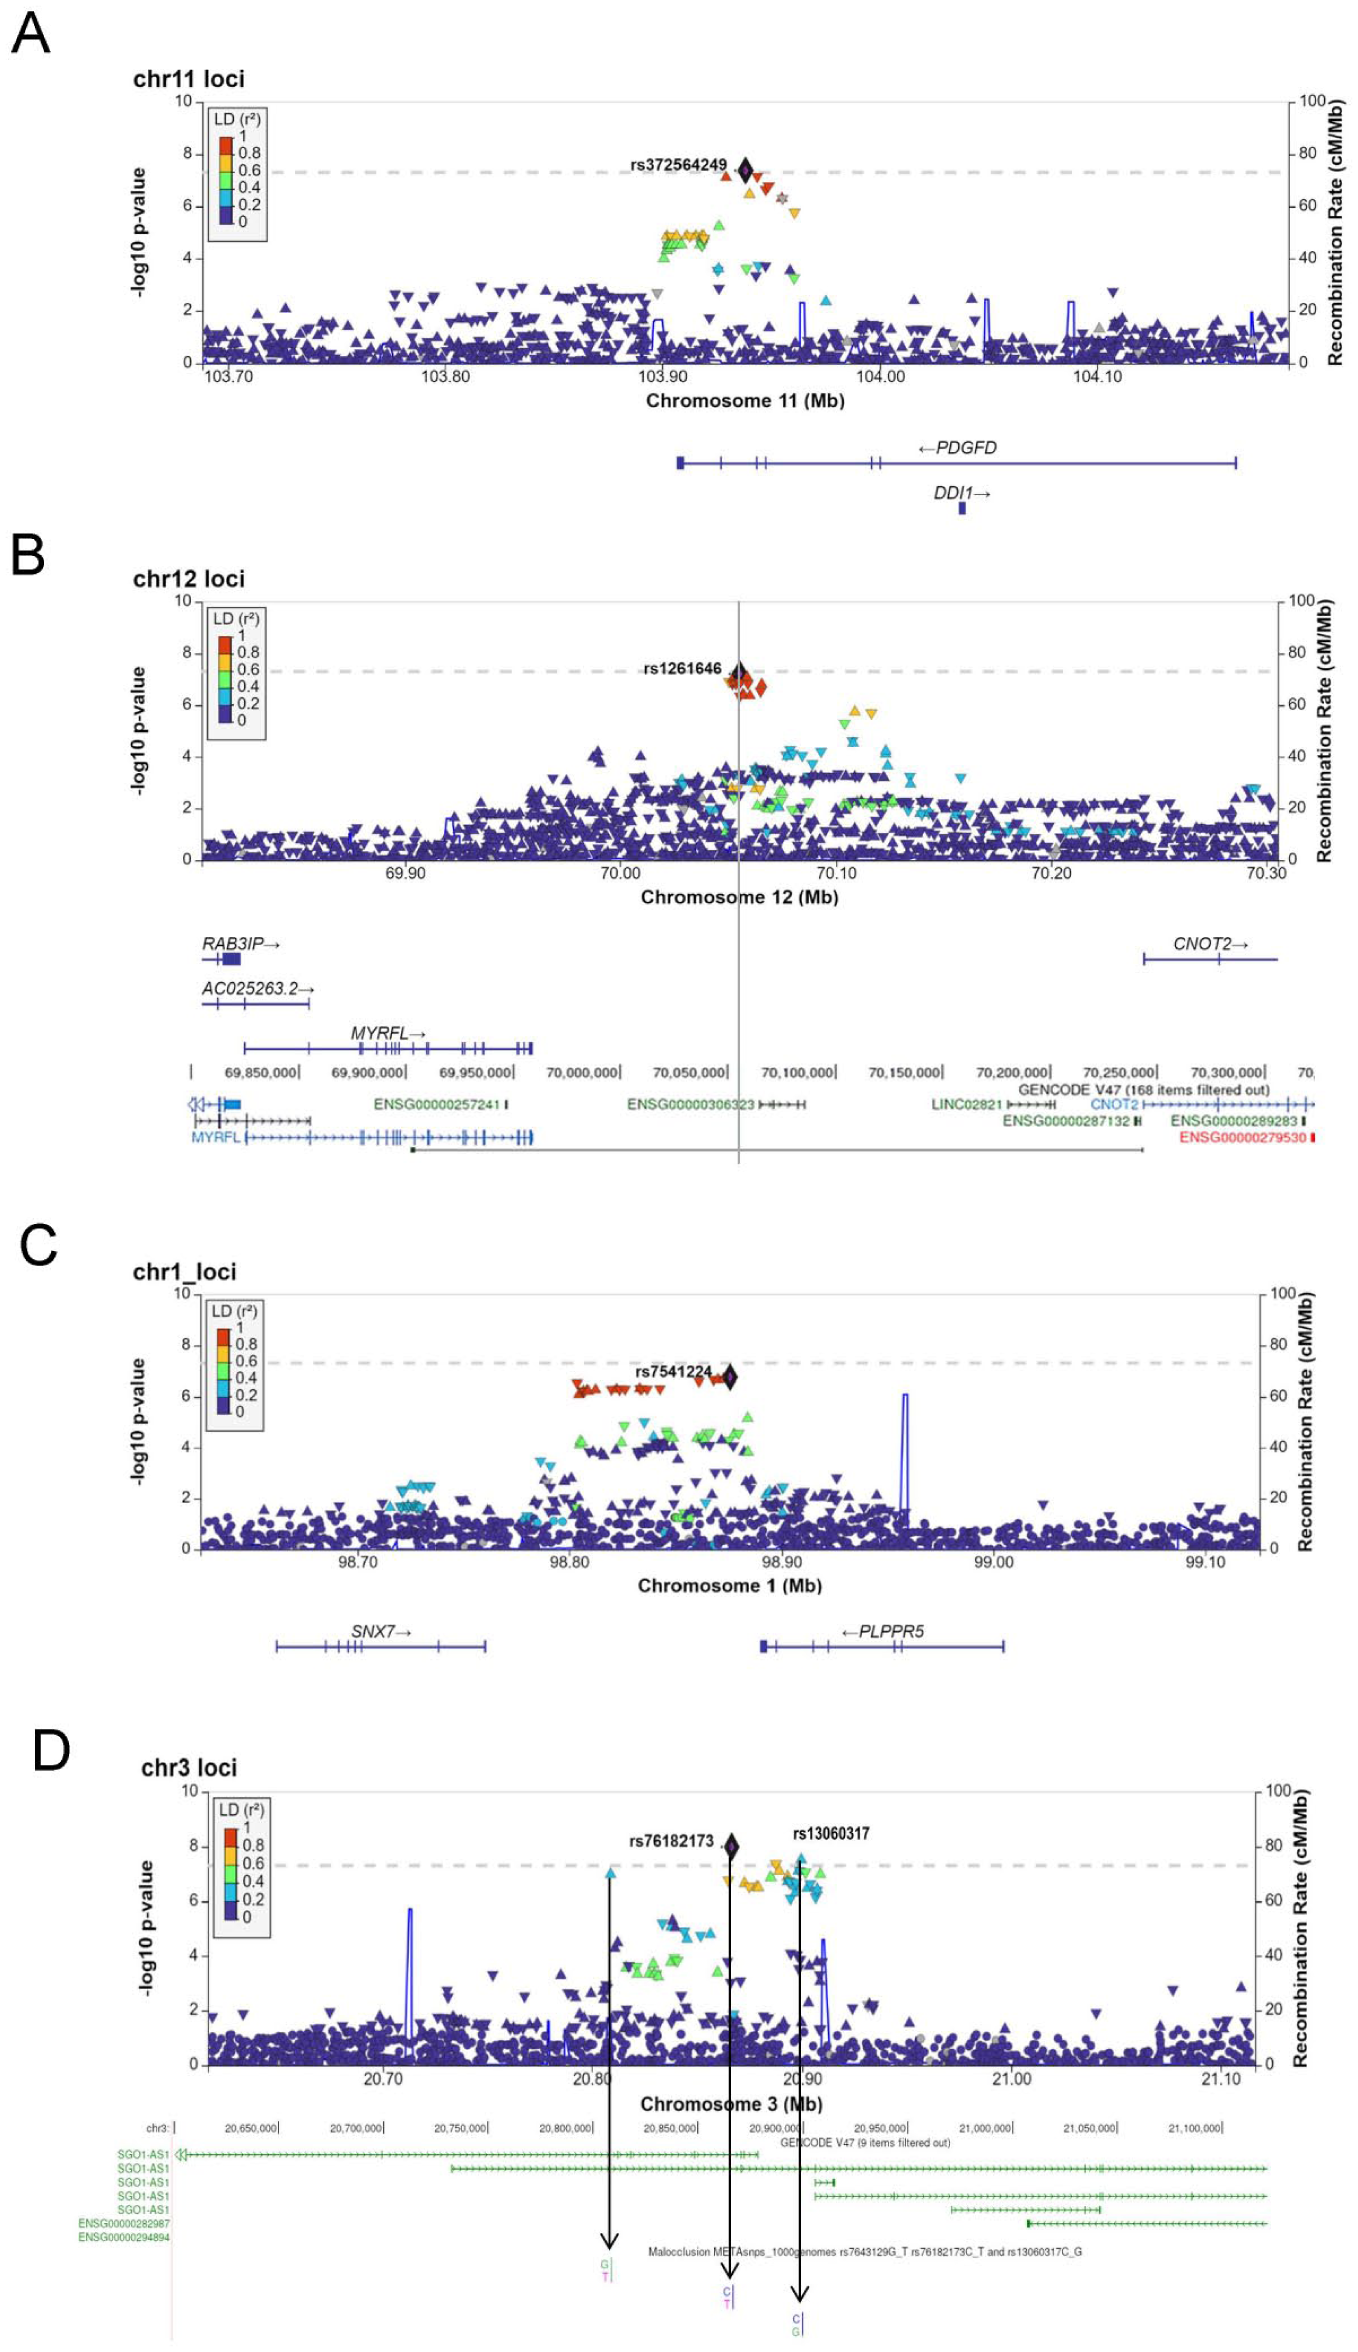
LocusZoom plots of the genomic region surrounding. (
To evaluate malocclusion-associated SNPs for their role in human facial shape variation, we tested the top loci (P < 5 × 10⁻⁵) for association with facial morphology using summary statistics from a facial shape GWAS meta-analysis of 4,680 US and 3,566 UK participants (full details are provided in the Appendix Notes 4). Although none of the associations met the predefined adjusted significance threshold (P < 2.00 × 10⁻³), rs66650217-EXOC2 (6p25.3) and rs10459670-LINC02694 (15q14) showed suggestive associations with facial shape (Appendix Table 3 and Appendix Fig. 8).
Discussion
This study investigated the genetics of nonsyndromic malocclusion phenotypes in multiancestral cohorts. Our findings replicated previously reported regions (11q22, 12q15, 2p13, and 4p16.1) and identified novel regions (1p21.3 and 3p24.3) associated with malocclusion phenotypes. Available QTL data suggest that the associated SNPs within these regions alter gene expression, and human transcriptomics data further support the possible involvement of these genes in craniofacial development.
The lead SNP at 11q22 is in strong linkage disequilibrium (R2 = 0.96) with rs78383143, which is an sQTL and eQTL for the
Although family-based studies have reported a strong genetic predisposition for class III malocclusion (Kudo et al 2005), no genome-wide significant locus was identified for class III malocclusion in this study. However, the top associated SNPs located within the 1p21.3 region showed strong suggestive associations, signifying that the lack of a genome-wide significant association could be attributed to the smaller sample size of class III cases. Previous genetic studies on skeletal class III malocclusion have identified several regions on the short arm of chromosome 1 (1p36, 1p35.3, 1p35.2, 1p22.3, 1p22.1) as being associated with mandibular prognathism (Jang et al 2010; Xue et al 2010; Ikuno et al 2014), suggesting a role for genes in the short arm of chromosome 1 in the regulation of mandibular size and/or position. The lead SNP rs7541224 in the 1p21.3 region identified in this study lies between the SNX7 and PLPPR5 genes. While no direct link between these genes and malocclusion has been reported, bulk and single-cell human transcriptomics data showed consistent SNX7 expression in craniofacial ectoderm and mesenchyme during development (Appendix Figs. 5 and 6). A suggestive association with class III malocclusion was also observed at the 2p13.1 locus rs146053870, an eQTL for the STAMBP gene (Appendix Fig. 7d), which encodes the STAM-binding protein. This protein maintains proper protein homeostasis and plays roles in signaling pathways critical for development (Tanaka et al 1999). Mutations in STAMBP cause microcephaly-capillary malformation (Carter et al 2021) syndrome, a condition characterized by distinctive facial features, including cleft palate and micrognathia - conditions that present with malocclusion. Additionally, the 2p13 region has been previously linked to mandibular size in mice (Dohmoto et al 2002). Furthermore, the SNP rs10459670 (15q14), which showed a suggestive association with class III malocclusion, also showed a suggestive association with variations in human facial shape, including the region overlapping the body and angle of the mandible.
Our analysis of multiplanar malocclusion identified a genome-wide significant association with rs13060317 at the 3p24.3 locus, an eQTL for the long noncoding RNA SGO1-AS1 (Appendix Fig. 7f), which reduces the stability of TGFB1/2 messenger RNA and inactivates TGF-β signaling (Huang et al 2021). TGF-β signaling plays a critical role in the formation of jaw skeletal components, including the coronoid, condyle, and angular processes of the mandible (Oka et al 2007). A separate analysis of vertical plane malocclusion phenotypes revealed a suggestive association between the 3p24.3 locus and open bite phenotype. Additionally, the 4p16.1 region, previously reported to be associated with mandibular prognathism (Li et al 2010) in a genome-wide linkage analysis, has SNPs that show a suggestive association with the deep bite phenotype in the current study. These findings suggest that loci influencing mandibular growth may contribute to a combination of sagittal and vertical plane malocclusion phenotypes, which usually represent a severe form of malocclusion. Another locus associated with multiplanar malocclusion is rs66650217 at the 6p25 locus, an eQTL for the EXOC2 gene (Appendix Fig. 6). Mutations in EXOC2, a subunit of the exocyst complex, have been linked to a syndrome that includes facial dysmorphism as part of its clinical presentation (Van Bergen et al 2020). Furthermore, the 6p25 locus showed a suggestive association with human facial shape variations (Appendix Fig. 8).
The strengths of this study include a large sample size, the use of dense SNP genotype data with imputation, the inclusion of multiple malocclusion phenotypes, and the use of a statistical analytic approach that accounted for the case-control imbalance in each cohort. A major limitation of this study is the absence of lateral cephalometric images or any other head or face images of the cohort participants, which would have allowed for confirmation of their skeletal diagnosis. However, previous studies have shown correlations between molar relationships and overjet with the ANB and Wits appraisals, respectively (Shrikant et al 2011; Al-Hamlan et al 2015), suggesting that their combination could serve as a good surrogate for diagnosing skeletal malocclusion in the sagittal plane (class II and class III). Nevertheless, our approach of combining these 2 measures (Angle’s class and overjet) may have excluded some skeletal malocclusion cases, such as skeletal class II division 2, which have class II posterior occlusal relationships but often normal overjet, and milder class III cases with an edge-to-edge anterior bite. As a result, the findings may not be generalizable to mild cases of class II and class III malocclusion. Furthermore, we could not perform independent replication, as no additional cohorts with comparable genotype and phenotype data were available. Therefore, future studies should integrate cephalometric data with clinical measures to allow for a more comprehensive and granular classification of skeletal malocclusions.
In conclusion, this study identified potential candidate genes for malocclusion, including PDGFD, SNX7, and STAMBP, as well as the long noncoding RNAs PRANCR and SGO1-AS1. To the best of our knowledge, this is the first array-based GWAS to evaluate multiple malocclusion phenotypes in multiancestry cohorts. Thus, these findings provide valuable insights into the genetics of malocclusion and will contribute to the development of genetic or polygenic risk scores, paving the way for novel management strategies to reduce the burden of malocclusion. However, caution is advised when applying these results to skeletal malocclusion phenotypes, as differences in phenotype definitions can influence genetic associations and should be carefully considered in risk modeling.
Author Contributions
A. Alade, contributed to conception and design, data acquisition, drafted and critically revised the manuscript; J.M. Maurer, M.-K. Lee, J. Anderton, S. Goovaerts, P. Claes, contributed to acquisition, analysis, and interpretation, drafted and critically revised the manuscript; K. Almpani, A. Adeyemo, S. Levy, J.K. Hartsfield Jr., L.A. Morford, J.R. Shaffer, B. Foxman, contributed to conception, data interpretation, drafted and critically revised the manuscript; A. Butali, S.M. Weinberg, L.M. Moreno Uribe, M.L. Marazita, J.S. Lee, contributed to conception and design, data acquisition, analysis, and interpretation, drafted and critically revised the manuscript; T. Peter, S. Miller, D.W. McNeil, contributed to acquisition and interpretation, drafted and critically revised the manuscript. All authors gave final approval and agree to be accountable for all aspects of the work.
Supplemental Material
sj-docx-1-jdr-10.1177_00220345261442129 – Supplemental material for Multiancestral GWAS of Dental Malocclusion Identifies Multiple Risk Loci
Supplemental material, sj-docx-1-jdr-10.1177_00220345261442129 for Multiancestral GWAS of Dental Malocclusion Identifies Multiple Risk Loci by A. Alade, J.M. Maurer, J. Anderton, M.-K. Lee, K. Almpani, S. Goovaerts, P. Claes, A. Butali, A. Adeyemo, S. Levy, J.K. Hartsfield, L.A. Morford, T. Peter, S. Miller, D.W. McNeil, J.R. Shaffer, B. Foxman, S.M. Weinberg, L.M. Moreno Uribe, M.L. Marazita and J.S. Lee in Journal of Dental Research
Footnotes
Acknowledgements
The authors thank Dr. Camden Bay for his contributions during the early stages of this project, the NIH/NIDCR Dental Clinical Research Fellowship Program for its support, and the members of the Lee Laboratory for their valuable contributions to this study. They are deeply grateful to all study participants. The content is solely the responsibility of the authors and does not necessarily represent the official views of the funders.
Declaration of Conflicting Interests
The authors declared no potential conflicts of interest with respect to the research, authorship, and/or publication of this article.
Funding
The authors disclosed receipt of the following financial support for the research, authorship, and/or publication of this article: This work was supported by research grants from the National Institutes of Health: R01-DE016148 (M.L.M., S.W.M.), R01-DE032122 (J.R.S., M.L.M., S.W.M.), and X01-HG011437 (J.R.S., M.L.M.), which funded the POFC2 study; R01-DE014899 (M.L.M., D.W.M., B.F., J.R.S.) and U01-DE018903 (M.L.M.) for COHRA1/DentalSCORE; R01-DE014899 (M.L.M., D.W.M., B.F., J.R.S.) and X01-HG009878 (J.R.S.) for COHRA2; and U01-DE018903 (M.L.M.), U01-DE028522 (S.L.), and R01-DE09551 (S.L.) for IFS.
Disclaimer
This research was supported in part by the Intramural Research Program of the National Institutes of Health (NIH). The contributions of the NIH author(s) were made as part of their official duties as NIH federal employees, are in compliance with agency policy requirements, and are considered Works of the United States Government. However, the findings and conclusions presented in this paper are those of the author(s) and do not necessarily reflect the views of the NIH or the U.S. Department of Health and Human Services (HHS).
Data Availability
![]() (record ID: 56-ES6P; accession: FB00001368; DOI: 10.25550/56-ES6P).
(record ID: 56-ES6P; accession: FB00001368; DOI: 10.25550/56-ES6P).
A supplemental appendix to this article is available online.
References
Supplementary Material
Please find the following supplemental material available below.
For Open Access articles published under a Creative Commons License, all supplemental material carries the same license as the article it is associated with.
For non-Open Access articles published, all supplemental material carries a non-exclusive license, and permission requests for re-use of supplemental material or any part of supplemental material shall be sent directly to the copyright owner as specified in the copyright notice associated with the article.