
Abstract
For the better part of the 21st century, opioid abuse and related consequences have beleaguered the United States. Effectively fighting the crisis may require a better understanding of potential differences among the types of opioids available as treating them as one homogeneous group may mask emerging trends and conflate more benign ones with those more troubling. The purpose of our study is to investigate changes in prescribing patterns of four groups of opioids (hydrocodone, oxycodone, fentanyl, and other) and how community-level factors explain their variation over time. We use a census tract–level data set with population, concentrated disadvantage, and prescription drug monitoring payment variables to address our goals. Findings show disparate prescribing patterns among the four types of opioids and considerable differences in the community factors that predict their change. Implications for future research and interventions follow.
Keywords
Introduction
During the 21st century, opioid abuse, addiction, and health-related consequences (e.g., overdose and death) have plagued the United States (Kolodny et al., 2015). Many—including former director of the Office of National Drug Control Policy, Michael Botticelli—are calling this the worst drug epidemic in our nation’s history (Hughes, 2016). Evidence (Quinones, 2015; Volkow & McLellan, 2016) shows the current crisis originated from a rise in legally prescribed opioids (i.e., Rx opioids) following various medical developments, such as the declaration of pain as a fifth vital sign, in the late 20th century that increased demand for them. The increased distribution and prescribing of Rx opioids (including such drugs as oxycodone, hydrocodone, fentanyl, and many others) in our nation, experts argue (Hughes, 2016), have led to an increased demand for cheaper illegal ones, for example, heroin, which have only worsened the problem. The havoc wreaked by fentanyl recently constitutes, perhaps, the latest and most troubling development in the nation’s opioid crisis (Seth, Rudd, Noonan, & Haegerich, 2018).
Effectively fighting the opioid crisis may require a better understanding of potential differences among the types of opioids available to the American public. Treating the great range of opioids as one homogeneous group of drugs may conflate relatively benign ones with those more troubling and/or mask important differences in prescribing patterns that could inform interventions to reduce opioid consequences.
Consider, for example, that certain types of Rx opioids are prescribed much more frequently than others and have had disparate impacts on patients. For example, hydrocodone formulations are the most often prescribed opioids in the United States (Drug Enforcement Administration [DEA], 2017), followed by oxycodone. Both treat chronic and acute pain associated with injury and illness and have multiple brand name formulations (Percocet and Vicodin) in high circulation.
Pharmaceutical—or legally prescribed—fentanyl, however, is used mostly in the United States to treat patients suffering chronic pain (Choo, Douriez, & Green, 2014) and is less often prescribed. The relative stability and low prescribing of pharmaceutical fentanyl (Peterson et al., 2016), coupled with the rise in illicitly manufactured fentanyl, has led experts to—perhaps—downplay its role in the escalation of the opioid problem. Yet, there are new concerns about it that warrant a closer look. First, U.S. senators (Armstrong, 2016) have recently called for limits on pharmaceutical fentanyl, given the national rise in fentanyl-related opioid deaths. They are worried it is adding to the opioid epidemic, especially overdose deaths. There is mounting evidence that pharmaceutical fentanyl is diverted to the illegal market (The Register-Herald, 2016; Vanderveen, 2016). The DEA acknowledged “Pharmaceutical fentanyl is diverted in its transdermal patch, lozenge, and liquid forms. Pharmaceutical fentanyl is often diverted in personal use quantities” (Blin et al., 2014; DEA, 2015). Also, pharmaceutical fentanyl might be one of the most unused prescribed meds, as measured by its surrendering at drug take back events and locations (Gray, Hagemeier, Brooks, & Alamian, 2015). Given these concerns and the use of pharmaceutical fentanyl among chronic pain patients, it is worthwhile investigating how prescribing patterns of pharmaceutical fentanyl have changed over time and how their predictors compare with those of other Rx opioids.
All three types of opioids (oxycodone, hydrocodone, and pharmaceutical fentanyl) have caused abuse, addiction, and other health-related consequences for the American public (Cicero et al., 2014). These three classes of opioids have also commanded most media attention, with recent studies showing declines in Rx opioid (Pezalla, Rosen, Erensen, Haddox, & Mayne, 2017) prescribing, especially with hydrocodone, given its reclassification as a Schedule II drug (DEA, 2014). While this may be initially reassuring, there are hundreds of “other opioids” (e.g., tramadol, diluadid, demerol, opana, kadian, avinza, etc.) prescribed daily. Increases in “all other opioids” could offset gains in combating overprescribing of some the more popular opioids and, ultimately, hinder progress combating the problem.
An Environmental Understanding
To date, most of the attention to the opioid epidemic has been on general Rx opioid abuse at the individual level: those contributing to the problem (doctors and other prescribers and civilians involved in drug diversion) or individuals suffering from opioid use disorders. This micro orientation fails to recognize the environmental aspects of the opioid problem, rendering our attention to community-level predictors as important in combating the problem.
Today, researchers understand that “environments operate jointly with individual factors to influence the risk of substance abuse” (Cerdá et al., 2013, p. 2252). Such community-level problems are often a function of characteristics of communities. Such traits include population distribution and concentrated disadvantage patterned across geographical space. This is because disadvantaged or socially disorganized communities expose residents to higher levels of poor health outcomes, including psychological stress, anxiety and depression, drug addiction, and alcoholism (Cerdá et al., 2017; Cho, Johnson, Fendrich, & Pickup, 2013; Molina, Alegría, & Chen, 2012).
A few studies have shown the value of understanding community-level predictors of opioid prescribing and consequences. For example, Cerdá et al. (2013; Cerdá et al., 2017), Hall et al. (2008), and Modarai et al. (2013) have linked community factors to opioid overdose and mortality. Yet, their work does not address community-level predictors of different Rx opioids and their potential variation geo-spatially and over time. Rigg and Monnat (2015) compared Rx opioid users with heroin users, concluding that they were least likely to be associated with concentrated disadvantage measures. However, they did not investigate such community-level predictors across types of opioids. Investigating such community-level predictors of change in the four Rx opioids is, therefore, the second objective of our study.
Given this, our article has two main objectives. The first is to unpack changes in oxycodone, hydrocodone, pharmaceutical fentanyl, and all other opioids prescribing over time to shed some scientific evidence on the current U.S. epidemic involving these drugs. We compare changes in prescriptions for oxycodone, hydrocodone, pharmaceutical fentanyl, and all other opioids across Delaware communities between the first quarter of 2013 (Q1 2013) and the last quarter of 2014 (Q4 2014), representing a 2-year period. Second, we investigate how community-level indicators, such as population composition, concentrated disadvantage, and prescription drug indicators (e.g., type of payment) explain changes in prescription patterns for these types of opioids. These two quarters land solidly within the opioid epidemic period affecting not only the state of Delaware, but also the United States more broadly (Kertesz, 2017; Volkow & McLellan, 2016). As the second smallest state in the country, Delaware currently ranks among the top 10 states with the highest overdose death rates (Centers for Disease Control and Prevention [CDC], in press). Delaware also ranks high in opioid prescribing rates (Paulozzi, Strickler, Kreiner, & Koris, 2015). Therefore, drilling down into changes in type of opioid prescribing over time could reveal important variations masked by studying all opioids or groups together. Recommendations for prescribing practices in Delaware and elsewhere could follow.
Analytic Approach
Data and Sample
The present study utilizes an enhanced prescription drug monitoring program (PDMP) data set to address its purposes. Forty-nine states have a PDMP currently. PDMP data are a direct indicator of the prescribing practices of medical personnel and a secondary marker of patient needs, behavior, or conditions. This is because the PDMP tracks prescriptions to certain drugs, which medical staff administer to patients for their conditions or needs. Doctors or other medical staff decide which drugs, that is, types of opioids, to prescribe to patients. Using an enhanced PDMP data set with community predictors from the U.S. Census, we can improve our understanding of not only community-level prescribing patterns (measured at the census tract–level) over time and by type of opioid, but also the environmental factors driving them. Therefore, our investigation should contribute to the literature on opioids and assist policy makers and practitioners in developing effective interventions to the current opioid epidemic.
The Delaware Prescription Monitoring Act (16 Del. C.§ 4798) authorizes the Office of Controlled Substances (OCS) in the Delaware Division of Professional Regulation to establish, maintain, and monitor the PDMP to reduce misuse of controlled substances in Delaware and to promote improved professional practice and patient care. The PDMP was launched by the governor’s office on August 21, 2012. The PDMP database collects information of all controlled substances Schedules II to V.
In 2014, we received federal funds 1 to enhance Delaware’s PDMP with other data (e.g., U.S. Census, crime, and overdose death) sources and to perform community-level (i.e., census tract–level) hot spots analysis of the geo-spatial distribution of opioid risk factors. Merging U.S. Census demographic data (2010 and 2012) with the PDMP data permits us to investigate how communities’ demographic and prescribing information predict the geo-spatial distribution of oxycodone, hydrocodone, pharmaceutical fentanyl, and all other opioids over time (i.e., Q1 2013 and Q4 2014).
Each opioid prescription in the PDMP is written to an individual patient, which we geo-coded using ArcGIS software. Once geo-coded, these prescriptions were aggregated to their respective U.S. census tract, just as survey responses to civilians are computed to tracts in the U.S. 2010 Census. The resultant data set is an analysis of 214 Delaware census tracts (N = 214 2 ), that is, our community proxy, each having values representing oxycodone, hydrocodone, pharmaceutical fentanyl, and all other opioids prescriptions for the two time points as well as values for community-level predictors. Fitting spatial regression will help identify distinct patterns across type of opioid and an understanding of the unique community-level factors driving such patterns.
Variables
Our study includes 16 variables, entered simultaneously in a comprehensive model at first, then in an iterative basis to isolate significance and produce parsimonious models, measured at the census tract–level (N = 214). Models include six U.S. Census population variables from the 2010 U.S. Census: percent White population, 3 American Indian and Alaskan Natives, Asian, Native Hawaiian and Pacific Islander, and two or more races, and Hispanics; and two variables from the 2012 American Community Survey (ACS): percent disabled population and percent veterans. We also analyzed five predictors of concentrated disadvantage from the U.S. Census website: mean home value, percent population with high educational attainment 4 (calculated), mean household income, percent unemployed, and percent without health care. Finally, we included three PDMP payment variables in our analyses: payment by commercial insurance, Medicaid/Medicare, and private (personal cash). In total, our analyses investigated 16 community demographics, concentrated disadvantage, and Rx variables on the four categories of opioids for the 214 Delaware census tracts.
Analysis Technique
We have two objectives for our statistical analysis. First, we investigate if there is change in the number of prescriptions for oxycodone, hydrocodone, pharmaceutical fentanyl, and all other opioids between Q1 2013 and Q4 2014. Second, we also study possible community-level predictors of change in types of opioids through comprehensive and iterative spatial modeling. To quantify the change in prescriptions, we simply subtracted prescriptions in Q1 2013 from those in Q4 2014, 5 and we regard this difference as a response variable. Therefore, our study has four response variables (oxycodone, hydrocodone, pharmaceutical fentanyl, and all other opioids) in total. The following paragraphs describe univariate and multivariate spatial regression to meet our two objectives.
Univariate Analysis
To evaluate if the change in prescriptions of an opioid type is significant between the two periods, we fitted a linear model with only an intercept and tested the significance of the intercept. Before fitting the model, we first applied Moran’s I test (Moran, 1950) to detect spatial autocorrelation across census tracts. If spatial correlation was not strong (i.e., the p value in the Moran’s test >.05), we applied the traditional ordinary least squares (OLS) method to fit the model. Otherwise, the generalized least squares (GLS) approach (Aitken, 1936) was used instead, as the OLS approach is no longer efficient. To apply the GLS approach, which requires modeling the spatial correlation properly, we chose from three candidate structures, including exponential correlation, Gaussian correlation, and no correlation. Among three GLS fits, one with each spatial structure, we adopted the best one that achieved the smallest Akaike information criterion (AIC; Akaike, 1974). Table 3 shows the results.
Multivariate Analysis
For each response variable, 6 we fit a linear model to assess its relationship with all community and PDMP payment predictors. For each change score, we also controlled for its Q1 2013 in the model. For each model, we first obtained an OLS fit, and then performed the Moran’s I test for the residuals to check if it was necessary to accommodate potentially strong spatial correlation. If the Moran’s I test was significant, we opted for the best GLS fit as in the univariate analysis. No Moran’s I tests were significant, rendering all results in the “Full Model” columns in Tables 4 to 7 based on OLS fits.
As the number of community predictors in each full model is large, some predictors that may ultimately explain the response variable may not reach significance. This would undermine their interpretation. To eliminate redundant predictors, and improve interpretation of our results, we performed a model selection procedure, where we obtained OLS fits of all possible subsets of predictors and identified the best model that achieved the smallest Bayesian information criterion (BIC, Schwarz, 1978). The best OLS fit may be updated by a GLS fit, if necessary, but the Moran’s I test shows it was not.
The results of these best OLS fits are given in the “Reduced Model” columns in Tables 4 to 7, where coefficient estimates are only available for those predictors contained in the best OLS fits. If a reduced model has sufficient interpretability of the data, compared with its corresponding full model, we report their total R-squared values, and the p value of the F test for model comparison in Tables 4 to 7. An insignificant F test (its p value >.05) implies that the benefit of using the full model is minimal, thus indicating preference for the reduced model.
Limitations
Our study focuses on opioid prescriptions at two time-periods only. Future studies should investigate additional ones to study the time-dynamic patterns of opioid prescriptions and the time-varying effects of various predictors on opioid prescriptions. Also, our article focuses on the state of Delaware only. As the nation is currently suffering an opioid problem, with high rates of prescribing considered a origin of it, similar research in other states that compares patterns of opioid prescriptions and explores the factors that may contribute to their similarities or differences is advised to further assess the findings we report below.
Findings
Table 1 provides means and standard deviations of our predictor variables. The population and concentrated disadvantage variables represent average tract values from either the 2010 Census or the 2012 ACS. For example, in 2010, Delaware census tracts were about 69% White, 8% Hispanic, 3% Asian, and about 2.5% two or more races. The tract population for American Indians, Alaskan Natives, Hawaiians, and Pacific Islanders was less than 1% each. The percent White population was highly varied across census tracts with a standard deviation of 22%. Alternatively, the 2012 ACS shows Delaware census tracts averaging about 13% disabled population and 11% veteran population. Both the disabled population and that without health care were also highly diverse, reporting high standard deviations.
Descriptive Statistics of Community Predictors.
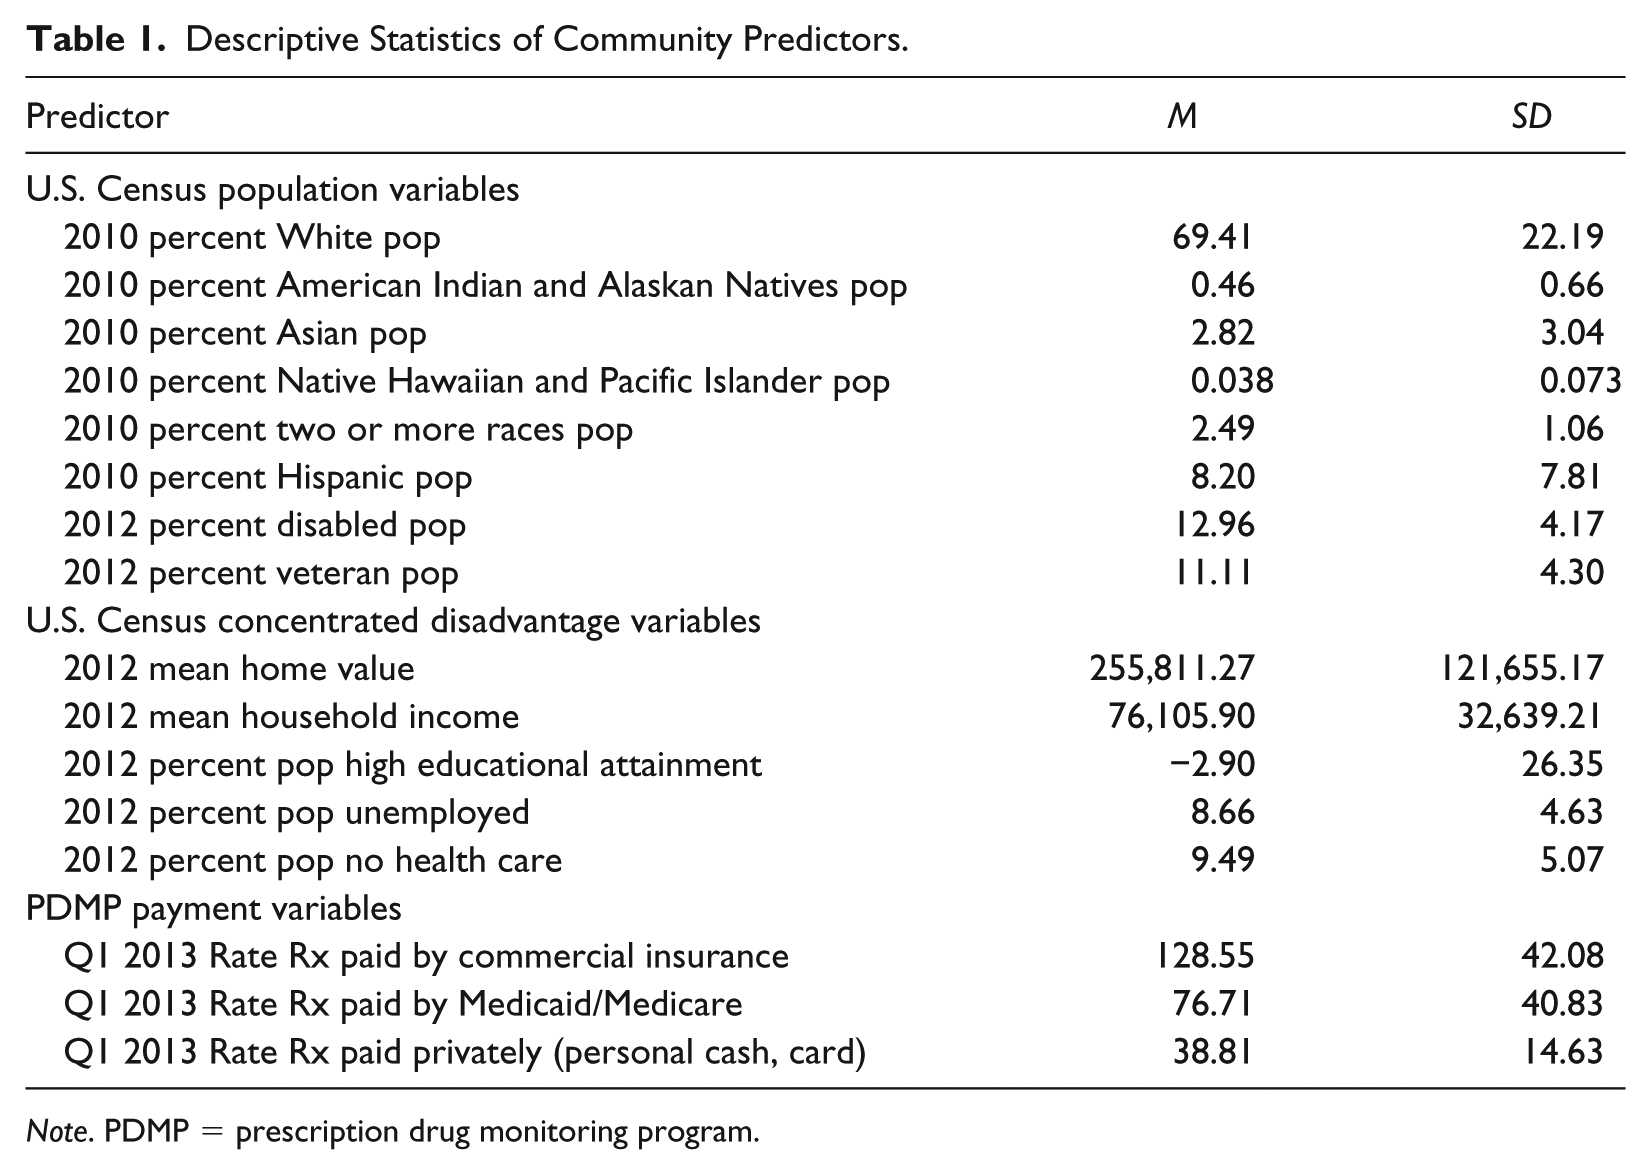
Note. PDMP = prescription drug monitoring program.
Tract averages for our concentrated disadvantage variables included home values of US$256,000, household income of US$76,400, about 8.7% unemployed, and 9.5% without health care. Our measure of educational attainment adds the percent bachelor’s degrees and professional degrees, minus the percent high school degrees in a tract. Thus, the negative number reported in Table 3 means Delaware census tracts had, on average, about 3% more population with high school degrees than BAs or professional degrees.
The PDMP payment variables we constructed are rates of payment methods per 1,000 tract population. The Delaware PDMP records payments for prescriptions as commercial insurance, Medicaid or Medicare, private payment (100% cash or credit card by patient), workman’s compensation, military installations or veterans administration, and Indian nations or other. We use the three payment forms most commonly found in the Delaware PDMP and calculated average tract rates (per 1,000 population) for Q1 2013 as 128.55 commercial payments, 76.71 Medicaid/Medicare payments, and 38.81 private payments.
Change in Opioid Prescribing
Table 2 shows means and standard deviations in the four types of opioid prescriptions in Delaware for the Q1 of 2013 and Q4 of 2014. Prescriptions for oxycodone were the highest for both time-periods, averaging about 419 per tract in Q1 2013 and 415 in Q2 2014. The relatively large standard deviations (i.e., 223.3 and 224.1) for both oxycodone metrics reveal substantial differences among tracts in oxycodone prescriptions. All other opioids comprised the second highest prescribed opioid group for both time-periods at an average of about 260 prescriptions per tract in Q1 2013 and 375 per tract in Q4 2014. Again, the high standard deviation values (i.e., 130.7 and 196.6) show high heterogeneity across tracts regarding all other opioids prescribing. Hydrocodone prescriptions averaged about 201 per tract in Q1 2013 and about 154 in Q4 2014, while pharmaceutical fentanyl prescriptions averaged about 33 and 32 per tract, respectively, for the same periods.
Descriptive Statistics of Community-Level Opioid Prescriptions.
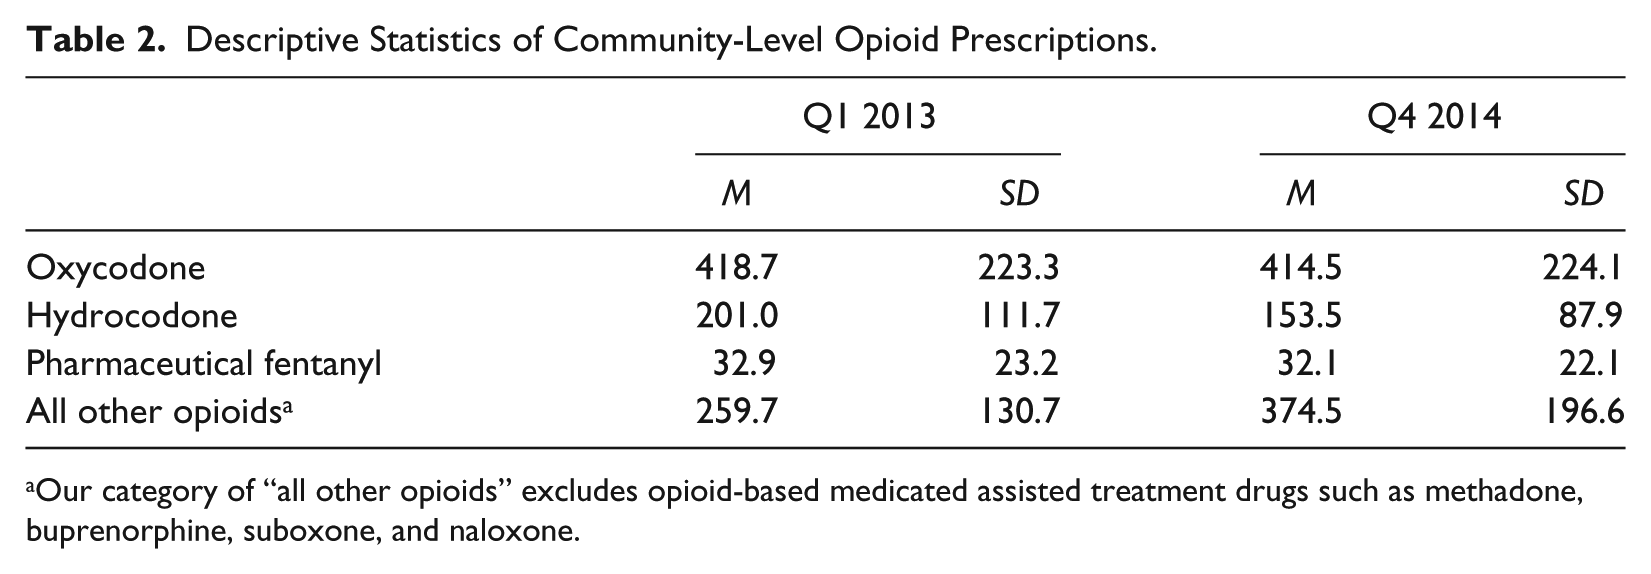
Our category of “all other opioids” excludes opioid-based medicated assisted treatment drugs such as methadone, buprenorphine, suboxone, and naloxone.
Table 3 shows changes in average tract prescriptions for oxycodone, hydrocodone, pharmaceutical fentanyl, and all other opioids. Oxycodone prescriptions decreased an average of 4.2 prescriptions per tract, which was not a significant decline between the two time-periods. We found the same pattern of stability for pharmaceutical fentanyl (discussed below), which reported a nonsignificant drop of less than one prescription per tract average between the two time-periods. On the contrary, hydrocodone prescriptions significantly decreased between Q1 2013 and Q4 2014, declining on average of about 48 prescriptions per tract. Perhaps the most telling change was in prescriptions for all other opioids. They increased significantly between the two time-periods by an average of 115 prescriptions per tract. The increase in community-level of all other opioid prescribing suggests their growing popularity and increased potential for abuse.
Descriptive Statistics of Change Scores for Community-Level Opioid Prescriptions.
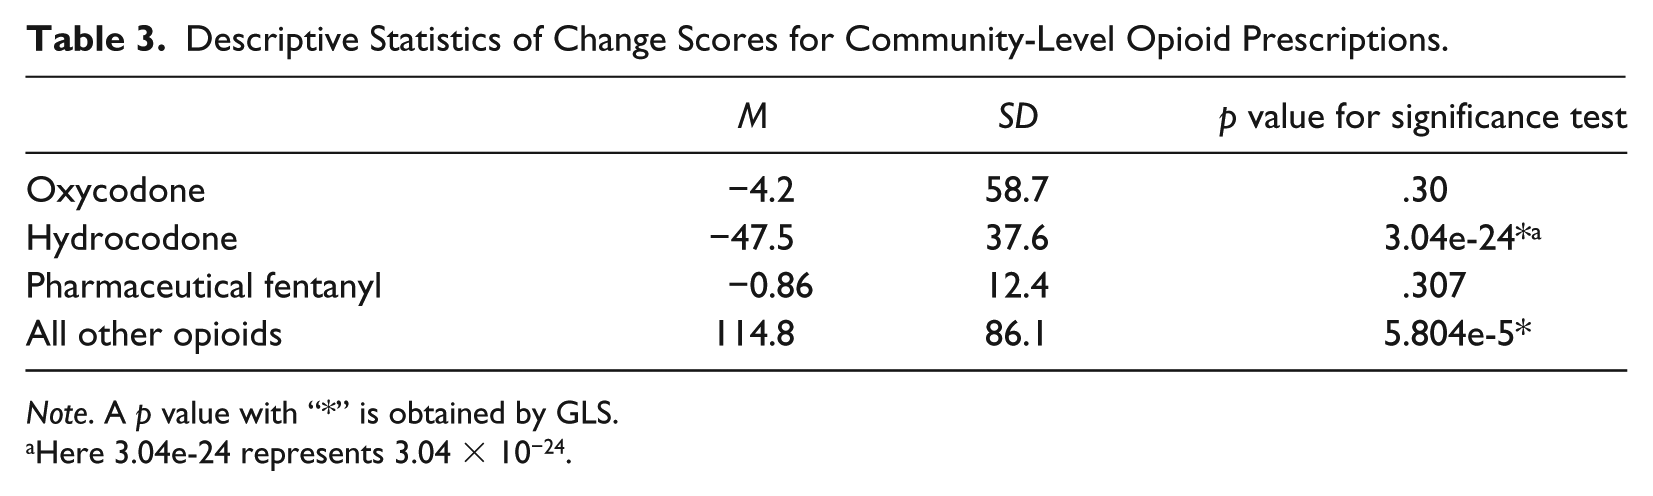
Note. A p value with “*” is obtained by GLS.
Here 3.04e-24 represents 3.04 × 10⁻²⁴.
Community-Level Predictors of Opioid Prescriptions
While our tendency may be to look at individual-level (e.g., patient and doctors) factors, or to new prescribing policies, our article asks if community-level factors can help explain the prescribing patterns of these drugs discussed above. Many community-level factors can influence opioid prescribing. Our data set of PDMP indicators and U.S. Census variables permits us to study other explanations, including those related to concentrated disadvantage and prescribing practices. Tables 4 through 7 present our findings of statistical models for each of our opioid classes and address the second objective of our study.
Community Predictors a of Change in Oxycodone Prescriptions.
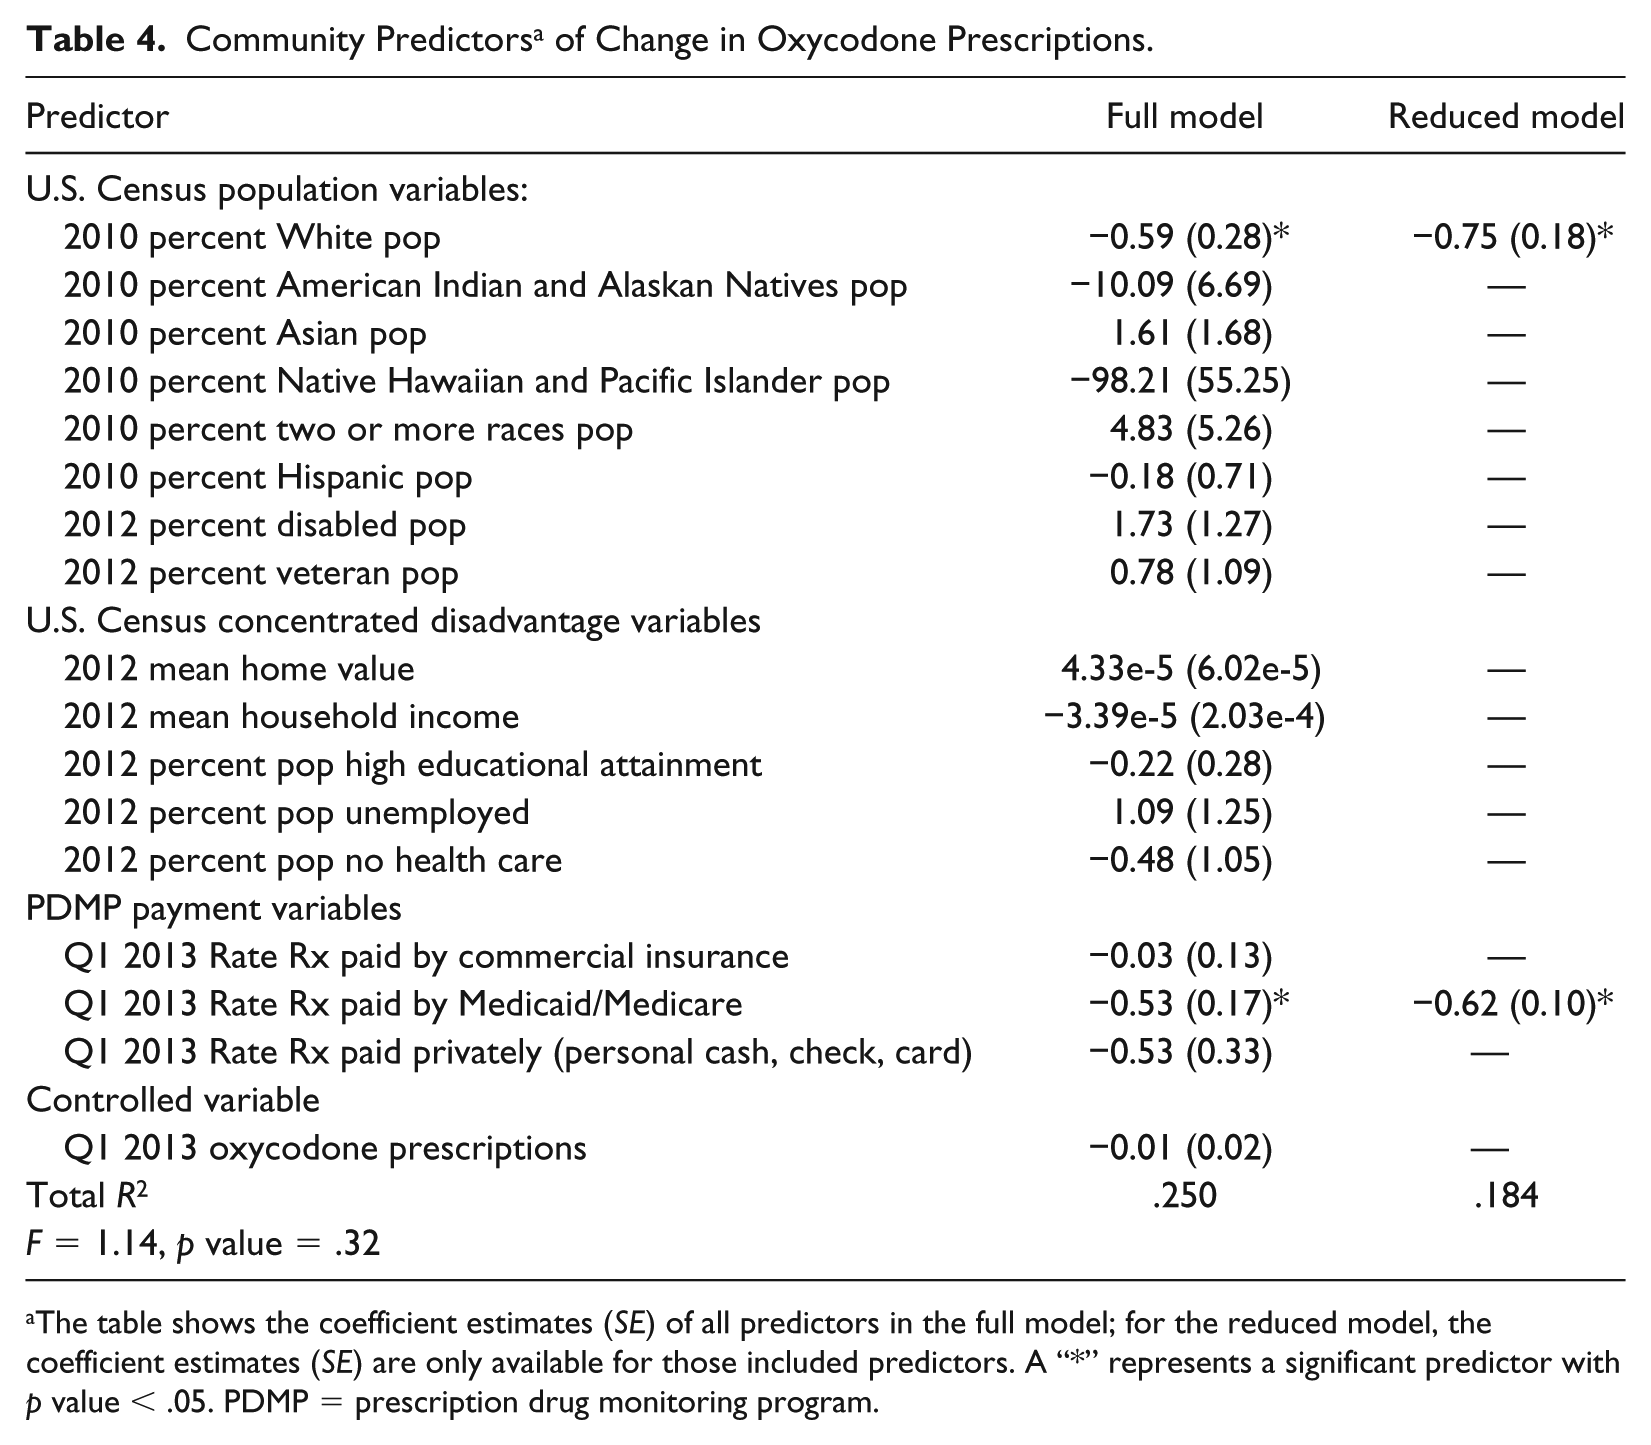
The table shows the coefficient estimates (SE) of all predictors in the full model; for the reduced model, the coefficient estimates (SE) are only available for those included predictors. A “*” represents a significant predictor with p value < .05. PDMP = prescription drug monitoring program.
Community Predictors of Change in Hydrocodone Prescriptions.
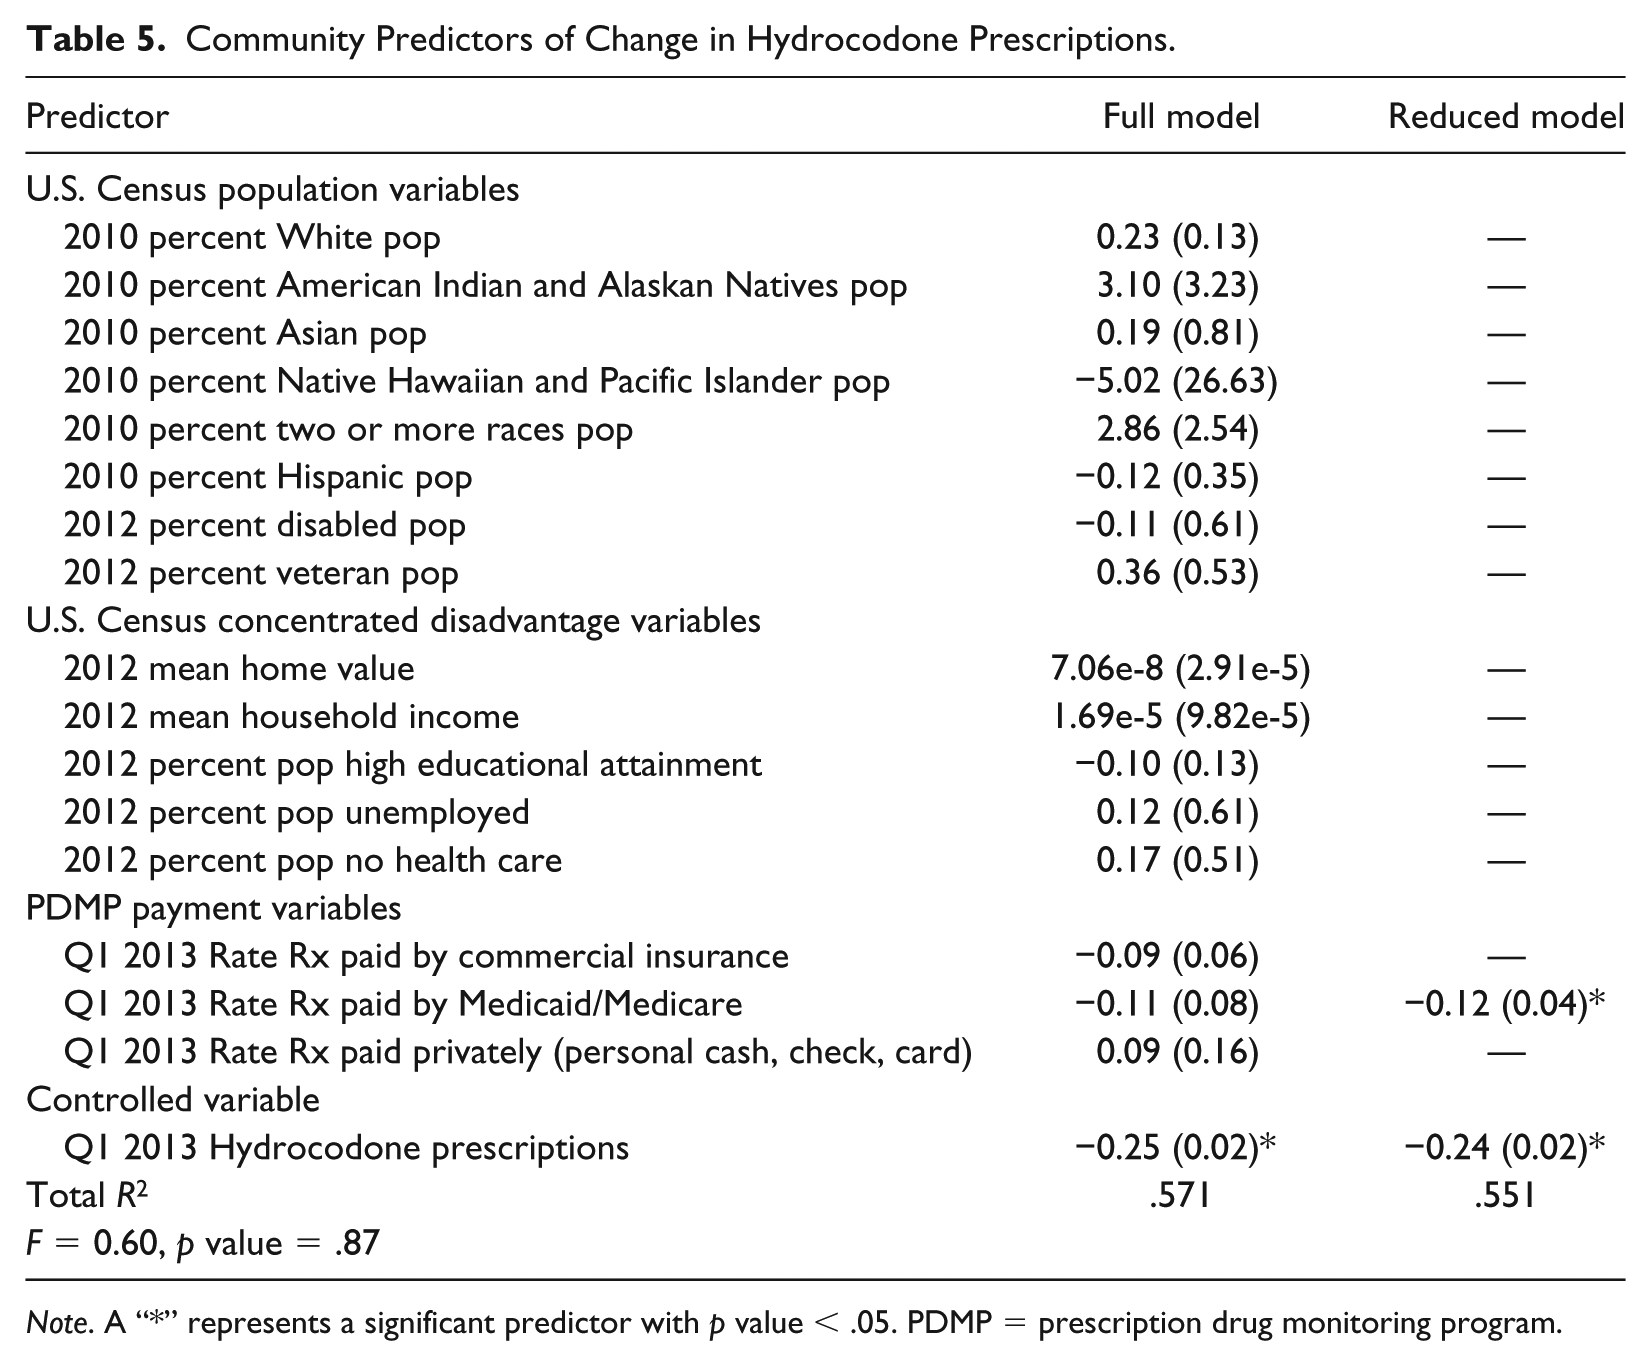
Note. A “*” represents a significant predictor with p value < .05. PDMP = prescription drug monitoring program.
Community Predictors of Change in Pharmaceutical Fentanyl Prescriptions.
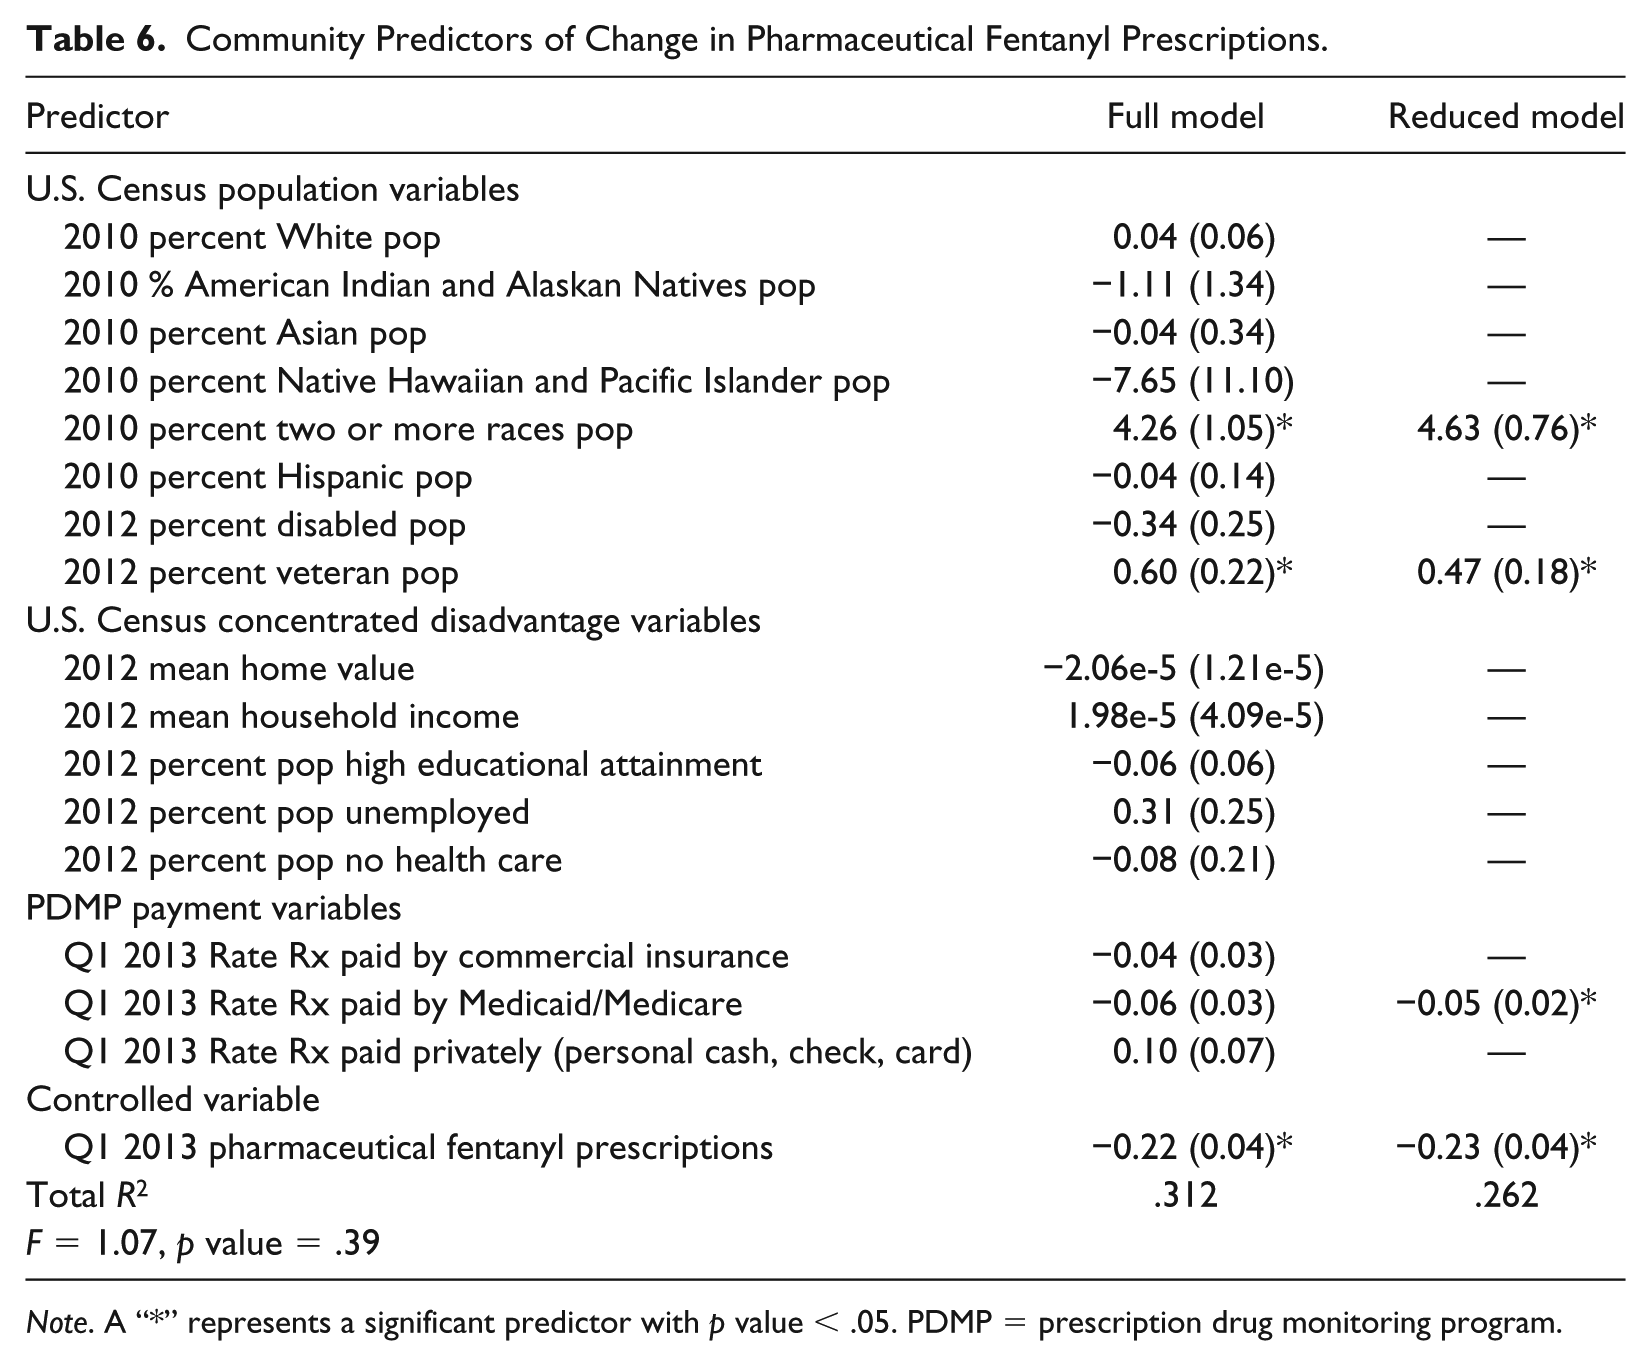
Note. A “*” represents a significant predictor with p value < .05. PDMP = prescription drug monitoring program.
Community Predictors of Change in All Other Opioids Prescriptions.
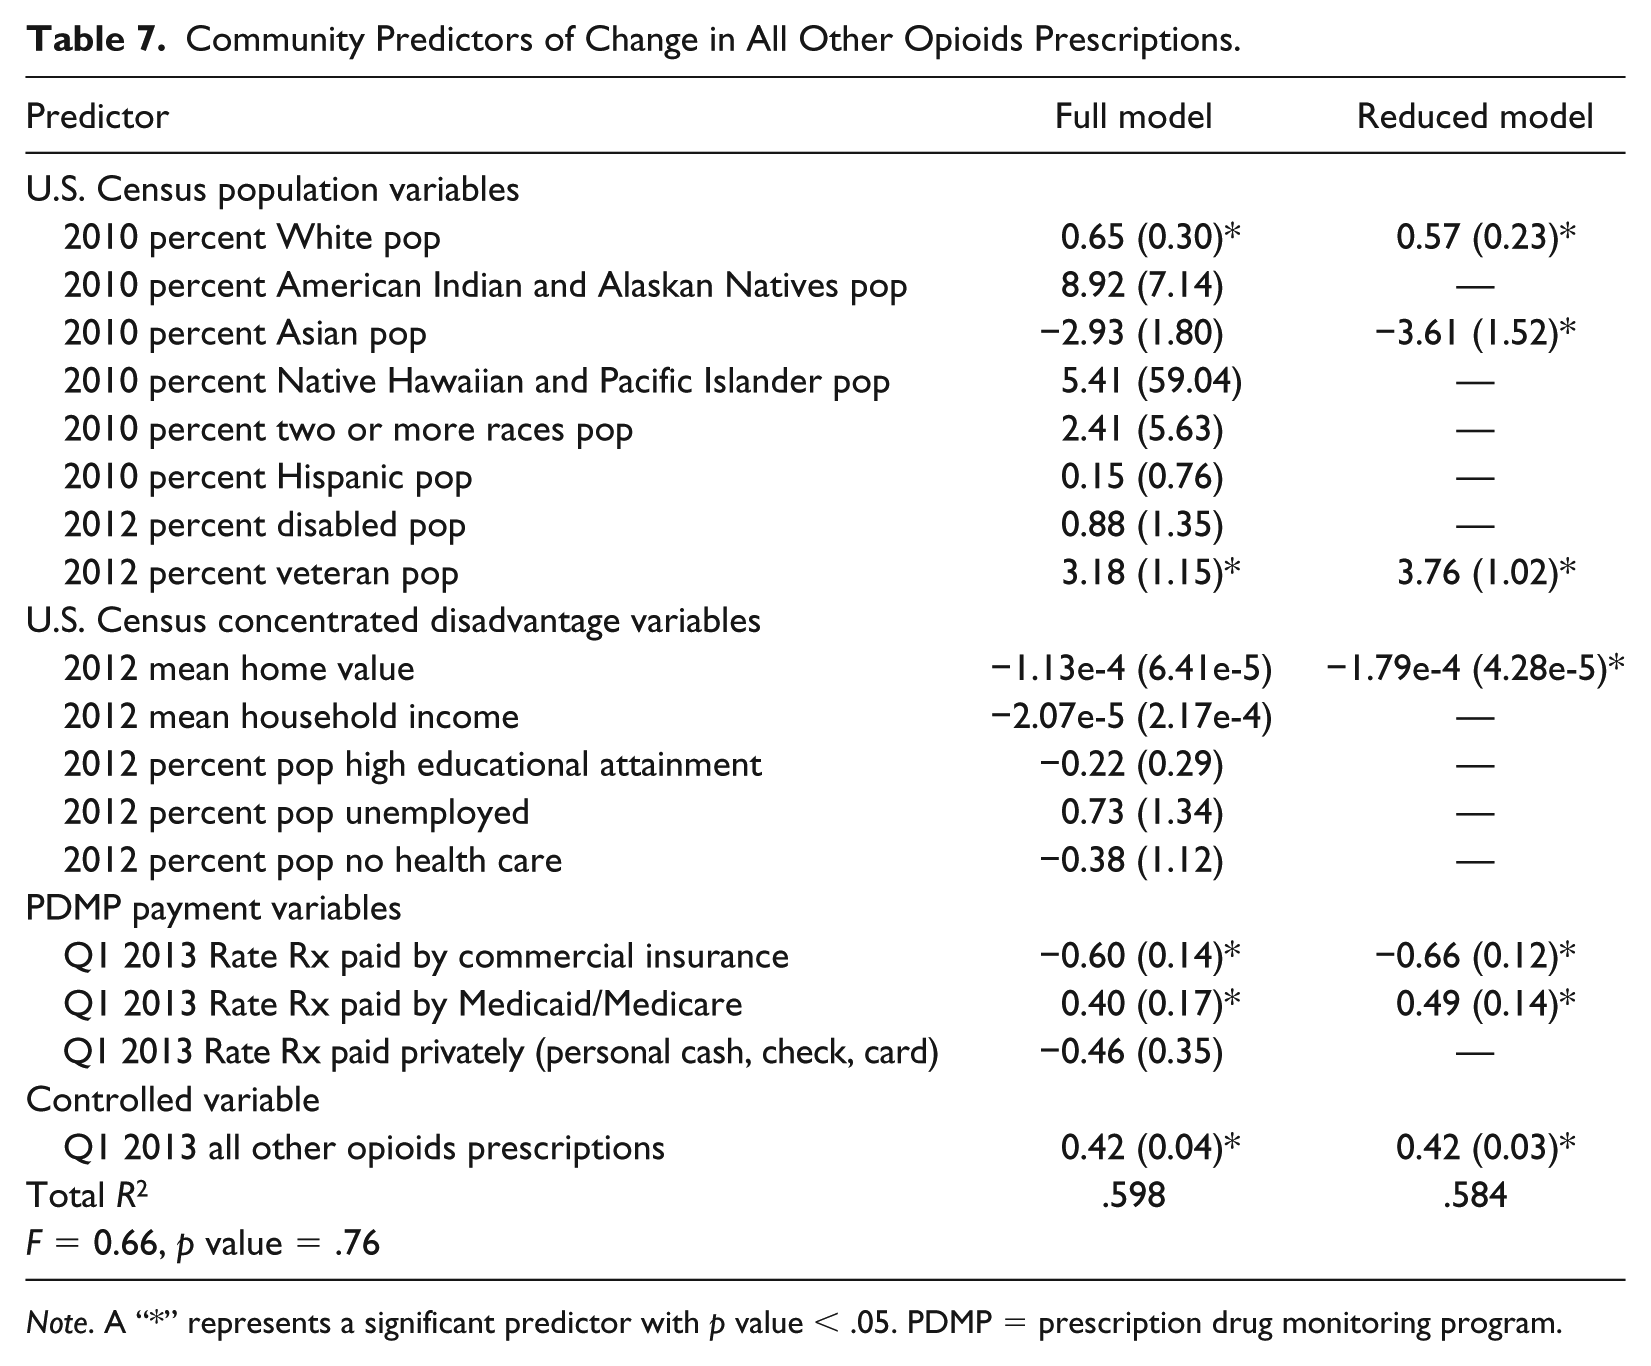
Note. A “*” represents a significant predictor with p value < .05. PDMP = prescription drug monitoring program.
Table 4 shows the community-level predictors of change in oxycodone prescriptions between our two time points in both the full and reduced models, along with their respective R-squared values. Recall from Table 3 that oxycodone prescriptions showed no significant change between the two time-periods. Thus, the Table 4 model explains relative stability in oxycodone prescribing. Two predictors were significant: Q1 2013 Medicaid/Medicare Rx Pay Rate (a PDMP payment variable) and 2010 percent White population (a U.S. Census population variable) were both negatively related to oxycodone prescriptions. The reduced model eliminates all insignificant predictors of the full model and successfully identifies significant ones. Although the R-squared drops from .250 to .184, this drop does not compromise the goodness of fit much, as verified by the p value (= .32 < .05) of the F test.
Recall that Table 3 above showed the mean level of hydrocodone prescriptions decreased significantly between Q1 2013 and Q4 2014. Table 5 shows predictors associated with this decrease. Apart from the controlled variable Q1 2013 hydrocodone prescriptions, the full model contained no significant predictor, while Q1 2013 Medicaid/Medicare Rx Pay Rate (a PDMP payment variable) was a significant negative predictor in the reduced model as it was in the oxycodone model. This justifies the aforementioned necessity of model selection (see above). Q1 2013 Medicaid/Medicare Rx Pay Rate is not significant in the full model as its statistical test is affected by the presence of other predictors. However, its significance appears in the reduced model. The comparison of the R-squared values, .571 for the full model and .551 for the reduced model, together with the large p value (.87) of the F test, also confirms that the reduced model is sufficient to explain the decrease of hydrocodone prescriptions.
As with the oxycodone pattern, tract-level prescription for pharmaceutical fentanyl did not significantly change between Q1 2013 and Q4 2014 (see Table 3). However, Table 6 shows more predictors significant in predicting pharmaceutical fentanyl prescriptions over time. For example, when controlling Q1 2013 prescriptions, the nonsignificant change of pharmaceutical fentanyl prescriptions has a strong negative association with Q1 2013 Medicaid/Medicare Rx Pay Rate, a positive one with the 2010 percent Two or More Races Population, and negative one with the 2012 percent Veteran Population, as in the reduced model. Q1 2013 Medicaid/Medicare Rx Pay Rate is not significant in the full model, but the small difference in the R-squared, and a p value greater than .05 for the F test, show the reduced model superior and describes the association between the response and predictor variables.
To review Table 3, prescriptions for all other opioids increased significantly between Q1 2013 and Q4 2014. Table 7 shows more of our population; concentrated disadvantage and PDMP payment variables were significant in predicting changes in acute opiate overdose (AOO) than all other opioids. For example, the reduced model shows three population variables are significant in predicting prescriptions for all other opioids. This includes negative relationships for 2010 percent White Population and 2012 Veteran Population, but a positive relationship for 2010 percent Asian Population. One concentrated disadvantage variable (2012 Mean home value) had a negative relationship with prescriptions for all other opioids while two PDMP payment variables (Q1 2013 Rate Rx paid by commercial insurance and Q1 2013 Rate Rx paid by Medicaid/Medicare) were strongly associated with the increase in tract-level of all other opioids prescriptions, but in different directions (i.e., positive for Medicaid/Medicare payment and negative for commercial payment). Although two of them, including 2010 percent Asian Population and 2012 Mean home value, turn out insignificant in the full model, we adopted the reduced model for better interpretation as the R-squared values of the two models are very close, and the F test is not significant (p value = .76 > .05). The R-squared values are strong at .59 for the full model and .58 for the reduced model.
Discussion
Our article investigated changes in community-level prescriptions of four types of opioids (oxycodone, hydrocodone, pharmaceutical fentanyl, and all other opioids) over a 2-year period that falls squarely within the U.S. opioid crisis. We studied thousands of prescriptions for these opioids in Delaware to investigate how prescription patterns could be explained at the community-level, allowing us to contribute to literature that has heavily investigated a singular all-opioid metric at the individual level.
We found different patterns of change in opioid prescribing at the community level, a result that would have been overlooked by studying a single opioid construct. Community averages for hydrocodone prescriptions declined between the beginning of 2013 and the end of 2014, while those for fentanyl and oxycodone remained stable, and those for all other opioids increased significantly. Most notably is our finding of a significant decline in hydrocodone prescriptions between early 2013 and late 2014 and an increase in all other opioids. These results may reflect the scheduling changes implemented by the DEA in 2014, which elevated hydrocodone to Schedule II. Critics (Scott, 2014) have argued that this policy change would lead to a decline in hydrocodone prescriptions and greater prescribing of lesser restricted Schedule III opioids, which dominate our all other opioids groups.
If opioid prescribing is a risk factor for morbidity and mortality, then, our findings also show that risk varies by community characteristics and type of payment for the four classes of Rx opioids we studied. For example, population variables were, in general, more often significant than concentrated disadvantage and PDMP payment variables. Consider that the increase in all other opioids is positively related to the percent White population and negatively related to the percent Asian population. This is consistent with prior research showing Rx opioids highest among Whites (Chen et al., 2005) and relatively lower among Asians. However, community-level prescriptions for all other opioids are negatively related to mean household income (i.e., a concentrated disadvantage variable) and commercial pay rate (a PDMP payment variable), but positively related to the Medicaid/Medicare pay rate. One interpretation of this is that lower income communities may be especially vulnerable to increased prescriptions of all other opioids—and perhaps their related consequences—if such prescriptions continue to escalate.
The most notable predictor in our analysis is the Medicaid/Medicare pay rate: It is the only significant predictor across all four opioid models. For example, the Medicaid/Medicare pay rate is negatively associated with oxycodone and pharmaceutical fentanyl (which reported no significant change between the two time points) and hydrocodone (which decreased significantly over the same period). On the contrary, this predictor is positively associated with all other opioids, thus suggesting even more vulnerability to this class of opioids in communities with higher enrollment in government-supported health care programs. Recently, legislators have blamed Medicaid/Medicare payments for driving the current opioid crisis (Collins, 2018). While further investigation of the relationship between Medicaid/Medicare pay rate and opioids is needed, our article clearly shows it plays an important role in prescribing patterns.
Finally, our findings show that lower socioeconomic communities, especially those with higher percentages of White and veteran populations and lower housing values, might be especially at risk for increases in the prescribing of all other opioids, or Rx opioids other than oxycodone, hydrocodone, and prescription fentanyl. This possible explanation of increased risk in the prescribing of all other opioids in certain communities may serve as a warning sign for future developments in the opioid problem, including a return to concentrated drug problems among lower resourced and vulnerable populations. Our findings suggest a growth in the prescribing of lesser known opioids (other than oxycodone, hydrocodone, and fentanyl) in communities already at risk for other health and social problems.
Researchers and policy makers may want to attend to the types of opioid prescribing as the epidemic wages on and new laws are passed to fight it. For example, many states have tightened opioid prescribing via setting limits on the number of pills that can be prescribed or shifting to electronic systems to combat diversion. Few laws target the actual types of opioids prescribed. So, while lawsuits against Oxycontin-amker Purdue Pharma stack up and may ultimately hinder its distribution, our article cautions that closer attention is needed to lesser known opioids to ward off their rise and replacement of other more popular ones.
Finally, our article calls attention to the diverse community impact in opioid prescribing. While it is true that anyone can become addicted to, or overdose from, the opioids we studied, our community-level focus shows that economically disadvantaged communities are more vulnerable to higher prescribing rates, which may ultimately affect their rates of related consequences (addiction and overdose). Community-level interventions are likely necessary as well in combatting the epidemic.
Footnotes
Declaration of Conflicting Interests
The author(s) declared no potential conflicts of interest with respect to the research, authorship, and/or publication of this article.
Funding
The author(s) disclosed receipt of the following financial support for the research, authorship, and/or publication of this article: The research was funded by a grant from Bureau of Justice Assistance, U.S. Federal Government, Award No. 2014-PM-BX-0002. The findings reported here do not necessarily reflect the sponsor’s.