
Abstract
Based on a survey conducted in high schools in three countries—the Czech Republic, Italy, and Slovenia—this study investigates the factors influencing alcohol consumption among high school students. Our analysis is based on four linear regression models, with the dependent variable, Alcohol Consumption—one model for each country and a joint model for all countries. The results show that there are large differences as far as drinking habits and patterns across countries are concerned. Whereas the patterns of the Czech students are similar to those of Slovenian students, the behavior of the Italians shows more distinctive features. Factors positively related to alcohol consumption include cigarette smoking, marijuana consumption, time spent with friends (positive relations), sport activities, art engagement, and gender-female (negative relation). As factors regarding students’ psychological state are insignificant, it may be concluded that alcohol consumption among teenagers from our sample is a phenomenon that is insensitive to changes in character but sensitive to social environment and life circumstances. Our results can serve as a map showing various drinking patterns. Applicable results can be deduced.
Introduction
Our study investigates factors associated with alcohol consumption among high school students from the Czech Republic, Italy, and Slovenia. The importance of such research is explained below.
In most Western countries, alcohol consumption has become a common part of life for many people. This is a major problem, especially in the case of young people; alcohol consumption can have a quite negative effect on their health (see, for example, Mukamal et al., 2003; Ruitenberg et al., 2002) although this effect can manifest itself in later part of their lives. The danger of alcohol use among young people lies also in the fact that at their young age they can develop addictive habits that will influence their adult lives (Prescott & Kendler, 1999). Thus, it is in the interest of society to investigate this phenomenon in depth to study what the factors are when it comes to alcohol consumption and to find out what can be done to prevent or ideally discourage young people from drinking. Our article is a modest contribution to this ongoing process of investigating factors that are related to drinking. We do so by studying high school students from three countries.
Many studies (see the next section) suggest that students’ drinking habits are formed by many factors. If trying to understand young peoples’ motivation to indulge in alcohol consumption, many areas of their lives and many factors within these areas must be taken into account. Our study does so as it studies the relations between many factors and alcohol consumption.
Table 1 contains some of the key characteristics related to the alcohol consumption in the countries studied in this article. The content is derived from the World Health Organization’s (WHO) Global status report on alcohol use in 2018.
Overview of Alcohol Consumption in the Analyzed Countries, 2018.

Source. World Health Organization (2018a).
Table 1 clearly shows that patterns connected to alcohol differ significantly across countries, both in terms of alcohol consumption and in terms of public policies concerning alcohol. 1 This is one of the reasons why factors influencing alcohol consumption can be expected to differ across countries as well. Our aim is to bring contribution to the ongoing research of alcohol connections by identifying potential alcohol use predictors among students from the three countries. The uniqueness of our study lies in the cross-country dimension of our methodological approach.
This article is organized as follows: In the next section, we provide a review of the existing literature on the relationship between alcohol consumption and happiness. Thereafter, we describe our methodology with all of the details needed to understand the procedures implemented in this study and then we turn to our results. The section “Discussion” is based on a discussion of the results, comparing alcohol predictors for the Czech Republic, Italy, and Slovenia, while the last one naturally concludes our article.
Literature Review
Alcohol use among students has drawn much attention from researchers for its influence on health and happiness (Thakker, 1998). A number of studies confirm the fact that drinking alcohol is very widespread and common among students: for example, 42% of first-year college students had experienced a period of heavy drinking in the past several months before the survey of the study (Wechsler et al., 2002) and about two thirds of American undergraduate students aged 18 to 24 years had reported drinking alcohol in the past month before the study (Johnston et al., 2003). Although the terms “young people,” “students,” or “teenagers” refer to different social groups in different countries, it is clear that alcohol consumption is an important aspect of the lives of young people. No less important is the fact that drinking patterns during one’s youth sets the stage for its continuation or even escalation in adulthood for a substantial proportion of the students (Jackson et al., 2001; Jennison, 2004).
Concerning its relation to happiness, frequent alcohol use among teenagers may have a negative impact on their life satisfaction level (Lambert et al., 2014). On the contrary, no relation between life satisfaction and alcohol consumption of high school students was found in India (Peltzer & Pengpid, 2013) and similar results were found in the case of Czech high school students (Janáček & Šťastný, 2018). Based on these observations, it is clear that some patterns concerning drinking are the same across countries even if the social environments (e.g., in India and in the Czech Republic) differ significantly and some patterns concerning drinking are dissimilar in different countries.
Regarding regional differences, increasing alcohol consumption in the long term concerned far more Eastern European than Western European countries (Kuntsche et al., 2011; Popova et al., 2007). These studies confirm that the social and cultural environment affects alcohol consumption and its denotations. This also applies to the significant differences in the average amounts of alcohol consumed per year across countries, as can be inferred from the report of WHO (2014). To further investigate the regional aspects of alcohol consumption, our study is in part based on the comparison of factors of alcohol consumption between countries.
When investigating alcohol use, an aim to identify relevant alcohol predictors is a further logical step, highly desirable especially if one’s intention is to create incentives that would decrease alcohol consumption. For high school students, coping with stress during the first year of college, alcohol expectancies (assertiveness and relax), social motives (making friends and popularity), and perceived norms constitute the driving forces of the students’ alcohol use (Borsari et al., 2007). Apart from these, many other factors of alcohol consumption emerged over the past few decades. Social media may serve as an example of these: As suggested by Ridout et al. (2012), attitudes toward alcohol and the significance of its role in society has been influenced by the emergence of social networking; portraying oneself as a drinker on social networking sites is considered desirable to one’s own identity, making alcohol more attractive.
There are also more complex areas connected with alcohol usage: perceived gender-specific norms, expectations about the effects of alcohol, and the importance of drinking in high school as key predictors of the consumption of alcohol among students (Reis & Riley, 2000). Similarly, an investigation of alcohol use among students in Vietnam suggests that the size of the group, availability of alcohol, and gender composition matter more than other motives (Diep et al., 2016).
There are many areas that are in some way connected with the consumption of alcohol; a major factor of alcohol use, linked to the social environment, is the nature of leisure activities. A study conducted among college students in the United States led to the conclusion that activities such as playing drinking games, partying, and so on stimulate the use of alcohol (Clapp et al., 2006). Apart from these, even activities generally considered as beneficial to one’s well-being can promote the use of alcohol, when conducted collectively: A study by Lorente et al. (2004) shows that French high school students drank significantly more when participating in group sports. This finding is in line with the work of Reis and Riley (2000) who found that participation in sport teams is an important social factor promoting alcohol use. Overall, these findings suggest that the social environment and the nature of students’ activities are mutually interlinked and as such pose a considerable influence on alcohol use.
The importance of personal relationships in peoples’ lives has been recognized repeatedly (see, for example, Janáček & Šťastný, 2018; Kalvāns & Ignatjeva, 2013; Lambert et al., 2014). This especially applies in the case of young people (see, for example, Harmening & Jacob, 2015; Schnettler et al., 2015). Thus, it is not surprising that social relations and personal relationships have an effect on the drinking practices of students as well. Parental influence and good family relationships shall be mentioned in the first place; according to Moore et al. (2010), parental monitoring and family closeness are positively related with a lower level of drinking among young people. Similar results were found by Petruzelka et al. (2020). However, the findings on this relation are ambiguous; a study by Kuther et al. (2003) concludes that, for all age groups of students, peer influence is an important predictor of alcohol drinking, whereas the influence of parental norms as a predictive factor remains unclear. Although these results leave much space for further research, it is clear that when studying young peoples’ attitude toward alcohol, personal relationships must be taken into account.
From an economic point of view, the use of alcohol can be taken as a form of consumption. As such, the level of its use should be directly influenced by financial aspects such as expendable income, consumer prices, taxation, general regulation, or advertising. A study investigating the risk of alcohol predictors among British youth identified expendable income and social attitude toward underage sales of alcohol as the most important factors driving alcohol consumption (Bellis et al., 2007). Other studies (Clapp et al., 2006; Fleming et al., 2004) identified advertising as another major influential factor forming the attitude of young people toward alcohol. Political restrictiveness may also play an important role toward alcohol production, pricing, and consumption (Allamani, 2011; Hnilicova et al., 2017).
Method
Our data set consists of replies provided by 3,841 high school students—1,564 Czechs, 800 Italians, and 1,477 Slovenians. The data were gathered through a questionnaire survey conducted in November 2017. The said countries were selected for their geographical proximity as well as existing cultural and social differences. This allows us to investigate whether existing social and cultural differences can be a source of different drinking patterns. Our survey encompasses 11 Czech schools, six Italian schools, 2 and 12 schools from Slovenia. We included all students from these schools with the age range being 15 to 21 years in the case of 99% of students. These were all high school students, but as European students usually go to college later than in other countries, our results can also be compared with studies that were conducted on university students.
As the gathering of data needed for our research can pose a major problem in some cases, we selected high schools that are in some way affiliated with our university or with foreign university students who studied in these high schools and who offered to contribute to our research.
Evidently, the selection of high schools was not random. However, in each country, we selected schools that offer the same type of education; all schools offered general education and all schools educated both boys and girls. There were no religious schools in our survey. In addition, we did not conduct the survey at schools specialized in practical manual education (e.g., horticultural schools or carpentry schools). Although the selection was not random, we believe that our data across countries was comparable and that the results of our study can be, to some extent, generalized for the population of students who go to high schools with general unspecialized type of educations in the countries included in our study.
In all schools, the survey was administered on the same day during morning lessons. Therefore, all students who were present at the school took part in the survey without any incentives being made. It can be expected that the absence rate of certain types of students (e.g., students who are often ill) was higher but as this is the case in all schools included in our survey, it does not pose a major problem regarding the statistical sample; if we want to be precise, we can say that our results apply only for students who do not skip school regularly but there is no explicit reason to expect that the statistical results of this study should be different in the case of this type of students.
The survey was administered by university students affiliated with our university. As weather conditions at the time of questionnaire gathering were the same in each school (partly cloudy with a temperature between 8 and 15 degrees Celsius), weather conditions did not disrupt the gathering of data and did not disrupt our results. In all schools, the questionnaires were filled out and collected in less than 10 min. Thus, it can be said that the comparison that we make in this study is relevant.
The questionnaires were distributed in the students’ native language (Czech, Italian, and Slovenian). The questionnaire included a series of questions related to different areas of students’ life. By doing so, we were able to control for various factors potentially related to the consumption of alcohol. All variables along with the corresponding question in the questionnaire and scales are listed in Table 2. The selected variables and corresponding questions in the questionnaires were selected to cover all important areas of students’ lives, including psychological aspects, demographic information, personal relationships, financial situation, other addictive substances besides alcohol, health conditions, free time activities, and so on. Naturally, there are many more characteristics that were not included into our survey, but to keep the length of the questionnaire reasonable, we refrained from including more questions. Our questionnaire still covers more aspects of students’ lives than is the case in most other studies concerning the well-being of students or their alcohol habits (see, for example, Demirbatir, 2015; Flynn & MacLeod, 2015; Zarei, 2013).
Variables, Corresponding Questions, and Scales.
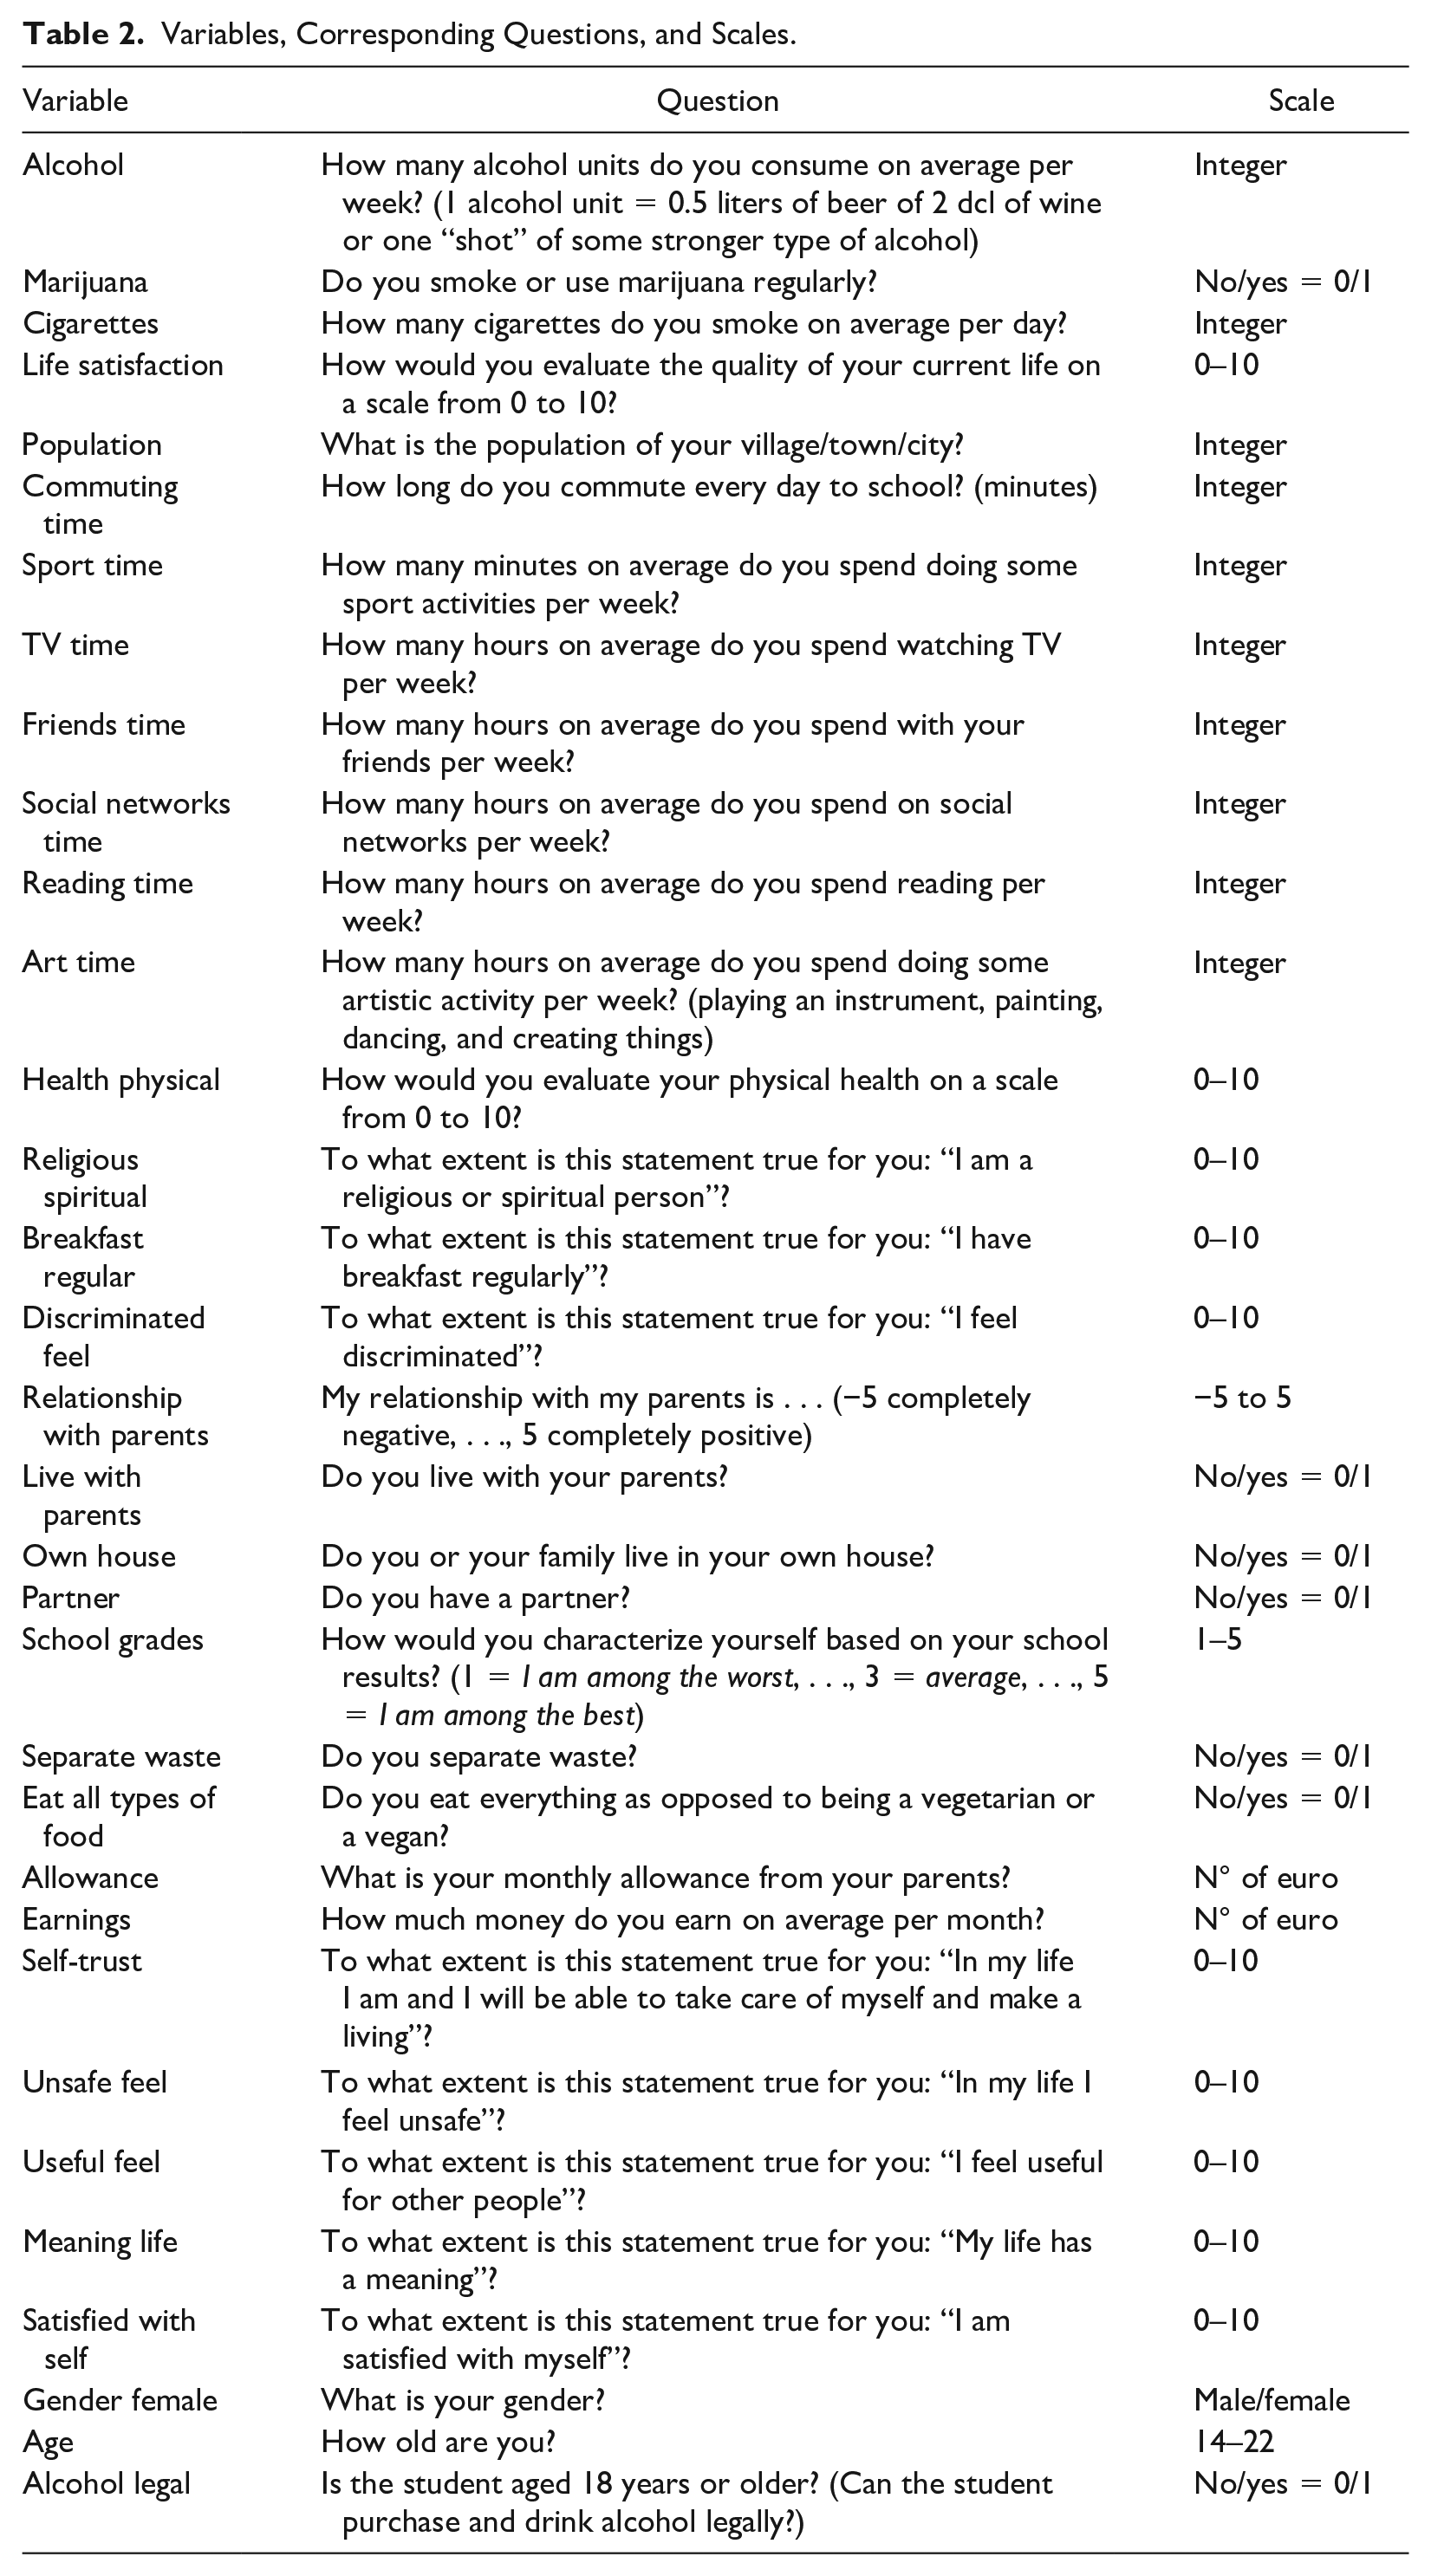
The variable that interests us most is Alcohol. It inquires about the average number of alcohol units consumed per week. One unit of alcohol is equivalent to 0.5 liter of beer or 2 dcl of wine or one “shot” of some stronger type of alcohol. We include this measure to be able to compare the consumption of different alcohol products.
The variable, Alcohol Legal, equals 1 if the student is 18 years old or older and it equals 0 if the student is 17 years old or younger. At the time we conducted our survey, the drinking age in all three countries was 18 years. 3 Thus, the variable, Alcohol Legal, indicates whether the student could purchase and consume alcohol legally. It is likely that being able to purchase and consume alcohol legally has a positive effect on the amount of alcohol drunk by students (increase in alcohol consumption). Whether this hypothesis is correct, we will find in the next sections of this study.
The values of the variables, Allowance and Earnings, were converted into Euro (the Czech Republic uses Czech crowns). Furthermore, the values were recalculated according to the purchasing power parity of the countries so that their values were comparable among countries. The values for purchasing power parity were retrieved from the Organisation for Economic Co-operation and Development (OECD) database at the time of the survey.
We included the variables, Self-Trust, Unsafe Feel, Useful Feel, Meaning Life, and Satisfied with Self, to examine the potential relationships between alcohol consumption and the students’ psychological attitudes. The importance of these aspects will be compared with other factors.
To investigate factors of alcohol consumption, we first constructed linear ordinary least squares (OLS) regression models with the dependent variable, Alcohol—one for each country (model results are in Table 3). The independent variables include all factors presented in Tables 2 and 4. We constructed models for each country separately to compare factors of alcohol consumption between these countries. After this, we constructed one linear OLS regression model based on data from all students (model results are in Table 5). This way, we were able to determine general factors of alcohol use relevant for all countries. In this single model, we included dummy variables for Italy (Country 2) and Slovenia (Country 3). This allowed us to determine the fixed effects of individual countries.
OLS Regression Model, Dependent Variable Alcohol, Three Separate Models—One for Each Country.
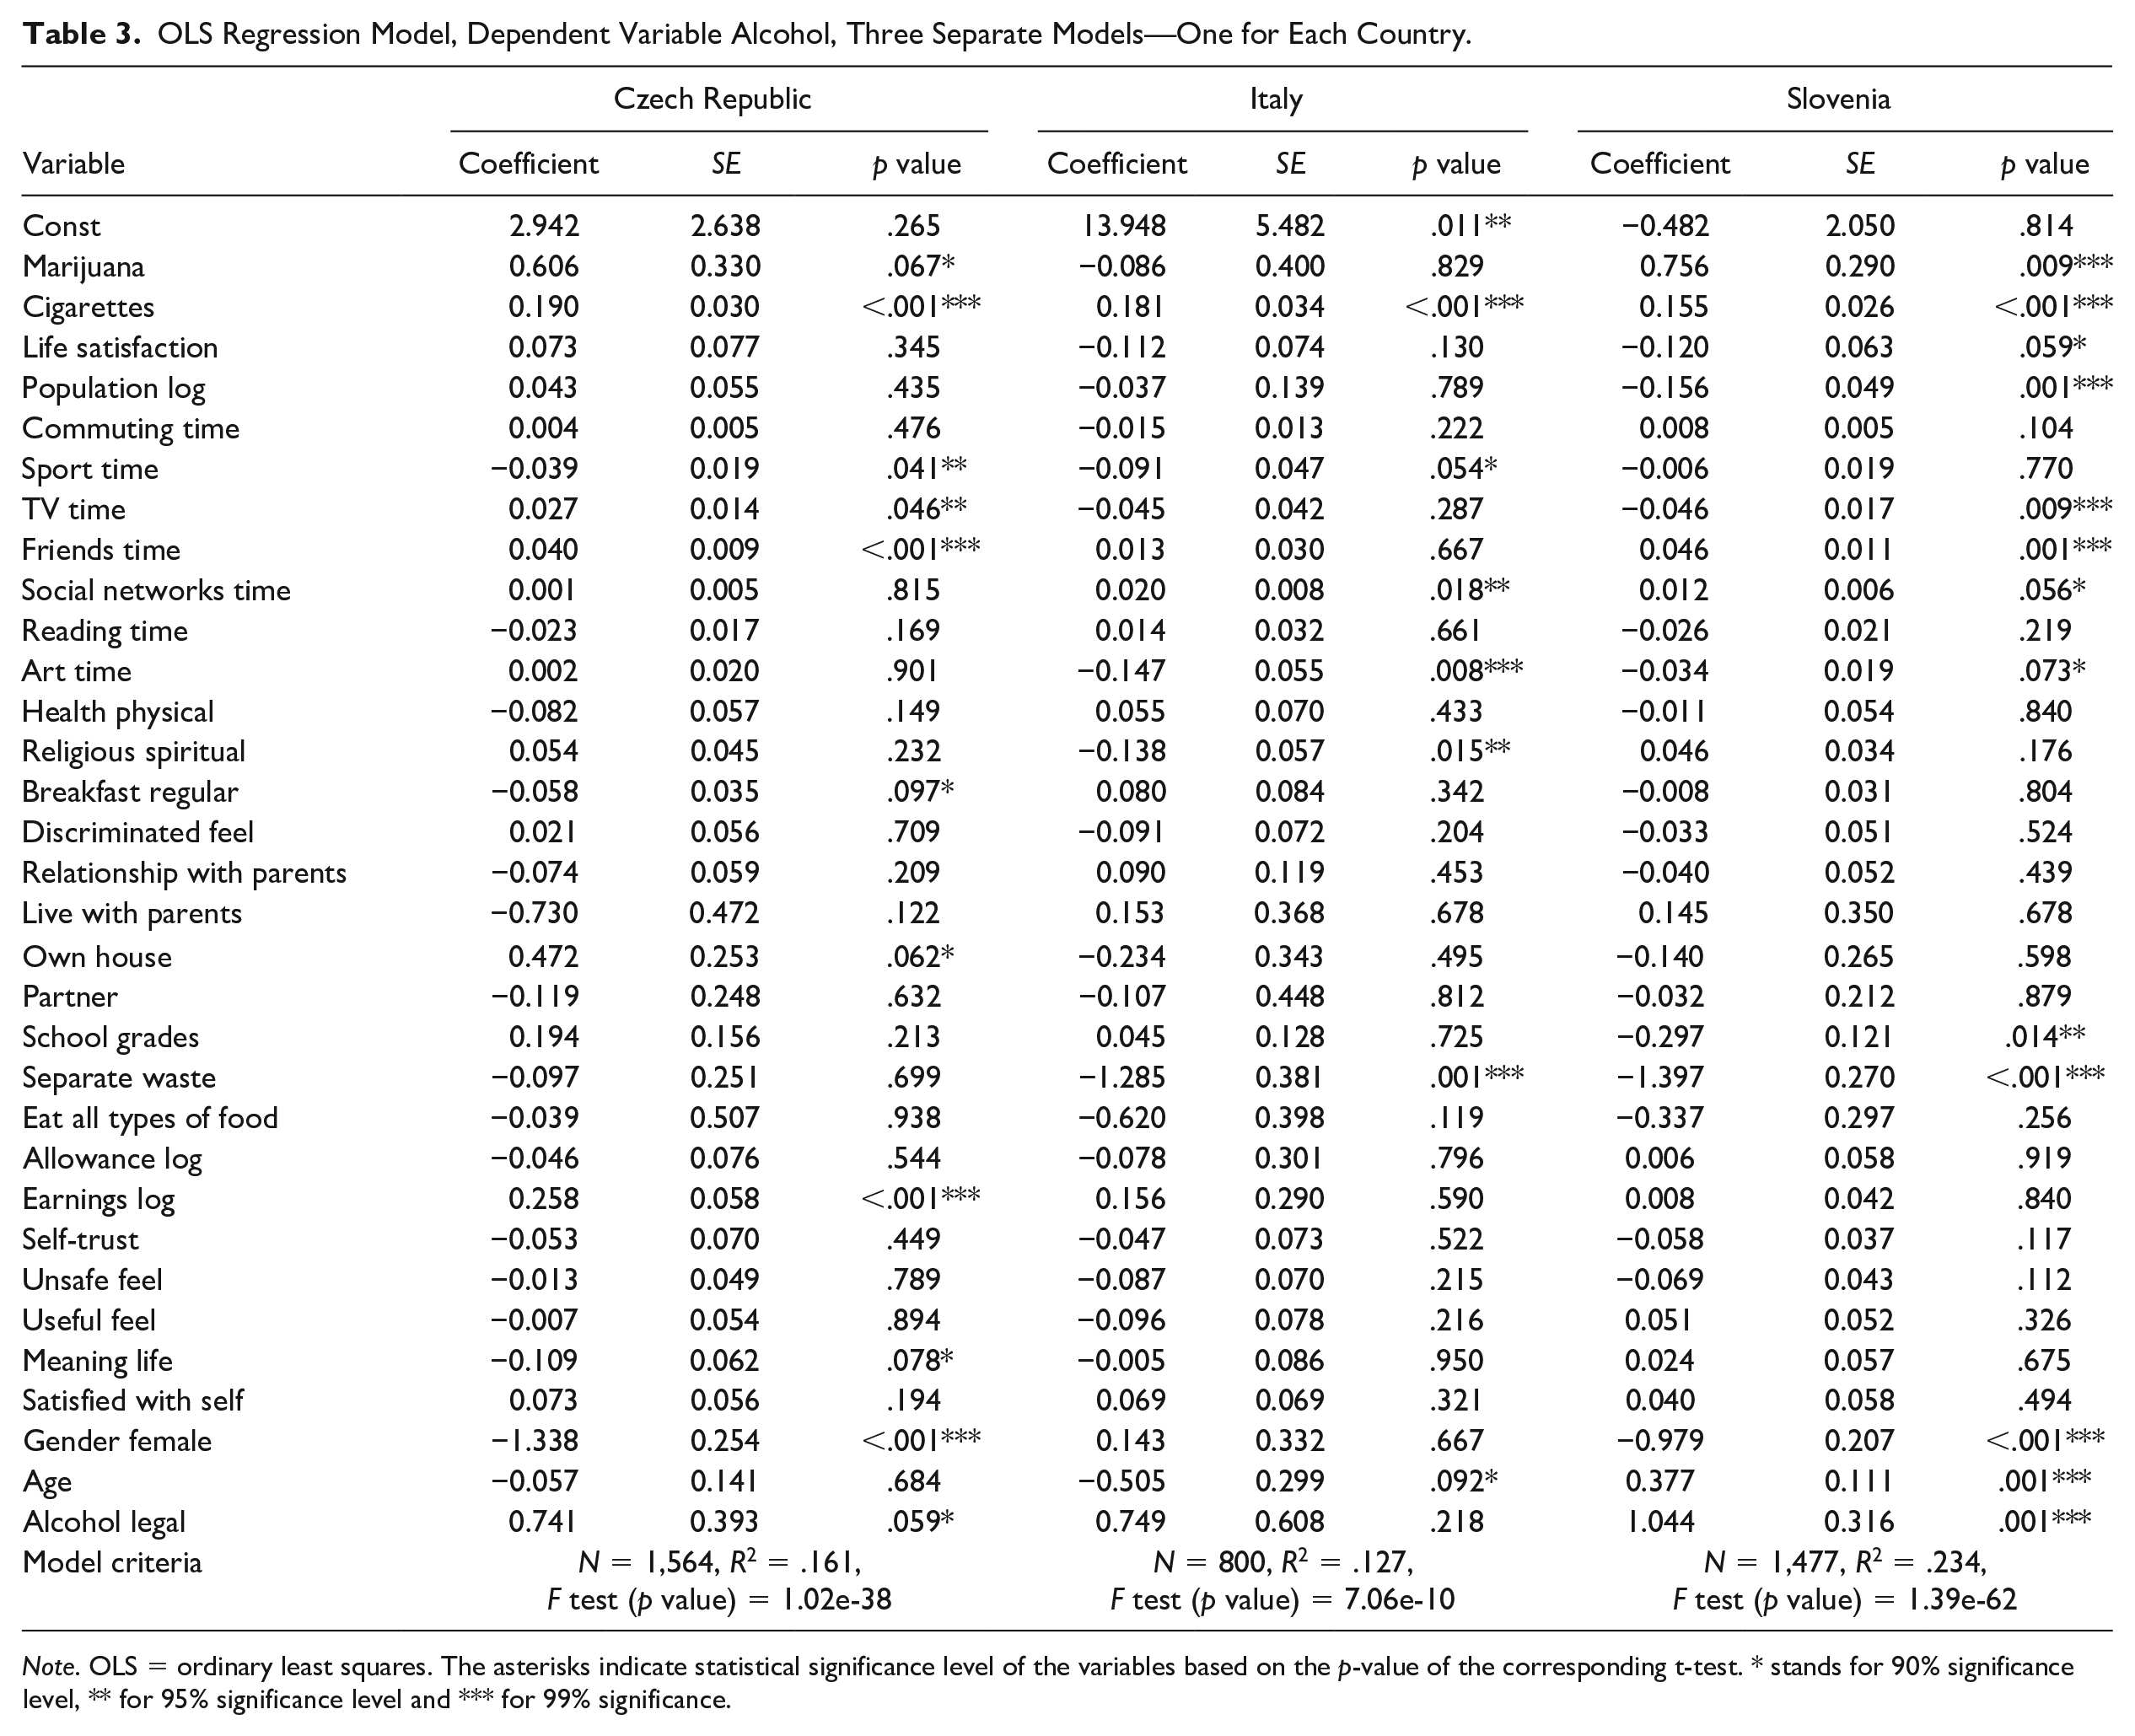
Note. OLS = ordinary least squares. The asterisks indicate statistical significance level of the variables based on the p-value of the corresponding t-test. * stands for 90% significance level, ** for 95% significance level and *** for 99% significance.
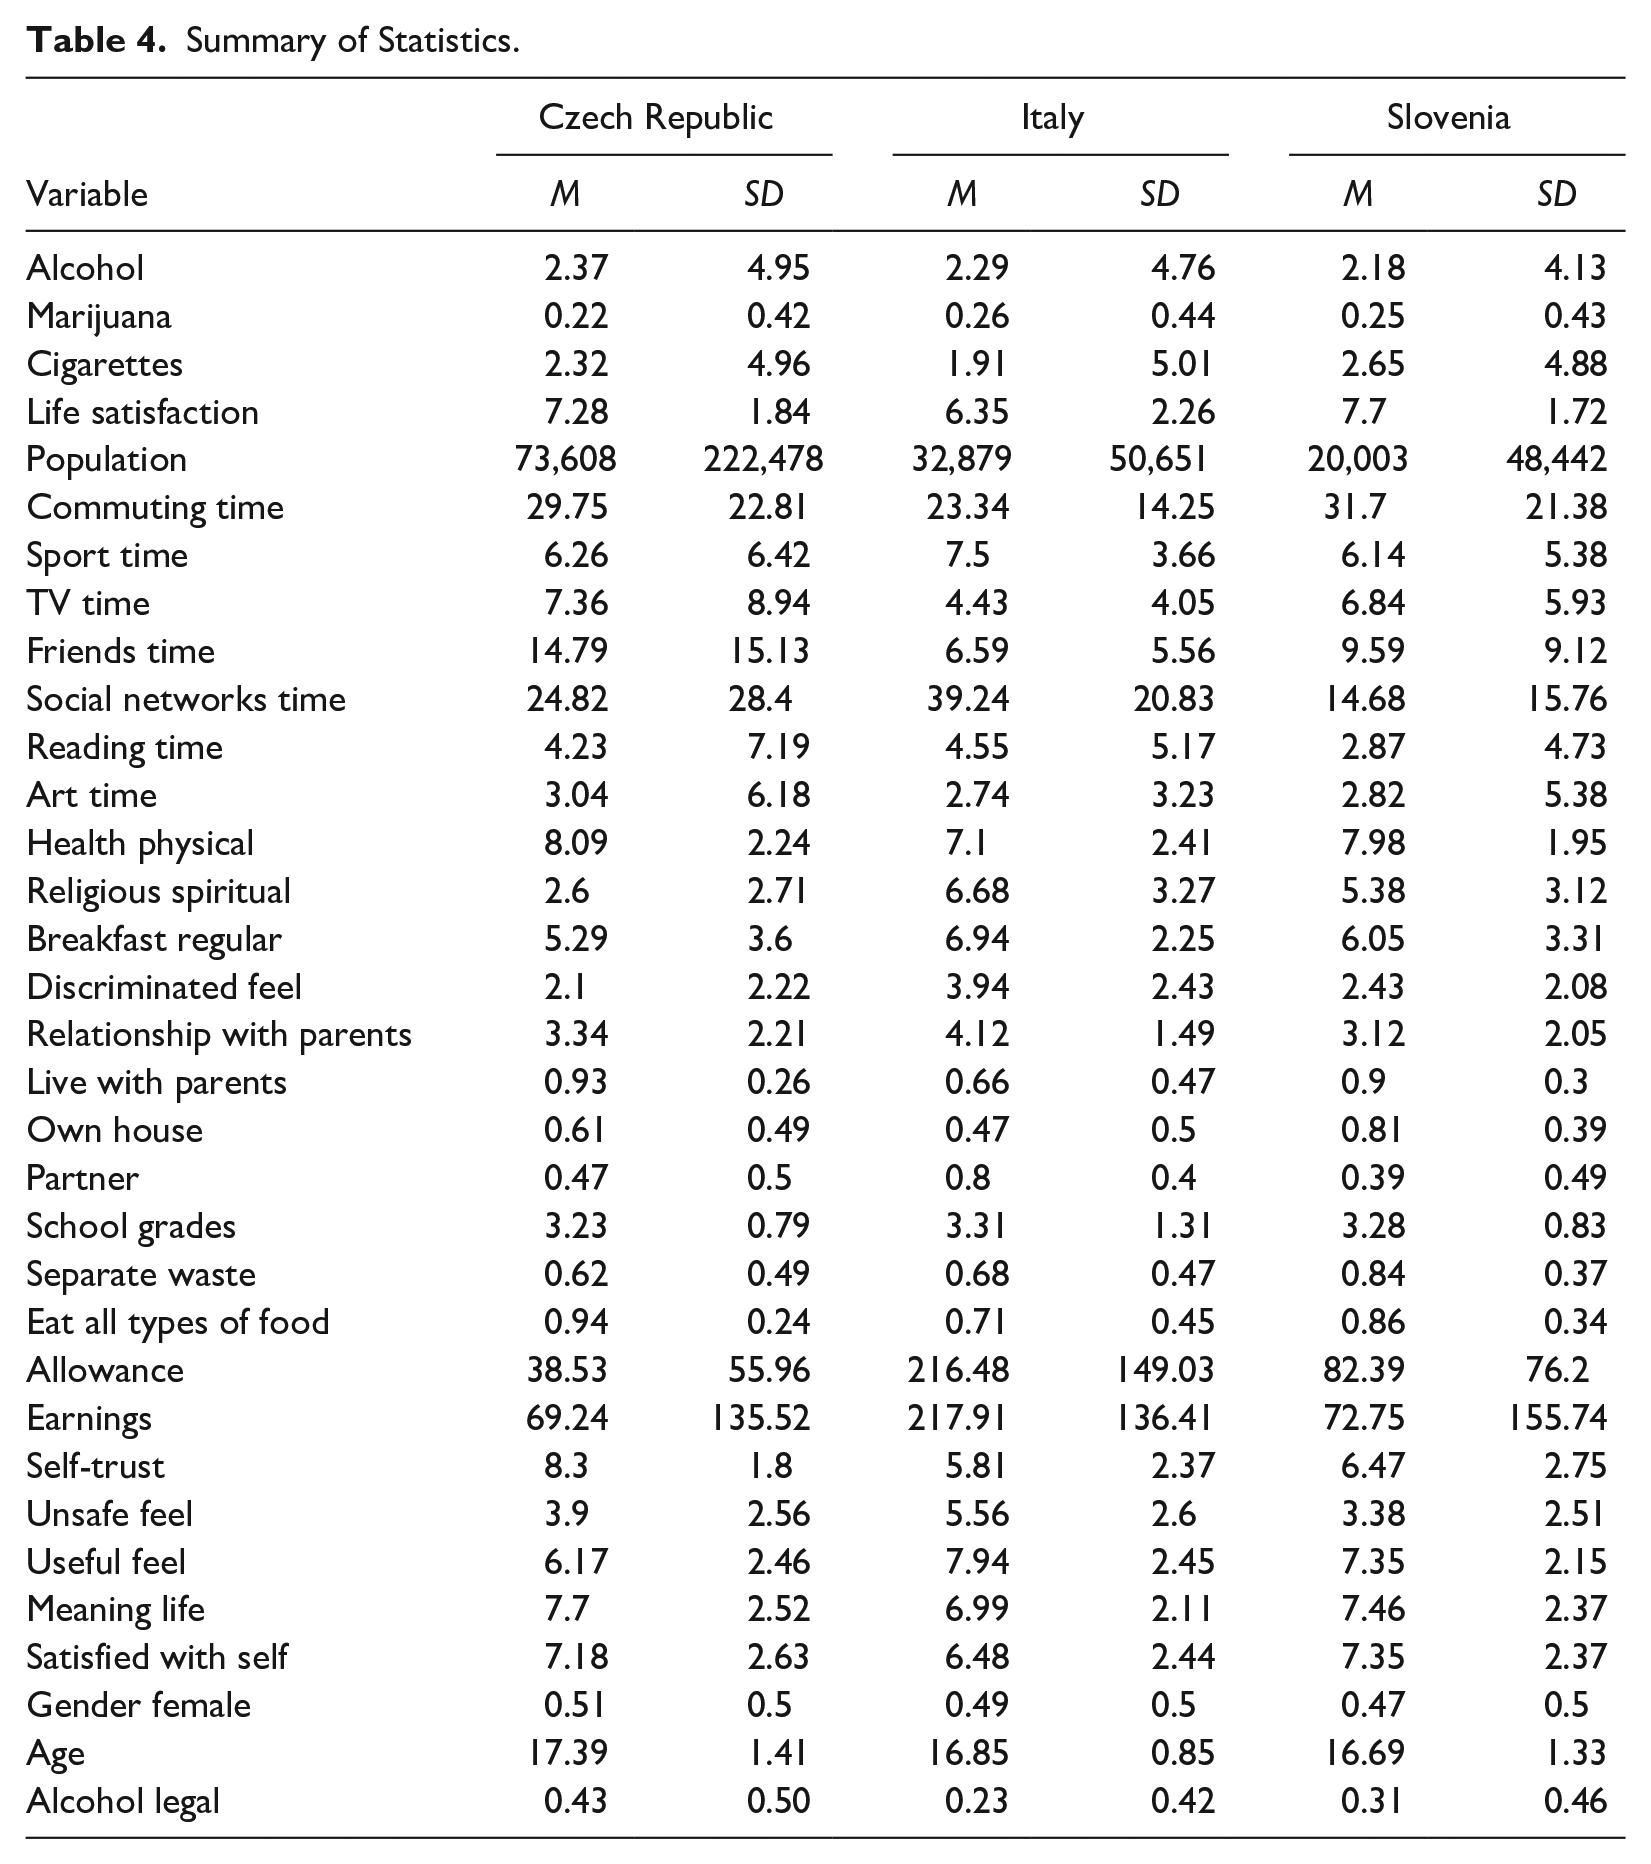
Summary of Statistics.
OLS Regression Model, Dependent Variable Alcohol, One Model for All Students From All Countries.
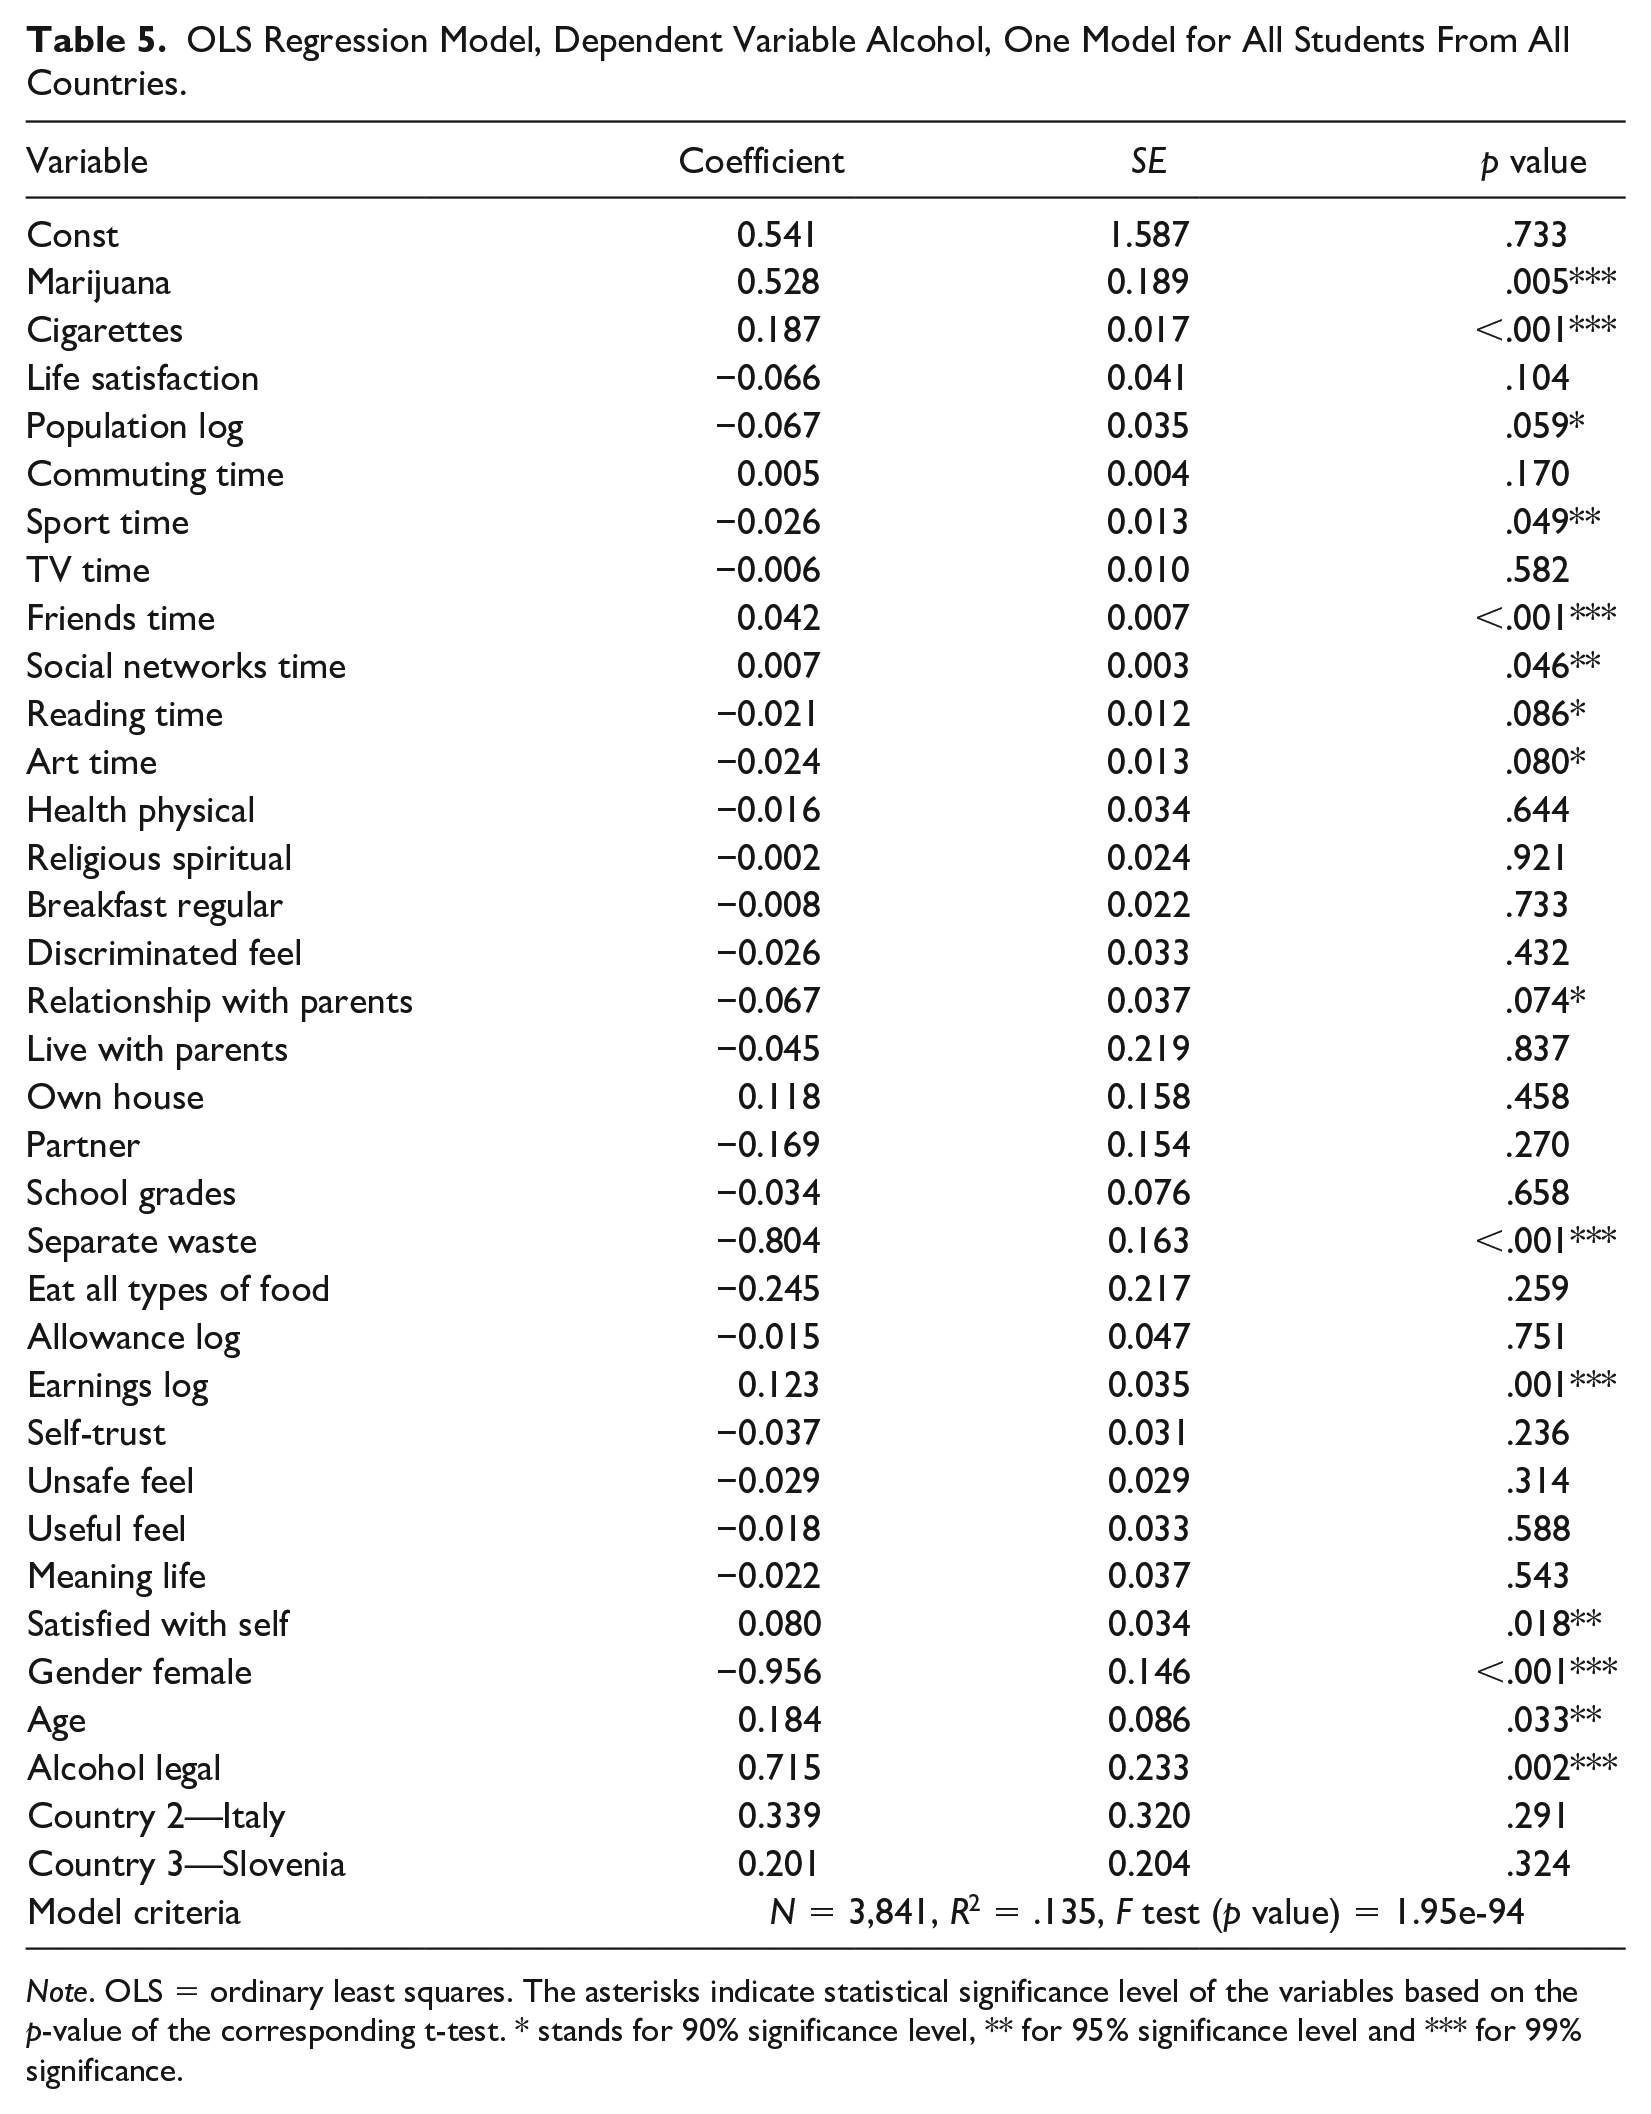
Note. OLS = ordinary least squares. The asterisks indicate statistical significance level of the variables based on the p-value of the corresponding t-test. * stands for 90% significance level, ** for 95% significance level and *** for 99% significance.
We are aware of the fact that our research would bring more detailed and concrete results if we repeated the questionnaire survey more than once. This would allow us to construct pooled regression models or even panel regression models. However, due to specific school restrictions, this was not possible. We encourage future researchers to conduct similar research based on collecting data at more time points. Although our cross-sectional data do not allow us to determine causal directions between variables, our study still brings valuable results that can serve as a base map of factors that are related to alcohol consumption. This map shows areas that should be investigated in more detail to understand student behavior more clearly.
For the sake of high-quality regression models, we used logarithmic transformation for the variables concerning finances (variables, Allowance and Earnings). As confirmed, the effect of marginal financial income on life satisfaction decreases with the absolute income (Kahneman & Deaton, 2010). In our case (with the dependent variable, Alcohol Consumption), we can expect the same pattern as far as the influence of income is concerned. Students’ consumption of alcohol is unlikely to grow linearly with personal income due to the saturation of their alcohol wants. This assumption is confirmed by the fact that when we used linear coefficients in the case of financial variables (Allowance and Earnings), the regression models were of lower quality—lower R-squared and higher Akaike and Hannah–Quinn criteria. Logarithmic transformation was also used in the case of the variable, Population, as it is unlikely that alcohol consumption would increase linearly with the population of the place of residence of the student.
Results
In this section, we first present and discuss the summaries of statistics of each country. After this, we move to the results of the regression analysis introduced and described in the previous section.
The summaries of statistics for all three countries are presented in Table 4.
The differences in alcohol consumption between students from the three countries are not large. Czechs consume relatively more alcohol than Italians and Italians drink a little bit more than Slovenians. The Italians are less into cigarettes. It can be inferred from Table 4, that the standard deviation for alcohol reaches its highest value in the Czech Republic. This suggests that comparatively a higher number of Czech students drink either a relatively large or relatively very low amount of alcohol.
Figure 1 shows the relative frequency distributions of the variable, Alcohol, for the three countries.
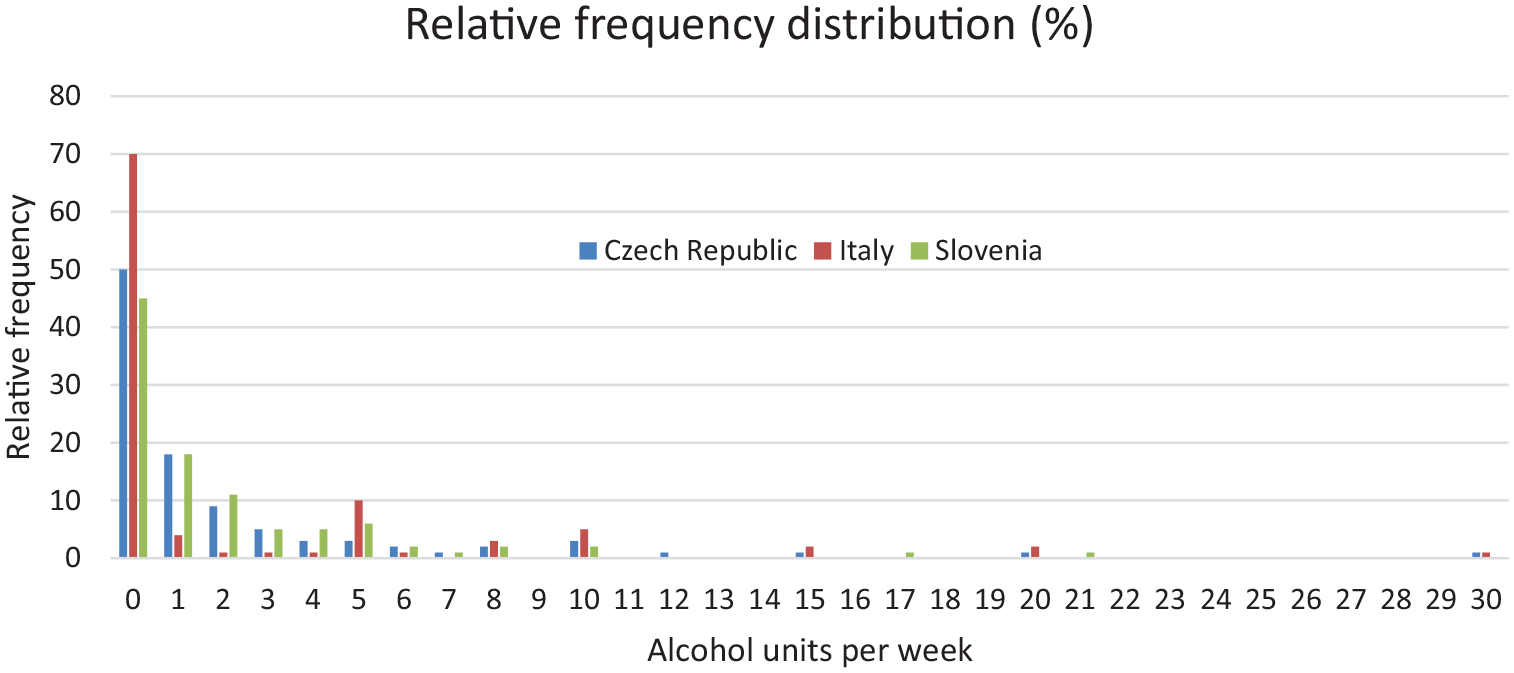
Alcohol relative frequency distribution: Czech Republic, Italy, and Slovenia.
Students from the Czech Republic and Slovenia exhibit a similar drinking pattern: about 50% of the students in these countries are abstainers. For the range between 1 and 9 units of alcohol, there was a gradual frequency decline. In both countries, only a minority of students reported more than 10 alcohol units per week. 4 Conversely, the patterns in Italy are noticeably different: Italians reported 70% abstainers and then there was a gradual decline for the Values 5, 10, 15, 20, 25, and 30. These differences show that in the Czech Republic and Slovenia it is quite common to drink alcohol occasionally (1–5 units per week). In Italy, the students are either abstainers or relatively bigger drinkers. Later in this section, and also in the section “Discussion,” we shall see whether the difference between Italians and those from the other two countries manifests when studying factors of alcohol use as well.
Table 3 presents the output for the linear OLS models constructed separately for each country. The dependent variable is Alcohol (alcohol consumption). The columns “Coeff” show the approximated coefficients of the regression models. The columns labeled “Std. Error” show the standard errors of the coefficient estimate. The columns “p value” naturally show the p values of the corresponding t test with the null hypothesis that the approximated coefficient is equal to zero. In the columns “p value,” three asterisks signify a p value lower than .01 (1% significance). Two asterisks stand for a p value higher or equal to .01 and lower than .05 (5% significance). One asterisk signifies a p value higher or equal to .05 and lower than .1 (10% significance). We follow the common approach and take a coefficient as significant, if the p value is lower than 0.5 (two or three asterisks). If the p value is between .05 and .1 (one asterisk), we consider the factor as potentially significant. The last row of the Table shows the basic model criteria.
The R-squared coefficients for the OLS models are relatively low. This is because the students approximated their alcohol consumption value and, in reality, the amount of alcohol consumed per week changes with every week. In addition, there can be other factors that correlate with alcohol consumption. However, as our aim is not to predict the alcohol consumption of a student but only to find general trends, the low R-squared criteria are not a problem and the models can be used for our purposes.
It should be emphasized that in our case regression results do not show causal effects but relations only. Causality cannot be determined from our cross-sectional data. However, in many cases (e.g., with gender), one causal direction can be ruled out (here the effect of alcohol on the gender of the student). In this article, we focus more on the potential “independent variable to alcohol” causality, but to determine the causal direction, further research is needed.
Discussion
Population and Alcohol Consumption
As can be inferred from the model for Slovenia in Table 3, the variable, Population Log. is significant with a coefficient −0.156, meaning that multiplying the population by e (increasing population by 172%) is connected with a decrease of the variable, Alcohol Consumption, by 0.156. Equivalently, increasing the population of a village/town by 10% is associated with a decrease of consumption of alcohol by log(1.1) × 0.156 = 0.095 × 0.156 = 0.0148. This is of course a relatively small, yet significant connection, which probably has to do with the social composition and habits of the students from different social areas. To understand this association clearly, more detailed research will be needed. In the models based on the Czech and Italian student population, no association between the population of the place of residence and alcohol consumption has been found, which gives a high probability that the population of the municipality of a student from either of these countries does not have any influence on the alcohol consumption of the student when other factors are fixed. 5
Time With Friends and Alcohol Consumption
Both the Czech Republic and Slovenia exhibit a positive relation between time spent with friends and alcohol use. The coefficients belonging to the variable, Friends Time, are 0.040 and 0.046, respectively. This means that, with other factors fixed, an extra 10 hr spent with friends are on average connected with an increase of alcohol consumption by 0.40 units in the Czech Republic and by 0.46 units in Slovenia. The reason why time with friends is a significant factor in the Czech Republic and Slovenia and not in Italy most likely has to do with the differences in drinking habits across countries. Our finding is in line with numerous studies concluding that time with friends, membership in students’ associations, and so on, are associated with a greater frequency and quantity of alcohol use (Cashin et al., 1998; Lichtenfield & Kayson, 1994; McCabe et al., 2005; Thrul & Kuntsche, 2016). It is important to emphasize that, as far as time with friends is concerned, both causality directions are possible: It seems logical that being with friends can increase alcohol consumption because of the social pressure created by students who drink alcohol regularly. On the contrary, students who drink more alcohol can be more inclined to meet friends, for example, in the bars and pubs where they come to drink. Here, it can be expected that the first causality (friends—alcohol) applies at least to some extent, but to measure strength of this causal effect, additional research must be conducted—preferably a random controlled trial or research based on panel data.
As mentioned in the “Method” section of this article, most Czechs and Slovenians drink between 1 and 9 units of alcohol per week. Apparently, drinking alcohol is considered a normal practice in these social backgrounds. Consequently, for the purpose of socializing and establishing social relations, students may be bound to follow the cultural habit of drinking alcohol. On the contrary, most Italians are abstainers; drinking alcohol is presumably not customary for Italian teenagers. Therefore, being part of the Italian teenager society probably does not automatically include drinking. Hence, the insignificance of the variable, Friends Time, in Italy.
Smoking and Alcohol Consumption
In all three countries, alcohol consumption is positively related with smoking cigarettes. This seems logical as smoking and drinking alcohol are complementary activities at many parties and gatherings. All of the estimated coefficients belonging to the variable, Cigarettes, were close to 0.17. This suggests that drinking one beer (or other type of alcohol unit) is connected with smoking five or six cigarettes. Moreover, the variable, Marijuana, is positively related with alcohol consumption in Slovenia and potentially positively related (p value .067) with alcohol consumption in the Czech Republic. This shows that in these two countries drinking can be connected not only with smoking cigarettes but also with smoking marijuana.
Finances and Alcohol Consumption
The variable, Earnings Log, has been found to be significant only for the Czech Republic (coefficient 0.258). The variable, Allowance Log, is insignificant in all of the three countries. This may seem rather puzzling as students need money to buy alcohol. However, in the Czech Republic and Slovenia, the prices of alcohol are relatively very low. In a restaurant, beer is usually cheaper than water as the sale of beer is the core business of dining establishments. In any case, it seems unlikely that we could achieve a reduction in students’ alcohol use by reducing their personal income. On the contrary, our results correspond neither with the study having identified expandable income as a predictor of alcohol use among U.K. students (Bellis et al., 2007), nor with other studies that found existing relationships between income structure and alcohol use among adolescents (see, for example, Elgar et al., 2005; Sornpaisarn et al., 2013). Therefore, the importance of finances as far as alcohol consumption is concerned is likely to vary across countries. As for the relation between earnings and alcohol consumption in the Czech Republic, both causal directions must be again taken into account: More money could increase alcohol consumption and higher alcohol consumption could possibly stimulate students to work more to earn money for buying alcohol. When studying the relation between income and alcohol, we should also consider the nature of alcohol as an economic article. It is possible that having a greater income is not related to greater or lower alcohol consumption because alcohol is not a normal good. It could be either an inferior good or the nature of this good could be that students buy and consume the same amounts of alcohol no matter what their income is, as is suggested above. In any case, it seems that the role of finances as far as alcohol consumption goes is rather complex and as such calls for more detailed research including both the quantitative and qualitative approach in the future.
Social Networks and the Consumption of Alcohol
Furthermore, the results show a positive relation between alcohol consumption and using social networks in Italy as well as a potentially positive relation (p value .056) in Slovenia. It is unlikely that while using social networks the students drink alcohol. A more probable explanation is that social networks are a place where drinking alcohol is considered attractive (Ridout et al., 2012).
Unfortunately, the Italians spend on average 39 hr per week on social networks, which is 15 hr more than the Czechs and 25 hr more than the Slovenians. As the coefficient belonging to the variable, Social Networks Time, for Italy is 0.020, social networks in the lives of Italian teenagers can be responsible for as much as 0.78 (0.020 × 39) units of alcohol per week. This is 34% of the average Italian alcohol consumption. The association between alcohol and social networking should be taken seriously; as suggested by Guedes et al. (2016), social networking shows signs of addictive activity. This is in line with the fact that alcohol consumption is connected with smoking cigarettes as well. Social networking, smoking cigarettes, and alcohol consumption provide the student with abnormal stimuli that the student may lack in normal life. Therefore, we suggest that all of these activities be taken as potentially addictive and potentially harmful, especially at an early age.
In addition, an inverse causality must be taken into account—Does having an inclination to alcohol lead to using social networks more often? As with other associations described in our study, the direction of causal effect needs to be studied in the future. In the same way, why social networking is an insignificant factor in the Czech Republic cannot be determined with 100% certainty. It is possible that the Czechs use social networks for different purposes than the Italians and Slovenians. More research will be needed here to determine the exact source of this disparity.
Watching TV and Alcohol Consumption
There is a negative relation between TV Time and alcohol consumption in Slovenia. Conversely, our results show a positive relation between TV and alcohol in the Czech Republic. A possible explanation is that there is a more tolerant approach toward alcohol use in the media in the Czech Republic. Indeed, not long ago, the name of the Czech football league was the “Gambrinus league” where Gambrinus is a beer brand. This is one of many examples showing that alcohol consumption in the Czech Republic is interwoven into many areas advertised on TV. Furthermore, the World Health Organization (2018b) reported that the Czech Republic is among the biggest consumers of alcohol in the world. In Slovenia and Italy, drinking is not a part of the culture to such an extent. This might go hand in hand with the lower number of alcohol advertisements on TV, which would make watching TV less seductive as far as alcohol consumption is concerned.
Prevention From Alcohol Consumption
Factors that may potentially serve as prevention from alcohol use can be derived from the regression results as well: cases when there is a negative relation between a certain factor and alcohol consumption. This is especially the case of participating in sport activities (significant in the Czech Republic and potentially significant in Italy), art (significant in Italy and potentially significant in Slovenia), being religious or spiritual (significant in Italy), and waste separation, which may serve as a proxy variable for having a positive attitude toward nature and one’s environment (significant in Italy and Slovenia).
These findings correspond to the results of many studies, which show that the more free time activities a student has, the lower their alcohol consumption, as is the case of religion involvement, which appears to significantly reduce alcohol consumption (see, for example, Crocker, 2002; Moos et al., 1976; White et al., 2006). Yet again, we should emphasize that an inverse causality (alcohol—factor, here in the negative sense) can apply as well. For example, drinking more alcohol may prevent students from attending to certain activities or free time events.
As far as sport is concerned, a negative relation in the Czech Republic and a potentially negative relation in Italy between sport and alcohol has been found. These results indicate a potentially negative influence of sport on alcohol consumption (more sport reduces alcohol consumption). As intuitive as these results may seem, they may contradict the result of other studies (see, for example, Lorente et al., 2004). These authors found that French high school students drank significantly more when participating in group sports. Again, this disparity may exist due to differences in national or local social habits. For example, it is possible that, after finishing their sport activities, French students go to a bar to drink alcohol. This may not be the case in the Czech Republic, Italy, and Slovenia. However, such hypotheses need to be confirmed in future research, be it a natural experiment or other suitable method.
Physical Health and Alcohol Consumption
As for the physical health of high school students in our sample, no relation with alcohol consumption has been found in any of the three countries. This may be surprising because of the generally known harmfulness of alcohol consumption, which has been confirmed scientifically as well (see, for example, Bewick et al., 2008; Stranges et al., 2006). On the contrary, our results may simply point to the fact that the harm caused by alcohol consumption can significantly manifest only in the later part of peoples’ lives. Thus, our results are compatible with the results of the studies mentioned above.
All of the psychological factors presented in the “Method” section of this article proved to be insignificant in all countries. This shows that drinking alcohol among students can be reduced directly by manipulating life circumstances and has little to do with the psychological setting of students. This finding might be surprising as it is often believed that susceptibility to alcohol consumption is a direct result of psychological problems or difficulties in one’s own personal life (Park & Grant, 2005). However, it is possible that this phenomenon arises only in the later part of life and it does not apply in the case of students.
Gender and Alcohol Consumption
Concerning gender, our results suggest that, with other factors fixed, girls tend to drink less in Slovenia and in the Czech Republic, specifically by almost 1 unit per week in Slovenia and by 1.3 units in the Czech Republic. This is not the case in Italy where gender has not proven to be a significant factor. The lower level of girls’ alcohol use is in line with other studies (see, for example, Berkowitz & Perkins, 2010; Geisner et al., 2004; Harrell & Karim, 2008). Park and Grant (2005) suggest that the perception of risk or alcohol-related consequences may account for these differences. In their study, women showed higher risk perception of using alcohol and drugs.
Age and Alcohol Consumption
According to our analysis, the drinking pattern among Slovenian students is significantly affected by age (the variable, Age, is significant in the regression model for Slovenia—see Table 3). Specifically, an increase of age by 1 year corresponds to an increase of weekly alcohol consumption among Slovenians by 0.38 units. The variable, Age, is potentially significant in Italy with a negative coefficient. This only highlights the differences between drinking habits between the three countries our study works with. If drinking consumption really decreases with age in Italy, then the habits and culture concerning alcohol use is different when compared with these aspects in the Czech Republic and Slovenia. It is, for example, possible that in Italy alcohol consumption occurs during one’s teenage years where it serves as one of the puberty symptoms. As students grow older, the need to delimit one’s possibilities and rules by drinking may disappear. Yet again, this is a hypothesis to be tested in future research. In this case, it is clear that only a detailed qualitative research could bring more light into these topics. Our study can only point to such phenomena and calculate their numerical properties without the ability to explain the observed patterns and constellations.
The variable, Alcohol Legal, is significant in Slovenia and potentially significant in the Czech Republic, in both cases with positive estimated coefficients. As the alcohol-factor causality can be ruled out in this case, this most likely means that when Slovenian and potentially also Czech students come of age they start drinking more alcohol. An explanation that is possibly responsible for these results is that in the Czech Republic, and especially in Slovenia, it is difficult to buy or obtain alcohol if you are aged younger than 18 years. Thus, when Czech and Slovenian students reach this age, they take advantage of their newly acquired right to buy alcohol and consequently they increase their alcohol consumption. On the contrary, in Italy, the variable, Alcohol Legal, is not significant. This can mean that for Italians the drinking age does not matter; their ability to obtain alcohol is the same when they are of age as when they were aged 17 years or younger. These results possibly show the intensity in which restrictions for purchasing alcohol are enforced; these restrictions seem to be enforced most in Slovenia, a bit less in the Czech Republic, and they are probably enforced very little or not at all in Italy. Table 1 suggests that, in Italy and Slovenia, legal restrictions regarding alcohol are stricter. However, this table does not talk about the purchasing restrictions. Our results (significance of the variable, Alcohol Legal, in Slovenia and potential significance in the Czech Republic) suggest that these restrictions may be most intensive in Slovenia and the Czech Republic. Overall, it seems that the intensity with which alcohol regulation (all aspects) is enforced is highest in Slovenia. The aforementioned observations and interpretation correspond with another study (Karlsson & Österberg, 2009).
Countries and Amounts of Alcohol Consumption
As a part of our analysis, we also constructed a linear OLS regression model based on the whole student population from all three countries (N = 3,841). We did so mainly to determine the fixed effects of countries. The results of this regression model are provided in Table 5.
A quick observation that can be drawn from Table 5 is that, in most cases, the significant variables are the same as the variables that were significant in component regression models (see Table 3). As these relations were interpreted and discussed in previous parts of this section, we refrain from doing so here. We will only highlight that the variable, Alcohol Legal, was found significant, confirming the strong role of public regulations regarding alcohol consumption.
The variables that we are most interested in concerning the case of the conjoint model are the dummy variables that stand for the countries (the variables, Country Italy and Country Slovenia). These variables were included in the model to control for various cultural, legal, or community institutions that are related to the amounts of alcohol consumption.
Both variables, Country Italy and Country Slovenia, were found insignificant. This means that the amount of alcohol that students in all countries drink is related with factors that were found significant in the regression analysis and there are no fixed effects of countries. One might be tempted to say that the amount of alcohol consumed among students is not related to the institutional environment of the countries, specifically, cultural, legal, or community institutions, including students’ attitude toward alcohol. However, we must bear in mind that some institutional constellations are implicitly included in some variables that were found significant and which were discussed in earlier parts of this study. For example, the fact that with other factors fixed, Czech and Slovenian girls drink less than boys itself most likely means that the institutional environment in these countries is set in such a way that it determines the students’ alcohol consumption to a large extent. In this specific case, it could, for example, mean that to see a boy with a glass of beer is socially more acceptable than to see a girl with alcohol in her glass. Using regression results, we can determine areas, social aspects, and cultural aspects, which are related with alcohol consumption. To define and describe concrete ties and causalities between alcohol use and other factors, additional qualitative analysis will be needed.
Conclusion
The aim of our research was to create a base map showing the different relations between alcohol consumption and various factors concerning different aspects of high school students’ lives. As was discussed in many places in this article, precise causality directions cannot be determined with our type of data. As was recommended many times in this article, further research can use this map as a guide as to what factors need to be studied in more detail. Thus, our study can be viewed as a cornerstone in analyzing the predictors of alcohol consumption among teenagers.
It is not certain to what extent our results can be generalized to students in countries different from those analyzed in our study. Also, the specific type of schools we worked with can be the cause of specific statistical results. Although it can be expected that the results of our analysis will, to some extent, apply to other students from different backgrounds, it would be most useful to extend our analysis to other students both from different countries and from different types of high schools. Such research would have the capacity to distinguish between patterns that apply to all or most of the students and patterns that depend on the specific student social group.
Such an approach was applied in our study as well; an essential part of our research is devoted to the comparison of factors related to alcohol consumption across countries—the Czech Republic, Italy, and Slovenia. The results show that the “drinking patterns” in the Czech Republic and Slovenia are similar but that they differ more in the case of Italian students. This is reflected both in the summary of statistics (different histograms for drinking alcohol—Figure 1) and in the outcomes of the regression models. The conclusion is that factors influencing alcohol consumption differ between the countries that we studied and most likely between other countries as well. This is probably due to different social backgrounds, social habits and values, and institutional environments in different societies. Therefore, when trying to reduce students’ alcohol consumption, one must take into account the specifics of the region and the society in which they operate. Specifically, one of the causes responsible for different drinking patterns in the three countries studied can be the existence of different legal regulations regarding alcohol or the different level and intensity of their enforcement in each country and region.
There are some points that we should emphasize when discussing further actions that should lead to the reduction of alcohol consumption. First, in the case of students in our sample, the amount of alcohol consumed does not depend on one’s own financial situation. Teenagers who want to drink are almost always able to find a way to drink regardless of their personal income. Therefore, it would be of little benefit to control students’ allowance from their parents to decrease their alcohol consumption. Second, as alcohol consumption is positively associated with smoking cigarettes (these two activities can be regarded as complements rather than substitutes), it is likely that if society reduces smoking among teenagers, then alcohol consumption will drop as well. Although we refrain from making any concrete recommendations, this fact could contribute to the justification of all measures aimed at decreasing tobacco consumption.
Furthermore, the time spent with friends is a potentially (if the time with friends to alcohol consumption causal effect applies) strong cause of increased alcohol consumption. Of course, it would be absurd to advise parents to keep their children away from their peers or to censor their relationships. If parents want to support a healthy lifestyle for their children, it may be of more use to pay attention to how their children spend their free time. Rather than negative motivation (forbidding socializing with certain social groups), a more positive motivation could be used—deliberately supporting social ties with communities and institutions, which the parents trust. For instance, developing relationships with art communities or sport clubs could prove beneficial as in our study both art and sport activities exhibit a negative relation with alcohol consumption.
Our study creates space for future research in many areas. First, the main limitation of our research is the fact that the regression results show relations and not direct causal effects. For example, the variable, School Grades, is a significant negative factor in the model with the dependent variable, Alcohol, in the case of Italy. This could either mean that academically successful students are less susceptible to drink alcohol (academic success—alcohol causality) or that students who drink alcohol have less time, less energy, or less motivation to study (alcohol—academic success causality). Although, in many cases, the relevant causality direction can be predicted (e.g., in the case of age and its relation with alcohol consumption), in most areas it is necessary to conduct more detailed research; constructing panel regression models based on data that are sufficient for this type of regression or conducting random controlled trials would prove especially valuable. Second, interesting and useful results could be found if researchers investigated the reasons for the disparities between countries found in our study. For example, what lies behind the fact that with other factors fixed, Czech and Slovenian girls drink much less alcohol than boys do and why does this not apply for Italy? In this case, qualitative research based on interviews with students or various authorities would be especially useful. The causes of such differences could also provide recommendations on how to reduce alcohol consumption among teenagers.
Overall, our results constitute a map of factors from various life areas related with alcohol consumption. This way, much space for future research is created. Additional research could offer and specify the means to decrease alcohol consumption among teenagers. As teenage years can be very sensitive as far as the forming of an alcohol addiction is concerned, our study and the results of future research have the potential to make students more “resistant” to alcohol consumption not only during their teenage years but also in the later part of their lives.
Footnotes
Declaration of Conflicting Interests
The author(s) declared no potential conflicts of interest with respect to the research, authorship, and/or publication of this article.
Funding
The author(s) disclosed receipt of the following financial support for the research, authorship, and/or publication of this article: This article was created with the support of the Smart project (Grant Number: CZ.02.1.01/0.0/0.0/17_048/0007435), University of Jan Evangelista Purkyne, Usti nad Labem, Czech Republic.