
Abstract
Socioeconomic disadvantage and disorder in the residential neighborhood have been linked to multiple health risks, but less is known about the relevance of other spaces of daily life. This article considers whether disadvantage and disorder in the immediate context—within or outside of the residential neighborhood—is associated with physiological symptoms indicative of stress and strain. We use data from a study of 61 older adults in four New York City neighborhoods. Participants carried smartphones to capture GPS locations and ecological momentary assessments during the study week. We find that instantaneous exposure to disorder is associated with momentary spikes in pain and fatigue. This is not explained by cumulative exposure to disorder or concurrent stress or fear. Rather, disordered spaces may be physically and cognitively taxing for older adults in real time. We urge further research on short- and long-term health consequences of activity spaces.
In the past several decades, extensive research has demonstrated that individuals who live in poorer or more structurally disadvantaged areas have worse health outcomes even after accounting for individual disadvantages (for reviews, see Cagney and York Cornwell 2010; Meijer et al. 2012; Pickett and Pearl 2001; Robert 1999; Yen, Michael, and Purdue 2009). Concentrated socioeconomic disadvantage in the residential neighborhood has long-term implications for self-rated health, chronic diseases, mental health problems, and mortality (Diez Roux and Mair 2010; Hill, Ross, and Angel 2005; Kim 2010; Ross and Mirowsky 2001). Dilapidated buildings and disorder in residential environments can also cause fear, stress, and mistrust of others (Perkins and Taylor 1996; Ross and Mirowsky 2001; Ross, Mirowsky, and Pribesh 2001), which contribute to poor physical and mental health (Galea et al. 2005; Kim 2010).
However, research on neighborhood effects on health rarely attends to locations where individuals spend time outside of their residential neighborhoods (Diez Roux and Mair 2010; Matthews and Yang 2013). Individuals often move beyond their residential areas for daily activities and social interaction, and the characteristics of this broader range of geographic contexts may be consequential for well-being. Extraresidential contexts can be particularly important for community-residing older adults who are especially dependent on and vulnerable to neighborhood conditions due to physical or cognitive limitations (Lawton and Nahemow 1973). Indeed, prior research indicates that neighborhood conditions can exacerbate or ameliorate physical health declines that accompany aging (Beard et al. 2009; Cagney and York Cornwell 2010; Robert and Li 2000). To the extent that older adults spend time outside of their residential neighborhood, extraresidential contexts may also be critical determinants of later life health trajectories.
In this article, we consider the role of activity spaces in older adults’ exposure and physiological response to environmental strains. Activity space is a recent sociological concept rooted in geographic research (Golledge and Stimson 1997). Activity space encompasses the full range of spatial contexts in which individuals conduct their daily activities, including but not limited to the residential neighborhood (Cagney et al. 2020). We examine how structural and social characteristics of older adults’ activity spaces are associated with health. We suggest that exposure to concentrated disadvantage and disorder in both residential and extraresidential areas may be stressful, cognitively taxing, and physically demanding—all of which may contribute to spikes in physiological symptoms like pain and fatigue and, over time, health declines.
We use novel data from a smartphone-based study of older adults in New York City that incorporated both continuous GPS tracking of respondents’ locations and periodic administration of ecological momentary assessments (EMAs). EMAs gathered respondents’ real-time reports of the characteristics of their location, what they were doing, whom they were with, and how they felt, including experiences of pain and fatigue—our primary measures of physiological symptoms. We focus on two characteristics of the local context—concentrated socioeconomic disadvantage and observations of disorder such as broken windows, litter, and cracked sidewalks. We examine how each is associated with physiological symptoms when encountered in older adults’ residential and extraresidential environments. The findings indicate that real-time perceptions of disorder are associated with spikes in pain and fatigue, but this is not attributable to cumulative exposure to disorder or to concurrent stress or fear. We conclude by discussing the implications for further research on activity space and health.
Background
Neighborhoods, Stress, and Health
For older adults, residential neighborhood disadvantage and disorder are associated with myriad indicators of health and well-being (Cagney and York Cornwell 2010; Yen et al. 2009). Neighborhood problems and lower perceived neighborhood safety—conditions often associated with concentrated disadvantage and disorder—are also associated with worse self-rated health among older adults even after accounting for individual disadvantages (Bowling et al. 2006; Wen, Hawkley, and Cacioppo 2006). In some cases, linkages between health and markers of neighborhood disadvantage and disorder may stem from exposure to neighborhood-based risks. For example, substandard housing and decaying infrastructure can present environmental toxins and physical hazards (Elliott 2000; Weden, Carpiano, and Robert 2008). Abandoned buildings, graffiti, and litter can also impact individuals’ exposure to hazardous conditions or victimization (Perkins and Taylor 1996; Ross and Mirowsky 2001; Ross et al. 2001). And for older adults who have functional limitations, uneven or littered sidewalks, insufficient lighting, and dilapidated structures may present additional physical challenges.
Neighborhood conditions can also impact individuals’ short- and long-term physical and mental health through the stress process (Aneshensel 2010; Diez Roux and Mair 2010). Observing litter, crime, dilapidated buildings, and neglected infrastructure, for example, can incite psychological responses such as emotional strain, anxiety, fear, and distress. These responses activate the sympathetic-adrenomedullary (SAM) system, causing the release of hormones, including epinephrine and norepinephrine, which increase heart rate, attention, and blood flow (Nixon et al. 2011). Subsequently, the hypothalamic-pituitary-adrenal (HPA) axis produces cortisol, which prepares the body to respond to a threatening situation. Symptoms associated with the physiological “fight or flight” stress response include rapid heartbeat, shortness of breath, nausea, dizziness, sweating, and weakness as well as an increase in overall pain sensitivity, which may manifest as pain in muscles or soft tissues such as tendons or ligaments or headaches (Nixon et al. 2011). Fatigue, or a lack of energy, has also been linked with the stress response, although the timing and mechanisms are not fully understood (see e.g., Chida and Steptoe 2009; Doerr et al. 2015).
Prior studies find that residence in socioeconomically disadvantaged and disordered neighborhoods is associated with physiological symptoms of distress such as chest pain, nausea, and weaknesses both cross-sectionally (Schieman and Meersman 2004) and longitudinally (Hill et al. 2005). These associations are consistent with how pain and fatigue are socially structured. Racial minorities and those with lower levels of socioeconomic attainment experience higher levels of pain and disability and worse quality sleep relative to whites and individuals with higher socioeconomic status (e.g., Grandner et al. 2016). These disparities are generally attributed to a combination of social and economic determinants, including discrimination, residential segregation, health behaviors, health care access, and (un)employment (e.g., Robinette et al. 2013), many of which are interwoven with the residential context. Indeed, older adults who reside in more socioeconomically disadvantaged neighborhoods report more daily pain and pain-related disability (Fuentes, Hart-Johnson, and Green 2007), and subjective perceptions of neighborhood problems are positively associated with both pain (Brooks Holliday et al. 2019) and poor sleep quality (Hill, Burdette, and Hale 2009).
Physiological symptoms such as pain and fatigue may be fleeting, but they can be disruptive to older adults’ daily lives by reducing mobility, social engagement, and well-being. Exposure to socioeconomically disadvantaged and disordered neighborhoods also has longer-term health consequences (e.g., Kim 2010; Pickett and Pearl 2001; Steptoe and Feldman 2001). Repeated or chronic activation of the stress response can overtax physiological systems, leading to “wear and tear,” or allostatic load (McEwen 1998), which contributes to elevated risk of morbidity, physical impairment, hospitalization, and mortality (Cohen, Janicki-Deverts, and Miller 2007).
Despite abundant evidence linking neighborhood disadvantage and disorder with individual health (Boardman 2004; Diez Roux and Mair 2010; Ross and Mirowsky 2001), research on the short- and long-term consequences of neighborhoods has been largely limited to considerations of the residential neighborhood. In the section that follows, we assert that exposure to disadvantage and disorder in extraresidential settings may be an important understudied factor for older adults’ health.
From the Residential Neighborhood to Activity Spaces
In sociological research, neighborhood typically implies the residential neighborhood or the residential census tract (Entwisle 2007; Sampson 2012; Yen et al. 2009). However, individuals residing within the same residential neighborhood may have vastly different activity spaces. Activity spaces account for the full range of social environments encountered during routine activities of daily life—including but not limited to the residential neighborhood (Browning and Soller 2014; Cagney et al. 2013, 2020). The concept of activity space echoes classic ecological models that describe daily patterns of urban mobility within and across different neighborhoods (Park 1915). It is also consistent with research in environmental gerontology, which envisions older adults as embedded in multiple social contexts that contribute to well-being (e.g., Lawton and Nahemow 1973; Wahl, Iwarsson, and Oswald 2012).
Indeed, residential neighborhoods account for only a portion of the locations where older adults spend their time (York Cornwell and Cagney 2017). Time use research suggests that older adults’ activity spaces are likely shaped by volunteering, socializing, hobbies, and leisure activities, which tend to increase after retirement (Krantz-Kent and Stewart 2007). Socioeconomic and residential neighborhood resources, racial-ethnic or cultural background, social connectedness, and health may also shape where older adults go (Foley 1950; Jones and Pebley 2014; Krivo et al. 2013; Kwan 1999; York Cornwell and Cagney 2017). Importantly, activity spaces may differ markedly from the conditions within individuals’ residential neighborhoods (see e.g., Basta, Richmond, and Wiebe 2010; York Cornwell and Cagney 2017; Zenk et al. 2011), which begs the question of how these activity spaces contribute to older adults’ health and well-being.
Several recent studies suggest that the socioeconomic characteristics of the locations where individuals conduct routine activities (e.g., working, shopping, worshipping, socializing) are consequential for health. For example, greater socioeconomic disadvantage in activity spaces has been associated with worse self-rated health net of residential neighborhood disadvantage (Sharp, Denney, and Kimbro 2015). There is also evidence that health consequences of socioeconomic disadvantage in the residential neighborhood are conditioned by the level of disadvantage within activity spaces (Inagami, Cohen, and Finch 2007). These findings are consistent with the idea that exposure to environmental stressors or demands in activity spaces exact wear and tear on the body (e.g., South et al. 2015), although the processes underlying these associations are largely unexplored.
Recent advances in real-time data collection and location tracking, such as smartphone-based EMA, have enabled examination of how individuals perceive and experience their immediate environment in real time (Cagney et al. 2020; Chaix 2018). This approach can lend insight into how social environments “get under the skin” to affect health (Taylor, Repetti, and Seeman 1997). And by studying individuals within their specific contexts, it extends Lawton and Nahemow’s (1973) classic ecological model of aging, which emphasizes the importance of the intersection of older adults’ personal competencies (i.e., functional, cognitive, sensory, self-esteem) and the “presses” or demands of the multiple social contexts within which they are embedded (also see Wahl et al. 2012). This approach allows for heterogeneity in individuals’ contextual exposures and their abilities to cope with (or adapt to) challenges and other situational factors in those social environments (Aneshensel 2010; Chaix 2018). From this perspective, the range and relevance of environmental demands may be much broader than previous work suggests. To the extent that exposures and responses to disadvantage and disorder are socially structured, conditions of activity spaces may be an underexplored source of disparities in later-life well-being.
The Present Study
The goal of this article is to examine how conditions of activity spaces—including locations of daily activities that take place outside of one’s residential neighborhood—are associated with physiological symptoms of distress such as pain and fatigue. Our analyses are guided by three research questions.
Research Question 1: Are older adults more likely to report symptoms of distress when they are located in areas characterized by socioeconomic disadvantage or disorder?
We use repeated measures within respondents and account for long-term and cumulative exposures to disadvantage and disorder to estimate the real-time association between local conditions and distress.
Research Question 2: Is the association between local disadvantage and disorder and symptoms of distress conditioned by whether individuals are within or outside of their own residential area?
This tests a widely used assumption that residential neighborhood conditions are most important for shaping health and well-being.
Finally, we examine whether real-time stress is a mechanism through which real-time exposure to disadvantage or disorder is associated with pain or fatigue.
Research Question 3: Does accounting for real-time reports of stress help to explain the relationship between real-time conditions and physiological symptoms?
An alternative explanation is that conditions such as litter, cracked sidewalks, substandard buildings, broken streetlights, and insufficient mobility aids (e.g., handrails on steps) induce spikes in pain and fatigue because they are physically and cognitively taxing for older adults.
Data And Methods
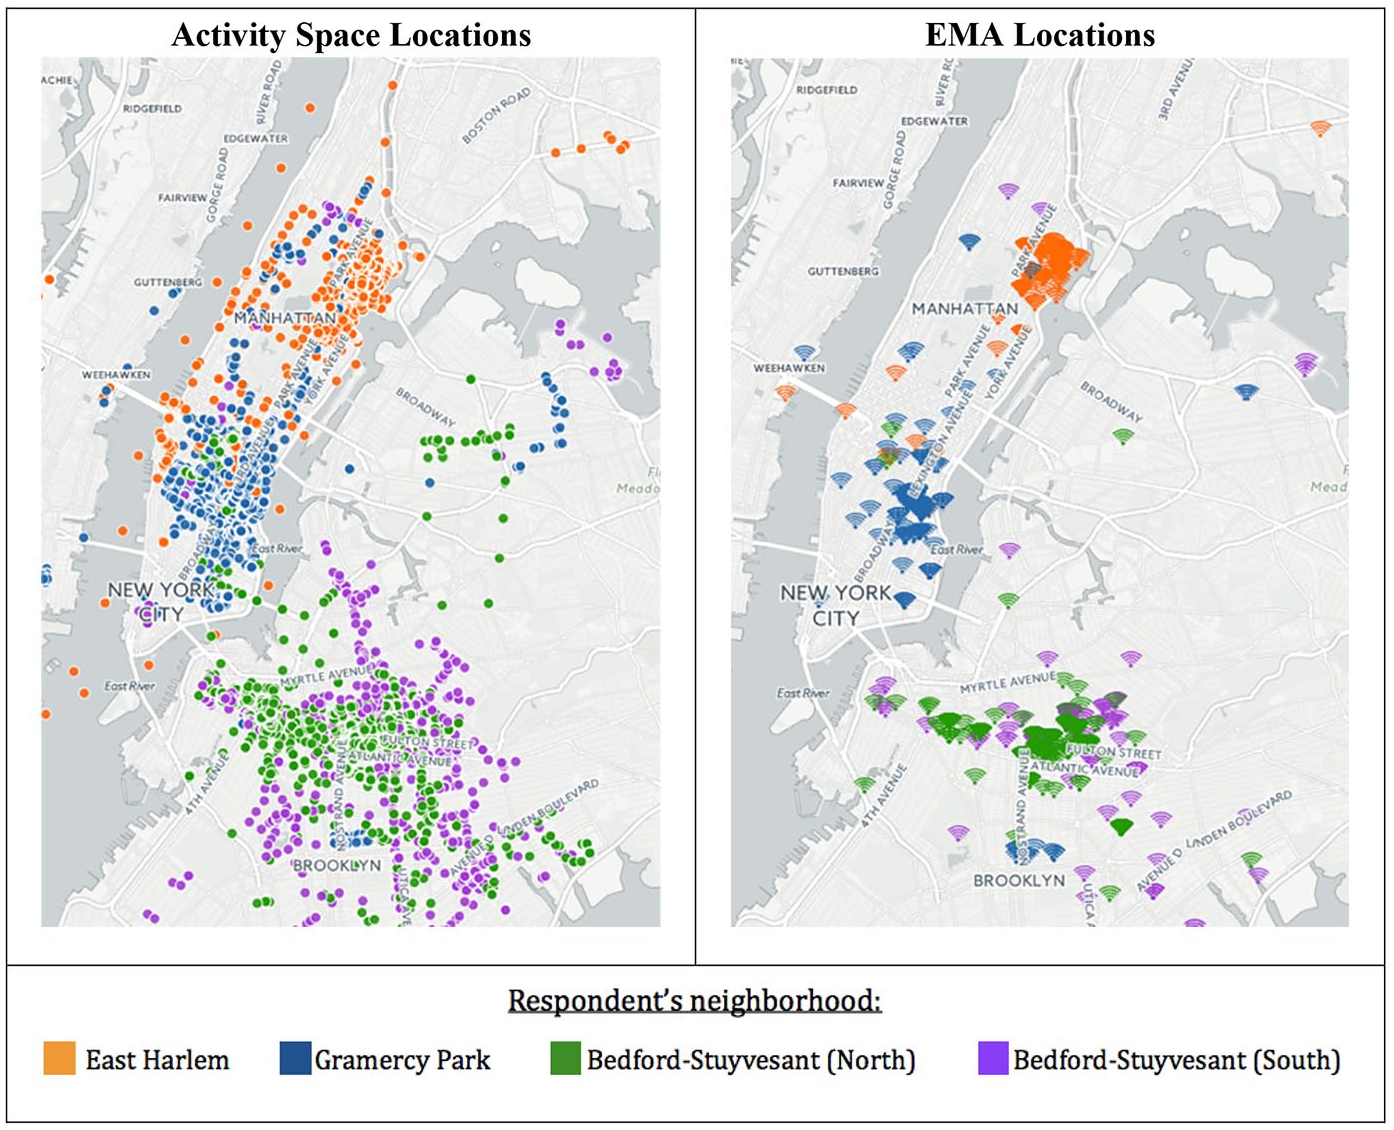
We used data from the Real-Time Neighborhoods and Social Life Study (RNSLS), a smartphone-based study of older adults in New York City, which was fielded in 2014. Respondents were recruited through convenience sampling at senior centers in four neighborhood areas: East Harlem, Gramercy, north Bedford-Stuyvesant, and south Bedford-Stuyvesant. These senior centers drew older adults who lived nearby for social events, educational seminars, health check-ups, and meals.
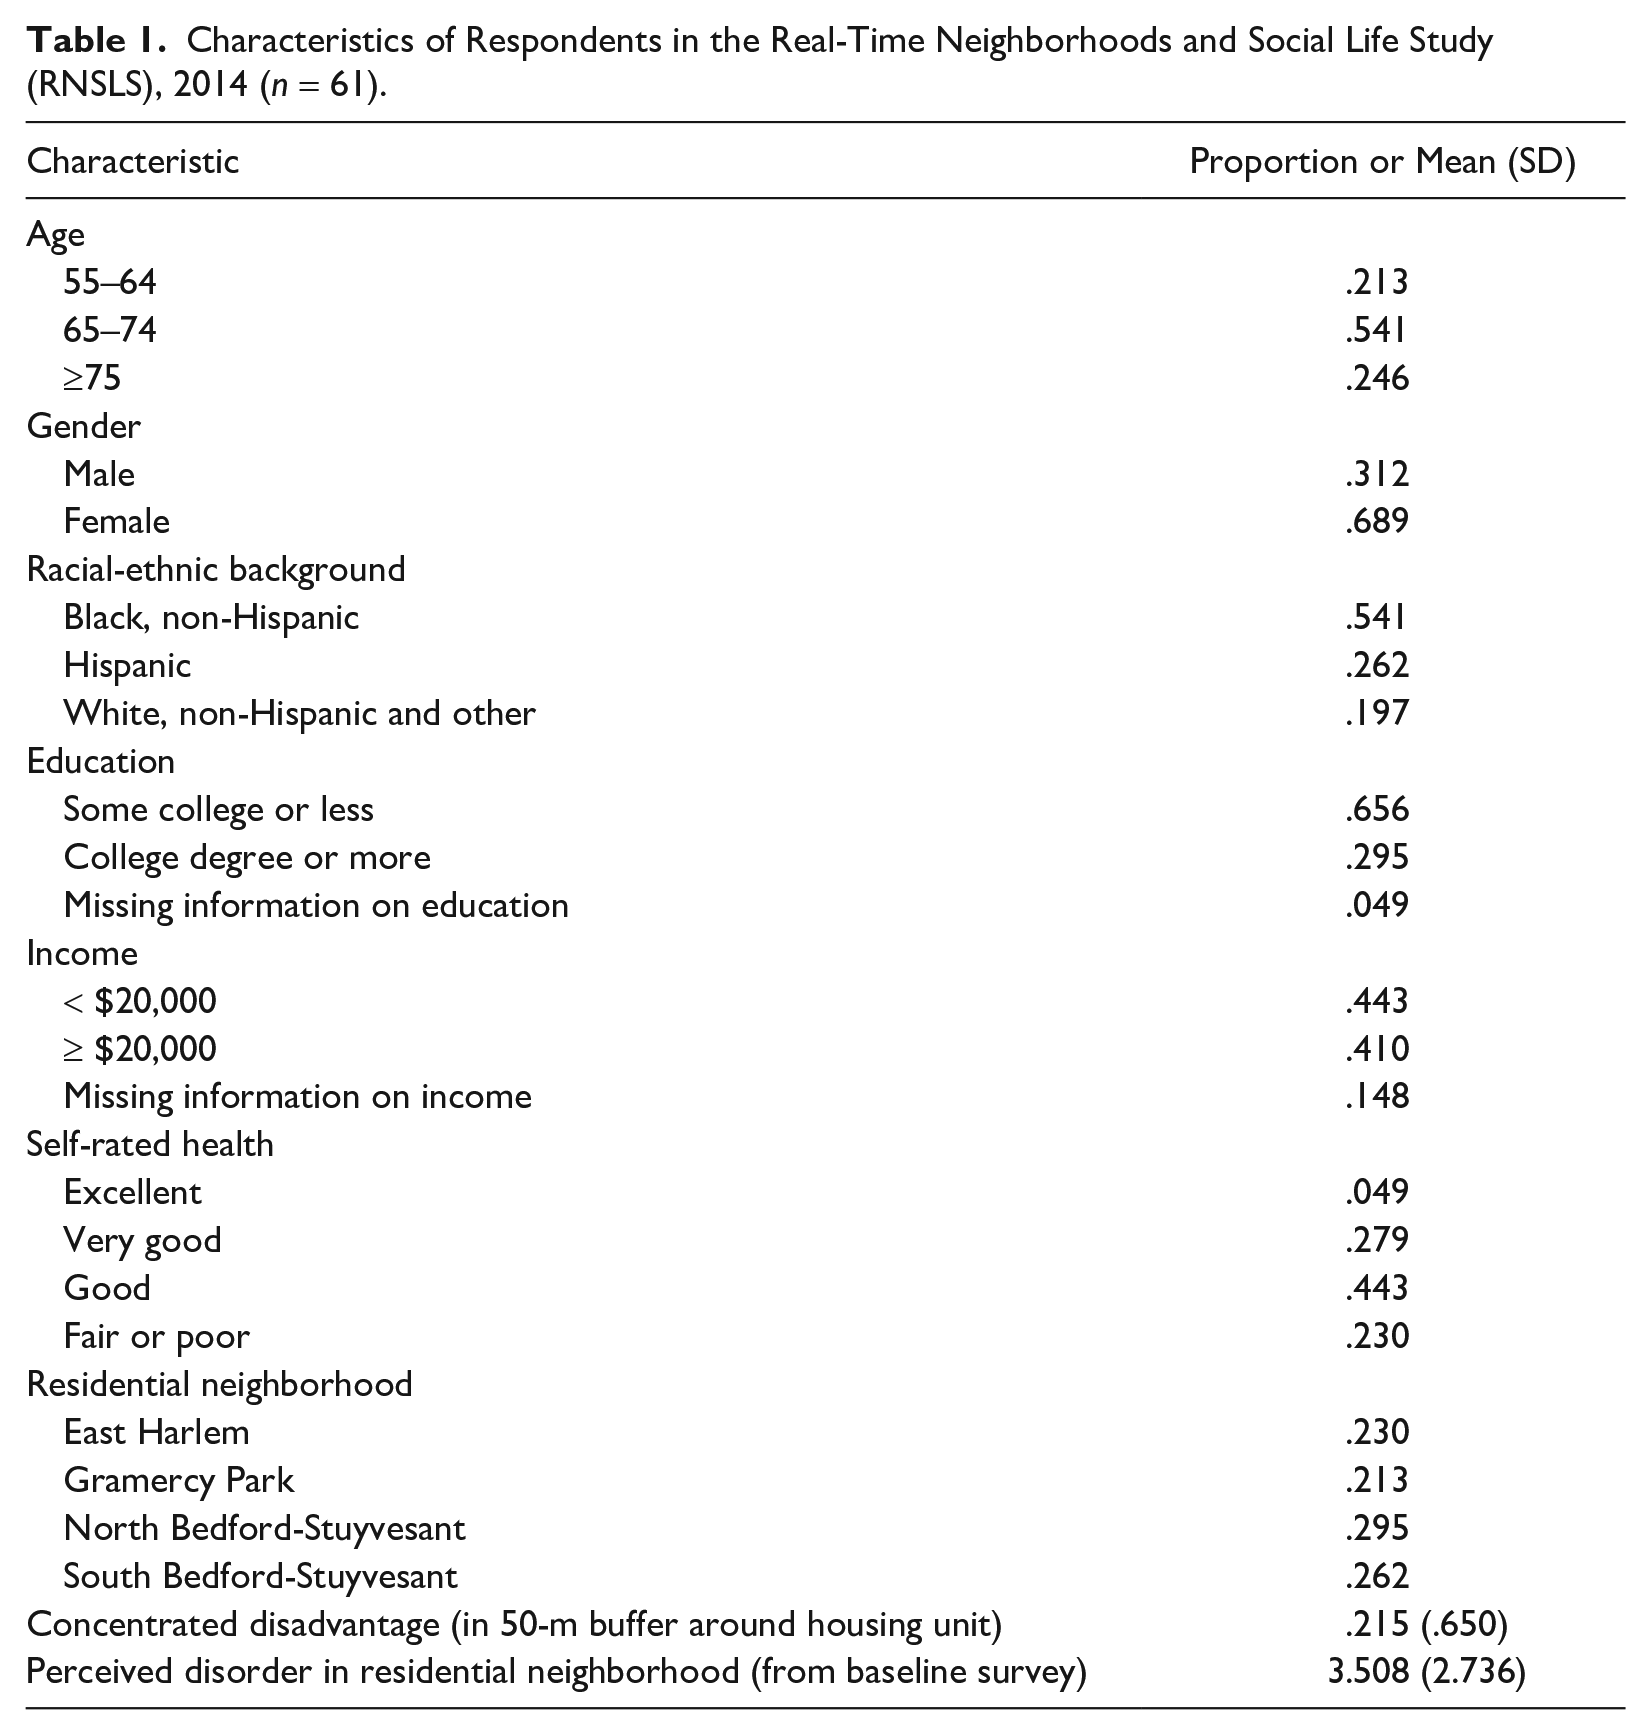
A total of 62 adults age 55 and over were recruited, and 61 completed the study in October through November 2014. As shown in Table 1, there were between 13 and 18 respondents per site. The sample was not representative of community-residing older adults in New York City, but these four sites were chosen to maximize racial-ethnic, socioeconomic, and geographic diversity in the sample. A paper-and-pencil survey administered at the beginning of the study showed that all respondents were over age 55. About 54% of respondents identified as black, non-Hispanic, and about 26% were of Hispanic origin. Nearly 30% of respondents had a college degree, but more than 44% reported annual incomes below $20,000.
Characteristics of Respondents in the Real-Time Neighborhoods and Social Life Study (RNSLS), 2014 (n = 61).
The study utilized smartphone-based data collection over the course of one week to capture respondents’ activity spaces, their exposure to particular conditions within residential and extraresidential settings, and fluctuations in physiological symptoms. The study began with an introductory training session on the inaugural Monday of the study week, conducted by the lead author of this study, in collaboration with an instructor from Older Adults Technology Services, a nonprofit organization in New York City that provides technology training programs for older adults. Each respondent was provided with an iPhone 5c to carry for a week. The smartphones enabled GPS tracking of respondents in five-minute intervals and intermittent collection of EMAs.
Ecological Momentary Assessment Collection
EMAs enable repeated collection of individuals’ self-reports of their activities, surroundings, and subjective states—akin to short, momentary surveys (Stone and Shiffman 1994). Whereas early EMA studies used paper diaries, smartphone-based EMA collection allows greater flexibility in timing and reduces recall bias (Trull and Ebner-Priemer 2009). Several recent studies demonstrate the feasibility of implementing smartphone-based EMA collection among older adults, including racial minorities (Fritz et al. 2017) and those with cognitive challenges (Ramsey et al. 2016).
EMAs were collected on the iPhone using Survey Swipe, a smartphone application for mobile survey research developed by Survey Analytics (www.surveyswipe.com). EMA questions appeared as text on the iPhone screen inside the Survey Swipe application, and respondents answered using the touchscreen interface.
Respondents were asked to complete 17 EMAs during the second half of the study week. The EMAs began Wednesday evening, following an afternoon training session. EMAs were then requested at random times within four time windows—morning, early afternoon, late afternoon, and evening—on Thursday, Friday, Saturday, and Sunday. When it was time to take an EMA, respondents were “pinged” via a text message from the RNSLS staff stating, “Please complete your [morning/early afternoon/late afternoon/evening] survey now.” A banner notification on respondents’ lock screens also announced that a new survey was available.
The EMAs included 23 items asking respondents to provide real-time reports about where they were, whom they were with, what they were doing, and how they felt. The respondent’s location at the time of EMA submission was also logged. On average, the EMAs required 4.6 minutes to complete, and the majority of EMAs were completed within 9 minutes of the ping. (The overall average time from ping to completed EMA was 18 minutes.) The EMA response rate reflected a high level of engagement and interest in the study; 98.7% of EMAs were completed within their corresponding time window.
Dependent Variables: Real-Time Pain and Fatigue
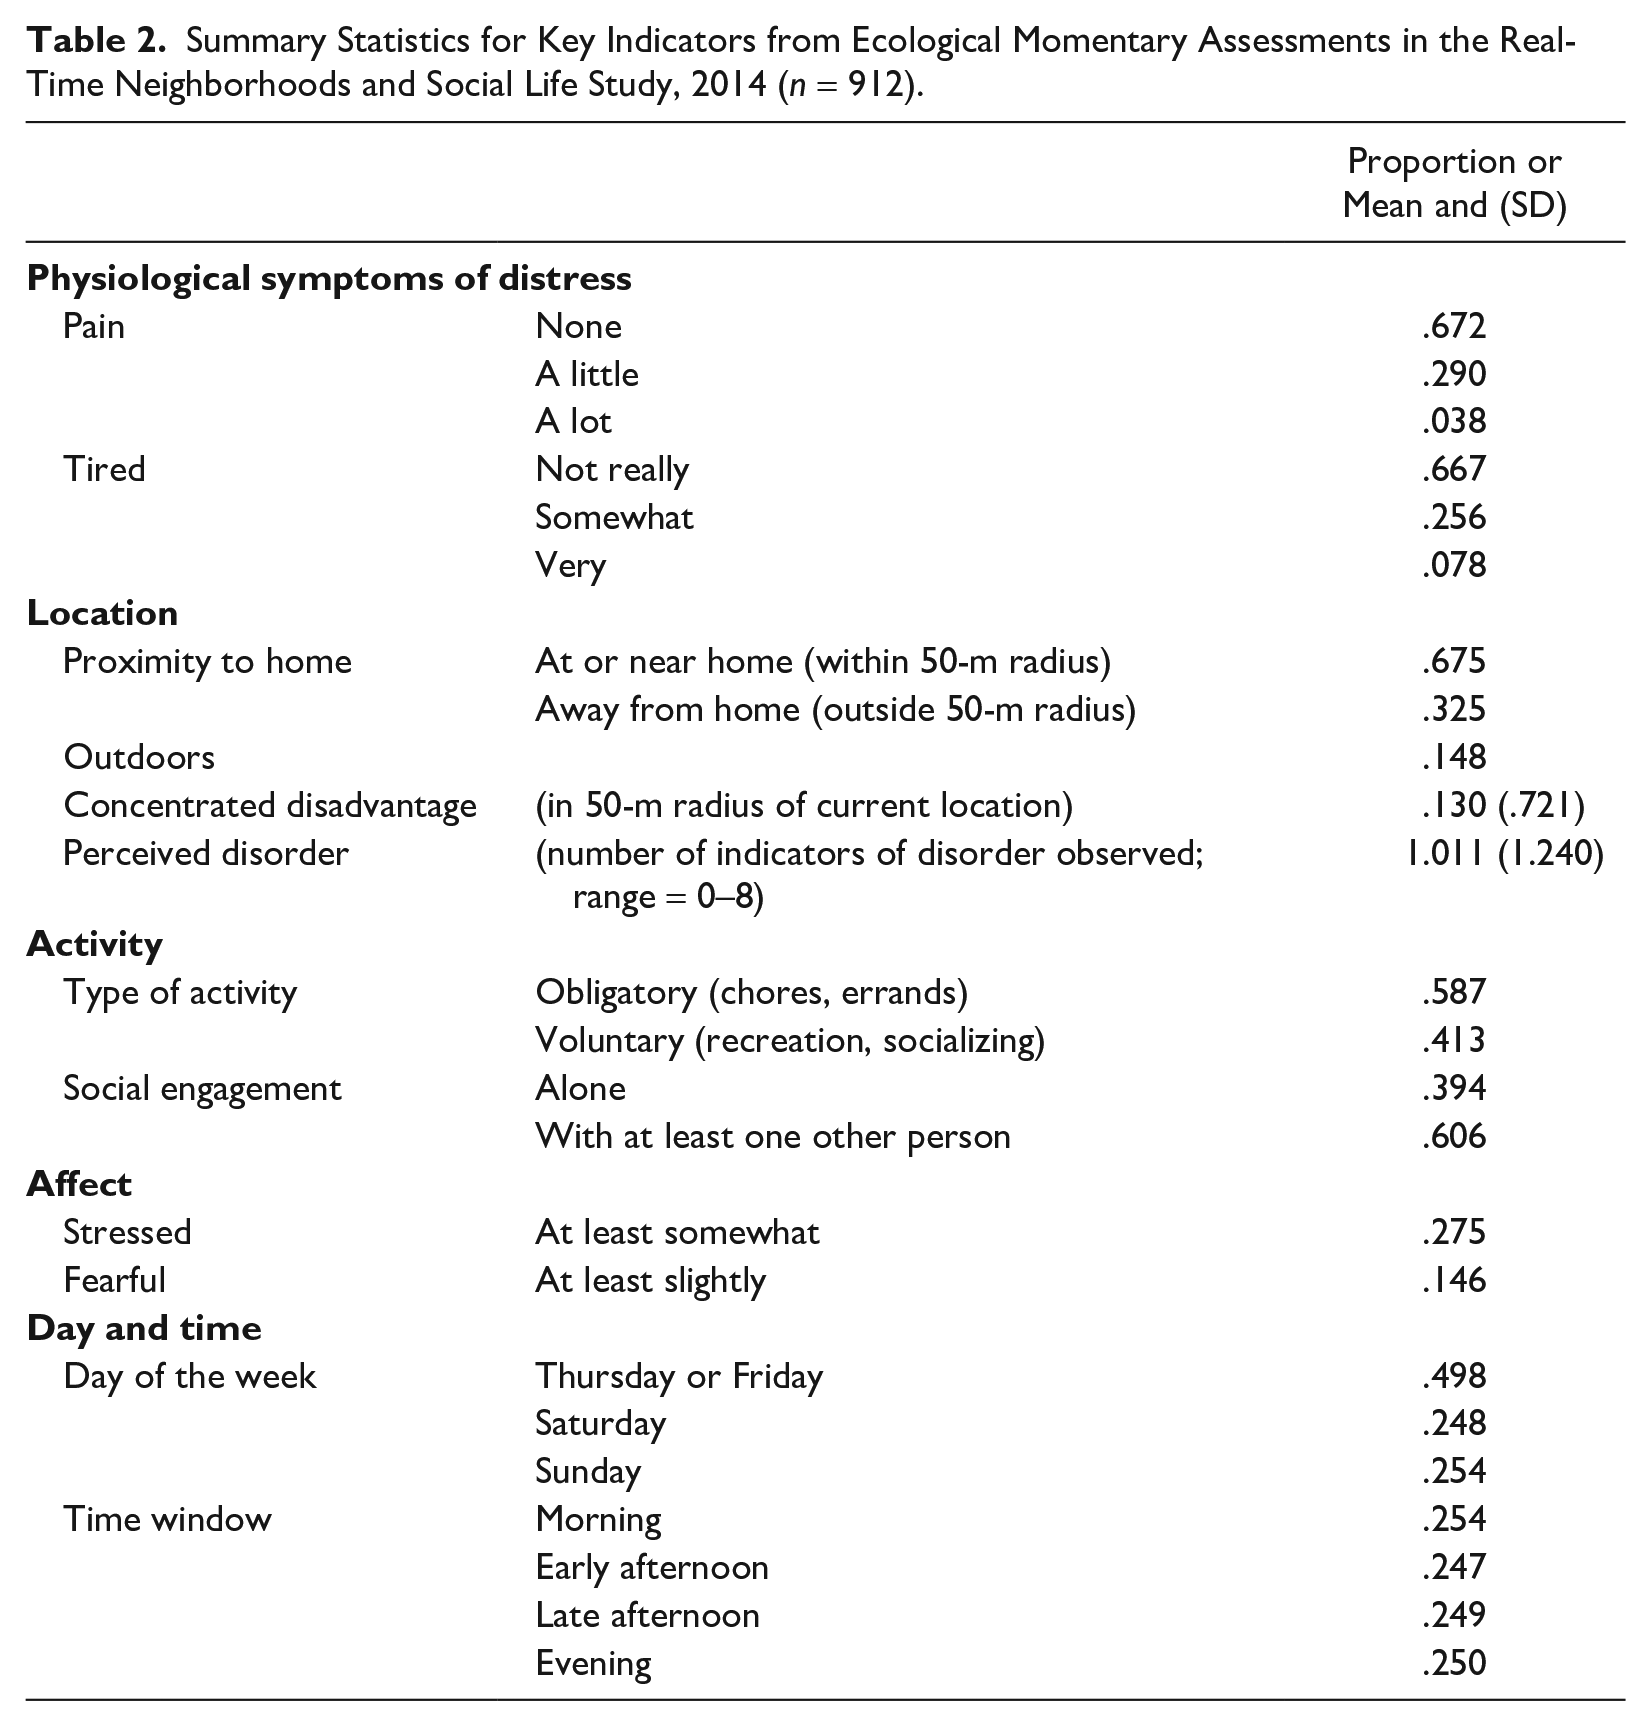
Two items on the EMA captured fluctuations in physiological symptoms of distress. Real-time pain was assessed by asking respondents: “Are you in pain right now?” Responses included 0 = not at all, 1 = a little, and 2 = a lot. To assess real-time fatigue, respondents were asked: “Do you feel tired right now?” Responses included 0 = not at all, 1 = somewhat, and 2 = very. Summary statistics for these and other indicators captured in the EMAs are presented in Table 2. Our analyses focused on whether respondents indicated any pain or any fatigue because respondents rarely indicated that they were experiencing the highest levels of these symptoms.
Summary Statistics for Key Indicators from Ecological Momentary Assessments in the Real-Time Neighborhoods and Social Life Study, 2014 (n = 912).
Characteristics of EMA Locations
We considered three characteristics of the locations where EMAs were completed. First, we identified the level of concentrated disadvantage around each EMA location. To determine this, we calculated concentrated disadvantage scores for each tract in the five counties of New York City as well as tracts in New Jersey that were observed in this data set. Following prior research, concentrated disadvantage was operationalized as a scale combining four tract-level measures from the 2010 to 2014 American Community Survey: (a) the percentage of residents whose incomes were below the poverty line, (b) the percentage of residents who received public assistance, (c) the percentage of residents who were unemployed, and (d) the percentage of residents who did not attend college. These items were highly correlated and loaded on one factor (eigenvalue = 2.06; loadings range = .58–.84), with excellent internal consistency reliability (Cronbach’s α = .76). We calculated factor regression scores for each tract, weighting the four items by their factor loadings using oblique rotation. Scores on the scale are presented in standard deviations, with higher scores indicating greater levels of concentrated disadvantage.
We then delineated 50-m buffers surrounding each EMA location. The 50-m buffers did not perfectly align with census tracts. In fact, they often overlayed multiple tracts; an average of 1.48 tracts were at least partially overlaid by each buffer. We estimated concentrated disadvantage within the EMA location buffers by summing the concentrated disadvantage scores for the tracts included within each buffer, weighted by the proportion of space within the buffer that was covered by each tract.
Second, we considered respondents’ perceptions of disorder in EMA locations. In the EMAs, respondents were asked to indicate which (if any) features of disorder were found in the area around their current location. When respondents indicated that they were indoors (85.81% of observations), they were asked: “If you went outside where you are right now, which of the following are you likely to see on the block?” Respondents who were outdoors while completing the EMA were asked: “Do you see any of the following on the block where you are?” The features of disorder included broken windows, vacant buildings, trash or litter, graffiti, damaged sidewalks, people yelling, people just hanging out, and drug or alcohol use. The disorder score is a count of the number of features of disorder reported in each EMA, ranging from 0 to 8, regardless of whether the respondent was indoors or outdoors. Respondents reported slightly more disorder when they were outdoors (M = 1.01, SD = 1.26) compared to those who were indoors (M = .98, SD = 1.05), but the difference was not statistically significant.
Third, we considered whether the EMA was completed outside of the respondent’s residential area. To assess this, we delineated a 50-m buffer around each respondent’s residence. EMAs located outside of this home buffer are considered to be outside of the respondent’s residential area (= 1). We relied on respondents’ report of their location to classify whether they were outdoors (= 1).
Activities and Affect Reported in EMAs
Additional indicators from EMAs shed light on respondents’ real-time activities and affect, which may be associated with characteristics of the locations they visit and their symptoms of distress. We used two indicators of respondents’ activities that may shape both perceptions of neighborhood disorder and physiological symptoms. First, respondents were asked how many people they were with when they completed the EMA. We differentiated between respondents who were alone (= 1) and those who were with at least one other person. Second, respondents were asked what they were doing when they completed the EMA. We categorized respondents as taking part in an obligatory activity (= 1) if they indicated at least one of the following: doing personal care, receiving health care, providing care for someone else, doing housework or household tasks, shopping or running errands, and working. All other activities, such as eating, walking, reading, relaxing, socializing, participating in a group, volunteering, and sports/recreation, were considered to be voluntary.
We examined two measures of real-time affect. Respondents were asked how stressed they felt at the time of the EMA, ranging from 1 = not at all to 5 = extremely. As shown in Table 2, very few EMAs included reports of the highest levels of stress, so we differentiated between EMAs where respondents did not feel stressed (= 0) and those where respondents reported feeling at least slightly stressed (= 1). The EMAs also asked respondents how safe they felt, with responses ranging from not at all to extremely. In the vast majority of EMAs (85.4%), respondents reported feeling very or extremely safe. We differentiated between these and EMAs that included reports of lower levels of safety—with the latter indicating at least some sense of fear (= 1). For a correlation matrix of all EMA variables, see Appendix Table A in the online version of the article.
Covariates
We controlled for a number of covariates, including the day of the week and time window when the EMA was collected (see Table 2). We also adjusted for respondent characteristics that may be associated with activity spaces and symptoms of distress. We consider the level of concentrated disadvantage within a 50-m buffer surrounding the respondent’s residence, which was calculated using the procedure described previously. We controlled for respondents’ reports of disorder in their residential neighborhoods, as assessed in the baseline survey. Respondents were asked which of eight features of disorder (including vacant buildings, broken windows, trash or litter, graffiti, damaged sidewalks, people yelling, people just hanging out, and drug or alcohol use) are at least somewhat of a problem in their neighborhood. The variable is a count of the number of these features, ranging from 0 to 8. We also adjusted for respondent gender, race and ethnicity, income, and self-rated health, and we controlled for the respondent’s residential neighborhood area within New York City (i.e., East Harlem, Gramercy, north Bedford-Stuyvesant, and south Bedford-Stuyvesant; see Table 1).
Analytic Plan
We used multilevel logistic regression models to estimate the likelihood of reporting pain or fatigue in an EMA observation (Level 1), with EMA observations nested within individual respondents (Level 2). These models adjust standard errors for the clustering of observations within respondents. First, unconditional models (without covariates) decompose the variation in the likelihood of reporting pain or fatigue across EMA observations (t) and respondents (i). These are specified as:

The outcome,
To examine associations between real-time exposure to neighborhood disadvantage and disorder and reports of distress, we fit a series of conditional models with covariates at EMA and respondent levels, as follows:
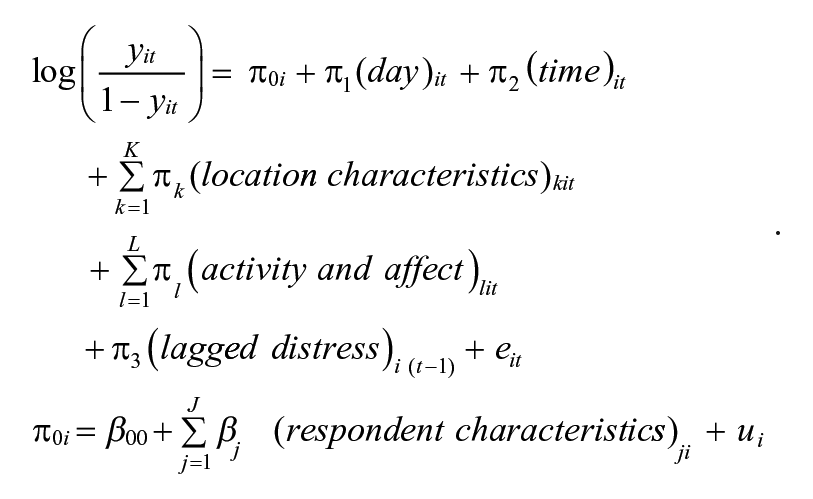
The conditional models first incorporated covariates at Level 2 to examine how the propensity of reporting symptoms of distress varies across a set of respondent characteristics (J). Next, we entered covariates at Level 1, addressing how the propensity of reporting pain or fatigue in a particular EMA varies across the day and time, characteristics of the current location (K), and aspects of the respondent’s current activity and affect (L). In supplemental models, we tested interactions at Level 1 to examine whether exposure to disadvantage and disorder was more strongly associated with symptoms of distress when respondents are: (a) near their residence, (b) outdoors, (c) alone, and (d) completing obligatory activities. All models included a time-lagged indicator of whether pain or fatigue was reported in the prior EMA to account for the nonindependence of observations of distress.
Results
The administration of EMAs at random times within four daily time windows was intended to capture data about a representative sample of respondents’ activity space locations. We first provide some descriptive data to contextualize the EMAs within respondents’ activity spaces. Figure 1 maps respondents’ GPS-tracked locations alongside all of the locations where respondents completed EMAs. The geographic spread of activity spaces appears well represented by EMA locations. Table 3 presents summary statistics for GPS-tracked activity spaces and EMA locations. Respondents were somewhat more likely to complete EMAs when they were near home and within their census tracts, but the subset of locations where EMAs were completed is slightly farther from respondents’ homes than activity space locations. None of these differences is statistically significant. Importantly, activity space and EMA locations are nearly identical in levels of concentrated disadvantage (.146 compared to .141, respectively).
Summary Statistics for Activity Space and Ecological Momentary Assessment (EMA) Locations among Respondents in the Real-Time Neighborhoods and Social Life Study, 2014.
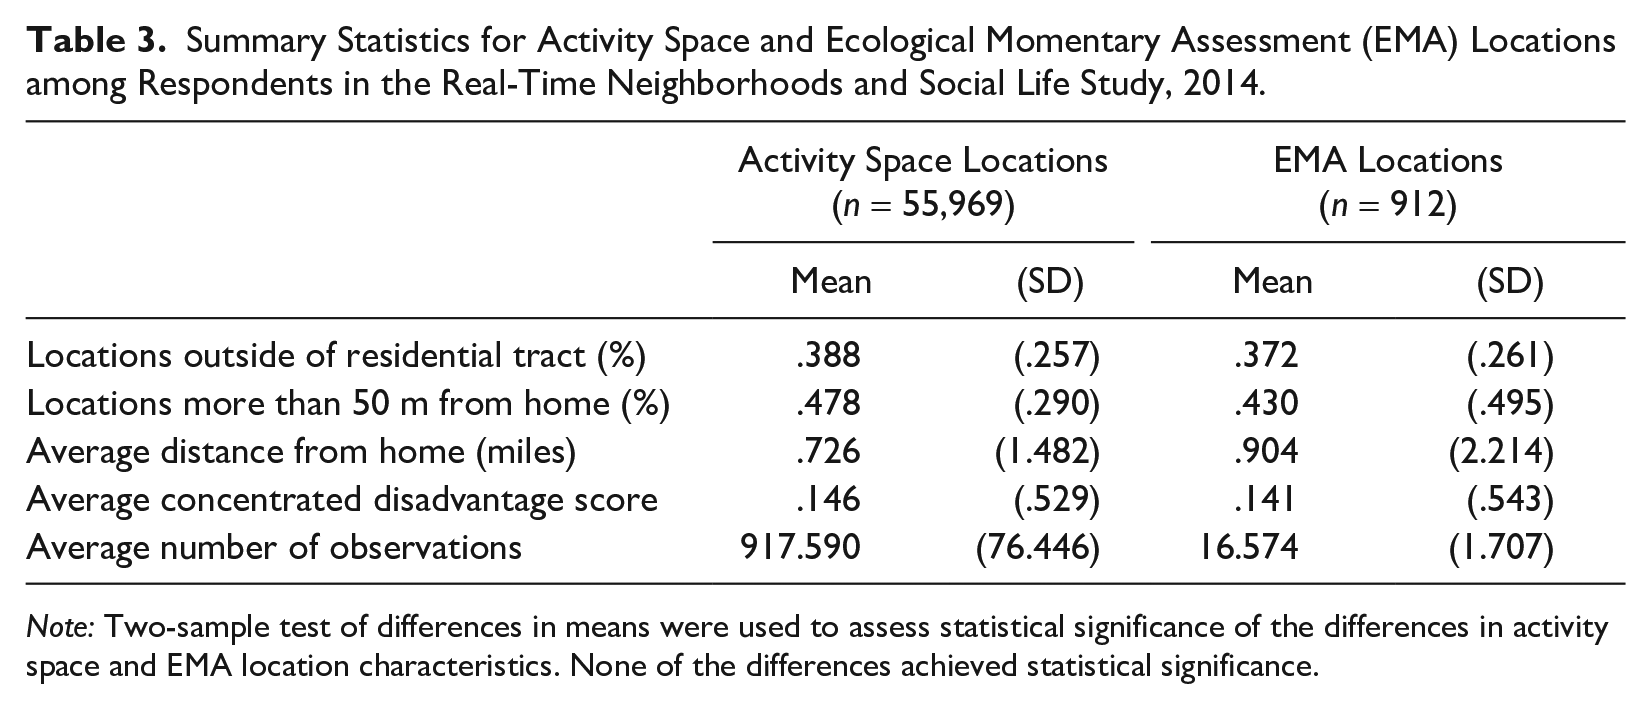
Note: Two-sample test of differences in means were used to assess statistical significance of the differences in activity space and EMA location characteristics. None of the differences achieved statistical significance.
Activity Space Locations (n = 55,561) and Ecological Momentary Assessment (EMA) Locations (n = 921) Observed across All Respondents (n = 61).
Respondent Characteristics and Symptoms of Distress
Table 4 presents two series of multilevel logistic regression models predicting whether the respondent reports pain or fatigue in each EMA. Unconditional models (not shown) decompose variance in symptoms across the two levels of analysis. Results indicate that most of the variance in EMA reports of pain and fatigue occurs at the respondent level (87.5% and 56.1%, respectively). Importantly, about 12.5% of the variance in pain and 43.9% of the variance in fatigue occurs at the EMA level. This within-respondent heterogeneity in momentary experiences of pain and fatigue may be attributable to differences in local conditions.
Log-Odds from Logistic Regression Models Predicting Whether Respondents Experience Pain or Fatigue.
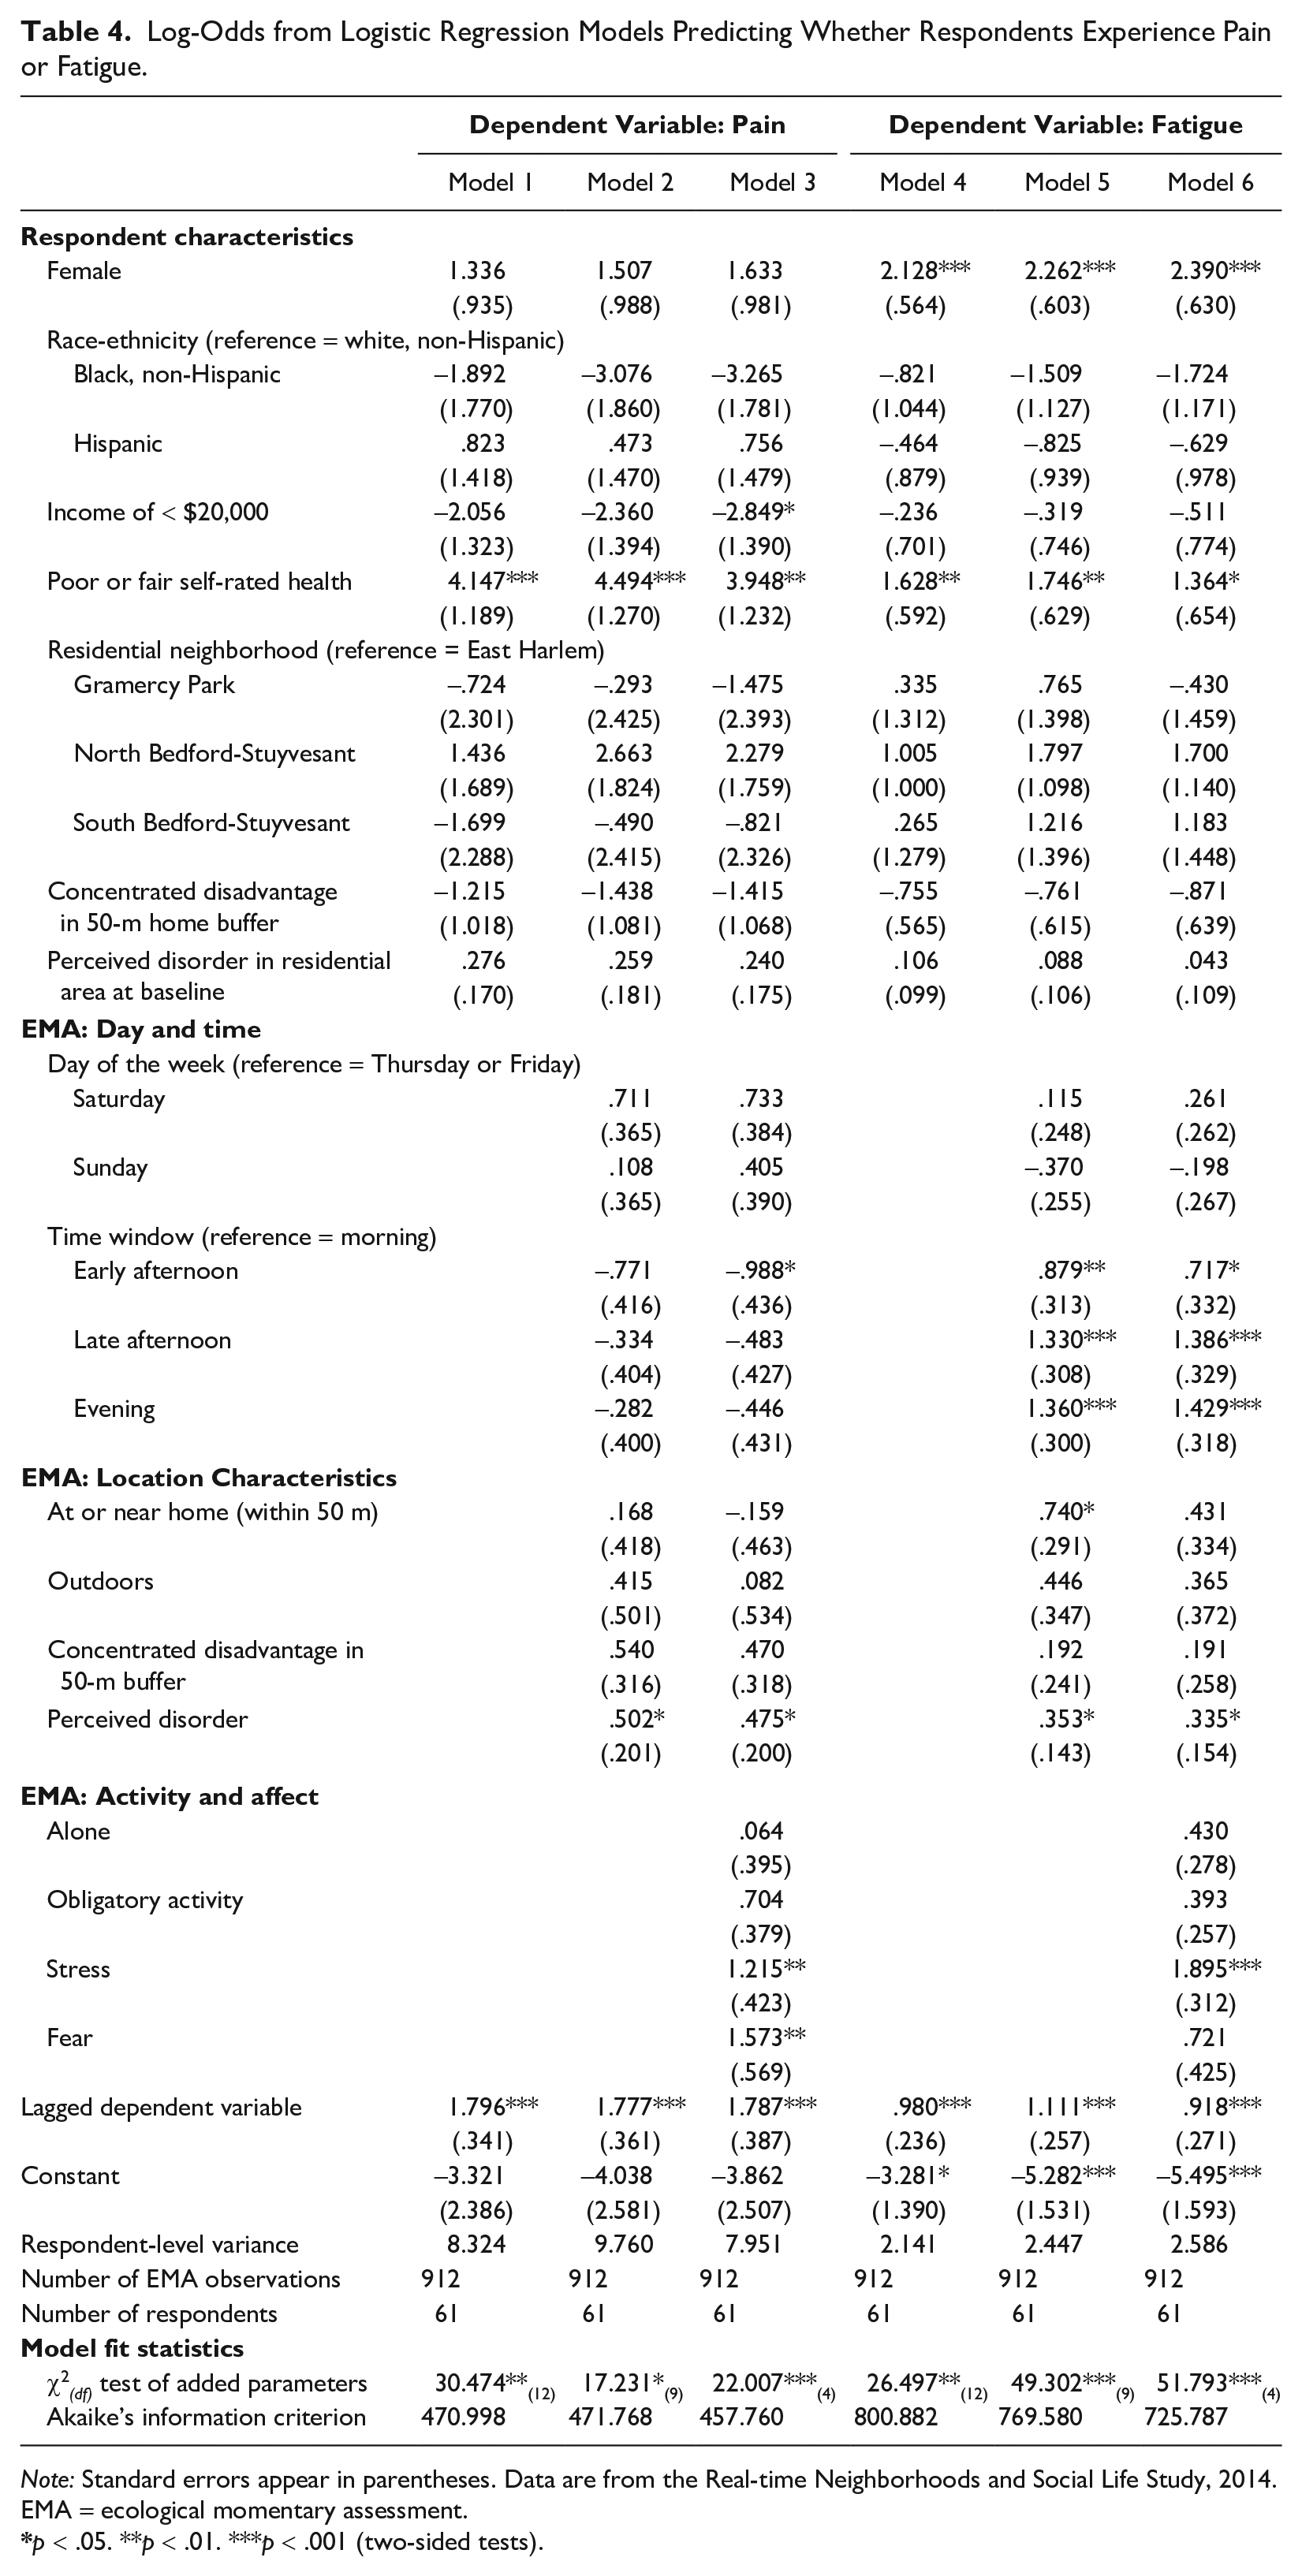
Note: Standard errors appear in parentheses. Data are from the Real-time Neighborhoods and Social Life Study, 2014. EMA = ecological momentary assessment.
p < .05. **p < .01. ***p < .001 (two-sided tests).
Models 1 and 4 in Table 4 include several respondent characteristics that, together, account for about 71.7% of the respondent-level variance in EMA reports of pain and about 39.4% of the respondent-level variance in EMA reports of fatigue. For ease of discussion, we convert log-odds to predicted probabilities, holding all other variables at their means. Overall, women are more likely than men to report symptoms of distress. Based on Model 1, women’s predicted probability of reporting pain is .315, compared to .198 among men, although this difference is not statistically significant. In Model 4, women are significantly more likely to report fatigue, with predicted probability of .405, compared to .120 among men (p < .001).
We do not observe any racial or ethnic differences in odds of reporting pain or fatigue. Older adults with incomes below $20,000 are approximately half as likely to report pain compared to those with higher incomes (probabilities of .194 for those with lower income compared to .384 among those with higher incomes). This difference achieves only marginal significance (p = .091), however, and we do not observe any notable income differences in reports of fatigue. (In supplemental models, we also included respondent education, but it is not significantly associated with pain or fatigue, and its inclusion did not change the results presented here.) Respondents who have poor or fair health have a .622 probability of reporting pain and a .510 probability of reporting fatigue on EMAs compared to probabilities of .180 and .244, respectively, among those with good or better health (p < .001 in Models 1 and 4).
Importantly, there is no evidence that the likelihood of reporting pain or fatigue varies by respondent’s residential area, the level of concentrated disadvantage in a 50-m buffer surrounding the respondent’s home, or perceived disorder in the respondent’s residential area. It is worth noting that disadvantage and disorder in the residential area are significantly higher among those with incomes below $20,000 compared to those with higher incomes (.358 vs. .038 for concentrated disadvantage and 3.895 vs. 3.505 for perceived disorder). However, even in supplemental models excluding respondent income, residential disadvantage and disorder are not significantly associated with real-time reports of pain or fatigue.
Social Environment and Symptoms of Distress
Models 2 and 5 incorporate characteristics of the locations where the EMAs were completed. Respondents were no more likely to report feeling pain when they were at or near their home (compared to being farther away) or when they were outdoors (compared to being indoors). Based on results in Model 5, respondents have a higher probability of reporting fatigue when they are at home (.321) compared to when they are away from home (.218), and the difference is statistically significant (p < .05). The likelihood of reporting fatigue does not vary across outdoor or indoor locations.
Indicators of concentrated disadvantage and disorder in the immediate location test our primary research question—whether older adults are more likely to report symptoms of distress when they are located in areas characterized by socioeconomic disadvantage or disorder. As shown in Model 2, a one standard deviation increase in concentrated disadvantage in the 50-m buffer around the EMA location is associated with about 72% higher odds of reporting pain (exp(.540) = 1.716). This association is marginally significant (p = .087), but the trend is worth noting given that it is observed net of three other indicators that may proxy exposure to socioeconomic disadvantage: the respondent’s own income level, the level of concentrated disadvantage within 50 m of the respondent’s residence, and the respondent’s residential neighborhood area (i.e., East Harlem, Gramercy, and Bedford-Stuyvesant). Concentrated disadvantage in the EMA location is not associated with the likelihood of reporting fatigue (b = .192; p = .426 in Model 5). Excluding real-time disorder from these models does not appreciably change the coefficients for concentrated disadvantage.
Models 2 and 5 also incorporate perceived disorder, or the number of indicators of disorder that respondents reported in the EMA. When respondents observe more disorder, they are significantly more likely to report pain (b = .502, p < .05 in Model 2), and they are significantly more likely to report feeling tired (b = .353, p < .05 in Model 5). Each additional reported indicator of disorder is associated with 65.2% greater odds of experiencing pain (exp(.502) = 1.652) and 42.3% higher odds of experiencing fatigue (exp(.353) = 1.423).
It is important to note that the associations between disorder and physiological symptoms are observed regardless of the level of concentrated disadvantage in the immediate area, whether the respondent is at or near home, and whether the respondent is outdoors. We have also conducted supplemental analyses incorporating cumulative exposure to disorder across the EMAs. We do not find any evidence that repeated exposure to disorder during the study period has an independent association with symptoms of distress or that it modifies the association between real-time disorder and distress.
The Role of Real-Time Activities, Stress, and Fear
Models 3 and 6 test several variables that may confound the relationship between real-time exposure to disorder and physiological symptoms of distress. First, being alone is not significantly associated with reports of either pain or fatigue. We find marginally significant associations between obligatory activities (e.g., providing care, running errands, working) and reports of pain (b = .704, p = .063). However, perceived disorder remains significantly associated with both pain (b = .475, p < 0.05 in Model 3) and fatigue (b = .335, p < .05 in Model 6).
Second, we examine the role of real-time affect. Stress has a particularly strong association with pain (b = 1.215, p < .01 in Model 3) and fatigue (b = 1.895, p < .001 in Model 6). Older adults who reported feeling some degree of fear in their current location were also significantly more likely to report feeling pain (b = 1.573, p < .01 in Model 3) and marginally more likely to report feeling fatigue (b = .721, p = .090 in Model 6). Importantly, accounting for fear and stress does not explain the relationship between disorder and distress.
Finally, we consider whether the association between perceived disorder and symptoms of distress is conditioned by location or activities. Results are presented in Appendix Tables B and C in the online version of the article. Interaction terms indicate that the association between disorder and distress does not differ based on whether the respondent is doing an obligatory (rather than voluntary) activity (b = .025, p = .934 for pain and b = .097, p = .677 for fatigue), whether the respondent is alone (b = –.195, p = .567 for pain and b = .119, p = .630 for fatigue), or whether the respondent’s location is near or away from home (b = .242, p = .453 for pain and b = .369, p = .118 for fatigue). The association between disorder and pain is also not conditioned by whether the respondent is outdoors (b = .344, p = .332). However, we find that the association between perceived disorder and fatigue is stronger when respondents are outdoors compared to when they are indoors (b = .613, p < .05).
Figures 2 and 3 summarize our key findings by depicting how real-time observations of disorder in activity space are associated with symptoms of distress. These figures present predicted probabilities of reporting pain and fatigue, calculated from Model 4 in Appendix Tables B and C in the online version of the article, with covariates held constant at their means. We truncate the original range of the disorder variable (0–8) in the figures because very few EMAs (n = 15) contained observations of more than five features of disorder.
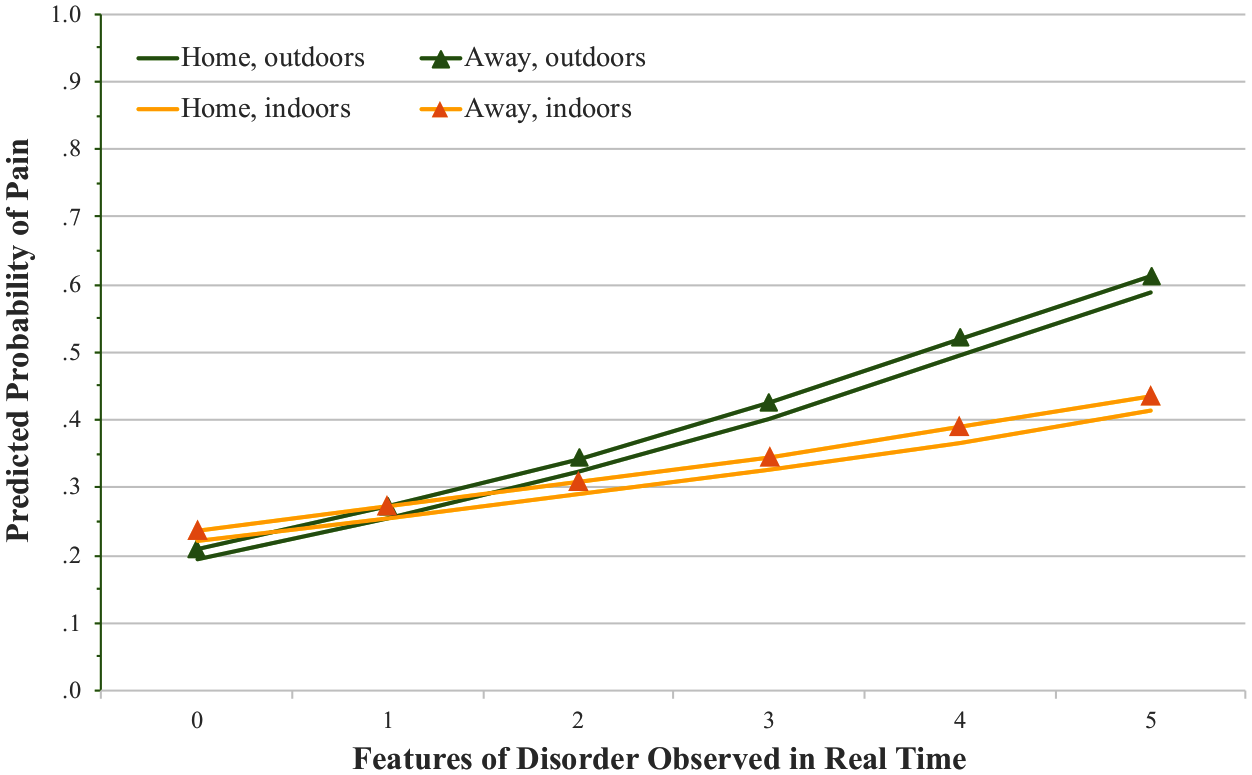
Disorder and Pain in Real Time, by Type of Location.
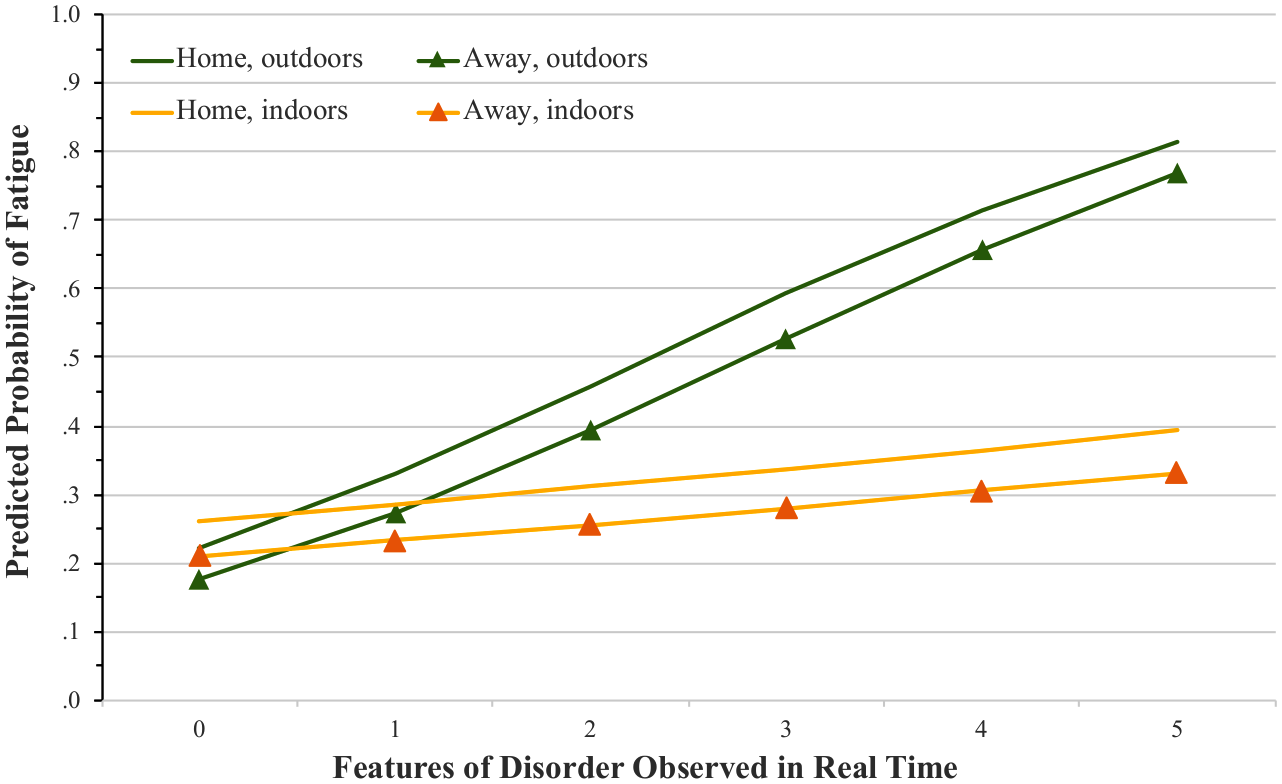
Disorder and Fatigue in Real Time, by Type of Location.
Figure 2 plots predicted probabilities of reporting pain when respondents are at or near home (within 50 m), away from home, indoors, and outdoors. For older adults who are at home and indoors, the probability of reporting pain increases from .221, with no disorder, to .413 when five indicators of disorder are observed. The increase in the probability of reporting pain appears steeper when older adults are outdoors, although the interaction is not significant. For example, when older adults are outdoors and away from home, predicted probabilities of pain increase from .209 to .611 across the range of disorder. Overall, this figure highlights that when older adults observe more disorder in their environment, they are more likely to report pain regardless of whether they are near or away from home, indoors or outdoors.
Older adults who observe more disorder in their environments are also more likely to report feeling fatigued, as shown in Figure 3. When respondents are indoors, this association is modest. Across the levels of disorder, predicted probabilities of fatigue increase from .261 to .393 for those who are home and indoors and from .211 to .332 for those who are away from home and indoors. The increase in risk of fatigue is more perceptible when older adults are outdoors. Predicted probabilities of fatigue increase from .176 to .769 across the range of disorder—a more than four-fold increase—when older adults are away from home and outdoors. A similar increase in the probability of reporting fatigue is observed when older adults are home and outdoors (from .221 to .815). The statistically significant interaction suggests that exposure to high levels of disorder in outdoor settings is especially fatiguing for older adults.
Discussion
This study expands research on neighborhoods and health by looking beyond individuals’ residential neighborhoods to consider the health implications of activity spaces. Using smartphone and GPS technology, we find evidence that instantaneous exposure to disorder in the immediate environment is associated with spikes in symptoms of distress such as pain and fatigue. This contributes to the rapidly expanding sociological literature on activity spaces (Cagney, et al. 2020) by providing further evidence that conditions of these spaces matter. As older adults move through the city, encountering features like broken windows, abandoned buildings, and litter can bring on or exacerbate physiological symptoms. The association between disorder and distress, particularly fatigue, is strongest when older adults are outdoors.
Linkages between residential disadvantage and disorder and negative health outcomes are often attributed to the idea that repeated or chronic exposure to blight, decaying infrastructure, and high rates of crime or deviance are challenging and stressful for residents (Aneshensel 2010; Boardman 2004; Diez Roux and Mair 2010; Schieman and Meersman 2004). We find support for this general idea in that real-time observations of disorder in the immediate context are associated with instantaneous spikes in symptoms of distress both within and outside of the residential neighborhood. However, real-time associations are not explained by cumulative exposure to disorder over the long term, in one’s residential neighborhood, or over the prior days of the study. These findings emphasize the real-time nature of the association between activity space disorder and symptoms of distress. Future research should examine how exposure to these conditions may underlie deleterious long-term health outcomes found in prior research.
One possible explanation for the association between disorder and symptoms of distress is that the observation of disorder may elicit stress or fear, leading to a physiological stress response and accompanying symptoms of distress (Nixon et al. 2011; Schieman and Meersman 2004). However, we do not find evidence that stress and fear mediate the association between perceived disorder and symptoms of distress. This may reflect a methodological limitation; our question about self-reported stress may be too general or may not elicit stress related to respondents’ appraisals of their real-time environments (Pearlin 1989). Prior work also points to complexities in the association between perceived stress and physiological response (see e.g., Goldman et al. 2005). Refining methods for real-time measurement of stress, through self-report or mobile sensing technologies, is a critical next step for examining the process through which activity spaces affect health.
Apart from the stress response, spikes in pain and fatigue may reflect that navigating disordered spaces is challenging for older adults. Seen through the lens of the classic ecological model of aging, the environmental “press” or demands of disordered areas may overtax older adults’ physical or cognitive capacities and induce symptoms such as pain and fatigue (see Lawton and Nahemow 1973; Wahl et al. 2012). Safely traversing areas with cracked sidewalks, abandoned or dilapidated buildings, poor lighting, and litter can require extra effort. This may lead to an increase in pain, for example, because older adults must physically adapt to uneven sidewalks. Indeed, we found that the association between disorder and fatigue is stronger when older adults are outdoors and, presumably, directly confronting disordered conditions.
An important question is whether coping with disordered conditions may be especially challenging for some older adults—particularly those who already suffer functional limitations or lack coping resources due to personal disadvantages (Aneshensel 2010; Wheaton and Clarke 2003). For example, extensive research documents that black and low-income older adults tend to reside in more disadvantaged neighborhoods (e.g., South et al. 2016) and may be exposed to more structurally disadvantaged activity spaces (Jones and Pebley 2014; Krivo et al. 2013; York Cornwell and Cagney 2017). Black and lower income older adults also experience worse health along many dimensions, including pain and fatigue, compared to their white and higher income counterparts (Janevic et al. 2017), which may make them more vulnerable to conditions such as disorder. In supplemental analyses, we explored whether the link between disorder and distress is stronger among black or lower-income older adults. Interaction terms crossing race-ethnicity or income with instantaneous disorder were not significantly associated with pain or fatigue. However, it is important to note that our analytic power to detect differences in the association between disorder and distress across social groups is limited due to the small sample size. We urge further research to explore how vulnerability to activity spaces is socially structured and how this may undergird persistent disparities in health outcomes.
The present study shows the promise of smartphone-based location tracking to identify individuals’ activity spaces, coupled with the collection of EMAs, which shed light on how individuals perceive and respond to the social contexts of daily life. Theory and method are evolving together as new approaches reveal dynamics that have previously been understudied. For example, although the present study attends to heterogeneity in older adults’ spatial exposures, it raises new questions about temporal aspects of exposures such as how long older adults spend in disordered spaces and how often they visit these spaces (see e.g., Kwan 2012). Four days of EMA collection also restricts our ability to assess routine activities that occur over longer time periods, such as weeks or months. From a methodological standpoint, the limited duration of the study also makes the data vulnerable to participants’ efforts to change their behavior—perhaps avoiding certain locations—during the study period. Studies with longer or repeated periods of observation would guard against this. They would also enable researchers to consider how exposure to disorder may pile up over time, and permit examination of how symptoms of distress affect subsequent mobility, social engagement, and mental and physical health.
Studies of neighborhood effects on health are often criticized for their lack of attention to individuals’ selection into residential neighborhoods. Activity spaces may also reflect individuals’ selectivity in choices about routes they take and spaces they visit or avoid within the city (Chaix et al. 2013). An important question relates to the extent to which individuals have agency in delineating their activity spaces and how the ability to do so is socially structured. Future work that uses smartphones or similar technologies to track activity spaces could capitalize on exogenous barriers that emerge within respondents’ activity space (e.g., road closure, heavy foot traffic, presence of police or emergency services) to help address issues of selection.
Several additional methodological limitations are worth noting, including the potential lack of generalizability of the study. The small, nonprobabilistic sample is majority black, non-Hispanic (54%) and includes a large portion of low-income older adults (44%). We did not find racial-ethnic differences in reports of pain or fatigue, but the demographic composition of our sample may have increased the likelihood of observations of disorder and reports of pain and fatigue. Furthermore, our results may be unique to the dense, urban context of New York City, where few individuals own cars and walking and public transportation are predominant. For these reasons, our findings cannot be generalized to the broader population of older adults in the United States, and our statistical tests may be biased due to the nonrandomness of our sample. Future research that relies on representative samples across different locations would be better positioned to make inferences to the older adult population in the United States.
Second, the clustering of respondents within residential neighborhoods leads to the potential for autocorrelation within sample clusters. Because only four residential neighborhood areas are included in this study, we are limited in our ability to assess how resources and demands within the residential neighborhood may structure activity spaces or condition older adults’ responses to socioeconomic disadvantage and disorder in extraresidential locations. Larger, representative, and clustered samples would enable the use of more advanced statistical approaches to evaluate individual- and neighborhood-level variation in the link between activity space and health.
Third, perceptions of disorder involve some level of subjectivity, which may introduce endogeneity into our models. Our finding that disorder is associated with distress even after accounting for socioeconomic disadvantage lends confidence that disorder is not simply a proxy for poverty. However, an important consideration is whether older adults experiencing pain or fatigue may feel particularly vulnerable to their surrounding environments, leading them to perceive more disorder than those who are not suffering any symptoms of distress. The time-lagged pain/fatigue variable helps to attenuate this bias, but we cannot rule it out. Furthermore, older adults may have a wide range of affective, symptomatic, and psychosocial responses to the observation of disorder, contingent on their past experiences, residential context, or other real-time circumstances such as the extent to which the location is unfamiliar or unavoidable (see Sampson 2012). More research is needed to unpack heterogeneity in perceptions of activity spaces.
Methods for smartphone-based data collection are still in development, but they have the potential to provide unprecedented access to individuals as they go about their daily lives. We find that the observation of disorder in the immediate environment—within or outside of the residential context—is associated with real-time symptoms of pain and fatigue. Although the method is new, the insights build from classic ecological theories in gerontology as well as urban sociological theories that problematized how individuals respond to or cope with the diverse social environments encountered during daily life in urban settings (e.g., Park 1915; Simmel [1903] 1971). These theories have inspired a large body of research that yields valuable insights about the role of residential neighborhoods in shaping individual outcomes like health (Sampson 2012). The present study and future work using smartphone-based methods represent new opportunities to engage the inherently dynamic assumptions of earlier accounts of urban mobility and to consider the health implications of exposure to a range of residential and extraresidential contexts.
Supplemental Material
sj-zip-1-hsb-10.1177_0022146520967660 – Supplemental material for Neighborhood Disorder and Distress in Real Time: Evidence from a Smartphone-Based Study of Older Adults
Supplemental material, sj-zip-1-hsb-10.1177_0022146520967660 for Neighborhood Disorder and Distress in Real Time: Evidence from a Smartphone-Based Study of Older Adults by Erin York Cornwell and Alyssa W. Goldman in Journal of Health and Social Behavior
Footnotes
Acknowledgements
We acknowledge comments and suggestions on earlier drafts from Christopher Browning, Kathleen Cagney, Benjamin Cornwell, Stephen Mooney, Andrew Rundle, and Julien Teitler. We thank Older Adults Technology Services and Alex Glazebrook for assistance with technology training sessions and data collection. George Berry and Alex Currit also provided valuable research assistance.
Funding
The authors disclosed receipt of the following financial support for the research, authorship, and/or publication of this article: Funding for this work was provided by the National Institute on Aging (1R01AG050605), the Cornell University Center for the Study of Inequality, Cornell Population Center, and the Cornell Institute for the Social Sciences.
Author Biographies
References
Supplementary Material
Please find the following supplemental material available below.
For Open Access articles published under a Creative Commons License, all supplemental material carries the same license as the article it is associated with.
For non-Open Access articles published, all supplemental material carries a non-exclusive license, and permission requests for re-use of supplemental material or any part of supplemental material shall be sent directly to the copyright owner as specified in the copyright notice associated with the article.