
Abstract
Because of the Flynn effect, IQ scores rise as a test norm ages but drop on the introduction of a newly revised test norm. The purpose of the current study was to determine the impact of the Flynn effect on learning disability (LD) diagnoses, the most prevalent special education diagnosis in the United States. Using a longitudinal sample of 875 school children who were initially diagnosed with LD on the Wechsler Intelligence Scale for Children–Revised (WISC-R), children experienced a significant decline in IQ when retested on the third edition of the WISC (WISC-III) compared to peers who were tested on the WISC-R twice. Furthermore, results from logistic regression analyses revealed that the probability of a rediagnosis of LD on reevaluation significantly decreased, in part, because of this decline on the WISC-III. These results are discussed in terms of their implications for both basic research and educational policy.
Accounting for 45% of all special education diagnoses, specific learning disability (LD) is the most prevalent special education category in America. More than two and a half million children are diagnosed with, and are receiving services for, LD each year within the public schools (Data Accountability Center, 2007).
The requirements for the special education diagnosis of LD are different from the clinical criteria outlined by the Diagnostic and Statistical Manual of Mental Disorders (DSM-IV; American Psychiatric Association, 1994). The DSM-IV relies heavily on the discrepancy model, where an individual must receive a significantly lower score on a standardized achievement test of reading, math, and/or written expression, compared to his or her measured intelligence (American Psychiatric Association, 1994). In contrast, however, the criteria for LD within special education are outlined by the Code of Federal Regulations (CFR; 34 CFR §300.8(c)(10)), in which LD is defined as a disorder in at least one of the basic phonological processes that are fundamental in language. Moreover, these deficits must have a significant, negative impact on the child’s academic performance and cannot be the result of mental retardation (MR), emotional disturbance, visual, speech, or motor impairments, or socioeconomic disadvantages.
Originally, the CFR used to require the discrepancy model until the 2004 reauthorization of the Individuals with Disabilities Act (IDEA; Education for All Handicapped Children Act, 1975). In its place, response to intervention (RTI), where a child’s response to research-based interventions can be used as part of the diagnostic assessment, was introduced. The discrepancy model, however, is still recommended by many school psychologists and is frequently implemented as part of the evaluation process (Fletcher & Vaughn, 2009).
Even without the explicit use of the discrepancy model, IQ tests play a fundamental role in the LD diagnosis. This is because a measure of general cognitive ability is required in the initial evaluations for all 13 disability categories outlined by IDEA, including LD. If diagnosed, children are required to be reevaluated at least every 3 years to determine if they are still eligible for the same services, where an IQ test is often required at these reevaluations. Because of these required triennial reevaluations, children who are diagnosed with a special education identification are repeatedly tested throughout their school years. The presence of the Flynn effect, however, makes the heavy reliance on longitudinal IQ testing in special education diagnoses problematic (Kanaya & Ceci, 2007; Kanaya, Scullin, & Ceci, 2003).
The Flynn effect refers to the systematic rise in IQ seen throughout the world; it has been estimated to be approximately 0.3 points a year, for a total gain of 3 points per decade, on the Wechsler and Stanford-Binet norms in America (Flynn, 1984, 1987, 2007). Because of the Flynn effect, over time a larger percentage of the population scores above the mean of 100 points. Therefore, the IQ test companies publish new norms that reset the inflated mean back to 100 points, and individuals receive significantly lower scores on the new norm compared to the same performance on the old norm.
This rise-and-fall pattern seen in IQ because of the Flynn effect and renormed tests can compromise the reliability of special education categories that heavily rely on IQ. For example, an IQ of 70 or less is often required for the diagnosis of MR (American Association of Mental Retardation, 2002; American Psychiatric Association, 1996; CFR). Because of this cutoff score and the repeated testings that are required through IDEA, Kanaya, Scullin et al. (2003) found that children at the cusp of the MR cutoff score of 70 points lost approximately 5 IQ points when they were originally tested on the Wechsler Intelligence Scale for Children–Revised (WISC-R) but retested on the third edition of the WISC (WISC-III). This 5-point drop resulted in a significant increase in MR diagnoses, as more children who previously scored above the cutoff score suddenly scored below it on the introduction of the new WISC-III norms and consequently qualified for an MR diagnosis. In contrast, children who were tested and retested on the same WISC-R did not experience a significant change in IQ or MR diagnoses on retesting.
The Flynn effect has also been documented in children diagnosed with LD. Specifically, Truscott and Frank (2001) found that children who were diagnosed with LD on the WISC-R lost, on average, approximately 5 points when retested on the WISC-III in a sample of 171 school children. Interestingly, in their sample of LD children tested and retested on the WISC-III, there was an average drop of approximately 2 points rather than the slight rise that characterizes the Flynn effect. In another study, children diagnosed with LD on the WISC-R lost approximately 7.5 points when retested on the WISC-III (Sanborn, Truscott, Phelps, & McDougal, 2003). There were no significant differences, however, in their achievement test scores when initially tested on an old norm (the Woodcock–Johnson Cognitive Ability–Revised) but retested on a new norm (Woodcock–Johnson Cognitive Ability–III). In other words, they experienced a significant decline on IQ but not on standardized achievement tests. This study replicated previous findings from Gaskill and Brantley (1996), who conducted similar analyses on a sample of 224 school children diagnosed with LD, although their achievement data were based on the Woodcock–Johnson–Revised and the Wechsler Individual Achievement Test.
Taken together, these findings strongly suggest that the Flynn effect will have a significant impact on LD diagnosis. More specifically, the introduction of a new norm would result in a decrease in LD diagnosis for two reasons: (a) the sudden drop in IQ can eliminate any previous discrepancy between a child’s IQ and achievement scores and (b) the sudden increase in MR diagnoses seen on the introduction of a new norm would reduce the number of children eligible for LD.
Despite the immediate implications of these findings, no study has directly examined the impact of the Flynn effect on actual LD diagnoses. Furthermore, the aforementioned studies on the Flynn effect on LD children were conducted on small samples gathered from New York and North Carolina. Given the variability in LD diagnostic criteria from one school district to another (Reschly & Hosp, 2004), it is unknown if these findings can be generalized beyond this geographical context. Therefore, the purpose of the present study is to replicate the aforementioned work using a more geographically diverse sample of LD children as well as to examine the impact of the Flynn effect (if any) on actual LD diagnoses on reevaluation.
Method
IQ records from 875 school children who were diagnosed on the WISC-R and later reevaluated on the WISC-R or WISC-III (usually because of their mandatory triennial reevaluations) were collected and divided into two testing groups based on their testing combination: (a) R-R, children who were tested on the WISC-R both times (n = 575), and (b) R-III, children who were tested on the WISC-R the first time and on the WISC-III the second time (n = 300). Testing dates ranged from 1974 to 2000. These data were extracted from a larger data set containing more than 11,000 special education assessments collected from 10 different school districts across the United States. They represent a diverse sample of geographical regions (e.g., Midwest, Southeast, West, South) and include rural, urban, and suburban school districts.
Analyses and Results
The test–retest correlation for the entire sample was statistically significant (r = .74, p < .001). Difference scores (D-scores) between full IQ at Time 1 and Time 2 were calculated for both groups. The average age of the participants (in years) and the average time between testing (in months) were also calculated (see Table 1). Similar to previous studies on LD children (Truscott & Frank, 2001), but unlike studies on other populations (e.g., Flynn, 2007; Kanaya, Scullin et al., 2003), participants experienced a decline in IQ when tested and retested on the WISC-R. When tested on the WISC-R but retested on the WISC-III, however, participants experienced a larger decline.
Means (and SDs) of Sample
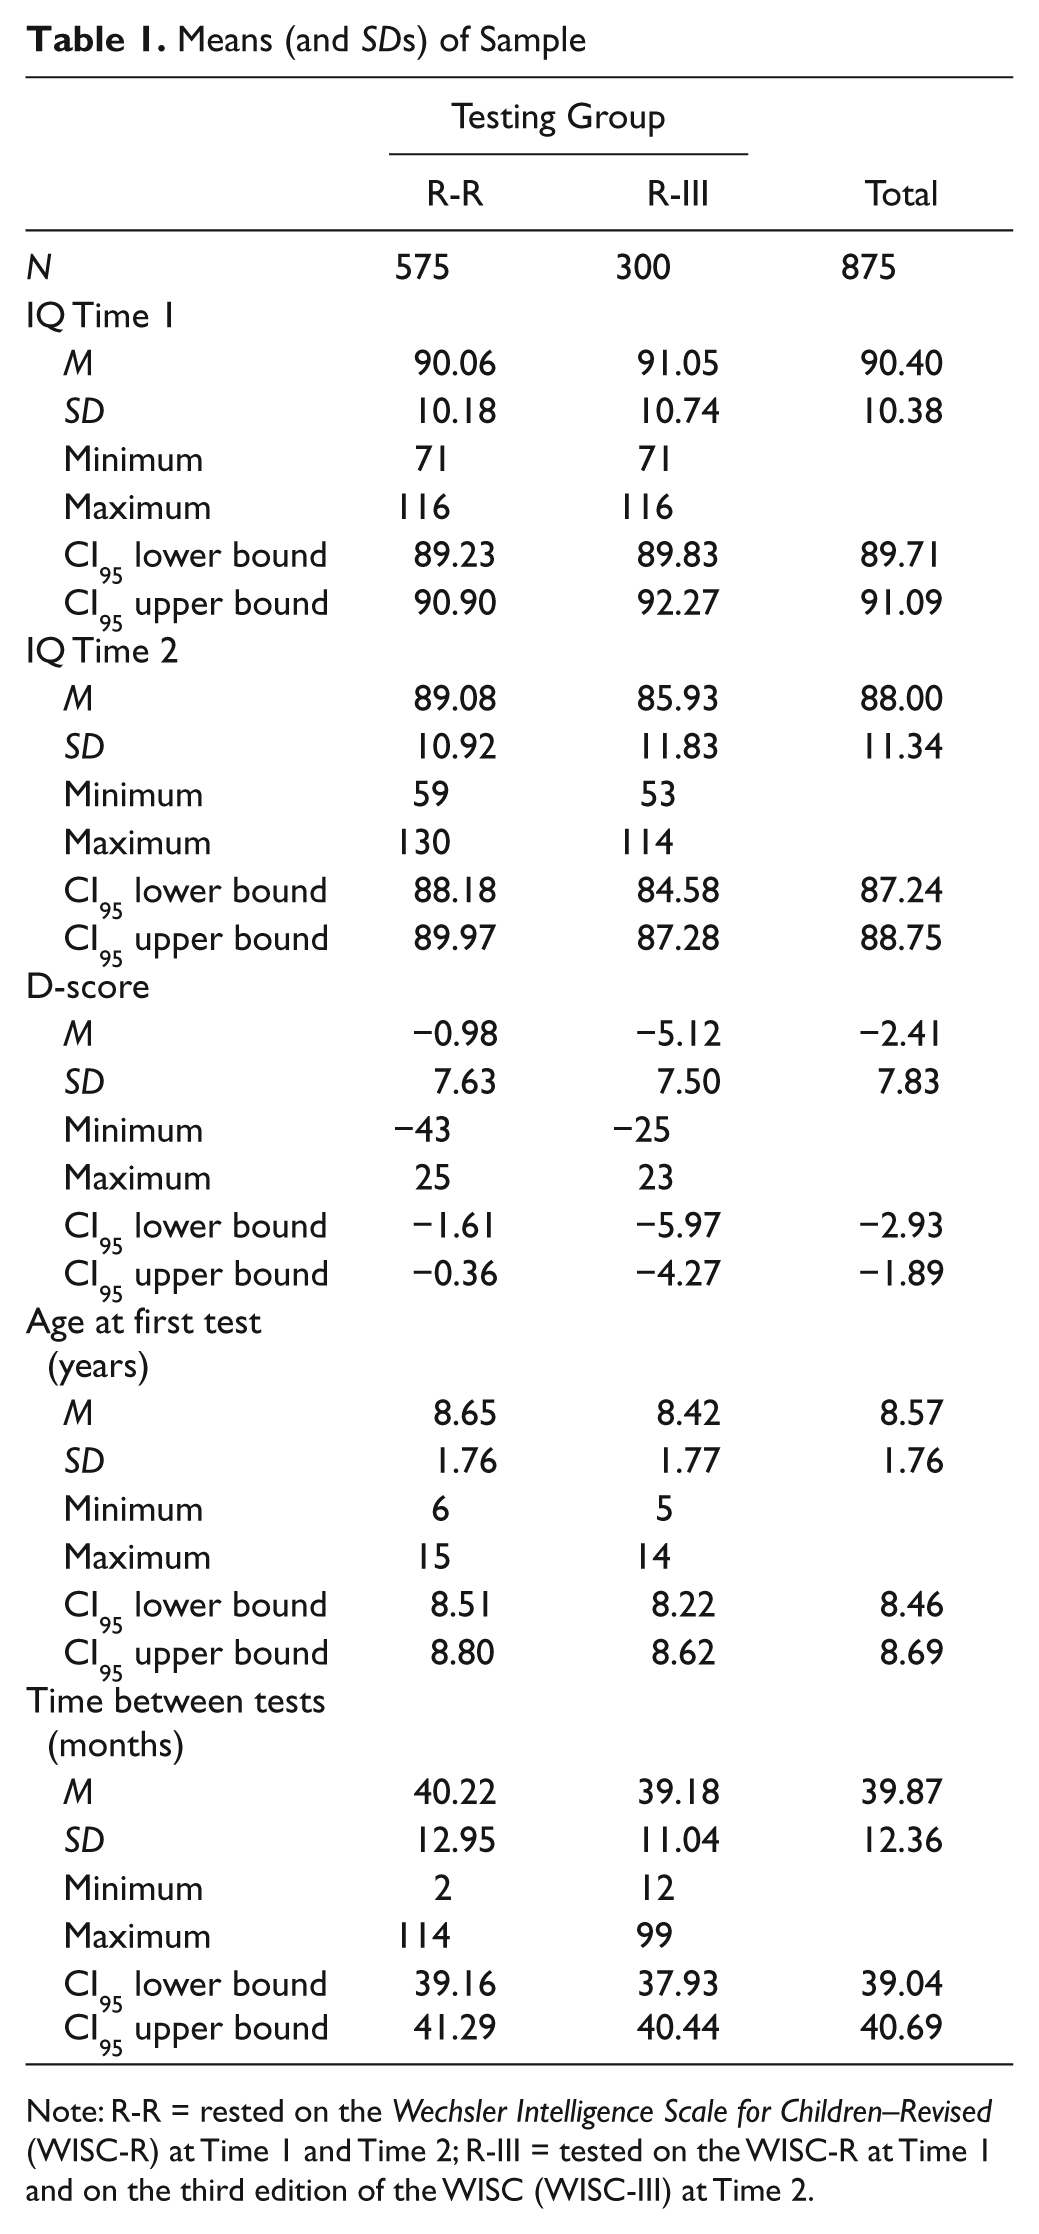
Note: R-R = rested on the Wechsler Intelligence Scale for Children–Revised (WISC-R) at Time 1 and Time 2; R-III = tested on the WISC-R at Time 1 and on the third edition of the WISC (WISC-III) at Time 2.
To determine if this decline experienced by the R-III group was significantly larger than the decline experienced by the R-R group, a multiple regression analysis was conducted. IQ at Time 2 served as the dependent variable, and testing group (the R-R group served as the reference group), age at Time 1, IQ at Time 1, and number of months between testings were included in the model as predictor variables, in accordance with previous research (e.g., Kanaya, Ceci, & Scullin, 2005; Kanaya, Scullin et al., 2003). The overall model was statistically significant, F(4, 865) = 303.75, p < .001, adj. R2 = .58). Testing group was statistically significant (see Table 2). This indicates that children in the R-III group experienced a significantly larger D-score on retesting compared to children in the R-R group after controlling for initial IQ, age at testing, and time between testing.
Regression Coefficients Predicting IQ at Time 2
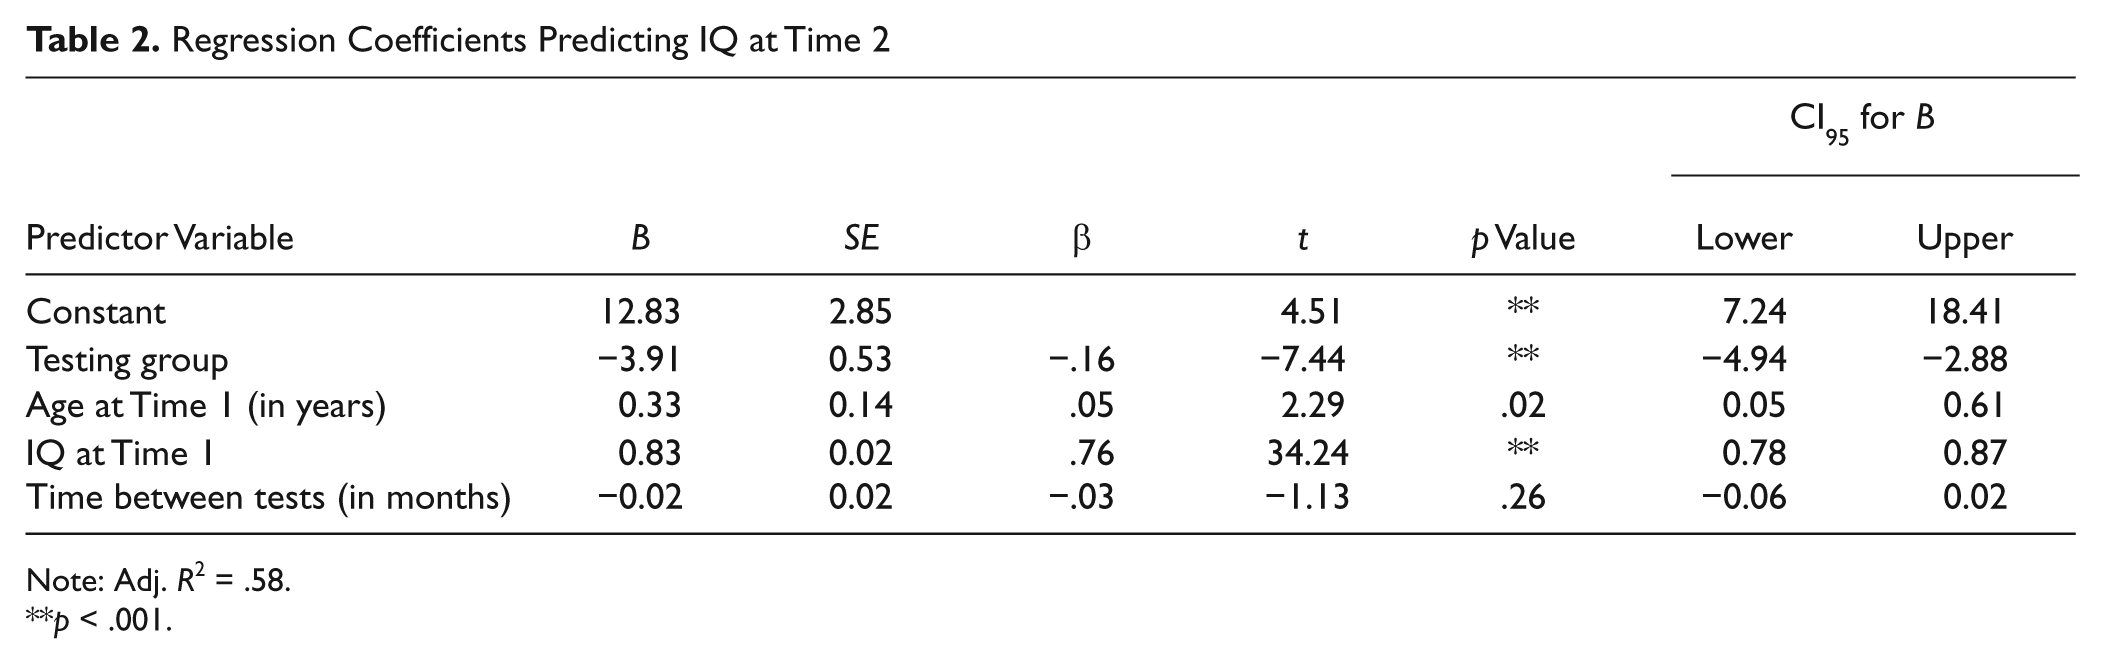
Note: Adj. R2 = .58.
p < .001.
It is important to note that this result cannot be driven by regression to the mean. Although regression to the mean is always potentially an issue when dealing with extreme scores, it would have affected the current results only if it exerted a bigger impact on the WISC-R than on the WISC-III, thereby enlarging the discrepancy between them. Any regression pressure, however, ought to decrease (not increase) the discrepancy between these scores because of upward pressure on the more extreme WISC-III scores because they are further from the mean than are the WISC-R scores.
On reevaluation, 67.4% of the children in the R-R group were rediagnosed with LD, whereas 59.2% of the children in the R-III group were rediagnosed. To determine if the significant drop in IQ on retesting in the R-III group had an impact on rediagnosis, multiple logistic regression analyses were conducted where the probability of rediagnosis was predicted by testing group (again, the R-R group served as the reference group), school district, IQ at Time 1, age at Time 1, and number of months between evaluations. School district was included in the model to accommodate for the fact that the diagnostic criteria used for LD services can vary widely between states and specific districts (Reschly & Hosp, 2004).
The overall model was statistically significant (see Table 3) and the Hosmer–Lemeshow test revealed the model was a good fit with the data, χ2(8) = 6.18, p = .63. The probability of a rediagnosis of LD on reevaluation was different based on testing combination after controlling for school district, the child’s age of testing, initial IQ, and time between tests (see Table 3). More specifically, the probability of an LD rediagnosis was significantly lower for children in the R-III group compared to children in the R-R group, odds ratio = 0.61, Wald(1) = 6.37, p = .01, confidence interval (CI)95 = 0.41, 0.90. This logistic regression model was conducted nine other times so that each school district could serve as the reference district. All of the statistics, including the Hosmer–Lemeshow tests and all coefficient values, were the same in all 10 models.
Logistic Regression Coefficients for the Probability of Learning Disability Diagnosis on Reevaluation
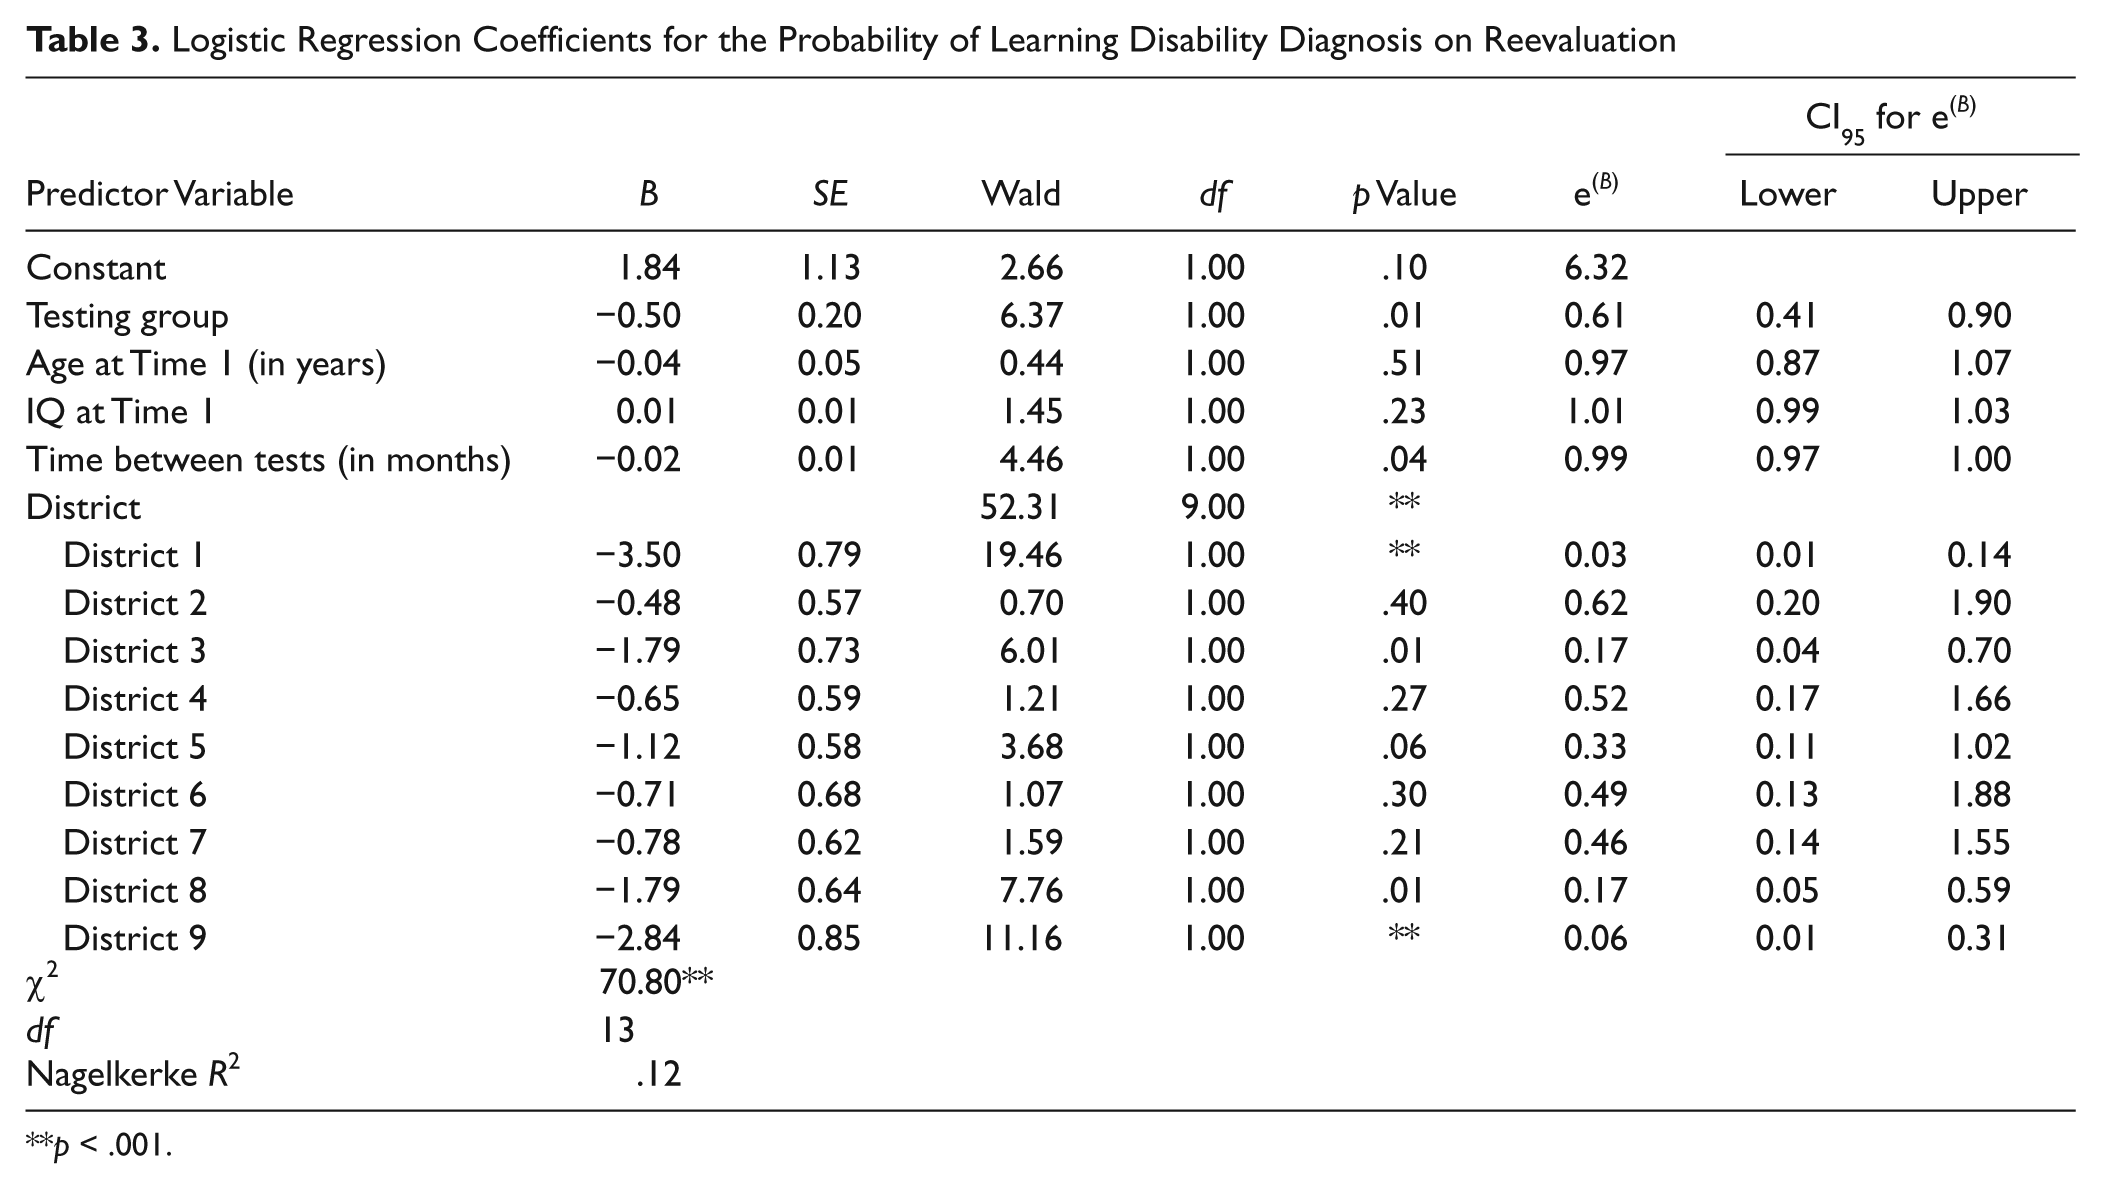
p < .001.
Conclusions
The results of the current study reveal that children diagnosed with LD experience a substantial drop of approximately 5 points in IQ when originally tested on the WISC-R but retested on the WISC-III. This pattern is consistent with the previous research on the Flynn effect and school children diagnosed with LD (e.g., Truscott & Frank, 2001; Kanaya, Ceci, et al., 2003; Kanaya, Scullin, et al., 2003; Sanborn et al., 2003). These results also demonstrate that the significant decline in IQ because of the introduction of the WISC-III resulted in a significant decrease in LD diagnoses on reevaluation. Although others (e.g., Gaskill & Brantley, 1996; Sanborn et al., 2003) have pointed out the practical significance of the Flynn effect on LD diagnosis, this is the first study to examine this issue empirically.
The significant decrease in LD diagnoses on the introduction of a new norm means that school children’s diagnoses are based in part on the year tested and test norms used rather than actual cognitive ability. And therefore the services and educational opportunities provided to school children, such as extra time allotted on tests and homework assignments, modified curricula and access to teacher’s aides (Gajria, Jitendra, Sood, & Sacks, 2007), and tax benefits provided to some parents with LD children are based, in part, on the year tested rather than the child’s academic needs. Given the high prevalence rate of LD and the costs of administrating these services, the Flynn effect could be resulting in millions of dollars in misallocated resources and thousands of mis-served children each year (Chambers et al., 2004). And because of the required reevaluations under IDEA, these disruptions can occur at any point throughout a child’s school career.
Although these data were collected before the CFR eliminated the discrepancy model as a requirement for the diagnosis, the discrepancy model is still allowed and recommended by some researchers and practitioners (Bradley, Danielson, & Hallahan, 2002; Fletcher & Vaughn, 2009). Furthermore, the lack of clear guidelines for implementing the RTI model (Fletcher, Denton, & Francis, 2005; Fuchs, Mock, Morgan, & Young, 2003) has led practitioners to continue to rely heavily on IQ and other standardized measures for the diagnosis. Even without the use of the discrepancy model, the fact that MR must be excluded for the LD diagnosis requires an IQ cutoff score of 71 points or higher.
Furthermore, it is important to note that the DSM-IV requires the discrepancy model for the clinical diagnosis of LD in children. Thus, adults who must meet the DSM-IV criteria for LD to qualify for social security disability insurance and college students who are trying to qualify for educational services similar to those that were granted to them during their primary and secondary years will also fall victim to the Flynn effect (Siegel, 1999). Indeed, Fitzgerald, Gray, and Snowden (2007) found that adults with LD who were tested on the WAIS-R experienced a significant decline when retested on the WAIS-III. And in some cases, defendants diagnosed with LD can be ruled incompetent to stand trial, as was the case for a minor who was initially charged with murder in Alexandria, Virginia (Danforth, 2009). Therefore, the implications of these findings go beyond the classroom setting.
Where Do We Go From Here?
Despite the far-reaching implications of these findings, it is difficult to know what to do about the Flynn effect within the context of special education diagnoses. The newest norms provide the most accurate scores, and so every effort must be made to use the most recent norms in the evaluations. The high cost of a testing kit (approximately $1,000) can prevent many school districts from replacing them in a timely manner, leaving low-income schools particularly vulnerable given the inverse relationship between socioeconomic status and learning difficulties (e.g., Molfese, Modglin, & Molfese, 2003). Therefore, although test manufacturers are restandardizing their norms more quickly, a solution must be made to accommodate for the use of less accurate, aging norms.
Unfortunately, the solution does not appear to be simple. Kanaya and Ceci (2007) have argued that there is no “quick fix,” as it is still unknown if the Flynn effect is uniformly distributed among ethnicity, income level, age, IQ, and disability. Therefore, a uniform approach, such as subtracting 0.3 point (the estimated rate of the Flynn effect in the general population on the WISC and Stanford-Binet norms) for every year that a norm ages may not be appropriate for each child.
Some (e.g., Siegel, 1999) have argued that an individual’s IQ is irrelevant to his or her LD diagnosis. Rather, more emphasis should be placed on standardized tests that measure skills that are specific to the cognitive task in question. For example, children who are being diagnosed for dyslexia should be administered a variety of tests that measure reading abilities. The underlying causes of the Flynn effect, however, are still unknown and widely debated (e.g., Flynn, 2007; Neisser, 1998), and most achievement tests are highly correlated with IQ. Therefore, relying more heavily on norm-referenced, non-IQ measures could also still lead to inaccurate diagnoses as these measures may also be vulnerable to the factors that are causing the Flynn effect.
It is clear, however, that the use of cutoff scores—including a cutoff score that is needed to satisfy the discrepancy model—on a measure that is naturally fluctuating over time is problematic. It is also important for educators and school psychologists to recognize that the scores that are derived from an IQ test at different points in time are not comparable to one another. For example, an IQ of 100 on the WISC-R in 2000 is not comparable to the same score on the same norm 10 years earlier, nor it is comparable to the same score on the WISC-III in the same year. The year the child was tested and the test norm used are just as important as the score that was obtained and needs to be included as part of the evaluation process.
Strengths, Weaknesses, and Lingering Questions
As noted, this is the first study to examine directly the impact of the Flynn effect on LD diagnoses, the most prevalent disability category within special education. Because of the geographical diversity of the data, these findings are more generalizable than most of the previous research on LD, which has largely been conducted on small samples from a single school district. Furthermore, only a few studies have examined the Flynn effect among school children who are tested for special education services, despite the heavy reliance on longitudinal IQ testing on special education decisions. Thus, a strength of the present analysis is that the use of archived special education files from 10 school districts around the United States increases the ecological validity of the results and the real-world impact of the Flynn effect.
The use of a record review, however, has several limitations. We had access only to the information that was included in the schoolchildren’s testing files, and the districts had different archival standards for their records. Although some school psychologists provided the scoring sheet of each child’s IQ administration, others simply provided the full scale IQ within the evaluation report. The latter was particularly the case for the older, WISC-R records in our data set. Because of this lack of uniformity, we were not able to analyze individual subtests or raw score performances on the children in our data set.
Although an analysis at the subtest and raw score levels would be useful to gain a better understanding of the nature and magnitude of the Flynn effect, it was not one of the aims of our current study. Given that a measure of “general cognitive ability” is required for all special education evaluations under IDEA, we wanted to determine the relationship between the Flynn effect, operationalized as a significant decline in full scale IQ on the introduction of a new norm, and the LD diagnosis. Indeed, the examination of the Flynn effect at the subtest and raw score level is a complex and debated topic (e.g., Flynn, 2007; Kanaya & Ceci, in press; Kaufman, 2010) that is beyond the scope of this study, although an excellent area for future research within the LD population.
Likewise, LD is often treated as an umbrella term that encompasses many different disorders, including dyslexia, reading disability, and arithmetic disability (CFR: 34 CFR §300.8(c)(10); Siegel, 1999). The CFR, however, does not make a distinction between these “subdiagnoses,” and neither did an overwhelming majority of the records in our data set. It would be interesting to see if the Flynn effect has a differential impact on these subdiagnoses. For example, LDs that rely more heavily on measures of fluid ability may be more directly affected by the Flynn effect than disorders of crystallized ability. Again, this is an important area for future research and not within the scope of our current study.
Because of the nature of the data collection, we also did not have access to the specific LD criteria that were used for each child in our data set. Given the wide variability in diagnostic criteria for many special education categories, including LD, throughout the country (e.g., Kanaya, MacFarlane, & Avera, 2009; Reschly & Hosp, 2004), it is highly likely that these districts utilized different criteria. Although we are not able to connect each child with the criteria used for his or her diagnosis (e.g., the requisite achievement–IQ discrepancy), we included the school district as a covariate in our logistic regression analyses. Furthermore, by recoding this variable so that each district served as the baseline district, we found that the Flynn effect has a significant impact on LD diagnoses, regardless of which criteria are used within these districts.
Race and gender data were also excluded from a majority of the files and could not be included in our analyses. Given the overrepresentation of ethnic minorities and males in special education, it is important to determine the impact and magnitude of the Flynn effect in these at-risk populations (Kanaya & Ceci, 2007). Likewise, evidence of a gender bias in the discrepancy model for reading disability diagnoses (Share & Silva, 2003) illustrates the importance of examining gender differences in future studies. Furthermore, we restricted our analyses to the WISC norms, despite the fact that many other IQ tests are used in special education evaluations (e.g., Stanford-Binet, Kaufmann ABC, Slosson Intelligence Test). Future research, however, should examine the nature and magnitude of the Flynn effect with other IQ tests that are used in special education evaluations.
In addition, we had access only to the recommendation of the special education evaluation committee. It is possible that the actual diagnosis is different from the committee recommendation, though the extent that this is true is probably small. We also did not have access to the children’s achievement test data, and so we were not able to control for any changes in achievement in our analyses or to examine the relation, if any, between trends in achievement and intelligence trends. Previous research, however, has found little evidence of the Flynn effect or other trends in achievement tests or other measures of crystallized measures (Flynn, 2007; Gaskill & Brantley, 1996; Sanborn et al., 2003), so it is unlikely that access to such data would have changed the overall results.
As noted above, many studies fail to find a Flynn effect for LD children’s achievement over time. This makes intuitive sense given that their disability impedes them from making age-appropriate progress in achievement in the domain related to their disability. What is less intuitive, however, is that Sanborn et al. (2003) reported little or no change in LD children’s scores on what are essentially intelligence tests. That is, in their study, children who were tested on the Woodcock–Johnson Cognitive Ability–Revised and then retested on the newer Woodcock–Johnson Cognitive Ability–III showed little change even though both of these versions are heavily g-loaded and correlate highly with other measures of general intelligence such as the WISC-R. Given that LD children are documented to fall further behind in their academic performance as they age (McKinney & Feagans, 1984), there are reasons to expect much smaller increases in achievement over time than would be found among regular education peers. But it is unclear why their performance on tests of general cognitive aptitude would not exhibit the customary decline when retested on a newer, presumably harder norm as seen on the WISC norms. This question would greatly benefit from future research targeted to explaining this disjunction.
Footnotes
Declaration of Conflicting Interests
The authors declared no potential conflicts of interests with respect to the authorship and/or publication of this article.
Financial Disclosure/Funding
This research was supported, in part, by a research grant by the Smith Richardson Foundation awarded to the second author. This research was also supported, in part, by a research grant by the Spencer Foundation (grant # 2007-000115) awarded to the first author. Any opinions, findings and conclusions or recommendations expressed in this material are those of the authors and do not necessarily reflect those of the Smith Richardson or Spencer Foundations.