






Abstract
In this study, we tested the outcomes of access to a response to intervention (RtI) model in kindergarten or in first grade on end-of-Grade-2 reading achievement and placement in special education. Across five schools, 214 students who began having access to Tier 2 intervention in kindergarten or first grade were compared in Grades 1 and 2 with 208 cohort peers who were average readers and 102 historical control condition second grade poor readers who did not receive Tier 2 intervention. Results demonstrated significant effects on reading achievement for access to RtI in kindergarten at the end of first grade (effects averaged 0.48), but not in second grade, except for students who were English language learners (ELLs), who showed an advantage through the end of second grade. Students with access to RtI overall had significantly higher outcomes at the end of Grade 2 than students in the historical control, with no differences resulting from ELL status. No significant difference in the proportion of students placed in special education was noted; however, a greater proportion of the students found eligible as with learning disabilities had poor reading scores if they were placed after participating in RtI.
Keywords
The Individuals with Disabilities Education Improvement Act (2004) encourages schools to adopt and implement multilevel prevention systems, known as response-to-intervention (RtI) models. The motivation for RtI stems in part from dissatisfaction with the traditional method for identifying students with learning disabilities (LD) in reading, which involves a discrepancy between a student’s cognitive ability and achievement. Because the kindergarten and first grade expectations for reading skills are both limited (albeit no less important) and constantly increasing, this discrepancy LD identification method often misses students; students are not found eligible for intensive intervention through special education services until second grade or later. By delaying identification of LD, students lack opportunity for early intervention in reading, which often has positive effects on short- and long-term reading achievement (O’Connor, Fulmer, Harty, & Bell, 2005; Simmons et al., 2008; Vaughn, Linan-Thompson, & Hickman, 2003).
A second motivation for RtI is the prevalent belief that some students are identified for LD because of instructional failure, meaning that students demonstrate poor reading achievement because of instruction that was insufficiently rigorous at the general education level (in RtI known as Tier 1). These students would not need special education if their reading instruction had been more careful, research based (L. S. Fuchs, 2003; O’Connor, 2000), or differentiated (Connor, Morrison, & Underwood, 2007). By providing small-group, explicit, and intensive instruction (also called Tier 2) and monitoring whether reading improves, RtI models may help to differentiate students who have need for a special education from those who would grow adequately with better instruction.
Because of the change in the IDEA and the success of the early intervention studies of the past 15 years (e.g., Blachman, Tangel, Ball, Black, & McGraw, 1999; O’Connor et al., 2005; Torgesen et al., 1999; Vaughn et al., 2003; Vellutino et al., 1996; Vellutino, Scanlon, Zhang, & Schatschneider, 2008), many school districts have adopted implementation of RtI as a means for preventing reading difficulties and assisting with identification of LD. These school-based models of RtI differ from the experimental studies in several respects. First, experimental studies usually select a group of students based on risk criteria identified at one time point (e.g., beginning or middle of kindergarten, beginning of first or second grade). These students become the risk pool for intervention and control groups. Although useful for experimental control, this experimental design model ignores the fact that students exhibit risk at different time points and on different dimensions of reading. For example, many students have reading difficulties based on poor letter knowledge or phonemic awareness in kindergarten and would be included in a kindergarten risk sample; however, other students perform adequately on these kindergarten skills and still demonstrate difficulties decoding words in first grade. These students, whose reading difficulties stem from integration of multiple skills, would not be included in the risk pool identified with kindergarten measures; however, they are included in the more fluid, school-developed models of RtI (Marston, Muyskens, Lau, & Canter, 2003; Mellard, McKnight, & Woods, 2009; Tilly, 2003).
Schools that implement RtI as policy include all at-risk students by screening multiple times each year and including students in intensive interventions (Tier 2) as their scores fall below cut points that indicate poor reading growth or achievement relative to their peers. In these practical applications of RtI, student movement is fluid across tiers of intervention over time. Thus, rather than identify a pool of students at risk and provide intervention for a specific length of time (e.g., 10 weeks, a semester, or a school year) regardless of growth, the school-based models admit and release students from Tier 2 interventions flexibly based on their performance (see, e.g., Marston et al., 2003 for a description of the Minneapolis implementation model, Mellard et al., 2009, for screening and selection procedures, and the Division for Learning Disabilities, 2008, guide for teachers).
This practical fluidity across tiers changes the fundamental research questions from those used experimentally (e.g., What are the outcomes of X treatment applied for 10 or 20 weeks to students at risk? What proportion of children at risk is no longer at risk after tutoring? What proportion is identified for special education?) to those with practical importance to school and district personnel (In what grade should we start an RtI system? What effect will this model have on students who are English Language learners? Does RtI improve long-term outcomes for students? Does it improve identification for special education?).
Beginning Tier 2 in Kindergarten or First Grade
Research syntheses (e.g., National Reading Panel, 2000; Snow, Burns, & Griffin, 1998) have identified underlying reading skills that can be mastered by most students in kindergarten or first grade, including letter–sound correspondences and phonemic awareness, which together contribute to a child’s understanding of how reading and writing function to capture spoken words, also known as the alphabetic principle. Beginning intervention in these key areas before students experience substantial failure in their effort to learn to read may affect long-term outcomes, such that the severity and perhaps the incidence of LD in reading may be decreased (Coyne, Kame’enui, Simmons, & Harn, 2004; O’Connor et al., 2005; Wanzek & Vaughn, 2011).
Evidence for this possibility began to accumulate in the 1990s, as researchers explored whether teaching kindergarten children letter–sound correspondences, phonemic blending and segmenting, and linking these areas together might improve their learning of words (O’Connor, Jenkins, & Slocum, 1995; Tangel & Blachman, 1992; Torgesen et al., 1999). These studies followed an RtI model, in that kindergartners were screened and those most at risk were selected for small-group, intensive instruction (Tier 2). Outcomes of these studies were positive; however, the researchers also pointed out that selecting children for risk status in kindergarten tended to “overselect”; that is, students’ lack of experience can be confused with poor learning potential. Thus, some of the success of these early interventions could be attributed to selecting students who would have learned these skills without specific intervention. Nevertheless, results of the kindergarten experiments have been so consistent that it is now common in schools to screen students for difficulties in these early reading skills, even when schools are not specifically implementing an RtI model of prevention.
Using a similar focus on the alphabetic principle, other researchers have explored the benefits of first grade intervention (Cunningham, 1990; Denton et al., 2010; O’Connor, 2000; Vellutino et al., 2008), either alone or in combination with kindergarten intervention. These studies have shown positive effects for a first grade start to Tier 2, as well as declining proportions of poor responders when first grade intervention was provided to students who responded poorly to intervention in kindergarten, or whose end-of-kindergarten scores still indicated risk for poor reading outcomes. All three models (intervening in kindergarten, intervening in first grade, or providing intervention as needed through kindergarten and first grade) have shown positive effects on reading development; however, they have rarely been compared within a single study.
Although the belief that earlier intervention is better than later intervention is common, not all studies of intensive intervention have found that earlier intervention improves rate of learning over later intervention, and many studies indicate that the accuracy of identification improves after kindergarten (Compton et al., 2010; O’Connor & Jenkins, 1999). Moreover, confining identification of at-risk readers to kindergarten is problematic; measures of early literacy used in kindergarten (e.g., letter naming and segmenting) are less sensitive for identifying later-emerging reading difficulties in first or second grade than are measures that require reading and comprehending text (Catts, Compton, Tomblin, & Bridges, 2012). When Cunningham (1990) compared the reading achievement of students who received phonemic awareness intervention in kindergarten versus first grade, first graders showed stronger outcomes in transfer measures of reading achievement (although experimental group kindergartners outperformed control group first graders on phonemic awareness tasks). Other studies that have included students in intervention across a range of grade levels in elementary school have found similar growth in reading between older and younger students. Lovett and Steinbach (1997), Rashotte, MacPhee, and Torgesen (2001), and O’Connor et al. (2002) developed and delivered reading intervention to students at three or more grade levels and found no grade-level effect on reading improvement. Conversely, Dion, Brodeur, Gosselin, Campeau, and Fuchs (2010) compared effects of enhanced Tier 1 instruction that began in kindergarten or first grade and found that students benefited more from the earlier start to evidence-based instruction, although the effect was only for the lowest-skilled students. Tier 2 intervention was not part of that study’s design.
Identifying students as struggling learners in kindergarten has a well-known downside mentioned earlier: Measures tend to overselect the proportion of students who may be at risk and result in funneling costly resources unnecessarily to students who are not truly at risk for severe reading disabilities (Compton et al., 2010; Jenkins & O’Connor, 2002; Speece, 2005). In addition, studies of interventions lasting 2 or more years often report loss of skills over the summer months (O’Connor et al., 2005; Vellutino et al., 2008); thus, beginning in kindergarten may mean spending time again in first grade on skills that appeared to have been mastered the year before. For these reasons, beginning in first grade could be more cost-effective than in kindergarten if the long-term outcomes are strong.
The issue here is not to compare 1 to 2 years of ongoing Tier 2 intervention, which has been done in other studies, but rather to offer access to intervention—as needed—in kindergarten or first grade. In RtI models, students are assessed on a set schedule and as their scores indicate risk they are included in Tier 2 interventions. Some students may develop risk for reading difficulties in first grade and still score adequately (e.g., at or above the 25th percentile) on kindergarten measures. For these students, having access to RtI in kindergarten would not matter because they would not have been selected for Tier 2 intervention at that time. Other students with reading difficulties in first grade might have alphabetic or phonemic difficulties that would have been apparent at the beginning of kindergarten. For these students, access to RtI in kindergarten might either eliminate their reading difficulty altogether or reduce the difficulties they experience in first grade. Therefore, in this study, students were provided with Tier 2 intervention as their scores on screening measures indicated risk (i.e., in fall or winter during any grade in which the student had access to the RtI model).
Likewise, students did not continue in Tier 2 for a set number of weeks. Screening assessments and progress monitoring measures advocated by researchers in RtI are meant to capture risk at various time points. Thus, when students score above the cut points that indicate risk for reading difficulties, they are meant to be returned to less intensive intervention, most frequently moving from Tier 2 (small group intervention) to Tier 1 (general education instruction only). In this study, when students scored above the risk cut points for 6 weeks, they returned to Tier 1; however, we monitored their reading growth in Tier 1 and returned them to Tier 2 if they failed to thrive with the general education instruction alone. How this model’s fluidity affects our understanding of the emergence of reading disabilities, student response to instruction, and the proportion of reading disabled children within different populations has received little research attention.
Including English Language Learners
In many areas of the country, the proportion of students who are English language learners (ELL) is increasing. In southern California, for example, schools commonly comprise 30% ELL or more, and these students often demonstrate disproportionate rates of reading difficulties in English (Kieffer, 2010; Lee, Grigg, & Donahue, 2007). To attempt to reduce potential bias in identification of students from minority cultures, ELL, and males, VanDerHeyden, Witt, and Gilbertson (2007) implemented an integrated model of RtI in five elementary schools using the system to enhance educational performance model. The study focused on the referral process and special education identification when the model was used by school personnel. Overall, using RtI as a process for identification decreased bias associated with gender and ethnicity; however, the authors did not evaluate RtI’s effect on ELL identified for special education.
Studies of early reading intervention in kindergarten and first grade have demonstrated positive effects for students who are ELL (Linan-Thompson, Vaughn, Prater, & Cirino, 2006; Quiroga, Lemos-Britton, Mostafapour, Abbott, & Berninger, 2002). Nevertheless, educators find it difficult to determine whether young students who are ELL need intensive reading intervention, or need experience in the school system for their language in English to develop (Klingner, Artiles, & Barletta, 2006). Part of this difficulty is that word reading, language comprehension, and reading comprehension may develop unevenly for ELL (Jean & Geva, 2009). In a longitudinal study of ELL from age 4.5 to 11, Mancilla-Martinez and Lesaux (2010) reported average word reading skills alongside very low language skills in kindergarten and first grade. By fifth grade these children comprehended text at only the second grade level, despite adequate word decoding. This disparity was also found between word reading and meanings of words (Mancilla-Martinez & Lesaux (2011). Relative skill in decoding coupled with poor reading comprehension may also account for Crosson and Lesaux’s (2010) finding that reading rate shows weaker relations with reading comprehension for ELL than for native English speakers by fifth grade.
Across these studies, researchers have recommended that oral language development in English be incorporated with skill interventions throughout the primary grades. This recommendation may be especially important in states such as California, where most instruction in public schools occurs in English. We reasoned that in an RtI model that includes students who are ELL, conversation and use of text-centered language should be included in Tier 2 intervention. Because these interventions are conducted most often in small groups, students who are ELL may benefit from opportunities to learn and use the English language, in addition to assistance in learning to read in English (O’Connor, Bocian, Beebe-Frankenberger, & Linklater, 2010).
Whether students who are ELL make greater gains with earlier access to RtI has not been explored. It is possible that students who are ELL could profit more than native English speakers from small group intervention that enables more opportunity to use the English language than whole-class instruction offers typically. In particular students who are ELL may benefit from an earlier start to reading intervention and continued support as needed in first and second grades.
RtI and Special Education
The key issues of whether RtI affects the incidence of disability or reliability of identification in the primary years create additional analytic difficulties. Few studies have examined long-term implementation of an RtI model (i.e., three or more years) and its effect on the identification of disability. O’Connor et al. (2005) demonstrated a downward trend in incidence of LD; however, the number of students in that study was too small for statistical analysis. In a larger study that followed students through third grade (Wanzek & Vaughn, 2011), the proportion of students found eligible for special education following implementation of RtI again showed a downward trend, but did not differ statistically. Similarly, VanDerHeyden et al. (2007) reported that although more students received attention from the school-based team through implementation of their model of RtI, fewer students were referred for and qualified for special education.
Long-term outcomes (end of second grade) of RtI on special education are also difficult to judge because of attrition. For example, in Vellutino et al.’s (2008) study, only 62% of the students who had received RtI were available for testing 3 years after it began, and only 25% of the kindergarten students remained through Grade 3. Given the attrition reported in previous longitudinal studies (e.g., Coyne et al., 2004; O’Connor et al., 2010; Vellutino et al., 2008), outcomes can be difficult to interpret.
Although models of RtI have been researched for many years, more must be learned about the outcomes of various choices in RtI frameworks as they are used in schools. One choice faced by school districts is when to begin using RtI to monitor and intervene with students who have reading difficulties. In this study, we explored the effects of this decision by comparing outcomes of beginning access to Tier 2 RtI interventions in kindergarten or first grade on end-of-Grade-2 reading achievement for native English speakers and for ELL, along with placement in special education. Our specific questions were the following: (a) Does access to Tier 2 intervention in kindergarten or first grade improve reading outcomes over untreated students at the end of Grade 2? (b) Do outcomes differ between students who are ELL or native English speakers? and (c) Do placements in special education for students with high-incidence disabilities differ across kindergarten access to RtI, first grade access, and an untreated control group?
Method
Study Design
In this 3-year longitudinal study, schools in Year 1 were assigned randomly from matched pairs to begin the RtI model in kindergarten or first grade. Student outcomes at the end of Grade 2 were compared with those of students in the same schools who were second graders in Year 1, also called the historical control group. All students were assessed three times per year with multiple reading measures. When scores on these measures indicated risk at any time point, students received Tier 2 intervention according to their assignment (kindergarten access, first grade access, or no access for the historical control). Students continued to receive Tier 2 intervention until their reading scores no longer indicated risk. The details of participants and procedures are described below.
Participants
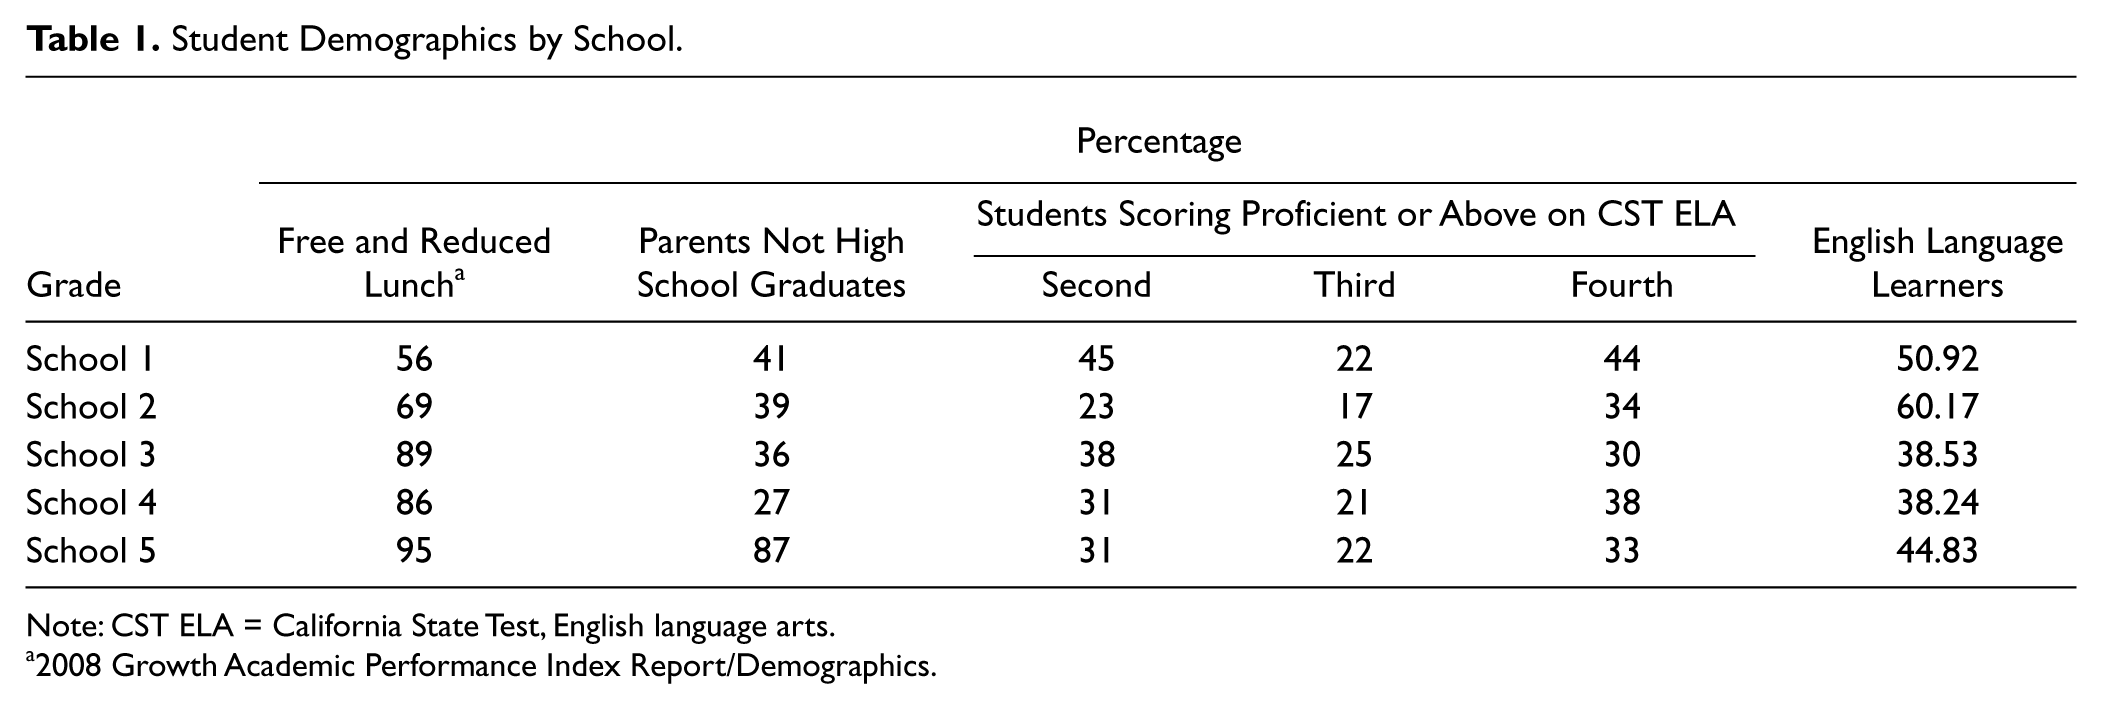
Student participants began with three cohorts—kindergarten, first grade, and second grade students—with approximately 410 students in each initial cohort. The students in these three grade levels attended five elementary schools in two school districts in Southern California. The schools served children whose free and reduced lunch status ranged from 56% to 95% (California Department of Education, 2008) and many children were learning English (California Department of Education, 2008). With only a few exceptions, the first language for students who were ELLs was Spanish, and the proportion of ELL students ranged from 38.24% to 60.17% across schools. The English language arts achievement proficiency levels of the students in these schools, as measured by the state mandated group administered annual assessment, the California Standards Tests, were below average (California Department of Education, 2008). Across schools, the percentage of students at the end of second grade who scored proficient on the California State Test (CST) for English language arts ranged from 23 to 45, and by third grade the range dropped to 17% to 25%. Table 1 provides by school the basic demographics of free and reduced lunch status, parent education level, percentage of ELL students, and percentage of students scoring proficient and above on the English language arts CST for the initial year of this study.
Student Demographics by School.
Note: CST ELA = California State Test, English language arts.
2008 Growth Academic Performance Index Report/Demographics.
Schools
School districts nominated potential school sites, and participation in the study was negotiated with the principal, the teachers, and researchers. None of the schools had participated previously in a model of RtI. We collected informed consent letters from all teachers in kindergarten, first grade, and second grade at the participating schools to allow classwide administered assessments and class observations.
Of the five schools, four were matched on proportion of students who were ELL and received free or reduced lunches and proficiency levels on the CST. In each pair, one was randomly chosen to wait to implement the intervention portion of RtI until Grade 1 and one to begin in kindergarten and Grade 1; however, kindergarten and first grade students at risk for reading disabilities were identified and monitored at all five schools. The fifth school was assigned to begin access to RtI in kindergarten based on most severe need (School 5).
Teachers
All of the kindergarten, first grade, and second grade teachers (N = 66) in the five schools participated in the study. All used the same reading curriculum (Houghton Mifflin Language Arts) and participated in 120 hours of language arts professional development on implementing this curriculum (40 hours of training followed by 80 hours of follow-up), which was provided through the California Reading Development Center. This level of professional development and the reading curricula were accepted as evidence-based reading instruction in California’s application for Reading First funding. California further requires that “teachers of English learners (EL) hold an appropriate document or authorization for English language development (ELD), specially designed academic instruction delivered in English (SDAIE), or content instruction delivered in the primary language” (California Department of Education, 2012). Districts must monitor and ensure that teachers hold appropriate ELL authorizations, cross-cultural language and academic development certificates, and bilingual authorizations authorizing instruction to English learners.
Students
K access and Grade 1 access
Students were classified as K access if they (a) were kindergartners in Year 1 and (b) attended one of the three schools where RtI intervention began in K. Students were classified as Grade 1 access if they (a) were first graders in Year 1 and (b) attended one of the three schools where RtI intervention began immediately, or (c) were kindergartners in Year 1 and (d) attended one of the two schools where RtI intervention was delayed until first grade. Thus, the K access cohort of students received Tier 2 treatment as kindergartners and/or first and/or second graders, depending on when and for low long their scores indicated risk. The Grade 1 access cohort of students received Tier 2 as needed in first and/or second grade when scores made them eligible. Eligibility criteria are described under Procedures and shown in Table 3.
Of the 819 K–1 students who began the study, 38% of students with K access and 41% with Grade 1 access to RtI had left the study by the end of second grade through attrition (families moving out of the participating school catchment areas), leaving 226 students with K access and 386 students with Grade 1 access to RtI by the end of Grade 2. Although attrition varied by school, it did not vary across cohorts. Unlike our earlier studies (O’Connor et al., 2005; O’Connor et al., 2010), attrition was slightly higher for average readers than for those who received Tier 2.
Tier 2 participants
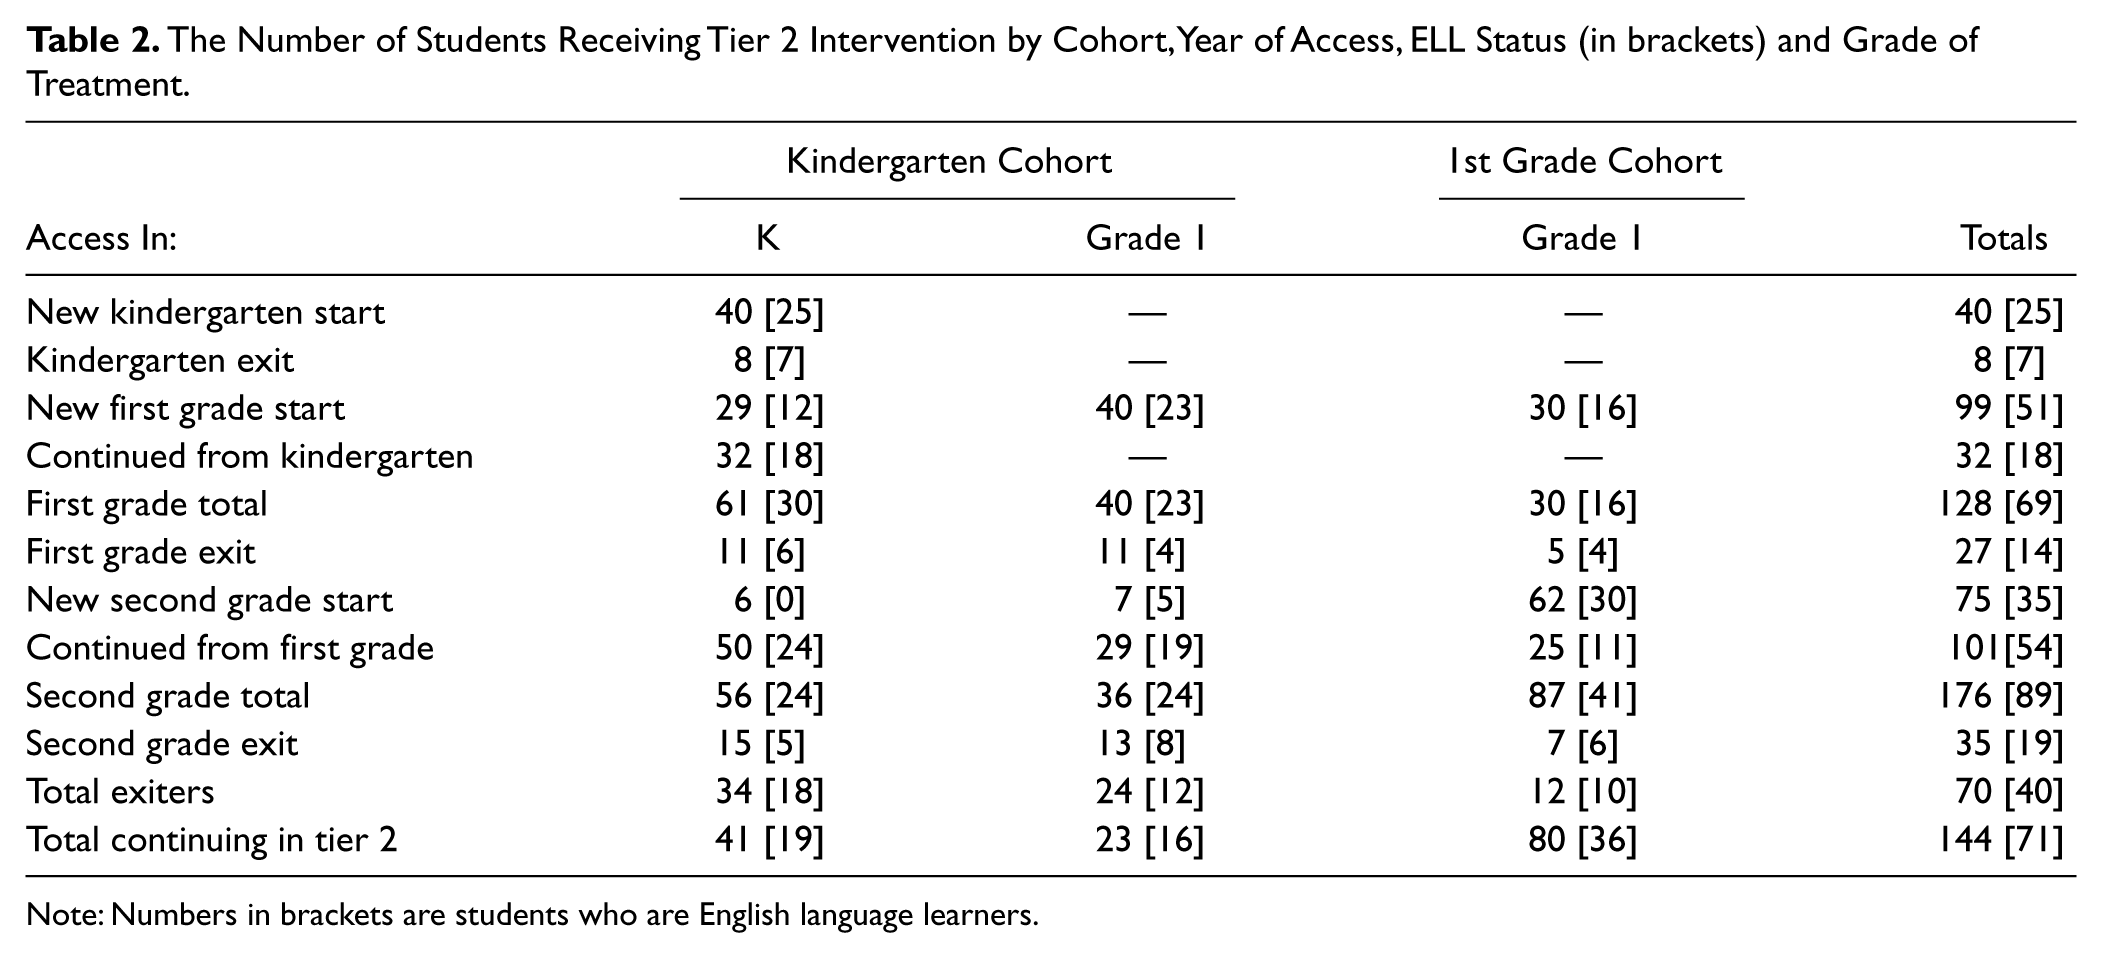
Among the final longitudinal sample of students who qualified for and received intervention at some point between kindergarten and second grade, 75 students were from the kindergarten access cohort and 139 were from the first grade access cohort. These students represent 33% and 36%, respectively, of the students available from these two cohorts. Among these students 74.4% were Hispanic, 11.2% were African American, 9.8% were White. A small number of students (2.8%) were either American Indian, Vietnamese, Asian Indian, or Other Pacific Islander, and 3.7% declined to state their ethnic status. Males were 56.5% of this at-risk sample, and 49% of the students were ELLs. All but 8.5% of these ELL students were at the early intermediate level or below, as indicated by their scores on the California English Language Development Test (CELDT). Table 2 shows the number of students by cohort and grade who entered and exited Tier 2 intervention across the 3 years. Of those Tier 2 students, the number who were ELL is shown in brackets.
The Number of Students Receiving Tier 2 Intervention by Cohort, Year of Access, ELL Status (in brackets) and Grade of Treatment.
Note: Numbers in brackets are students who are English language learners.
Average readers
Among the student peers in the K and Grade 1 access cohorts who did not qualify for intervention (average readers), 70.2% were Hispanic, 10.6% were African American, 12.5% were White, and 2.9% were Vietnamese. A small number of students (3.4%) were either American Indian, Korean, Asian Indian and Cambodian, or Filipino, and 0.5% declined to state. Males were 42.8% of this average reader peer sample, and 53.4% of these students were ELL. The proficiency in learning English was higher for these ELL students, as 24.3% scored at the intermediate or advanced level on the CELDT. By the end of second grade, the attrition rate was 67% across average-reader cohorts.
Grade 2 controls
Students in the five schools who were in second grade in the first year of the study formed our control group. Because 33% to 36% of students who had access to RtI across the 3 years received Tier 2 at some point, we identified the bottom 33% of students in our Grade 2 control to designate at-risk status. Operationally, this criterion selected students reading fewer than 39 words correct per minute (wcpm) in fall of Grade 2. The number of students selected (n = 102) using this method generated a risk proportion similar to the risk proportions in the cohorts with access to Tier 2 intervention. Demographic statistics for the historical comparison group of at-risk second graders were similar to those who had access to RtI, with 74.5% Hispanic, 12.7% African American, and 11.8% White. These students were 55.4% male and 44.5% ELLs. All but two of the ELL students in the risk sample were at the early intermediate or lower level on their second grade CELDT test.
Instruction (Tier 1) in these second grade historical control classes in Year 1 was very similar to the Tier 1 instruction our second grade RtI participants received in Years 2 and 3 because Tier 1 teachers used the same reading curriculum across all years in all classes. More than 80% of students in RtI cohorts had the same teachers as the second grade historical control.
Students in the historical control group (n = 391) received no experimenter-designed Tier 2 intervention. We established with school personnel that students would be eligible for any school-based intervention deemed appropriate, including special education and tutoring programs, regardless of experimental condition. However, aside from special education services, no additional interventions were available for second grade historical control students when they were in kindergarten or first grade. In second grade, pull-out remedial services were offered to poor readers in the control in three of the five schools, which consisted of 25–min small-group (about 6 students) reading instruction 4 days per week from the school’s reading coach using Reading Mastery II (Engelmann & Bruner, 1995). Students were grouped by class for this service rather than by reading ability, as the program authors recommend, and remained with their group throughout the school year.
Measures
Assessments for Sample Selection and Description
The Peabody Picture Vocabulary Test–3rd Edition (PPVT; Dunn & Dunn, 1997) was used to describe receptive language in English for all students. The PPVT is an individually administered, norm-referenced measure of receptive vocabulary designed for individuals 2.5 years old through adult. The child selects from among four pictures, one which best represents a word read by the examiner. We report standard quotient scores here (raw scores standardized for age in years and months at the time of testing), with a mean of 100 and standard deviation of 15.
For selection for intervention and monitoring the students’ responsiveness, we used subtests of the Dynamic Indicators of Basic Early Literacy (DIBELS; Good & Kaminski, 2003) in all grades and Word Identification Fluency (WIF; L. S. Fuchs, Fuchs, & Compton, 2004) in first grade, all of which are timed and individually administered. Criteria for entering and exiting Tier 2 are described in the Procedures section.
Kindergarten Measures
DIBELS Letter Naming Fluency (LNF) is a measure of accuracy and speed of naming upper- and lowercase letters that are randomly arranged. LNF contains 100 upper- and lowercase letters that are randomly ordered on a paper. Students are asked to name as many letters as they can within 1 minute in the order presented. The examiner notes errors and subtracts errors from the total number of letters named within a 1-minute period. The DIBELS Initial Sound Fluency (ISF) is a standardized assessment that captures emerging phonological awareness (Kaminski & Good, 1996). The examiner shows a page of four pictures to a child and names each picture. The examiner then asks the child to point to the picture beginning with the sound /m/. The examiner starts the stop watch as soon as the question is asked. If the child does not respond in 5 seconds, the watch is stopped, the item is scored 0, and the examiner moves on to the next set. The child’s score is the sum of all correct responses within the accumulated minute period. Hintze, Ryan, and Stoner (2003) reported alternate-form reliability of .86.
In January, Phonemic Segmentation Fluency (PSF) replaced ISF for kindergarten students. DIBELS PSF measures students’ ability to segment three- and four-phoneme words into their individual phonemes (e.g., sat = /s/ /a/ /t/). The examiner orally presents the child with a word, and the child responds with all or some of the component parts. The student’s score is the number of sounds attempted minus the errors within 1 minute. The PSF 1-month alternate-form reliability is .88 in May of kindergarten, and the predictive validity from Spring of kindergarten to reading connected text in Spring of first grade is .62 (Good et al., 2004).
First Grade
First grade students received four individually administered assessments: Letter Naming and PSF (described earlier) and Nonsense Word Fluency from the DIBELS, and WIF (L. S. Fuchs et al., 2004).
DIBELS Nonsense Word Fluency (NWF) measures the child’s emerging sense of the alphabetic principle and the ability to use this concept to decode nonsense CVC (consonant vowel consonant) and CV (consonant vowel) words. Students are presented with a paper with these patterns and directed that they may read them as one word (e.g., dif is /dif/) or as individual sounds (/d/ /i/ /f/). Either method would be scored as 3 points. Students are given 1 minute to read as many of these nonsense words as possible and the final score is the number of sounds attempted minus errors. The one-month test–retest reliability for the NWF in first grade is .83 (Good et al., 2004). The predictive validity of the NWF for reading text (Oral Reading Fluency [ORF]) is .82 in the spring of first grade (Good et al., 2004). First grade students who identified 25 or fewer sounds in 1 minute in fall were considered at risk.
WIF consists of word lists developed by L. S. Fuchs et al. (2004), which contain 100 isolated words randomly selected from Dolch preprimer, primer, and first grade high-frequency word lists. Students are presented with this list and asked to read the words as quickly as they can. The score is the number of words read correctly within 1 minute, a measure of automaticity of reading skill. L. S. Fuchs et al. report alternate test form reliability of .91 from two consecutive months. The alternate-test form stability coefficient for two consecutive weeks was .92 in the beginning of first grade. Based on findings from the development studies of this measure, first graders who identified 8 or fewer words in fall were considered at risk for reading disabilities.
DIBELS ORF measures reading rate and accuracy. Passages for ORF were administered three times per year to first and second graders beginning in winter of first grade: fall and winter to determine risk status for Tier 2 intervention, and as an outcome in spring of each year. It was also administered every 3 weeks to students in the Tier 2 interventions to monitor progress. The DIBELS ORF passages are used nationally extensively to identify students who need instructional support and to monitor educational progress. Benchmark passages are available for each grade level for fall, winter, and spring of each year. The student is presented with three different passages and asked to read aloud for a period of 1 minute. Scores are calculated as the number of words attempted minus errors, and the median score is used for analysis. Alternate-form reliability ranges from .79 to .94 across measures, and interrater reliability for the first grade sample is .95. Second grade students with an ORF score of 35 or fewer words per minute in fall were considered at risk.
Outcome Measures
ORF (described earlier), subtests of the Woodcock Reading Mastery Tests–NU (WRMT; Woodcock, 1998), and the Gray Oral Reading Test–4 (GORT-4; Wiederholt & Bryant, 2001) were used as outcome measures at the end of second grade. The WRMT Word Identification subtest required students to identify words in isolation, the Word Attack subtest required students to apply phonic and structural analysis to pronounce pseudowords, the Vocabulary subtests required students to identify synonyms, antonyms, and analogies to written words, and the Passage Comprehension subtest required students to read one or two sentences silently with a missing word signaled by a blank space, and to supply a word that made sense in that space. Split-half reliability estimates for Grade 2 on these subtests ranged from .89 to .92.
The GORT-4 was selected to generate standardized scores for reading fluency and comprehension of paragraph to page-length passages. The GORT-4 assesses students’ reading accuracy, rate, and comprehension on passages of 50 to 200 words in length. Students read increasingly difficult passages orally, while the examiner notes errors and miscues. Following oral reading, the examiner asks passage-dependent comprehension questions that tap a range of comprehension types, from literal to inferential. The reliability of the GORT-4 at ages 8–10 ranges from .89 to .91.
Procedures
Determining Risk Status for Entering and Exiting Tier 2
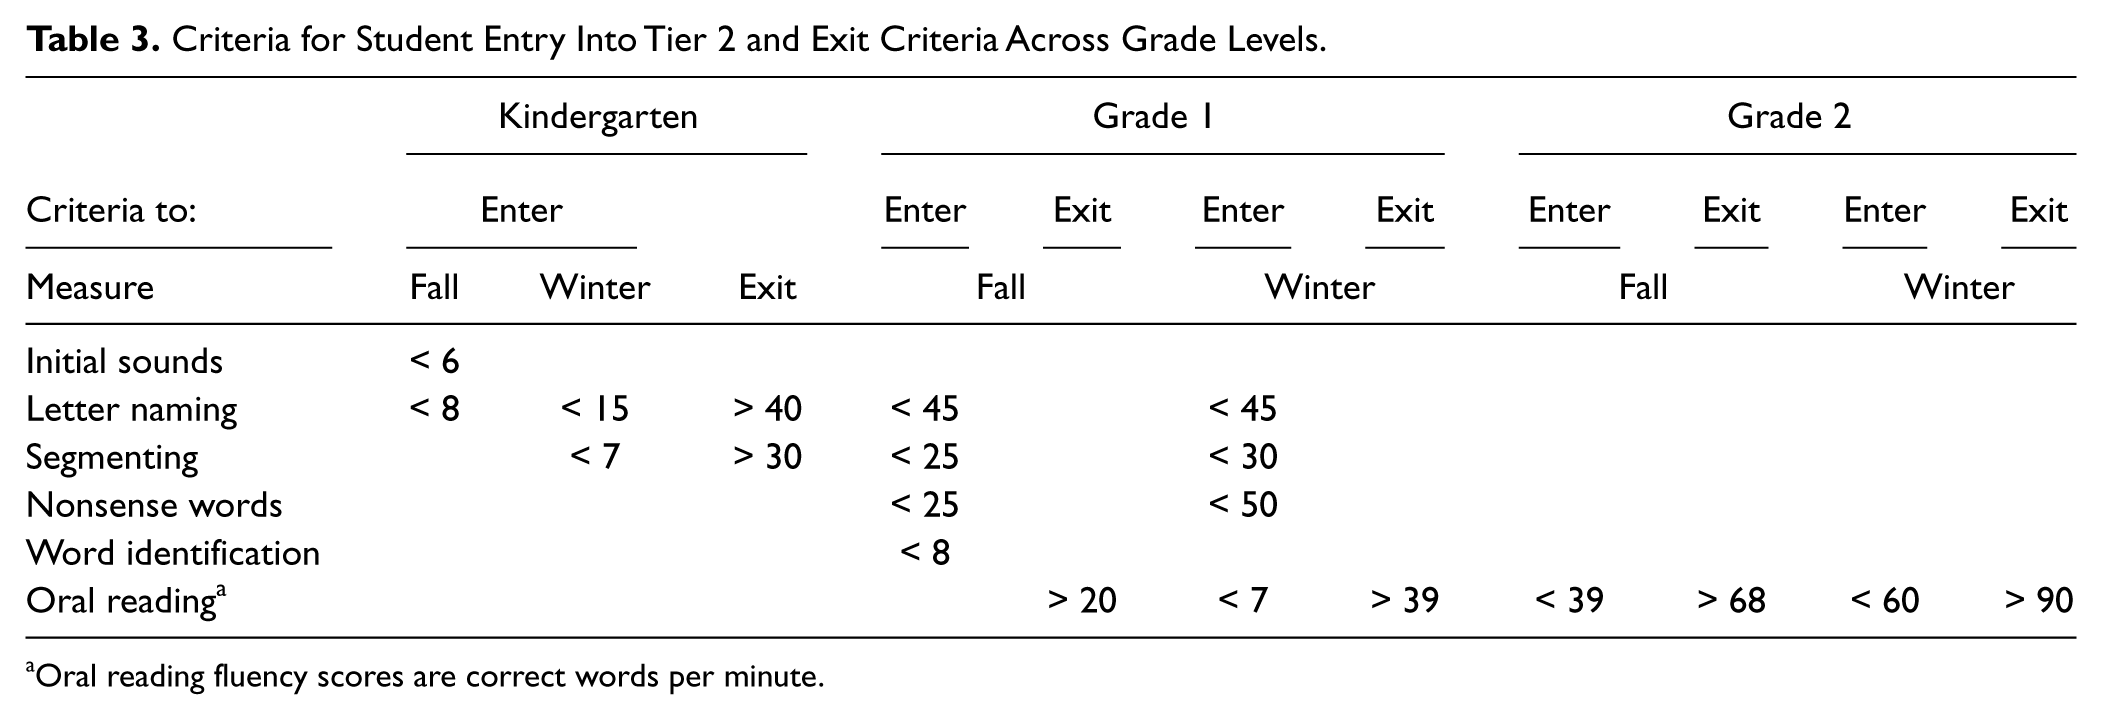
Students were determined to be at risk if they fell below grade specific benchmarks in the fall or winter of the academic year (see Table 3). For kindergarten and first grade students, a combination of early literacy measures was examined—Fluency in Initial Sounds, Letter Naming, Phonemic Segmentation, Nonsense Words, and Word Identification—and students scoring below these benchmarks participated in Tier 2 as their assigned condition gained access to the RtI model. Fluency in oral reading of connected text (DIBELS ORF) was an additional criterion used to determine risk status beginning in the winter of students’ first grade year. Our cut points for selecting students for Tier 2 were higher than those recommended in the DIBELS manual because of our earlier studies (O’Connor et al., 2005; O’Connor & Jenkins, 1999) that found the published criteria too low to identify nearly all (90%) students who later demonstrated poor reading achievement in first or second grade. Second grade students were screened for risk status exclusively with the DIBELS ORF measure. Table 3 delineates the measures and benchmarks by grade level for entering and exiting Tier 2 in fall and winter of each grade.
Criteria for Student Entry Into Tier 2 and Exit Criteria Across Grade Levels.
Oral reading fluency scores are correct words per minute.
In our largest school, 85% of the kindergarteners would be considered at risk based on one of the three measures (LNF, ISF, PSF). We selected for recruitment those students with scores that met selection criteria on all three measures.
Informed consent letters in English and Spanish were sent home via the school site to obtain permission for the student to participate in the intervention. Across the five schools and two grade levels of recruitment for intervention, parents of only 5 students either refused or did not respond. Once parental consent was obtained, student informed assent was solicited. Students were folded into the pool of “at-risk and eligible for Tier 2” status based on scores collected in the fall and/or winter. Thus some students with access to RtI in K or Grade 1 began Tier 2 in the fall of their access year, and others exceeded criteria in fall but met criteria for Tier 2 later that year or the following year as their scores failed to keep up with peers.
Determining Response to Tier 2 Intervention
Researchers have used several methods for determining response. For consistency across years, we used the criteria in Table 3 not only to identify students for Tier 2 intervention but also to determine when to return them to Tier 1 instruction only. Tier 2 participation was fluid, with new students folded into Tier 2 at any time their scores fell below the Table 3 benchmarks. Students who received Tier 2 intervention were monitored every 3 weeks using alternate forms of the measures that were used to select them for Tier 2. When for two consecutive cycles students surpassed the selection criteria for the succeeding screening cut points, they stopped participating in Tier 2 intervention. For example, the cut point for selecting students for Tier 2 at the beginning of Grade 2 is reading fewer than 39 words correctly per minute on the ORF. If Tier 2 Grade 1 students read more than 39 words per minute correctly on two consecutive ORF monitoring cycles during the winter or spring of Grade 1, they were released from Tier 2. Returning to Tier 1 only was not a permanent decision for many of the students, who were returned to Tier 2 if they failed to make sufficient progress in Tier 1 to surpass the cut points in later screenings.
Risk status of all students with access to Tier 2 was reassessed in the fall and winter each year. In addition to meeting the grade level risk criteria defined in Table 2, students also had to have been present in these schools in Year 1, although they did not need to be among students who were identified for Tier 2 during the first year of the study. We did not fold in to our sample students who were new to the school sites in Year 2 or 3. Students who were part of the intervention in the prior year continued in the intervention until they met the exit criteria in Table 3. Students who had access to Tier 2 in kindergarten or first grade entered Tier 2 in fall or winter of any eligible year based on these screening measures.
Tier 2 Intervention
The Tier 2 intervention consisted of small group (two or three students) instruction for 20 minutes in kindergarten and 25 to 30 minutes in first and second grade, four times per week. The intervention was offered from September through April of the academic year and delivered by project staff during the regular school day. Students were pulled from their general education classroom according to classroom schedules such that Tier 2 instruction supplemented, rather than supplanted, English language arts instruction or ELL programming.
Kindergarten
Tier 2 activities were drawn from Ladders to Literacy (O’Connor, Notari-Syverson, & Vadasy, 2005) to improve oral language, phonological awareness, letter knowledge, and integration of the two to develop the alphabetic principle. These activities have generated significant improvement in phoneme awareness for low-skilled students in field trials (D. Fuchs et al., 2001; O’Connor, Notari-Syverson, & Vadasy, 1996) and have shown evidence as an effective Tier 2 intervention in kindergarten (O’Connor et al., 2005; Vaughn et al., 2003).
Alphabet letters and their most common sounds were introduced at a rate of one or two letters per week, depending on student progress. Phonemic awareness activities began with saying words slowly so that students could hear the individual speech sounds within one-syllable words. Most words were represented with pictures and objects to make them more concrete, teach the names for objects, and enable students who were ELL to participate more easily. Students generated a one-sentence message that was written by the Tier 2 teacher and used for finger-point reading and for identifying letters and sounds that had been taught.
Letters and sounds were integrated with first sound activities so that students could begin to apprehend the alphabetic principle, and by December letters were used in onset-rime blending and segmenting and students manipulated letters on cards to represent where the letters would occur in a word. Students also began writing a letter to represent a sound routinely in lessons.
By March students segmented words into three phonemes and represented all phonemes in words with letter tiles in an activity called Segment-to-Spell. We increased the difficulty of activities based on observations of students in groups and their scores on the progress monitoring measures. Students whose progress exceeded our cut points for beginning of first grade were dropped, or exited, from Tier 2, but were monitored on the same schedule as other participants to ensure that they maintained the levels they achieved during the treatment.
First grade
Tier 2 in first grade was based on Sound Partners (Vadasy et al., 2005) and included letter–sound, decoding, sight word identification, and reading of sentences and decodable books in small groups for 25–30 minutes four times weekly. These activities have generated significant improvement for low-skilled first and second grade students when delivered as intensive, supplemental instruction (Vadasy, Jenkins, Antil, Wayne, & O’Connor, 1997; Vadasy, Sanders, & Tudor, 2007).
Each lesson contained multiple activities. First, a new letter or letter combination was introduced about every two lessons and students reviewed previously taught letters and patterns. Phonemic awareness activities began with auditory blending and segmenting in fall, but were phased out as students mastered these skills and were replaced with spelling and writing activities, in which students focused on letters and patterns they had learned and decoding words. These reading and spelling activities provided practice opportunities to apply the new and reviewed letters and patterns. High frequency sight words were introduced through a cumulative introduction technique that included frequent review. Reading of a decodable sentence was introduced during Lesson 3, and by Lesson 9 at least two sentences were read daily. To provide more practice reading sentences and begin story reading, the Bob Books (Maslen & Maslen, 2000) were used throughout Tier 2, along with the Decodable Books series from Open Court. These books begin with controlled vocabulary (e.g., “Mac had a bag and a dog”) and become more various in vocabulary as students progress through the sets. Midway through first grade, about 10 minutes of the Tier 2 lessons focused on reading and rereading decodable books. Word endings and rules such as “magic e” were also included midway through the year. Most groups did not complete a lesson in a single session; on average students completed between 70 and 80 lessons in Sound Partners.
Second grade
Tier 2 lessons in second grade included many of the first grade activities (i.e., word study, reading and rereading books at their current reading level, and brief spelling and sentence-writing opportunities), but also brief lessons on word meanings and comprehension checks. The materials for these lessons included leveled reader series (e.g., I Can Read Books; see Note 1) and word patterns drawn from Teaching Word Recognition (O’Connor, 2007). Half of each lesson was devoted to reading and rereading text, one-third to word level reading and writing, and about 5 minutes to comprehension strategies (e.g., main idea, searching for details, and finding clues for making inferences), justifying responses with sentences in text, and sentence writing. These lessons were developed for this study and used across Tier 2 groups; however, the level of materials varied depending on students’ rate of progress.
Fluidity Across Tiers
In each grade, students receiving Tier 2 who scored above the risk range for two consecutive screening periods were released from intervention but continued to be monitored throughout the year. Likewise, students who fell below the cut points on fall or winter measures administered to all students (including students who were initially labeled typically developing readers) were folded into Tier 2 instruction. Thus, our Tier 2 sample received intervention as needed (approximately the lowest 25% at each measurement cycle), but only about 12% of the sample participated in Tier 2 continuously during the 2 or 3 years they had access to the RtI model. Because our intent was to consider effects of access to RtI, rather than a set time period of intervention, eligible students received varying amounts of Tier 2 instruction over 1 to 3 years, depending on whether their access to RtI began in kindergarten or first grade. We present statistics on the amount of intervention students received in the Results section.
Tutors and Training
Tutors were hired and trained by project staff and included experienced special education teachers, classroom teachers, graduate students, and teacher aides. Across the staff, 61% of these individuals were tutors for the entire 3 years of this research; 88% were with the project for 2 or more years. The lead tutor in each school participated in 30 hours of training on reading development in Grades K–3 and instructional activities focused on components of reading. All tutors received training from the principal investigator (PI) in instructional delivery of the specific Tier 2 package for each grade level (Ladders to Literacy for kindergarten, Sound Partners for first grade, decodable books with fluency practice, and comprehension activities in second grade). Each year, the initial training lasted 4 hours and included a theoretical introduction of each activity, modeling of the activity, guided practice, independent practice in small groups with observation, feedback, and discussion of common problems. In addition to the teacher manuals that were part of the published curricula for Ladders to Literacy and Sound Partners, tutors received a teacher manual generated by the researchers. This project specific manual included detailed descriptions of student activities, teacher scripts, a pacing guide for daily lessons, a pacing guide for monthly progress based on average growth, and flow charts linking specific types and levels of activities to progress monitoring scores. This initial training was supplemented by 2-hour bimonthly follow-up training (again taught by the PI) where new activities were introduced, common issues noted during field observations were discussed, and additional practice provided. Project staff also met biweekly in small groups by school site and reviewed progress monitoring data and monthly lesson plans for each individual student. These reports and plans were reviewed and approved biweekly by the PI, lead instructional staff, and the project director.
Treatment Fidelity
An experienced classroom or special education teacher was designated as the lead tutor at each site. In addition to observing, supporting, and providing feedback to the project staff, the lead tutor oversaw weekly the progress of students and modifications to the monthly lesson plans. The lead tutor collected daily activity logs completed by tutors for each of the small groups, and these were reviewed by the authors. In reviewing the activity logs, we examined completion of the each of the steps/activities outlined in the teacher scripts, and progress through the lesson sequence. Progress below the pacing guidelines triggered a conference where activities and/or pacing were changed. Depending on the grade level, progress through the curricula was defined as shifts from phonological to phoneme-level activities (kindergarten: Ladders to Literacy), successful completion of mastery tests for blocks of lessons (first and second grade: Sound Partners), and movement through a series of leveled readers of increasing difficulty with 85% accuracy (second grade curricula).
Daily activity logs were entered into the annual database and included information regarding the minutes of compiled treatment, the activities completed within the lessons, and the tutor’s assessment of the child’s performance. These activity logs were compared with observations of tutors conducted by the PI, instructional staff lead, and the project director. The fidelity observations were specific to each grade level curricula and included direct actions on the part of the tutors for each segment of the lesson. Fidelity was computed as a percentage of all observed actions compared to all actions expected. If any observation fell below 85% fidelity, the tutor was provided coaching and feedback, followed by coteaching with the lead tutor until acceptable fidelity was reached. Fidelity observations were collected every 6 weeks on all tutors for each of the 3 years of the study. During this time period, we observed three instances (4% of all observations) of less than acceptable fidelity in Year 1, six instances in Year 2 (3% of all observations), and no instances in Year 3. In each of these cases, fidelity immediately rose to acceptable levels after the corrective action noted was applied. The average fidelity rating for Ladders to Literacy was 93.26%, for Sound Partners was 92.06%, and for second grade curricula was 89.4%.
Results
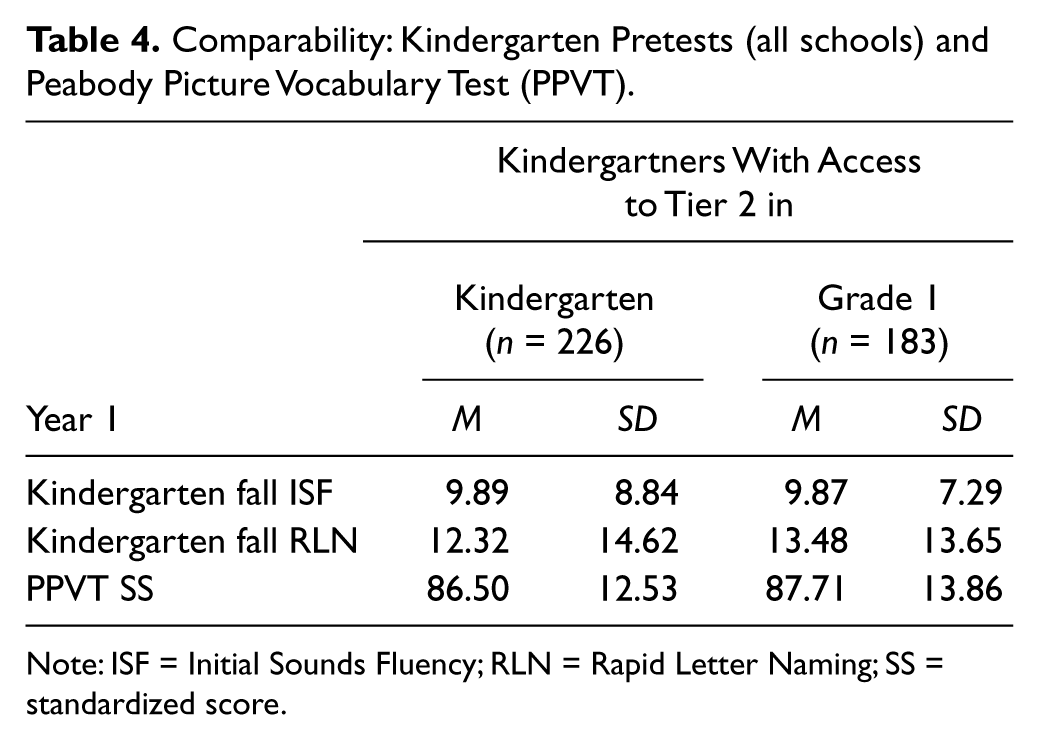
We tested for comparability across cohorts in three ways: differences between (a) kindergartners assigned to access in kindergarten or first grade, (b) receptive vocabulary across the three cohorts, and (c) second grade reading ability for the Tier 1 (untreated and not at risk) students across cohorts. First, we tested for potential differences between children in kindergarten in schools assigned to have access to Tier 2 in kindergarten (3 schools) or first grade (2 schools). Multiple analysis of variance (MANOVA) on fall early reading (ISF and RLN) and vocabulary measures in kindergarten was not significant, Wilks’s lambda F(3, 405) = 0.744, p = .476. Means and standard deviations are shown in Table 4.
Comparability: Kindergarten Pretests (all schools) and Peabody Picture Vocabulary Test (PPVT).
Note: ISF = Initial Sounds Fluency; RLN = Rapid Letter Naming; SS = standardized score.
Next, we tested for preexisting differences in vocabulary across the three cohorts (Grades K, 1, or 2 in Year 1). Analysis of variance (ANOVA) for receptive vocabulary (PPVT) in the first year of the study across conditions revealed no significant difference in language ability across cohorts, F(2, 1183) = 0.826, p = .43. Because we expected differences resulting from intervention, we also conducted ANOVA on second grade reading rate for students in Tier 1 across cohorts: the approximately 70% of each cohort considered typically developing readers. This test was not significant, F(2, 717) = 1.03. These typically developing readers did not participate in the intervention during the study years, and together these results suggest no differences across cohorts resulting from general class instruction (Tier 1) or student vocabulary across cohorts. Means and standard deviations are shown in Table 5.
Comparability: Tier 1 Only (average readers) Across Cohorts at the End of Grade 2.
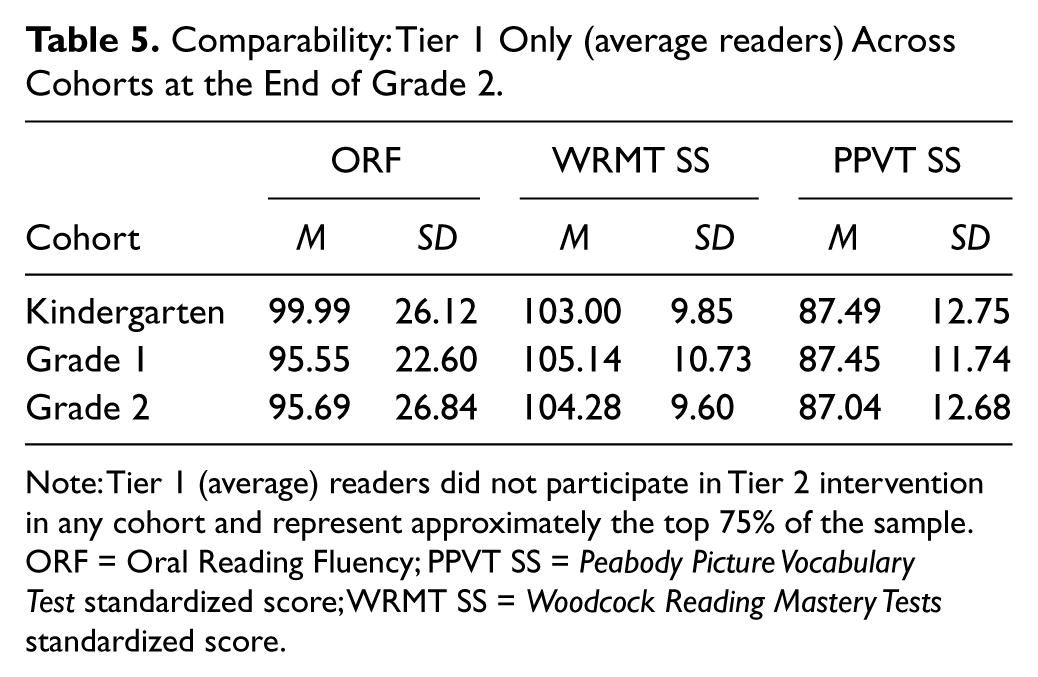
Note: Tier 1 (average) readers did not participate in Tier 2 intervention in any cohort and represent approximately the top 75% of the sample. ORF = Oral Reading Fluency; PPVT SS = Peabody Picture Vocabulary Test standardized score; WRMT SS = Woodcock Reading Mastery Tests standardized score.
Analytical Decisions
To determine whether a hierarchical model was needed, we first determined whether to nest the data within schools. A one-way random effects ANOVA was computed for the outcome variables as a preliminary step for a hierarchical linear modeling analysis. Data were analyzed at the student and school levels to provide information regarding variability of outcome measures at both levels and the reliability of the school means surrounding the population mean. At the student level, the basic equation is,
where B0j is the average reading performance at School j, and rij is the person-level effect, which is the deviation from the mean for Student i in School j. Reading Performanceij is the dependent variable, ORF, for Student i in School j. At the school level, the basic equation is,
where G00 is the grand mean for reading performance, U0j is the deviation from the mean for School j, and B0j is allowed to vary randomly across schools.
Estimates for the model are provided in Table 6. The grand-mean ORF achievement in the spring of Grade 2 was 57.75, with a standard error of 1.39 (95% CI = 55.03, 60.47). T-results were significant, suggesting the average ORF achievement was statistically different from 0, t(4) = 41.599, p = .000. At the student level, the variance component was 485.12. The variance component at the school level, 3.96, explained the deviation of each school’s average ORF achievement surrounding the grand mean. It is anticipated that 95% of the school means would fall between 53.85 and 61.65. The significance test was not significant, χ2(4) = 5.986, p = .199, indicating no significant variation in ORF performance across schools.
Results From the One-Way ANOVA Model; Outcome Variable Is Grade 2 Spring Oral Reading Fluency.
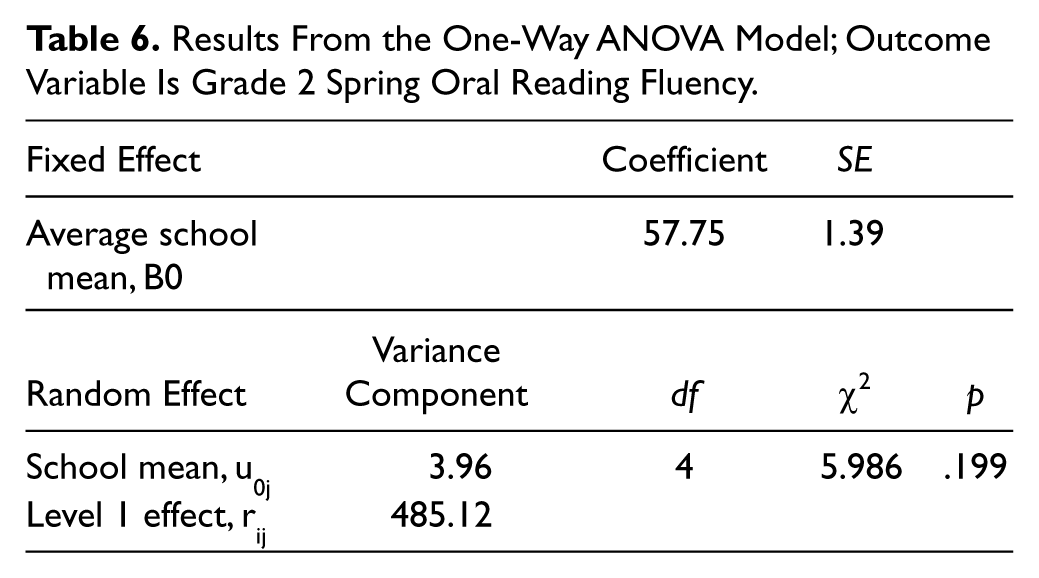
The intraclass correlation coefficient (0.0081) indicated that about 1% of the variance in spring ORF achievement was between schools. The reliability estimate of the sample means was 0.326 indicating moderate reliability. The above results suggest that an analysis across schools is unwarranted because of the limited variability at Level 2 (Raudenbush & Bryk, 2002). Because the classroom teacher and the Tier 2 tutor changed annually across the 3 years of the study, we could not consider further nesting of the data.
We did not use a growth model across cohorts because we had multiyear data for students in the RtI cohorts, but only Grade 2 data for the historical control. For the same reason, we did not covary for kindergarten scores, as these scores were unavailable for students who were first or second graders in Year 1.
Minutes of Tier 2 Intervention
Table 7 shows the average number of minutes of Tier 2 intervention received by students who had access to RtI in Kindergarten or first grade. Unlike dosage studies, in which students are assigned to a treatment to receive a specified numbers of minutes, participation in Tier 2 in this study was dependent on student RtI. Thus, students who were less responsive received more minutes of intervention than those who responded quickly to increased instructional intensity, and good responders returned to instruction in Tier 1 only.
Descriptive Statistics for Minutes of Tier 2 Intervention by Cohort and Access.
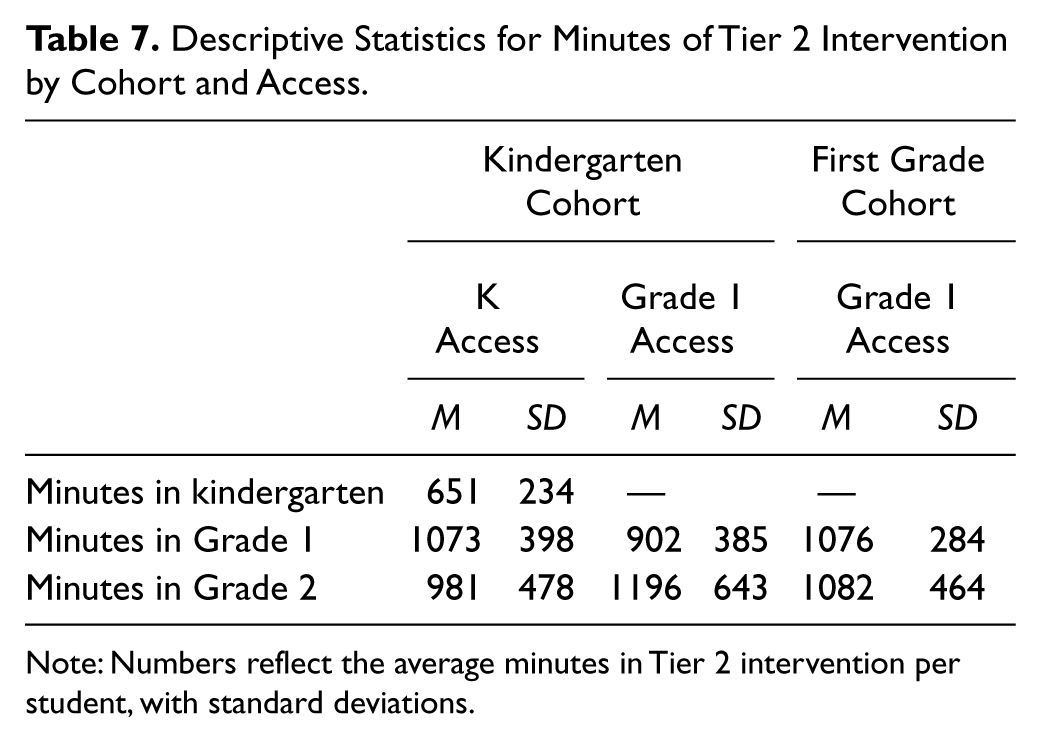
Note: Numbers reflect the average minutes in Tier 2 intervention per student, with standard deviations.
Because the students who were the least responsive received the greatest number of minutes in treatment, we did not expect minutes of Tier 2 to have a positive relationship with reading outcomes, and that is what we found. The correlation between minutes of Tier 2 and end of Grade 2 total score on the WRMT was –.30 for students with K access and –.28 for students with Grade 1 access.
Effects of Kindergarten Versus First Grade access to Tier 2 Intervention
Students were classified as kindergarten access if they had been assigned to the kindergarten (K) access cohort and received Tier 2 intervention, regardless of when they received Tier 2 intervention. This means that the K access cohort included students whose scores made them eligible for Tier 2 in kindergarten, and also students whose scores were above the cutoff in kindergarten, but who fell below first or second grade cutoffs and were included in Tier 2 when their scores met inclusion criteria. Likewise, students in the Grade 1 cohort received Tier 2 as needed in first and/or second grade as their first and second grade scores made them eligible.
In Grade 1 we compared reading achievement between students at risk for reading difficulties (i.e., scoring below time-dependent cut points) who had access to Tier 2 intervention as needed beginning in K or Grade 1 (results follow). In second grade, outcomes of students who had the opportunity to participate in RtI from K or Grade 1 were compared with the second graders in the same schools who were measured in Year 1, prior to implementation of the model (the historical control).
Effects on Reading in Grade 1
We conducted MANOVA on beginning and end of Grade 1 reading achievement for students at risk, using access to Tier 2 intervention in K or Grade 1 as the between variable. Because of collinearity among the WRMT subtests, we used the Total Reading score in these analyses; however, we report subtest scores also in Table 8. Fall reading achievement (NWF, WIF, and WRMT) favored students who had K access to RtI, Wilks’s lambda F(3, 238) = 3.721, p = .01, over students who began access to RtI in first grade. Effect sizes (using the pooled standard deviations) across the 3 measures were 0.72, 0.55, and 0.38, respectively, and averaged to medium effects (Cohen, 1988). By the end of first grade, outcomes (WIF, ORF, and WRMT) continued to favor students in the K start cohort, F(3, 238) = 4.072, p < .00). Effect sizes across the 3 measures were 0.30, 0.46, and 0.48, respectively, ranging from small to medium. Means and standard deviations for the two treated groups are shown in Table 8, along with scores for typical readers who consistently fell above cut points for inclusion in Tier 2 intervention.
Descriptive Statistics for Students Across Conditions in Grade 1.
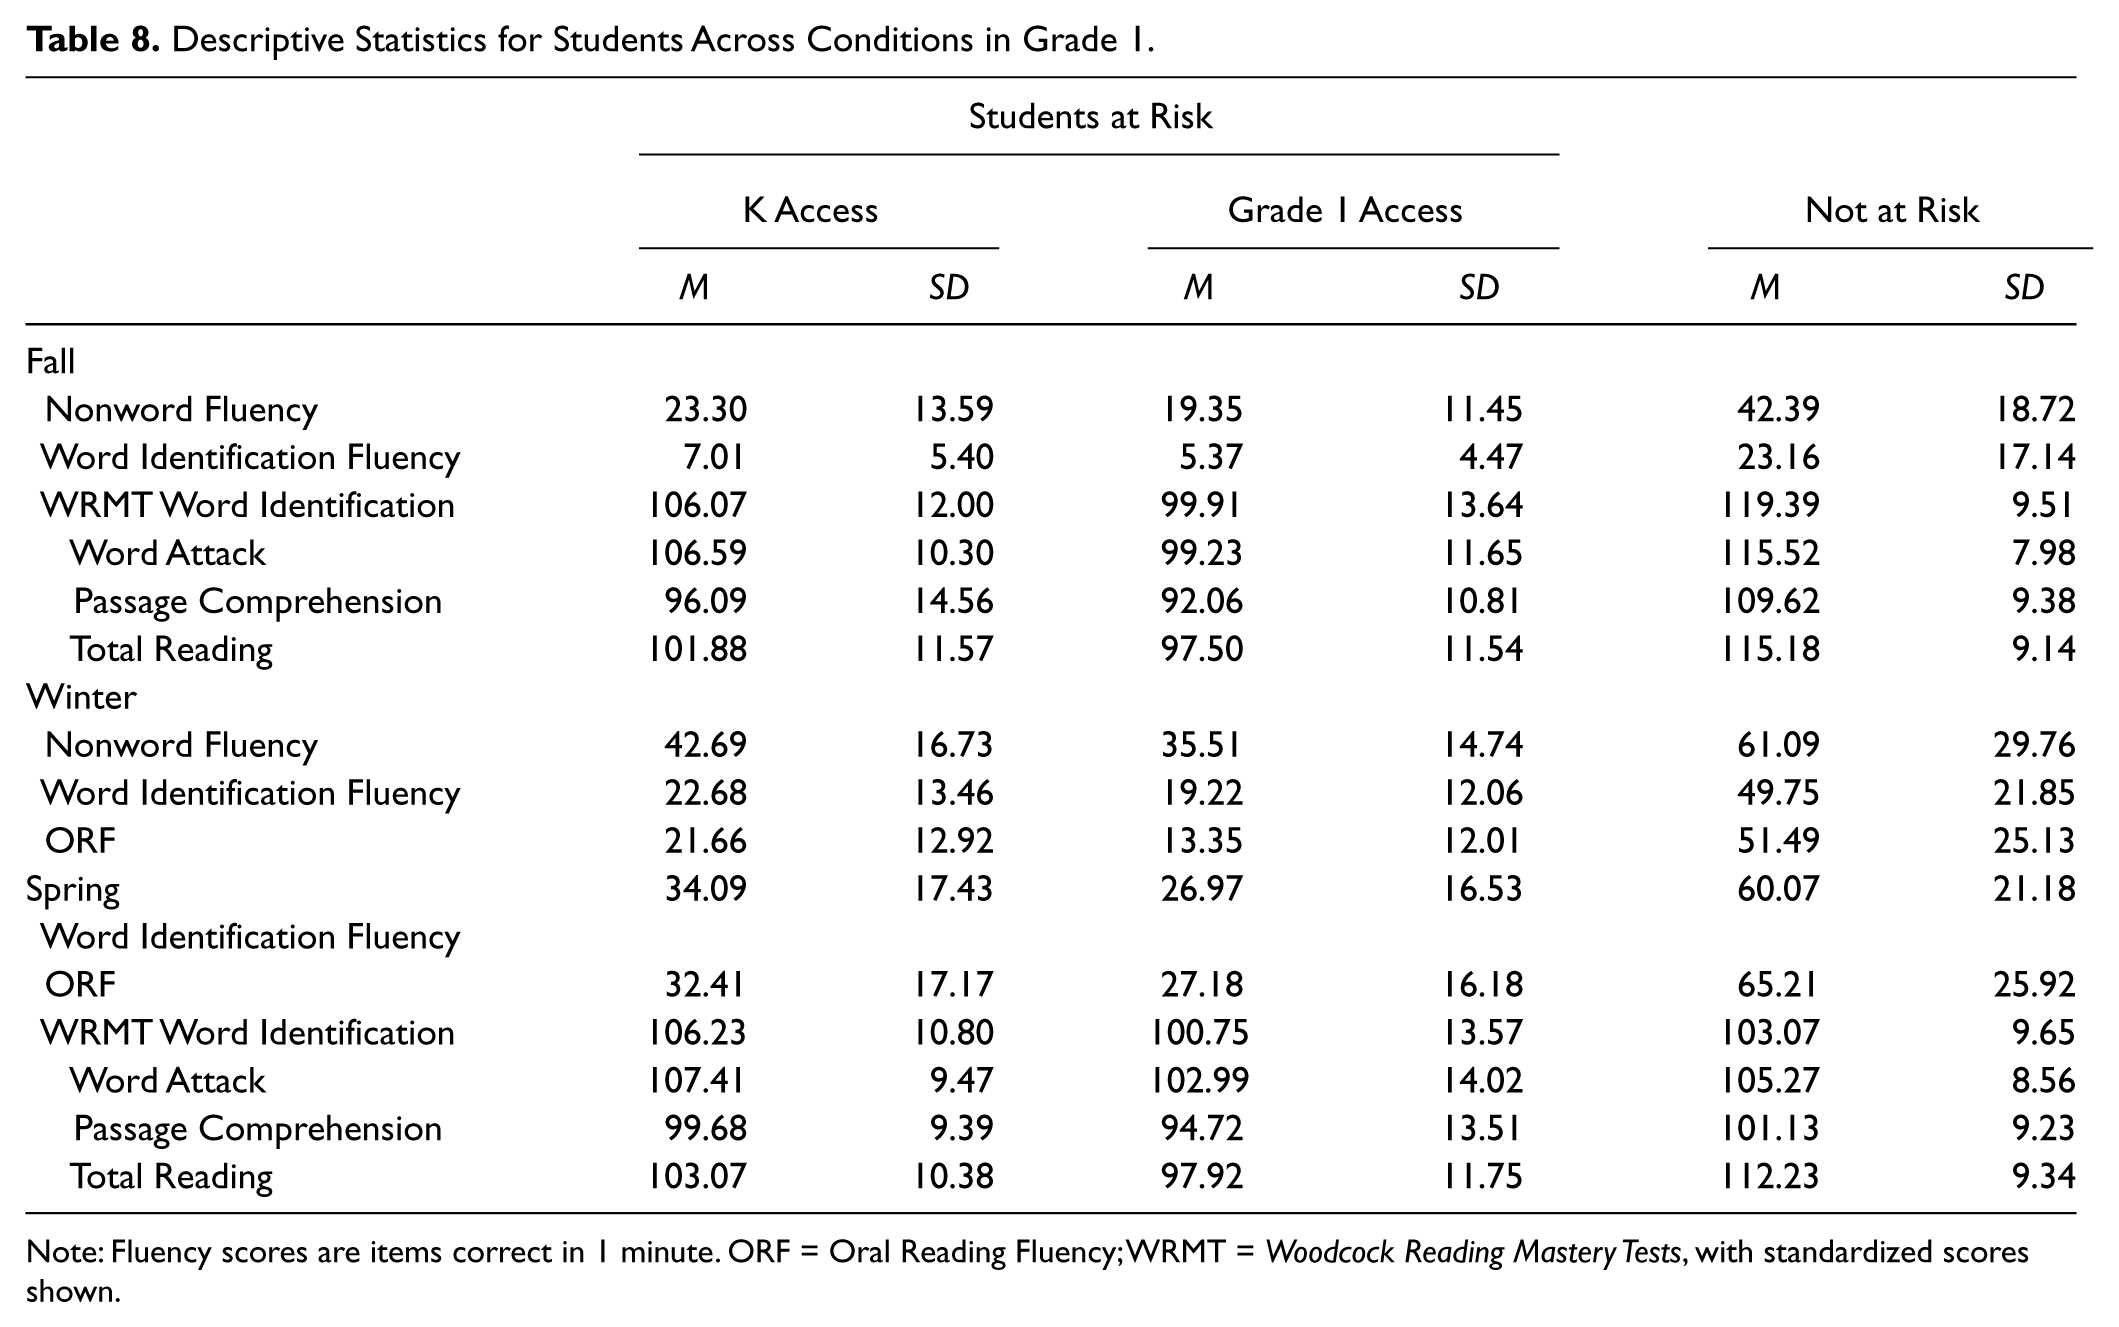
Note: Fluency scores are items correct in 1 minute. ORF = Oral Reading Fluency; WRMT = Woodcock Reading Mastery Tests, with standardized scores shown.
Effects in Grade 2
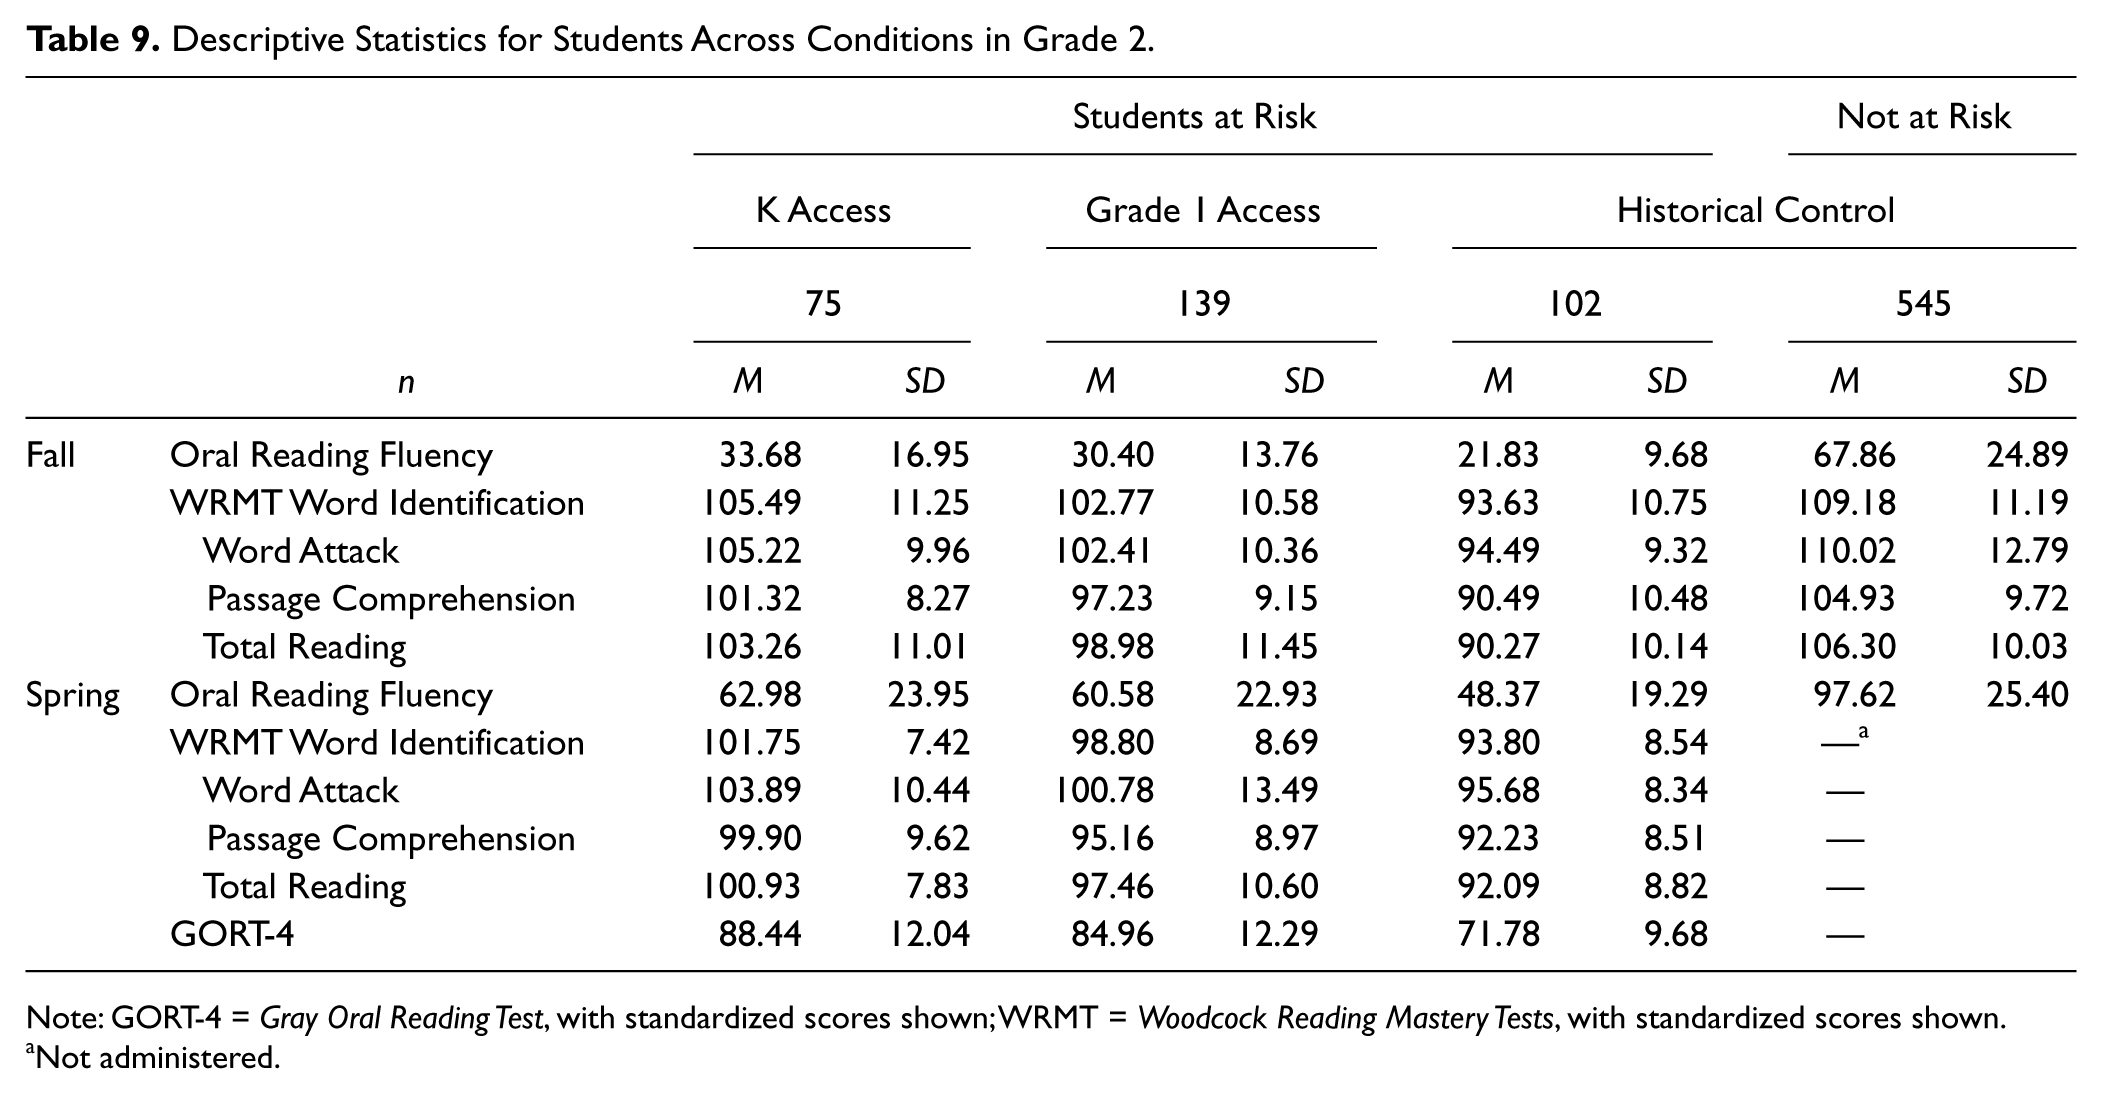
To test for second grade effects of K or Grade 1 access to RtI, MANOVAs followed by pairwise comparisons (using Bonferroni adjustments) were conducted between students at risk in each of the two treated samples and the historical Grade 2 control. Means and standard deviations for measures of ORF, WRMT, and GORT-4 are shown in Table 9.
Descriptive Statistics for Students Across Conditions in Grade 2.
Note: GORT-4 = Gray Oral Reading Test, with standardized scores shown; WRMT = Woodcock Reading Mastery Tests, with standardized scores shown.
Not administered.
In fall of Grade 2, MANOVA that included ORF and WRMT was significant, F(4, 602) = 18.266, p < .01. Pairwise comparisons revealed that both treatments outperformed the control significantly for each measure, and the K cohort performed significantly better than the Grade 1 cohort on the WRMT, with an effect size of 0.38. By contrast, the effect size between at-risk students with K access and the control group was large (effect size = 1.23).
At the end of second grade, MANOVA that included ORF, the WRMT, and the GORT-4 showed that both treated groups outperformed the control on all measures, F(6, 600) = 12.31, p < .01. Scores of students with K access to RtI did not differ significantly from Grade 1 access on reading achievement at the end of Grade 2, although the effect size of the difference between K and Grade 1 on the WRMT was over 0.3. Effect sizes between the experimental groups and the control were consistently larger than 1.
Disaggregating access by Responsiveness
Another way to consider the difference in K versus Grade 1 access is by returning to Table 2, which shows the number of students who received Tier 2 by cohort and access year over time. When we examine the K access children, 34 of the 75 students (8 + 11 + 15) met exit criteria by the close of second grade (45% of this sample). For students with Grade 1 access, whether they were in kindergarten or first grade in Year 1, 36 (11 + 13 + 5 + 7) of the 139 students (40 + 7 + 30 + 62) met exit criteria by the close of second grade (26% of this sample). Of these 36 “exiting” children, two thirds of them (from the wait list kindergarten cohort) were considered not at risk in kindergarten based on our progress monitoring: They began to need assistance only when first grade reading demands increased. Although we do not know the levels of kindergarten risk for the first grade cohort, we can reasonably assume that a proportion of these children were struggling in kindergarten for a full year prior to receiving first grade Tier 2 intervention.
Disaggregation of the students who entered and exited in first grade lends support to this assumption. A total of 69 students (29 + 40) from the monitored kindergarten cohort entered Tier 2 intervention as first graders. From these students receiving Tier 2 first grade intervention, 22 (11 + 11) met exit criteria: 4 who were placed as kindergartners, and the remaining 18 after just one year of first grade intervention. In all, 32% of these students exited from Tier 2. Compare this with the first grade cohort whose first access to RtI was Grade 1; only 17% (5 of the 30 students) met criteria to exit Tier 2 intervention.
Perhaps the most dramatic comparison between the K and Grade 1 cohorts is the number of students who were found at risk for RD for the first time in second grade. A total of 62 children from the Grade 1 cohort who did not meet criteria in first grade were eligible for Tier 2 by the beginning of second grade; yet only 13 (6 + 7) from the K cohort qualified for the first time in second grade. Furthermore, of the second graders receiving Tier 2 instruction, 30% of the K cohort (15 + 13 / 56 + 36) were able to meet exit criteria at the end of the year, whereas only 8% (7/87) of the Grade 1 cohort was able to do so. This analysis for students who were ELL is described below.
Effects for Students Who Were English Learners
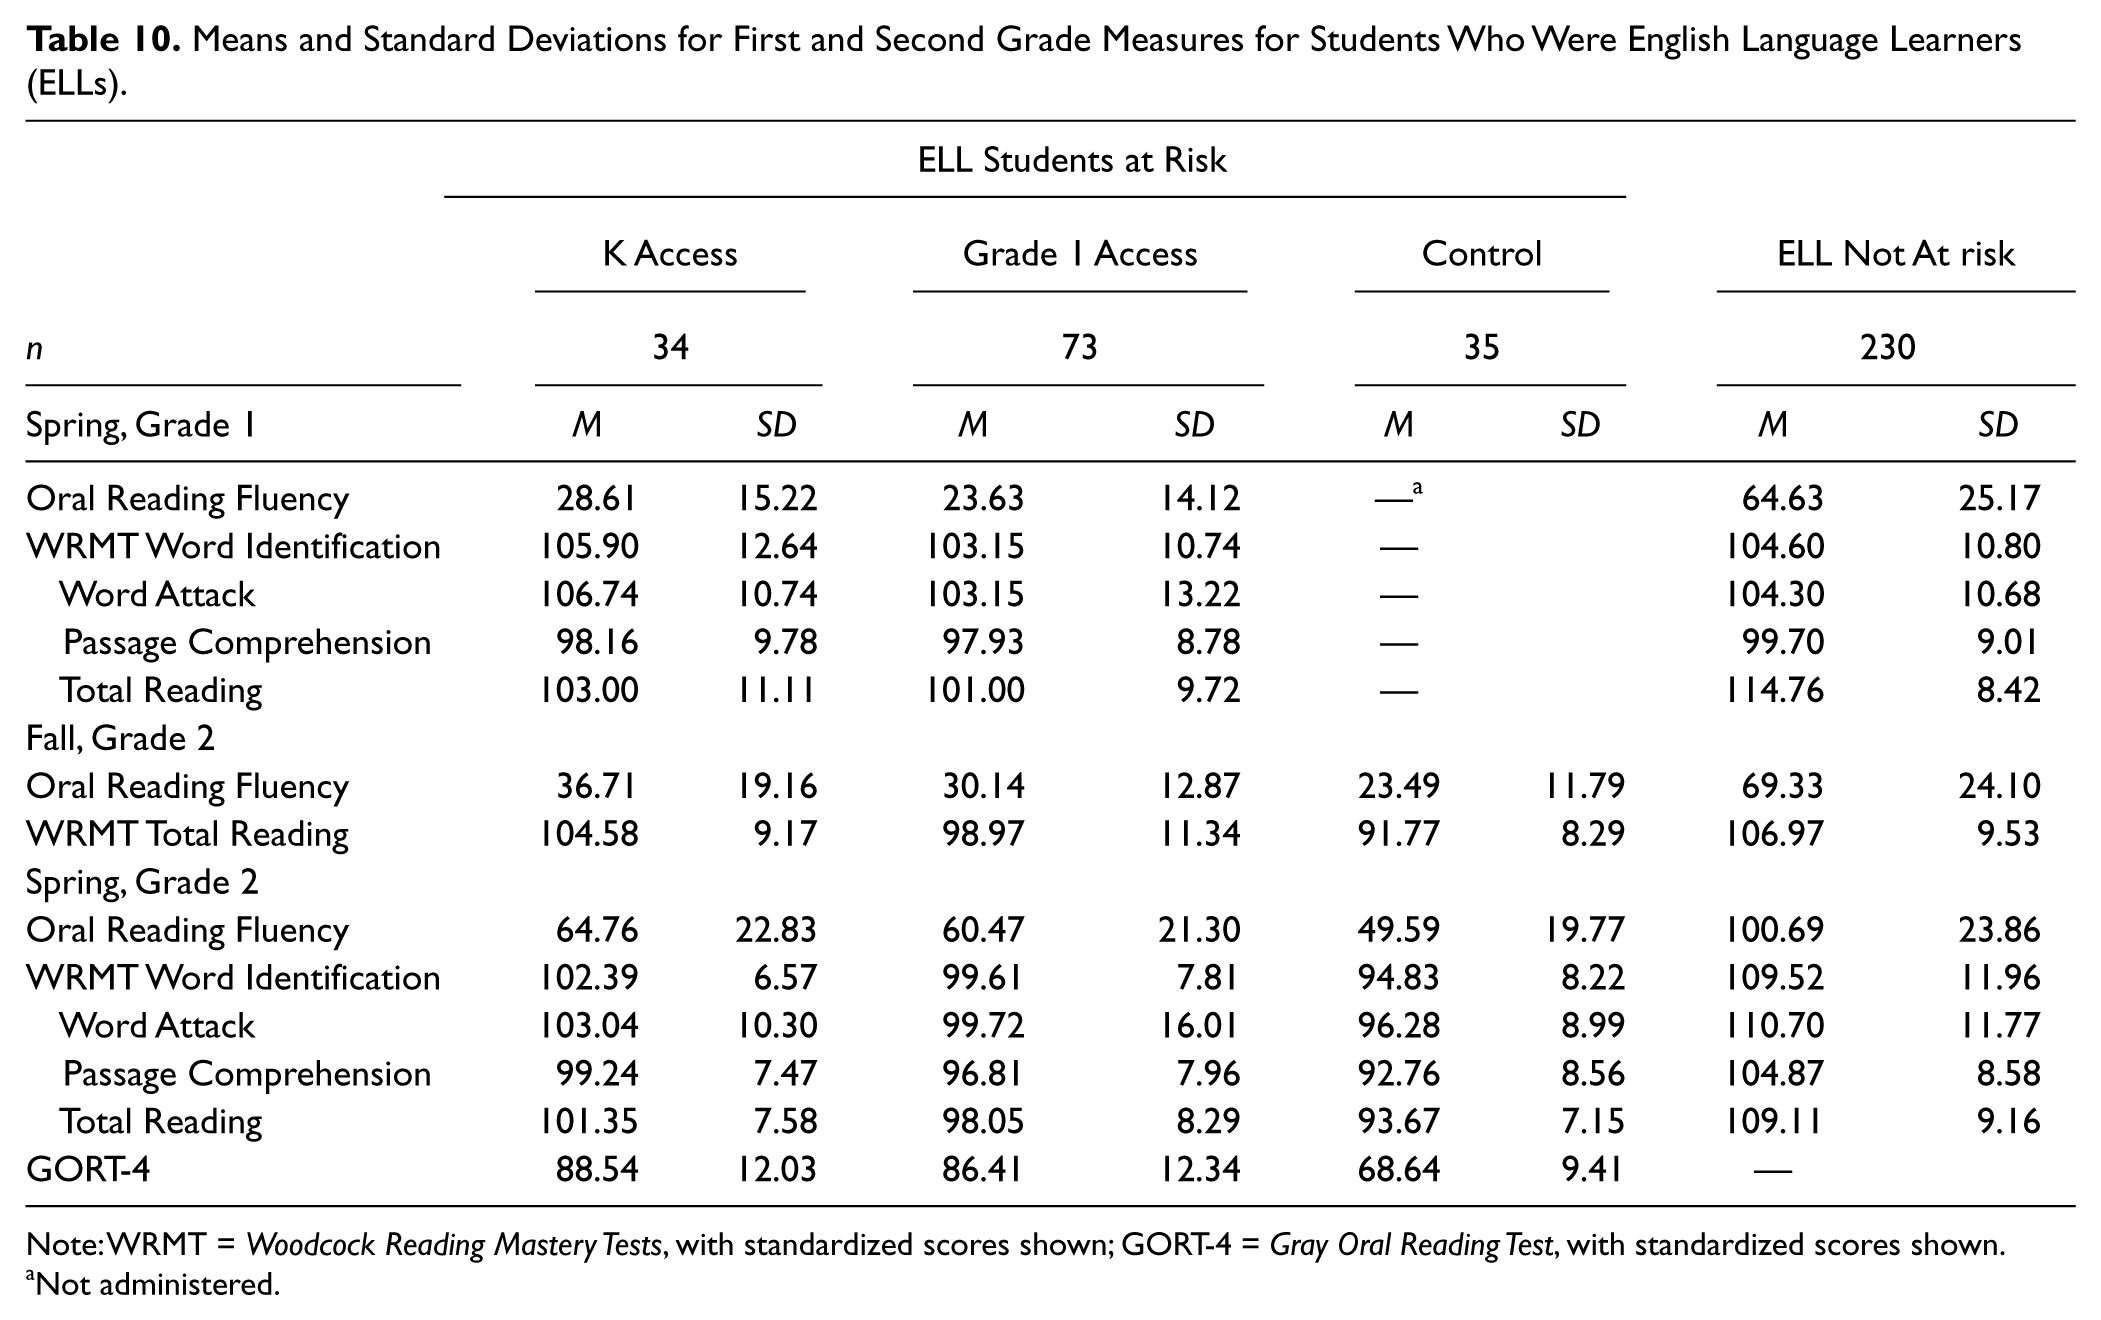
At the end of first grade, ELL students who began access to RtI in K or Grade 1 did not differ statistically, Wilks’s lambda F(3, 103) = 1.61. By the beginning of second grade, ELLs with K access performed significantly better on ORF and the WRMT than those with Grade 1 access, F(2, 104) = 3.76, p < .05, and by the end of second grade, this advantage remained for the WRMT, F(1, 105) = 4.03, p < .05, but not for ORF or GORT-4 scores. RtI benefited students who were ELL regardless of K or Grade 1 access over ELL students in the control, F(6, 248) = 5.58, p < .01, partial η2 = .12. Table 10 shows means and standard deviations for students by condition.
Means and Standard Deviations for First and Second Grade Measures for Students Who Were English Language Learners (ELLs).
Note: WRMT = Woodcock Reading Mastery Tests, with standardized scores shown; GORT-4 = Gray Oral Reading Test, with standardized scores shown.
Not administered.
For ELL students, the patterns of entering Tier 2 (see Table 2) were similar to those of native English speakers, but the success rates were higher. Of the 37 (25 + 12) K access ELL students who received Tier 2 intervention, 18 (7 + 6 + 5) or 49% exited by the close of second grade. For students with Grade 1 access, 22 (4 + 8 + 4 + 6) of the 74 (23 + 5 + 16 + 30), 30% of this sample, met exit criteria by the close of second grade. Examination of the students found to be at risk for RD for the first time in second grade reveals that approximately half of the K cohort (5 / 6 + 7) and half of the Grade 1 cohort (30/60) were EL.
Identification of Students for Special Education
The final question is whether access to Tier 2 intervention in kindergarten or first grade changes the proportion, pattern, or characteristics of students who are identified for special education. In comparing the RtI cohorts to a historical control for special education proportions of incidence and ethnic representation, we limited our consideration to students with classifications of specific learning disabilities and speech/language disabilities, as these conditions would be those most amenable to the influence of RtI. This decision eliminated about 20% of students receiving special education in each cohort with classifications such as hearing impaired, moderate cognitive impairment, or autism.
For the historical control group of 381 second graders, 20 were placed in special education by the end of second grade, a proportion of 5.25%. Of these students, 12 were placed prior to second grade. Regardless of placement grade level, only half (10) of these special education students met the at-risk criteria based on ORF (39 or less wcpm) in second grade. Using this same criterion for at risk status, 102 of the historical control second graders were deemed at risk. Among these at-risk students, 9.2% of the Hispanic, 7.69% of the African American, and 16.6% of the White students were placed. Among the “not at risk” historical control students (n = 279), 3.28% of Hispanic, none of the African American, and 9.09% of White students were placed in special education by the end of second grade.
For the sample of RtI access students (n = 214), 11 were placed by the end of second grade, a proportion of 5.19%. Of these 11 students, 6 were placed in special education prior to second grade. Regardless of placement grade level, all but one of these 11 students met the at-risk criterion based on ORF (less than 39 wcpm) in the beginning of second grade. Among the total sample of students found to be at risk during this study, 5.98% of Hispanic, 5.00% of African American, 7.69% of White, and 14.29% of other were placed in special education by the end of second grade.
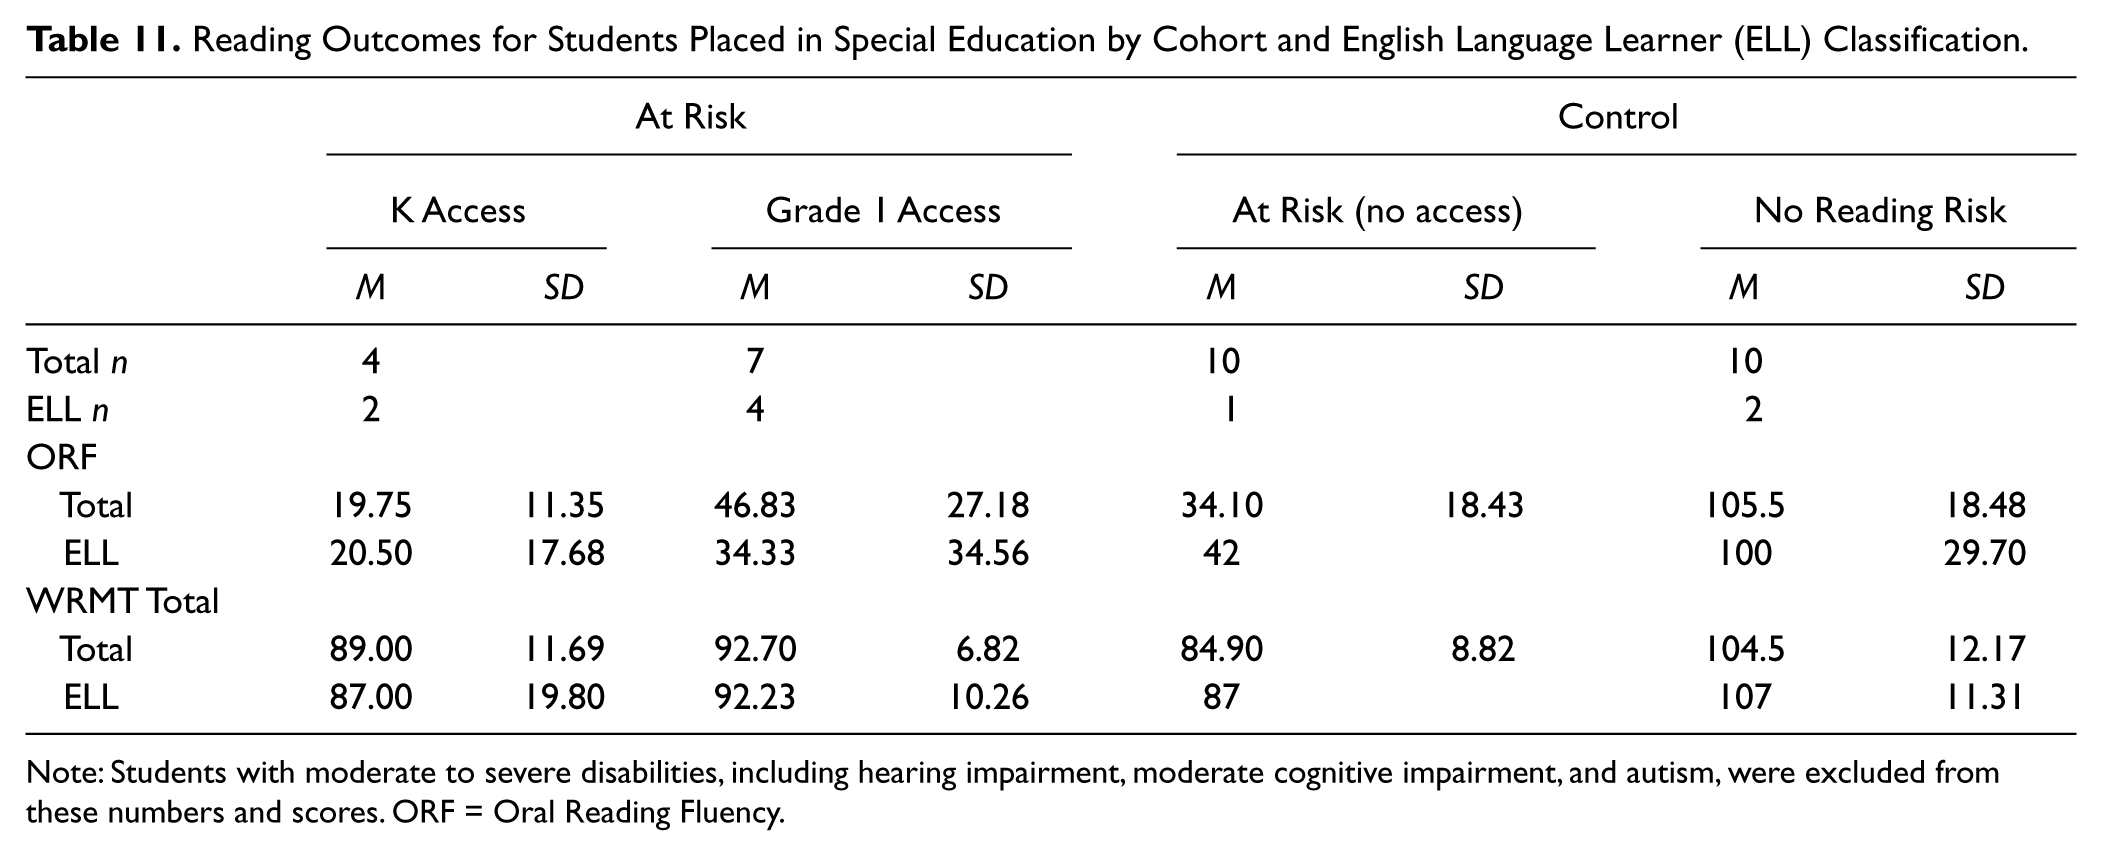
Regarding the impact of K versus Grade 1 access on special education placement, 4 of the 68 students with K access to RtI were placed in special education. These students (2 Hispanic, 1 African American, and 1 White) all met the second grade criterion of at risk. With one exception, all were placed at the end of second grade. For the 144 students with Grade 1 access, 7 were placed in special education. Among these 7 students, all but 1 were placed prior to the end of Grade 2. Reading outcomes for students placed in special education by cohort are shown in Table 11.
Reading Outcomes for Students Placed in Special Education by Cohort and English Language Learner (ELL) Classification.
Note: Students with moderate to severe disabilities, including hearing impairment, moderate cognitive impairment, and autism, were excluded from these numbers and scores. ORF = Oral Reading Fluency.
Discussion
As other studies have found (Connor et al., 2007; O’Connor et al., 2005; Simmons et al., 2008; Vaughn et al., 2009), participation in an RtI model of early reading intervention improved reading outcomes over high-risk students in the same settings prior to implementing a tiered intervention model (our same-schools, Grade 2, historical control), whether access became available in K or Grade 1. These differences were robust. Four new findings were noteworthy: (a) although reading outcomes between students with access to RtI in K or in Grade 1 diminished over time and did not differ by the end of second grade, a higher proportion of students with K access reached exit criteria before the end of second grade; (b) students who were ELL showed lasting benefits from K access, in both reading outcomes and proportion reaching exit criteria; (c) 35% of students demonstrated reading risk for the first time in second grade, and proportions did not differ between ELL and native English speakers (NES); and (d) proportions of students identified for special education with and without access to RtI did not differ, but in the RtI groups identified students mirrored school ethnicity demographics, and most had reading scores that demonstrated academic difficulties.
Our study was designed to determine whether beginning access to Tier 2 interventions as needed in K would improve long-term outcomes over beginning in Grade 1. The answer seems to be that it depends on which outcomes are most valued. Beginning in K gave students a boost that lasted through the beginning of Grade 2, but this advantage diminished between the treated samples over the second grade year. At the end of first grade, K access to Tier 2 improved reading outcomes over Grade 1 access by over one third of a standard deviation on the WRMT. By the end of second grade, the difference because of K access was less than one fourth of a standard deviation and was no longer significant.
Examining the proportion of students initially at risk who attained adequate reading skills (> 90 wcpm on ORF) by the end of Grade 2 tells another story. In the K access cohort, 45% of students who received Tier 2 met exit criteria by the end of second grade, compared to 26% of students with Grade 1 access. Of the students identified as at risk at the beginning of Grade 2 in the historical control, only 2% met the exit criteria at the end of the year. These statistics suggest that earlier intervention shrinks the proportion of students who remain in high-risk groups for reading difficulties.
One possible conclusion from this analysis is that in the absence of intervention in kindergarten, the students in our first grade cohort developed deficits that grew more troublesome as the reading demands increased across first and second grades—the so-called Matthew effect (Stanovich, 1986). For students with K access, Tier 2 intervention was (for some, not all) timely enough to push students past the wave of reading skill deficits. If Stanovich’s hypothesis is correct, poor readers may also be disinterested in reading instruction, making instruction less effective for poor than for better readers. In a study that explored relations among component reading skills across first grade, Perfetti, Beck, Bell, and Hughes (1987) concluded that unless students either had or quickly acquired phonemic awareness early in first grade, the phonics instruction provided by their teachers was unlikely to be effective. Tier 2 in kindergarten focused on phonemic blending, segmenting, and combining these skills with letter–sound acquisition, and so the focused intervention Tier 2 provides could enable struggling students to become attuned to reading instruction, making them more responsive to the instruction that is offered across both tiers.
Students Who Were English Language Learners
Regarding Grade 2 reading outcomes, having access to early intervention in K may have been more important for students who were ELL than for NES. Although poor English language skills for ELL students may increase the false positive identification of at-risk status (Klingner et al., 2006), we reasoned that the additional access to small group, intensive intervention in English could provide more benefit to the K access cohort of ELL in vocabulary as well as in reading, which could in turn improve reading comprehension. Our hypothesis was only partially borne out, at least with the power to demonstrate a significant difference. As with NES, students who were ELL with access to RtI regardless of start year improved reading outcomes significantly over ELL in the control group; however, unlike NES, differences between ELL students with K versus Grade 1 access on untimed measures of reading (i.e., the WRMT) persisted through the end of Grade 2. It was surprising that these differences were found on reading specifically, and not on the language measures.
One reason for similar outcomes on the language measures could be related to their design. Both the PPVT and the WRMT were designed for a broad age span and may have included too few items for students in Grades K–2 to detect differences in language development if they existed. Nevertheless, reading differences were found on other broad-age-range measures, which detracts from this possibility. Another explanation could be that bifurcating the sample into ELL and non-ELL, along with attrition, took their toll by the end of second grade, and both of these factors decreased power to detect effects. This possibility could be explored with a larger study in the future.
The most likely explanation in our view is that access did not mean ongoing placement in Tier 2. Where in other studies of RtI’s effects on vocabulary and reading development, researchers have assigned students to interventions for specific amounts of time regardless of growth, our study was flexible and allowed nimble movement across tiers based on students’ most current reading (i.e., not language) scores. In the ELL sample, as well as for the NES, students only participated in Tier 2 when their reading scores indicated risk. Some students in the K cohort did not demonstrate risk until first grade, and so students in the K cohort did not necessarily have an extra year of Tier 2 intervention.
Several studies in the past few years (Crosson & Lesaux, 2010; Mancilla-Martinez & Lesaux, 2010, 2011) have found that ELL students’ reading skills develop unevenly because of the differential relationship between word reading skills, word meanings, and reading comprehension over time. Although decoding and word recognition may show adequate development in the first several years of school, vocabulary and reading comprehension often lag behind significantly. Inspection of Table 10 shows a gap between word reading and passage comprehension of about one third of a standard deviation (5–7 standard score points) on the WRMT in Grade 1 for the ELL students, regardless of risk. By the end of Grade 2, the gap narrowed to 3 standard score points, with K access students demonstrating average scores for word identification and reading comprehension. Tier 2 included focused discussion of text content in Grades 1 and 2, which likely led to a direct impact on reading comprehension, even in the absence of measurable improvement on broad range tests of vocabulary.
As Klingner et al. (2006) and others have suggested, poor English reading skills resulting from learning English constitutes a different cause for poor reading achievement than poor reading skills in a child’s first language. Some ELL students identified for Tier 2 improved their word reading skills rapidly and no longer scored within the range for Tier 2 selection in succeeding years. In this study, 28% of the ELL identified in K caught up sufficiently by the end of K to need no additional assistance with reading. By the end of Grade 1, an additional 25% caught up. Students who were ELL were not differentially identified with reading difficulties or disabilities. Overall, our measures identified a proportion of ELL students for Tier 2 that was similar to the ELL population in the participating schools.
Late-Emerging Reading Difficulties
Unlike earlier studies in which the risk sample was identified in Year 1 and remained constant, we identified new students for Tier 2 intervention across years as their scores on screening measures fell below the cut points that indicated risk, as long as students were present in the schools in Year 1. This model emulates how schools tend to orchestrate RtI models (see, e.g., Mellard et al., 2009) and may have reduced the bias favoring RtI results in studies that selected only kindergarten or beginning first graders as their intervention sample, thereby excluding students whose reading difficulties emerged later.
This distinction is important because 36% of the students who received Tier 2 intervention at some point across this 3-year study received it for the first time in Grade 2. These students’ scores were above the cut points for Tier 2 intervention at all time points across Grades K–1.
Unlike Kieffer’s (2010) study that reported particularly high proportions of late-emerging RD for ELL by fifth grade, the proportions of ELL and NES in our study did not differ. ELL students were included in Tier 2 based on their word reading scores and not language ability, which may have decreased the proportion of late-emerging RD in our sample. By third and fourth grade, as vocabulary and language comprehension exert more influence on total reading scores for ELL and NES, we could find more students with late-emerging reading disability, and an increasing proportion of ELL students in the late-emerging category. If growth in vocabulary and reading comprehension of ELL lags behind their word reading ability, as found by Mancilla-Martinez and Lesaux (2010), the widening gap would lead to this outcome. Comparison of end-of-year scores across Tables 8, 9, and 10 demonstrates that ELL students at risk grew similarly to NES on reading measures in first and second grades despite lacking proficiency in English. At this point, we have no clear evidence whether ongoing access to an RtI model will decrease the incidence of late-emerging RD because of comprehension difficulties among ELL students.
Identifying Students for Special Education
In an experiment using RtI as a model for decreasing special education placements, Wanzek and Vaughn (2011) found that the implementation of tiered reading intervention schoolwide produced measurable, though not significant, decreases in special education placement. The authors note that this drop may be a regression toward the national mean because the study schools had been previously placing students in special education at a rate of 19.37%, well above the national average of 12%. As in VanDerHeydenet al.’s (2007) study, eligibility categories were condensed across types of disability, which decreased differences that could be because of reliability of identification of students in high-incidence categories, such as LD.
In our control group the special education placement rate was 6.4%, a smaller figure to reduce, and in fact overall access to Tier 2 instruction decreased neither referrals nor placements. The presence of Tier 2 may have improved earlier detection of students with high-incidence disabilities, who received Tier 2 intervention for a period of time, did not respond, and were then referred for special education consideration. Similar to national statistics, LD placements were 50% of the classifications for the sample with earliest access to Tier 2 intervention.
Although teacher referral may not be the most reliable way to identify LD, teacher ratings of reading ability and reading problems have been tightly linked in the research literature to reading status at year’s end in first grade (Speece et al., 2011) and in fourth grade (Speece et al., 2010); however, potential bias in teacher referral has also been linked to overrepresentation of minority students. Having access to RtI did not decrease the proportion of students identified for special education, nor did it have a significant impact on the timing of identification. When students with high-incidence disabilities are considered across cohorts, we found that those who had participated in Tier 2 interventions were nearly all identified for special education because of poor responsiveness to those interventions. All but one of these students with disabilities met poor-reader status at the end of Grade 2. Among students with high-incidence disabilities in the historical control group, only half met criteria for poor reader status. This difference suggests that participation in a model of RtI may reduce teacher bias associated with the “judgmental” categories of disability and increased the validity of LD decisions.
Moreover, no students in the historical control cohort who were ELL were placed in special education by the end of Grade 2. Although disinclination to refer or place ELL students could be viewed as sensitivity to language differences that can contribute to overrepresentation of minorities in special education (e.g., Donovan & Cross, 2002), ignoring the special needs of ELL students in the primary grades could also contribute to the overrepresentation of ELL students in special education by middle school (Kauffman, Conroy, Gardner, & Oswald, 2008) and to their late-emerging RD (Kieffer, 2010). Our data support the notion that using RtI as one indicator of need for special services may reduce teacher bias and make access to special education more equitable across ethnic groups. Studies of longer implementation of RtI models—through the third and fourth grades when most students with high-incidence disabilities have been identified, and in schools with high and varied proportions of minority enrollment—will be necessary to explore these possibilities.
A Caveat About Measurement in RtI Models
Screening children for potential reading difficulties and monitoring their progress during interventions are primary components of every RtI model. Although we have focused attention on access to RtI in this study, notions of when to screen students for reading difficulties may be as important as when to treat them. Identifying students for Tier 2 in kindergarten provides more opportunity for early intervention before difficulties become severe; however, kindergarten screening tools are less reliable indicators of reading problems than measures of actual reading a year later.
Quick screens such as segmenting spoken words into phonemes in kindergarten or reading rate in second grade can help to reduce teacher bias and identify children who may need additional, more effortful assessment to validate whether reading problems exist (Compton et al., 2010; D. Fuchs, Fuchs, & Compton, 2012). Nevertheless, some of the widely used additional and effortful assessments, including the WRMT or GORT, have their own much-discussed problems, especially for assessing reading comprehension, which is the key indicator of late-emerging LD (Catts et al., 2012).
Determining reliable screening procedures for comprehension is important because measures of isolated skills (letter naming, segmenting, or word recognition) miss children who later develop reading difficulties because of language and comprehension problems that went untested in earlier grades. This issue is salient especially for students who are ELL. Finding appropriate measures for potential reading comprehension difficulties has proved problematic. For example, some researchers have suggested that passage comprehension as measured by the WRMT relies more heavily on word decoding than on comprehension of text (Francis, Fletcher, Catts, & Tomblin, 2005; Keenan, Betjemann, & Olson, 2008). Keenan and Betjemann (2006) found that older students with poor decoding skills score higher than expected on the GORT because it is possible to guess correct answers to some questions through background knowledge without reading the passages.
In our work, poor readers in elementary school consistently score lower (i.e., standard scores) on the GORT than the WRMT, and so although we have not seen (and do not see in this study) problems of score inflation on the GORT, we suspect score inflation on the WRMT. Not only were our Tier 2 participants in the lowest quartile of their grade, but they were also the lowest quartile in low-achieving schools that had qualified for “school improvement” under the No Child Left Behind Act. A glance at the receptive language (PPVT) scores in Table 4 shows that these students on average were about 10 standard score points below that test’s national mean. Nevertheless, on the WRMT subtests they score well into the average range, even though their teachers still acknowledged them as poor readers in need of remediation. It is possible that the national focus on early reading and academic content in kindergarten has skewed the norms on this measure. For the research and practice communities, renorming existing measures and developing quick screens that are sensitive to comprehension in the early grades and reliable for students who are ELL should be priorities for research on practices used in models of RtI.
Limitations
Kindergarten measures are less reliable indicators of reading risk than are measures in first grade (L. S. Fuchs, 2003; O’Connor & Jenkins, 1999; Speece, 2005). To compensate for the overselection of kindergartners as being at risk (e.g., Coyne et al., 2004; O’Connor, 2000), we were especially stringent on criteria for entering Tier 2 in kindergarten. We elected to take the students most severely in need, with scores below our cut points on all measures, and continued to monitor them, as well as kindergartners who met only one or two of the criteria. These students were added to the Tier 2 intervention if they did not show growth in general classroom instruction, which qualifies the notion of kindergarten access. Because we worked with the most severely at-risk students, the problem of overidentification was minimized; our treated kindergarten sample may be more comparable in certainty of identification to the first grade identified sample than has been true for other studies. Nevertheless, through 3 years of monitoring student progress, we also found students in first and second grades whose early literacy measures in kindergarten had placed them above the high-risk cutoff for intervention. Across cohorts, the proportion of students selected for intervention each year remained near 25%. As some students met criteria to exit Tier 2, others became eligible, most likely because of the increasing complexity of “what counts” as reading in first and second grades. What may appear to be less “success” as measured by ever-declining numbers of children at risk over time (see, e.g., Simmons et al., 2008) is balanced by including students whose reading difficulties appeared after Year 1 of this study.
Although attrition was large (about 40% by the end of Grade 2), it was in line with other longitudinal studies of RtI. As examples, O’Connor (2000) reported 29% of participants lost over 2 years. McMaster, Fuchs, Fuchs, and Compton’s (2005) intervention lasted only 7 weeks; nevertheless, they lost 7% of students. In Simmons et al.’s (2008) longitudinal study of RtI, 51% of at-risk kindergartners remained in the study at the end of Grade 2.
Although the teachers were mainly the same across all three cohorts, the effects reported here may be in part the result of a systemic change in teachers’ awareness of reading difficulties in participating schools, which could also account for the differences between students’ reading ability in special education in the cohorts with and without access to RtI. This possibility warrants further research attention.
Overall, the limitations in this study reflect the hazards of research in public schools. Nevertheless, studies that mirror how schools use RtI to identify students for intervention and consider their response in eligibility decisions for special education are essential. Without such studies, it will be difficult for researchers to recommend a range of applications that could improve student reading outcomes and the reliability of special education placements.
Implications
In this study, whether having access to structured Tier 2 intervention as early as kindergarten mattered depended on when reading achievement was measured, who was measured, and proportions who reached criteria for adequate reading ability by the end of second grade. Differences on reading measures were significant throughout first grade, but waned in second grade, except for students who were ELL, for whom earlier intervention was consistently better than later. Our most important contribution may be identifying a substantial proportion of students who scored too high in K (and for many, too high through first grade) to be identified for Tier 2 when it was available. Because we monitored the reading skills of all students in these schools three times per year, we can verify that 30% of students our Tier 2 sample in second grade were developing typically in the early literacy skills of phonemic segmentation and letter names and sounds in kindergarten, and only later (in Grade 1 or 2) demonstrated difficulties with words, reading rate, and/or comprehension. Although other research teams have identified late-emerging RD after third grade (e.g., Catts et al., 2012; Kieffer, 2010), our study suggests that measures commonly used to identify students for early reading intervention (i.e., measures of letter knowledge and segmenting skills) miss students who develop reading difficulties as early as the middle of first grade.
Our study also included students whose reading achievement through the end of first grade was average on standardized reading measures and reading rate, who nevertheless encountered difficulties with multisyllabic words and comprehension in second grade that indicated a need for intensive intervention. These issues raise the possibility that studies in which students were identified as high risk only in kindergarten or first grade—and who then become the sample that was followed longitudinally— might amplify the likely results of implementing an RtI model on decreasing the proportion of students at risk.
Whether RtI should (or should be expected to) reduce the proportion of students identified for special education has also received considerable discussion (L. S. Fuchs, 2003; Wanzek & Vaughn, 2011). In our study early intervention did not reduce the proportion of students placed in special education but may have reduced bias associated with placing minority students with LD in special education. Considering the reading ability of the students who were placed in special education, this study also suggests that RtI may increase the validity of LD placements, as nearly all such students demonstrated persistent difficulties with reading acquisition. More and longer studies that include all students in schools (rather than identifying only those who appear at risk in the first year or two of schooling) are needed to demonstrate whether the patterns found here will endure.
Footnotes
Declaration of Conflicting Interests
The author(s) declared no potential conflicts of interest with respect to the research, authorship, and/or publication of this article.
Funding
The author(s) disclosed receipt of the following financial support for the research, authorship, and/or publication of this article: The research in this article was supported in part by Grant R324B070098 from the U.S. Department of Education, Institute of Education Science to the University of California, Riverside, and the Eady/Hendrick Endowment. The content is solely the responsibility of the authors and does not necessarily represent the official views of the U.S. Department of Education, or Institute of Education Sciences.