
Abstract
We discuss a component-based, developmental view of text writing fluency, which we tested using data from children in Grades 2 and 3. Text writing fluency was defined as efficiency and automaticity in writing connected texts, which acts as a mediator between text generation (oral language), transcription skills, and writing quality. We hypothesized that in the beginning phase, text writing fluency would be largely constrained by transcription skills (spelling and handwriting), while at a later phase, oral language would make an independent contribution to text writing fluency. Furthermore, we hypothesized that text writing fluency would have a stronger relationship with writing quality at a later phase than at an earlier phase. We operationalized text writing fluency using two curriculum-based measurement writing scores: percentage correct word sequences and correct minus incorrect word sequences. Results revealed that in Grade 2, only transcription skills were uniquely related to text writing fluency, whereas in Grade 3, oral language was also related to text writing fluency. Text writing fluency was weakly related to writing quality in Grade 2 but strongly related to writing quality in Grade 3, over and above oral language and transcription skills. In both grades, oral language and handwriting fluency were independently related to writing quality. Theoretical and practical implications are discussed.
Keywords
Now more than ever, proficient writing is a key skill for academic and career success (Graham, Harris, & Hebert, 2011). However, a meager 30% of students in Grades 8 and 12 performed at or above a proficient level on the most recent National Assessment of Educational Progress test (NAEP; National Center for Educational Statistics, 2012). In fourth grade, only 28% were at a proficient level on the NAEP (National Center for Education Statistics, 2003). Neither of these NAEP reports provided disaggregated writing data for students with learning disabilities (LD), so little is known about their performance, but they are certainly less likely than students without disabilities to succeed in school, graduate from school, attend college, stay out of prison, or attain jobs earning over $50,000 per year.
In the Writing Next report, Graham and Perin (2007) argued that it is important to consider not only students identified as having LD but also students who are low-achieving writers, defined as “students whose writing skills are not adequate to meet classroom demands” (p. 3). Graham and Perrin also noted that while “some of these low-achieving writers have been identified as having learning disabilities, others are the ‘silent majority’ who lack writing proficiency but do not receive additional help” (p. 3). Arguably, the NAEP data indicate this is now a majority of students. Thus, it is vital to identify struggling writers at the early stages of writing development, regardless of whether they are low-achieving writers or are identified with LD, in order to intervene early so they can become proficient writers who will be college and career ready.
The combination of poor performance and a lack of common expectations has led to the Common Core State Standards (CCSS; National Governors Association Center for Best Practices & Council of Chief State School Officers, 2010). Though controversial, these standards remain in effect in more than 40 states and are driving changes to high-stakes assessments. In writing, kindergarten students are expected to write several sentences with support by the end of the year. These expectations build across grade levels so that by Grade 4, students are expected to write both informative and exploratory essays to convey ideas, use facts, describe sequences of events, and use transition words, and they should produce writing that is appropriate to different tasks and purposes (National Governors Association Center for Best Practices & Council of Chief State School Officers, 2010, 2010). Furthermore, the CCSS emphasizes teachers should provide scaffolding and formative feedback to writers and specifies that many of the standards will require adult guidance and support for the early grades (National Governors Association Center for Best Practices & Council of Chief State School Officers, 2010, 2010). To date, there remains a gap between these writing standards and writing assessments that can guide a teacher’s ability to screen and progress monitor students in writing to inform writing instruction and intervention, particularly for low-achieving writers, including students with LD (Graham, Harris, & Santangelo, 2015). In the present study, we conceptualized a theoretical model of writing fluency at the text level (i.e., text writing fluency), and tested the model using two of the curriculum-based measurement (CBM) writing measures.
Definition and Theoretical Conceptualization of Text Writing Fluency
Two prominent theoretical models of developmental writing are the simple view of writing (Juel, Griffith, & Gough, 1986) and the not-so-simple view of writing (Berninger & Winn, 2006). The former states that writing is a function of two key component skills: transcription and ideation (also called text generation; Berninger, Abbott, Abbott, Graham, & Richards, 2002; Juel et al., 1986). Text generation is the process of generating ideas and encoding those ideas into oral language at various levels (word, sentence, and discourse) and therefore necessarily requires oral language skills. Studies indeed have shown the relation of oral language skills to writing (Berninger & Abbott, 2010; Coker, 2006; Juel et al., 1986; Kim, 2015a, 2015b; Kim et al., 2011; Kim, Al Otaiba, Sidler, Greulich, & Puranik, 2014; Olinghouse, 2008). Transcription, the process of encoding sounds into print, including spelling and handwriting, has also been consistently related to writing (Abbott & Berninger, 1993; Berninger et al., 1997; Berninger, Abbott, et al., 2002; Berninger, Vaughan, et al., 2002; Graham, Berninger, Abbott, Abbott, & Whitaker, 1997; Kim, 2015a, 2015b; Kim et al., 2011; Kim, Al Otaiba, et al., 2014). The not-so-simple view of writing expanded the simple view of writing by adding two more component skills of writing: working memory and self-regulatory processes (see Note 1), which are also supported by empirical evidence (Graham, McKeown, Kiuhara, & Harris, 2012; Hayes & Chenoweth, 2007; Kellogg, Olive, & Piolat, 2007; Limpo & Alves, 2013).
Although highly influential and instrumental, these models require further development in several aspects, one of which is the role of fluency in writing development. Fluency refers to automaticity and effortlessness in information processing (LaBerge & Samuels, 1974). In current models of writing, fluency is explicitly recognized at the sublexical level, that is, handwriting fluency. According to information-processing theory (LaBerge & Samuels, 1974; Posner & Snyder, 1975) and relevant evidence, however, fluency is a developmental phenomenon, encompassing various grain sizes, including sublexical, lexical, and text or discourse levels, and fluency at a lower level is necessary for achieving fluency at a higher level (Kame’enui, Simmons, Good, & Harn, 2001; Meyer & Felton, 1999; Wolf & Katzir-Cohen, 2001). In reading development, for instance, fluency has been examined at various levels, including letter, word, and text. In particular, fluency at the text or discourse level, or text reading fluency (also widely known as oral reading fluency), has received much theoretical and empirical attention (Fuchs, Fuchs, Hosp, & Jenkins, 2001; Jenkins, Fuchs, van den Broek, Espin, & Deno, 2003; Kim, 2015a; Kim, Park, & Wagner, 2014; Kim & Wagner, 2015; Kim, Wagner, & Foster, 2011; Kuhn & Stahl, 2003; National Institute of Child Health and Human Development, 2000; Wolf & Katzir-Cohen, 2001).
The primary goal of the present study was to explore and develop a theoretical conceptualization of writing fluency in connected texts (i.e., text writing fluency) and to test that conceptualization with empirical data. Ritchey and her colleagues (2015) recently defined writing fluency as “the ease with which an individual produces written text” (p. 27; italics in original) and hypothesized that writing fluency draws on the two essential component skills of writing according to the simple view of writing: text generation and transcription. In the present study, we expand Ritchey et al.’s important, albeit preliminary, attempt to define, or characterize, writing fluency in several crucial ways. First, building on Ritchey et al.’s conceptualization, our short definition of text writing fluency is efficiency and automaticity in writing connected texts. Efficiency refers to both accuracy and speed of executing a target task (e.g., writing), while automaticity refers to speed, effortlessness, and lack of conscious awareness (Logan, 1997) and does not necessarily imply accuracy. Both efficiency and automaticity are hallmarks of proficiency in skill acquisition.
Writing requires a highly complex set of processes. Because higher-order processes, such as producing texts, place a great demand on cognitive capacity, it is important to be able to allocate one’s available mental resources to these higher-order processes. This is possible when lower-level skills, such as transcription skills, acquire efficiency and automaticity. Although transcription skills are not typically considered attention demanding for skilled writers (compared to generating and organizing ideas), for children who are developing transcription skills, transcription skills can place a great demand on cognitive capacity. Therefore, until children develop efficiency and automaticity in transcription skills, few cognitive resources may be available for higher-order processes. Effortful and laborious writing of connected-text writing would tax and consume attentional resources and working memory capacity (see Perfetti’s [1985, 1992] efficiency account of reading for a similar argument). On the other hand, efficiency and automaticity in writing connected texts would release general cognitive processes to be available for higher-order processes, such as planning and revising (e.g., connecting ideas and propositions across text and arranging them in a logical and smooth flow).
A critical point in our conceptualization of text writing fluency is specifying connected text beyond the sublexical and lexical levels (i.e., letter writing or spelling individual words) in efficiency and automaticity. This is theoretically important because inherent in connected texts are meaning processes that originate in context, and this context aspect is what separates text writing fluency from transcription skills. Writing connected texts requires meaning processes beyond the word level to produce cohesive and coherent connected texts. Efficiently producing written connected texts requires and is built not only on transcription skills but also on meaning-related processes (e.g., producing meaningful, cohesive, and coherent ideas). Therefore, not only transcription skills, but also text generation or oral language, would be necessary to support writing fluency. For this reason, we use the term text writing fluency to accurately reflect our conceptualization because text writing fluency differentiates efficiency and automaticity in writing connected texts from proficiency or fluency in transcription skills, which are typically operationalized as lexical or sublexical skills.
Aligned with Ritchey et al.’s (2015) speculation, we hypothesize that text writing fluency draws on the two component skills of writing: transcription and text generation. If text writing fluency facilitates writing by enabling cognitive resources to be used for higher-order cognitive processes, and it draws on transcription and text generation, then text writing fluency would play a mediating role, acting as a bridge to connect, at least partially, transcription skills and text generation with a criterion writing skill (i.e., writing quality; see Figure 1). An important corollary, then, is the nature of mediation—whether writing fluency completely or partially mediates the relation of transcription and oral language to writing quality.
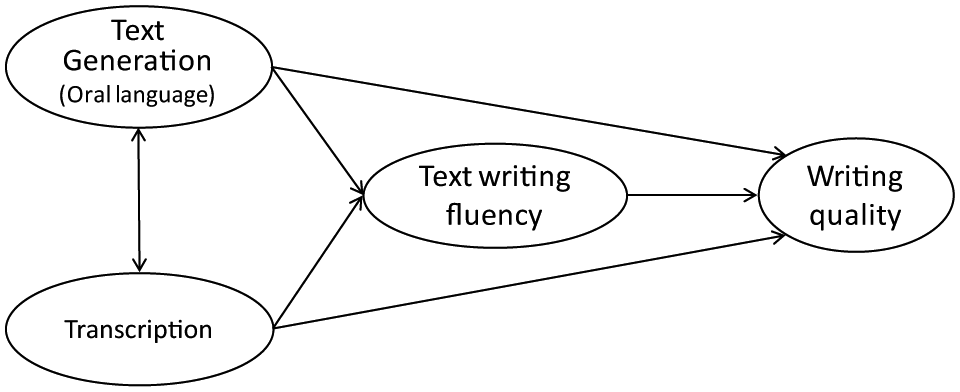
Developmental and component-based models of text writing fluency: Hypothesized relations among text generation, transcription skills, text writing fluency, and writing quality.
Importantly, we hypothesize that the nature of these relations (text generation, transcription, text writing fluency, and writing quality) would change as children’s skills develop. In other words, the relations are dynamic as a function of development. During the beginning phase of writing development, children’s transcription skills would constrain their composition processes to a large extent, and therefore, much of children’s cognitive resources would be expended on transcription, leaving little available for higher-order meaning-related processes, such as generating and translating ideas into oral language. Consequently, the relation of text generation to text writing fluency is expected to be weaker in the beginning phase of development. With development of transcription skills, children are able to utilize their cognitive resources for the text generation aspect to a greater extent, resulting in an increased contribution of text generation to text writing fluency. Text writing fluency would make a greater contribution to writing quality at a later phase of writing development because text writing fluency at a later phase captures not only transcription skills but also text generation skills. Therefore, text writing fluency would be a slightly different construct at different phases of writing development. Based on these hypotheses, our longer, developmental and componential definition of text writing fluency is as follows (see Note 2): Text writing fluency is the efficiency and automaticity in writing connected texts and draws on transcription and text generation (or oral language skills). Fluent writers can write connected texts with accuracy, speed, and ease, whereas dysfluent writers have difficulty generating connected texts, characterized by effortful and laborious transcription. In the beginning phase of development, text writing fluency is largely a function of, or is constrained by, transcription skills. With further development, however, text writing fluency is efficiency and automaticity in writing connected texts where transcription is accurate, rapid, and effortless and where cognitive resources, such as attention and working memory, can be allocated to meaning-related processes, facilitating text generation processes.
Operationalization of Text Writing Fluency
We tested the above noted theoretical model of text writing fluency by using two CBM writing scores: percentage correct word sequences (%CWS) and correct minus incorrect word sequences (CIWS), given their alignment with our conceptualization of text writing fluency and empirical evidence. CBM writing assessments were developed to provide global indicators of children’s writing performance (Deno, Marston, & Mirkin, 1982) and to signal a need for further diagnostic assessments and intervention. In CBM writing assessments, children are typically asked to write for a brief time (e.g., 5 min) in response to prompts or pictures (Coker & Ritchey, 2010; McMaster et al., 2011; McMaster, Du, & Petursdotter, 2009). Then, their compositions are evaluated using several indicators, including total number of words written, correct word sequences (two adjacent words that are grammatically correct and spelled correctly), incorrect word sequences, words spelled correctly, and derived scores, such as %CWS (correct word sequences divided by total number of words written) and CIWS (for reviews, see Graham et al., 2011; McMaster & Espin, 2007). CBM writing measures have shown to be reliable and valid (for reviews, see Gansle et al., 2004; Gansle, Noell, VanDerHeyden, Naquin, & Slider, 2002; Jewell & Malecki, 2005; Lembke, Deno, & Hall, 2003; McMaster et al., 2009; McMaster & Campbell, 2008; McMaster & Espin, 2007; McMaster, Ritchey, & Lembke, 2011).
Indicators of text writing fluency as defined in this article had to meet several criteria. First, writing tasks had to be at the connected-text level, not at the sublexical or lexical levels. Second, the indicator should capture both speed and accuracy of connected-text writing; that is, any measures that captured only speed or accuracy would not be sufficient. Therefore, total number of words written, which is included as part of CBM writing assessments, would not be an appropriate measure of the text writing fluency construct because it captures only the speed or productivity aspect but not accuracy. In fact, total number of words written has been widely used as an indicator of writing productivity (Abbott & Berninger, 1993; Berman & Verhoevan, 2002; Kim et al., 2011; Kim, Al Otaiba, et al., 2014; Kim, Al Otaiba, Wanzek, & Gatlin, 2015; Kim, Park, & Park, 2015; Mackie & Dockrell, 2004; Puranik, Lombardino, & Altmann, 2008; Wagner et al., 2011), although several previous studies used the term fluency to describe the total number of words written (e.g., Abbott & Berninger, 1993; Berninger, Abbott, et al., 2002; Graham et al., 1997).
Third, our conceptualization of text writing fluency—as well as Ritchey et al.’s (2015)—hypothesizes that text writing fluency draws on both transcription and text generation. Indicators such as correct word sequences and incorrect word sequences do capture both transcription and oral language because grammatical accuracy is captured in these indicators. However, correct and incorrect word sequences are confounded by the amount of writing: Children who write more are likely to have greater number of correct or incorrect word sequences, and vice versa. In contrast, %CWS and CIWS account for amount of writing (see the Method section). Moreover, %CWS and CIWS have been shown to have strong validity evidence (Amato & Watkins, 2011; McMaster & Espin, 2007), including children in primary grades (Jewell & Malecki, 2005; Lembke et al., 2003; Weissenburger & Espin, 2005). For instance, CIWS was moderately to strongly related to teacher’s holistic evaluation of writing (.65 ≤ rs ≤ .78) as well as researcher’s evaluation of students’ writing samples for children in Grades 2 and 3 (.53 ≤ rs ≤ .84; Lembke et al., 2003). In addition, %CWS and CIWS were moderately and fairly strongly related (.41 ≤ rs ≤ .67) to SAT language scores (which captures proficiency in mechanics and expression) for students in Grades, 2, 4, and 6 (Jewell & Malecki, 2005). In the present study, we explicitly tested whether (a) writing quality (operationalized as quality of ideas and organization), text writing fluency (operationalized as %CWS and CIWS), and writing productivity (total number of words written) are related but dissociable constructs or (b) they capture a single writing construct or two constructs composed of writing quality (quality of ideas and organization) versus text writing fluency (%CWS, CIWS, and total number of words written).
In summary, to measure our conceptualization of text writing fluency, writing assessment has to use tasks at the connected-text level with a reasonable time limit, whereas writing evaluation should capture accuracy and speed of transcription and oral language.
Present Study
We tested our theorization of text writing fluency by fitting the model shown in Figure 1, using data from children in Grades 2 and 3. Specifically, we hypothesized that text writing fluency draws on text generation and transcription skills. However, text generation may contribute to text writing fluency to a greater extent at a later phase of development (Grade 3) than at an earlier phase of development (Grade 2). Furthermore, text writing fluency was hypothesized to mediate, at least partially, the relation between text generation and transcription skills, and writing quality. Finally, text writing fluency was expected to be more strongly related to writing quality as children develop skills (Grade 3 compared to Grade 2).
As noted above, text generation was operationalized as oral language skills because generated ideas are abstract, preverbal messages and have to be translated to oral language before they can be transcribed to written composition (Berninger, Abbott, et al., 2002; Kim et al., 2011; McCutchen, 2006). Oral language is a broad construct, encompassing word-, sentence-, and discourse-level skills. Studies have shown that various aspects of oral language skills are related to writing: vocabulary and grammatical knowledge (Kim et al., 2011; Kim, Al Otaiba, et al. 2014; Olinghouse, 2008), sentence comprehension (Berninger & Abbott, 2010), and oral retell and production (Berninger & Abbott, 2010; Juel et al., 1986; Kim & Schatschneider, 2017). However, growing evidence indicates that discourse-level oral language skills, such as listening comprehension or oral retell and production, are higher-order skills that encompass foundational or lower-level oral language skills, such as vocabulary and grammatical skills (Florit, Roch, & Levorato, 2011, 2014; Kim, 2015b, 2016; Kim & Schatschneider, 2017; Tunmer, 1989); foundational cognitive skills, such as working memory, inhibitory control, and attention (Daneman & Merikle, 1996; Florit, Roch, Altoè, & Levorato, 2009; Kim, 2015b, 2016; Kim & Phillips, 2014); and higher-order cognitive skills, such as inference, perspective taking and reasoning, and comprehension monitoring (Kendeou, Bohn-Gettler, White, & van den Broek, 2008; Kim, 2015b, 2016; Kim & Phillips, 2014; Kim & Schatschneider, 2017; Lepola, Lynch, Laakkonen, Silvén, & Niemi, 2012; Strasser & del Rio, 2014; Tompkins, Guo, & Justice, 2013). In fact, the discourse-level oral language has been shown to completely mediate the relation of vocabulary, grammatical knowledge, inference, and perspective taking to writing (Kim & Schatschneider, 2017).
Method
Data were drawn from cross-sectional samples of children in Grades 2 and 3 from nine schools. Both samples were part of a longer longitudinal study following students’ reading and writing development across the elementary years. The students attended schools in a southeastern city that were recruited for the study purposefully, because they served a diverse population with a relatively high proportion from low socioeconomic backgrounds. The second-grade sample was composed of 234 children from 39 classrooms (46% boys; mean age = 8.27, SD = 0.38). Approximately 77% of the children were eligible for free and reduced lunch, and 6% had speech impairment and 4% had language impairment. Approximately 62% were African Americans, 25% were Caucasians, and 10% were multiracial. The third-grade sample consisted of 260 children from 38 classrooms (56% boys; mean age = 9.26, SD = 0.37), 74% of whom were eligible for free and reduced lunch. Approximately 3% had speech impairment and 4% had language impairment. The third-grade sample was composed of 57% African Americans, 32% Caucasians, and 6% multiracial children. Fewer than 5% of the children across the grades were English language learners.
Measures
Writing assessment
Children were administered three separate writing assessments. Each assessment was given in group format with a 10-min time limit. The first writing prompt was an experimental task used in previous studies (Kim, Al Otaiba, et al., 2014; Kim, Al Otaiba, Sidler, & Greulich, 2013; McMaster et al., 2009). In this task, children were instructed to write about a time when something unusual or interesting happened when they got home from school. Children were provided with the words “One day when I got home from school . . .” on ruled paper (the “One day” prompt hereafter). The second writing task was the Essay Composition task of the Wechsler Individual Achievement Test–Third Edition (WIAT-III; Wechsler, 2009). In this task, children were asked to write about their favorite game and provide three reasons why they like their favorite game. Finally, for the “Pet” prompt, children were told to write a letter to their parents about an animal that they would like to have as a pet and to explain why. Children’s written compositions were evaluated in terms of quality and CBM measures.
Writing quality
Writing quality was coded on these tasks by examining quality of ideas and organization, based on previous studies (e.g., Graham, Berninger, & Fan, 2007; Graham, Harris, & Chorzempa, 2002; Hooper, Swartz, Wakely, de Kruif, & Montgomery, 2002; Olinghouse, 2008). We adapted the widely used 6+1 Trait rubric (see Northwest Regional Educational Laboratory, 2011, for scoring guide and examples) on a scale of 1 to 7. A score of 0 was assigned to writing samples that could not be scored (e.g., those with a random string of letters). Children’s compositions with detailed and rich ideas using unique or interesting perspectives were rated higher. For organization, compositions were evaluated in terms of logical sequence in overall structure (i.e., beginning, middle, and closing) and appropriate transitioning. Although a previous study has shown low reliability and validity of the 6+1 Trait approach (Gansle, VanDerHeyden, Noell, Resetar, & Williams, 2006), recent studies indicate that with rigorous training, high reliability is achievable (Kim, Al Otaiba, et al., 2014; Kim, Al Otaiba, et al., 2015). Furthermore, four traits of the 6+1 Trait approach, namely, ideas, organization, word choice, and sentence fluency, were shown to capture a single construct (Kim, Al Otaiba, et al., 2014) and were related to standardized and normed writing tasks (Kim, Al Otaiba, et al., 2015). In the present study, raters were graduate students and were trained through several meetings before establishing reliability. In the initial meeting, the raters went over the rubric with the first author and scored sample compositions together. In the second meeting, raters brought independently rated written samples (approximately 15 samples), discussed rationale for assigning a particular score, and discussed discrepancies. Raters reconvened to discuss another set of 15 practice samples before working on a reliability set. In the present study, interrater reliability was established with 45 writing pieces for each prompt (see Note 3), which represented approximately 9% per prompt across grades and ranged between .82 and .88 (Cohen’s kappa).
The Essay Composition subtest of the WIAT-III (Wechsler, 2009) was also scored according to conventional standards provided by the testing manual. Specifically, we used rules provided by the test authors for scoring the Theme Development and Text Organization (TDTO) component of the test. This scoring included an interactive analysis that consisted of assigning points based on each child’s inclusion of an introduction and conclusion and the number of separate paragraphs and transition words. The score also consisted of the number of valid reasons that the student included and elaborations on those reasons. The maximum raw score on TDTO is 20. The publisher reported a test–retest reliability coefficient of .83 for children in the elementary grades (Wechsler, 2009). In our sample, interrater reliability was established at the item level at .85 (agreements divided by the sum of agreements and disagreements) on 45 pieces of written sample. The Essay Composition task was moderately related to Sentence Composition (Wechsler, 2009), and a recent study showed that TDTO is best conceptualized as assessing writing quality (Kim, Al Otaiba, et al., 2015). Note that TDTO standard scores are available only for children in Grade 3 and above, and thus, in the present study, standard scores are reported for children in Grade 3 only.
Text writing fluency
As noted above, CIWS and %CWS of CBM writing were used in the present study. These were derived from correct word sequences and incorrect word sequences (Coker & Ritchey, 2010; Lembke et al., 2003; McMaster et al., 2009, 2011; see also Graham et al., 2011, and McMaster & Espin, 2007). The %CWS is derived by dividing the number of correct word sequences by the total number of words written. CIWS is derived by subtracting the number of incorrect word sequences from the number of correct word sequences. Raters were trained by a master coder who had extensive experience with CBM scoring and went through a similar process as described for the writing-quality evaluation.
Reliability was examined using 45 written samples for each writing prompt. The reliability coefficients were calculated by using an equation that produces quotients indicating scorer proximity to a primary coder for each of the components, a method that produces what is referred to as a similarity coefficient (Shrout & Fleiss, 1979). A similarity coefficient is appropriate for CBM writing scores because these data are quantitative (interval), not categorical (e.g., nominal and ordinal; Fleiss & Cohen, 1973). Each rater’s score for each of the components of CBM was compared to the primary coder’s score for the same component. If the two numbers were exactly the same, the reliability coefficient would be 1. If the two numbers were not the same, the smaller of the scores was divided by the larger number, producing a quotient between 0 and 1. For example, the primary rater gave a score of 126 correct word sequences, whereas a second rater gave the same writing sample a score of 129 correct word sequences. The similarity coefficient for correct word sequences for this particular writing piece would be .98. The average coefficient for each of the CBM components among the 45 writing samples was then computed, and these ranged between .92 and .99. Differences found for the reliability set were discussed and resolved. Once reliability was established, the master coder conducted random spot checks throughout the study to ensure consistency in scoring was maintained.
Spelling
The Woodcock-Johnson Tests of Achievement–Third Edition (WJ-III; Woodcock, McGrew, & Mather, 2001) Spelling subtest was used. In this task, an assessor reads aloud an isolated list of words of increasing difficulty to each student. For the purposes of this study, testing procedures were slightly modified in order to accommodate for group testing, with children tested in groups of no more than six children. Children began at the predetermined starting point for their respective grade provided by the test authors, and basal and ceiling were established by carefully monitoring each student’s responses as the testing proceeded. As reported by the testing manual, using the split-half procedure, internal consistency reliability is high for the age group of the children included in this study (.88–.91; McGrew, Schrank, & Woodcock, 2007). In addition, reliability among the sample was high and similar to that reported by the manual (Cronbach’s alpha = .90).
Handwriting fluency
Two tasks were used to assess handwriting fluency: the Alphabet Writing Fluency task of the WIAT-III (Wechsler, 2009) and an experimental paragraph-copying task. In the WIAT-III Alphabet Writing Fluency task, children were given 30 s to write as many letters of the alphabet as they could. The children were provided with the letter a and were given 1 point for each additional recognizable and correctly formed letter of the alphabet that they wrote. The publisher reported a test–retest reliability of .69 for children in Grades 2 and 3. In our sample, interrater reliability was established at .88 (Cohen’s kappa) on 45 pieces of children’s work. The Alphabet Writing Fluency task was weakly to fairly strongly related to spelling (r = .36) and written expression (r = .68), respectively (Wechsler, 2009).
In the paragraph-copying task, children were instructed to copy words from the story “Can Buster Sleep Inside Tonight?” (117 words) as fast and as neatly as they could. They were given 1 min to copy as many words from the story, which was provided to them on a separate sheet of paper. Scoring procedures for this measure included counting the number of words attempted and subtracting the number of errors, which provided the correct number of words for each student. Children were not given credit for incomplete or misspelled words or words with unrecognizable letters. Interrater reliability was established at .91 (Cohen’s kappa).
Oral language
Children’s oral language skills were assessed by two listening comprehension tasks and one vocabulary task: the Narrative Comprehension subtest of the Test of Narrative Language (TNL; Gillam & Pearson, 2004), the Listening Comprehension subtest of the Oral and Written Language Scales–Second Edition (OWLS-II; Carrow-Woolfolk, 2011), and the Picture Vocabulary subtest of the WJ-III. In the Narrative Comprehension subtest of TNL (Gillam & Pearson, 2004), the child listened to three short stories and was asked comprehension questions after each story. According to the examiner’s manual, the reported Narrative Comprehension portion of the TNL has an internal consistency of .87 and a test–retest reliability of .85. In the OWLS-II Listening Comprehension subtest, children listened to a stimulus sentence and were asked to point to one of four pictures that corresponded to the sentence read aloud by the tester. This subtest’s reported split-half internal reliability ranges from .96 to .97 for the age group of our sample. In the WJ-III Picture Vocabulary task (Woodcock et al., 2001), children were asked to orally identify various pictures of objects that increased in difficulty. Reliability for this subtest for our sample was .76 (Cronbach’s alpha).
Procedures
Children were assessed by trained research assistants in quiet spaces in the schools. Writing, spelling, and handwriting fluency tasks were administered in small groups. Oral language tasks were individually administered.
Data Analysis Strategy
Primary data analytic strategies included confirmatory factory analysis and structural equation modeling, using MPLUS 7.1 (Muthén & Muthén, 2013). Latent variables were created for the following constructs: writing quality, text writing fluency, handwriting fluency, and oral language. For spelling, a single task was used, and therefore an observed variable was used in structural equation modeling. Model fits were evaluated by multiple indices, including chi-square statistics, comparative fit index (CFI), the Tucker-Lewis index (TLI), root mean square error of approximation (RMSEA), and standardized root mean square residual (SRMR). Excellent model fits include RMSEA values below .08, CFI and TLI values equal to or greater than .95, and SRMR equal to or less than .05 (Hu & Bentler, 1999). TLI and CFI values greater than .90 are considered to be acceptable (Kline, 2005).
Results
Descriptive Statistics and Preliminary Analysis
Table 1 displays descriptive statistics for the present study. Across the grades, children’s mean performances on the normed tasks were in the average range. For instance, children’s mean scores on the OWL-II Listening Comprehension (M = 101.40 for second graders; M = 98.11 for third graders) and WJ-III Picture Vocabulary (M = 98.74 for second graders; M = 99.13 for third graders) were in the average range. Similar trends were found for their spelling, alphabet writing fluency, and WIAT-III writing score (TDTO; third grade only).
Descriptive Statistics for the Study.
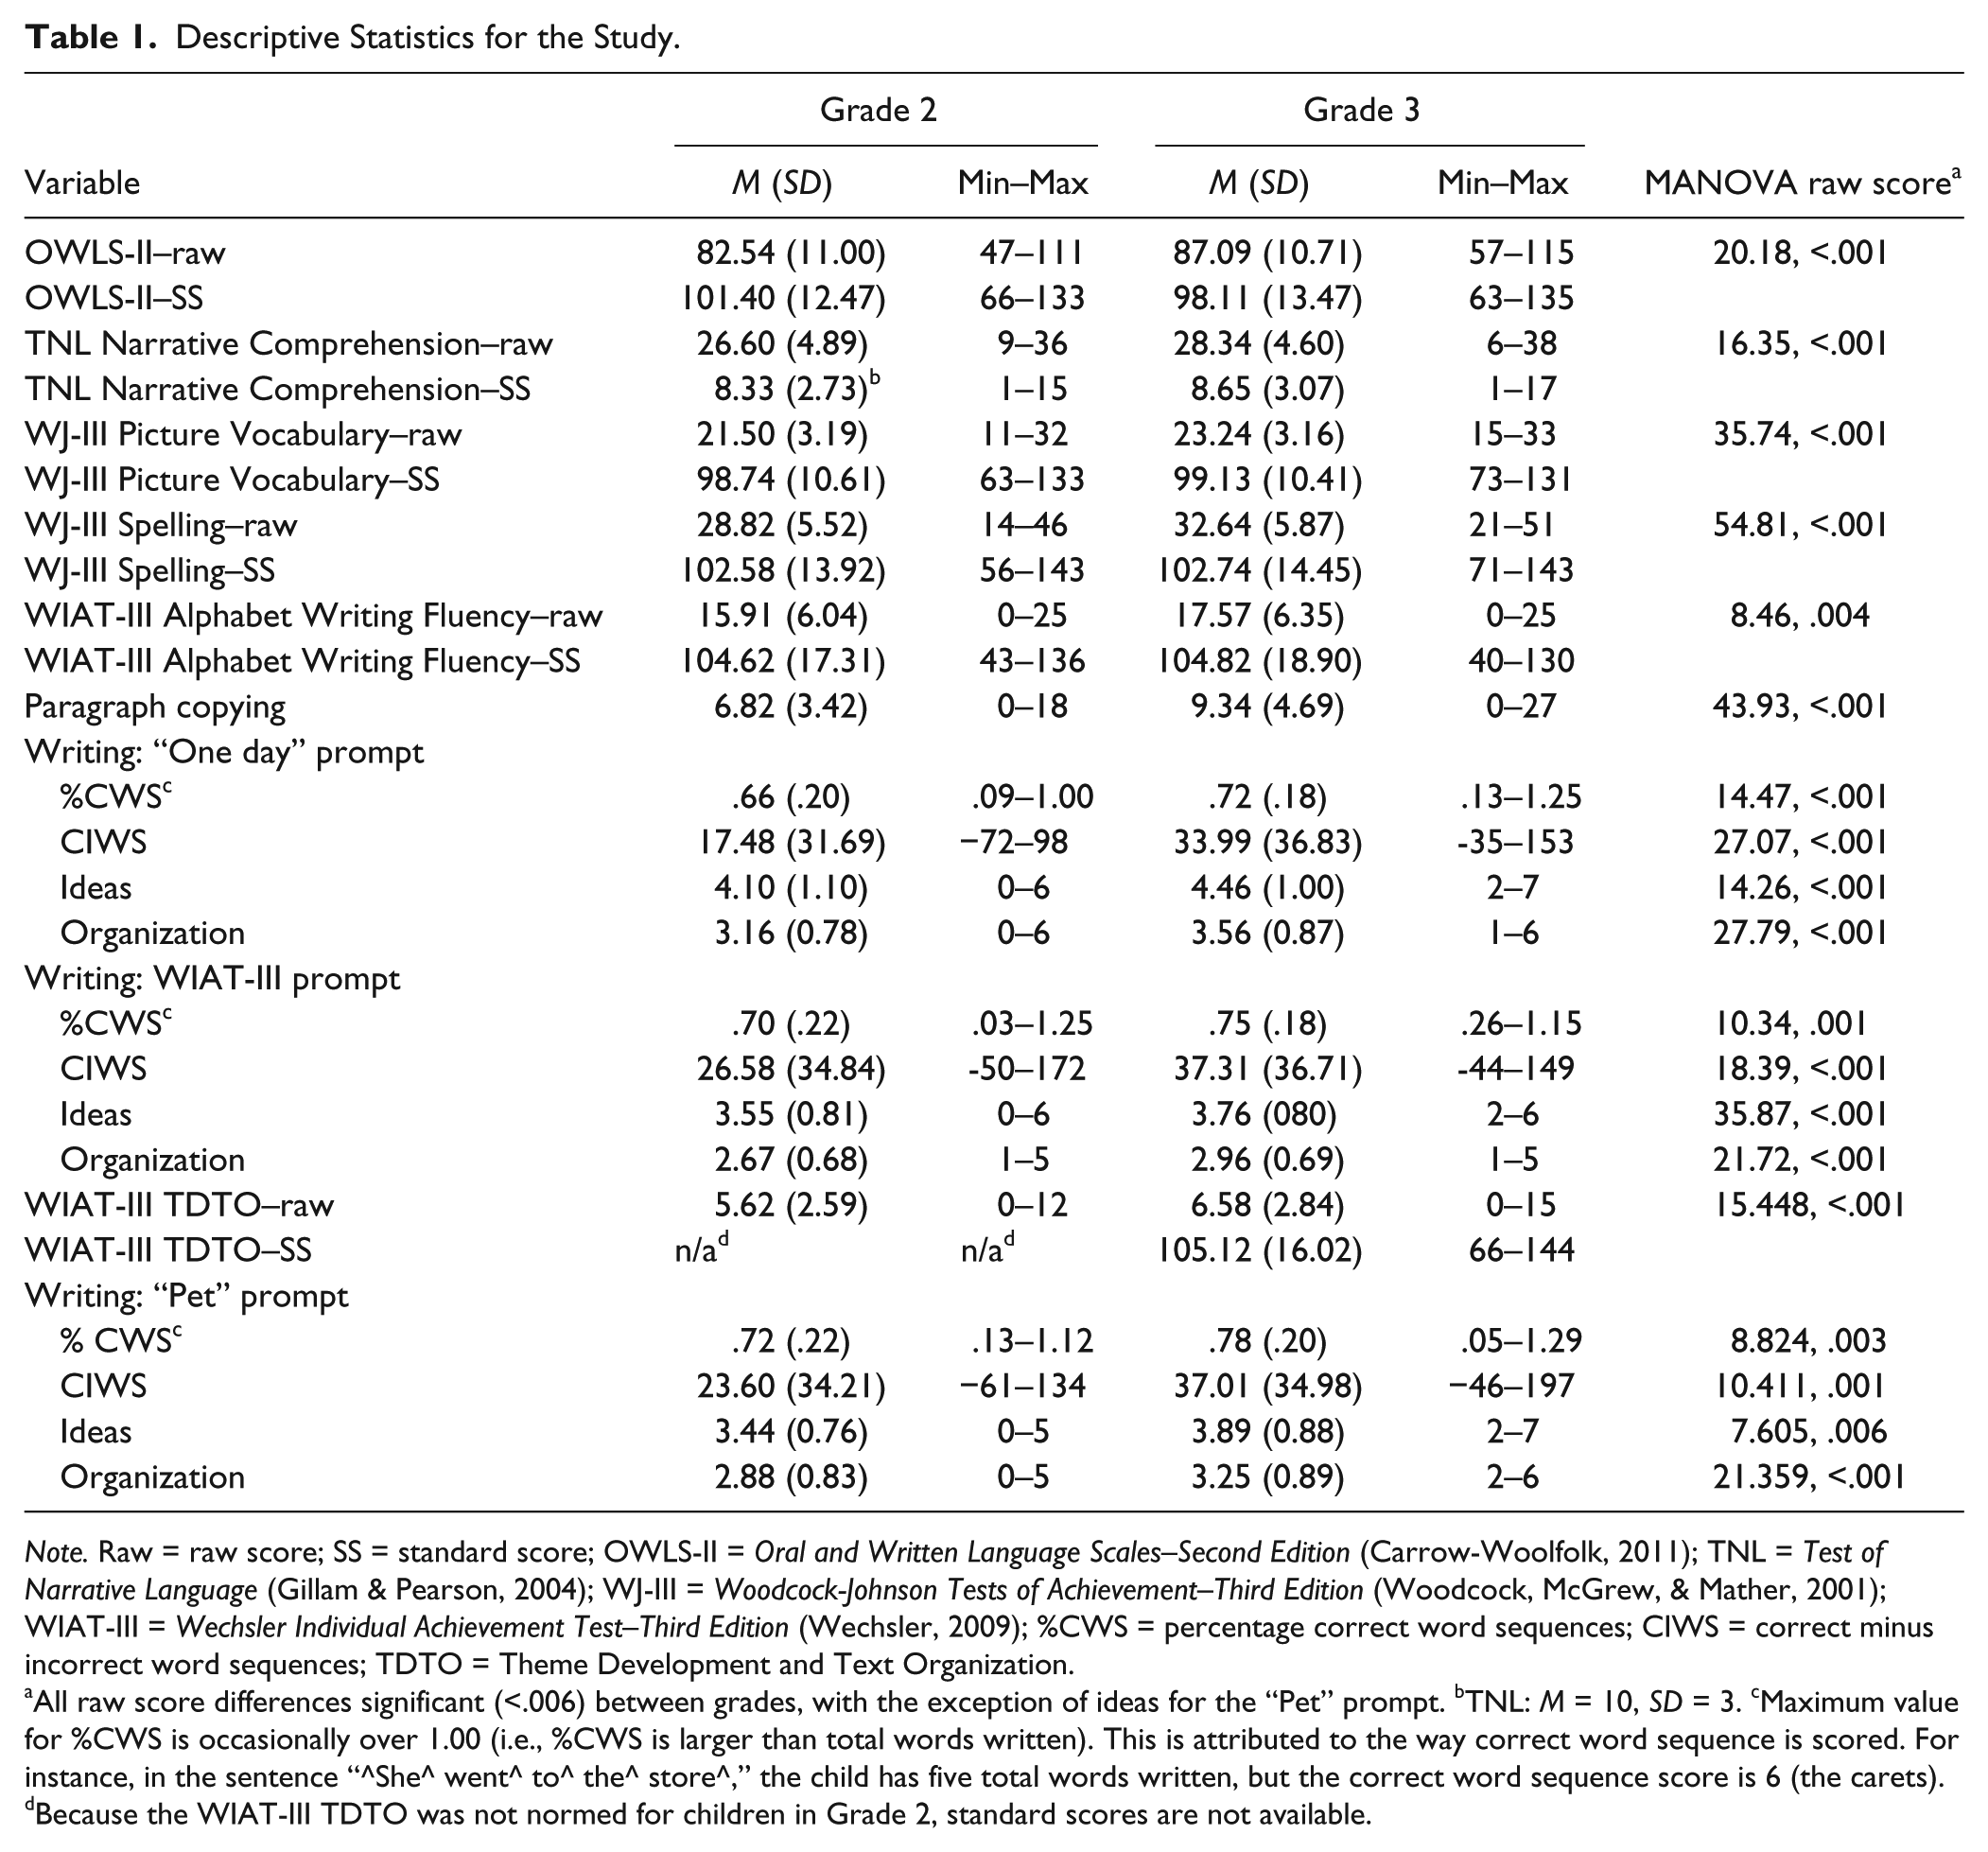
Note. Raw = raw score; SS = standard score; OWLS-II = Oral and Written Language Scales–Second Edition (Carrow-Woolfolk, 2011); TNL = Test of Narrative Language (Gillam & Pearson, 2004); WJ-III = Woodcock-Johnson Tests of Achievement–Third Edition (Woodcock, McGrew, & Mather, 2001); WIAT-III = Wechsler Individual Achievement Test–Third Edition (Wechsler, 2009); %CWS = percentage correct word sequences; CIWS = correct minus incorrect word sequences; TDTO = Theme Development and Text Organization.
All raw score differences significant (<.006) between grades, with the exception of ideas for the “Pet” prompt. bTNL: M = 10, SD = 3. cMaximum value for %CWS is occasionally over 1.00 (i.e., %CWS is larger than total words written). This is attributed to the way correct word sequence is scored. For instance, in the sentence “^She^ went^ to^ the^ store^,” the child has five total words written, but the correct word sequence score is 6 (the carets). dBecause the WIAT-III TDTO was not normed for children in Grade 2, standard scores are not available.
Raw scores on each of the study measures were compared between grade levels using a multivariate analysis of variance. Given multiple comparisons, a Benjamini-Hochberg linear step-up procedure was used (Benjamini & Hochberg, 1995) to account for Type I error. The Benjamini-Hochberg, or false discovery rate, procedure is appropriate when multiple statistical tests are being performed on the same set of data but yields greater power than the more conservative Bonferroni technique, which controls for the familywise error rate (see also Thissen, Steinberg, & Kuang, 2002; Williams, Jones, & Tukey, 1999). As shown in Table 1, the results of the multivariate analysis revealed that Grade 3 children’s raw scores were significantly higher than Grade 2 children’s scores on all of the measures in the study. Subsequent analyses were conducted using raw scores.
Table 2 shows the correlations between measures for children in Grade 2 (lower diagonal) and those in Grade 3 (upper diagonal). Correlations were in the expected directions and range compared to previous studies (e.g., Berninger & Abbott, 2010; Graham et al., 1997; Kim, Al Otaiba, et al., 2014; Wagner et al., 2011). Oral language measures were moderately related to each other. Writing measures also tended to be moderately related to each other.
Correlation Matrix for Measures (Lower Diagonal for Second Grade and Upper Diagonal for Third Grade).
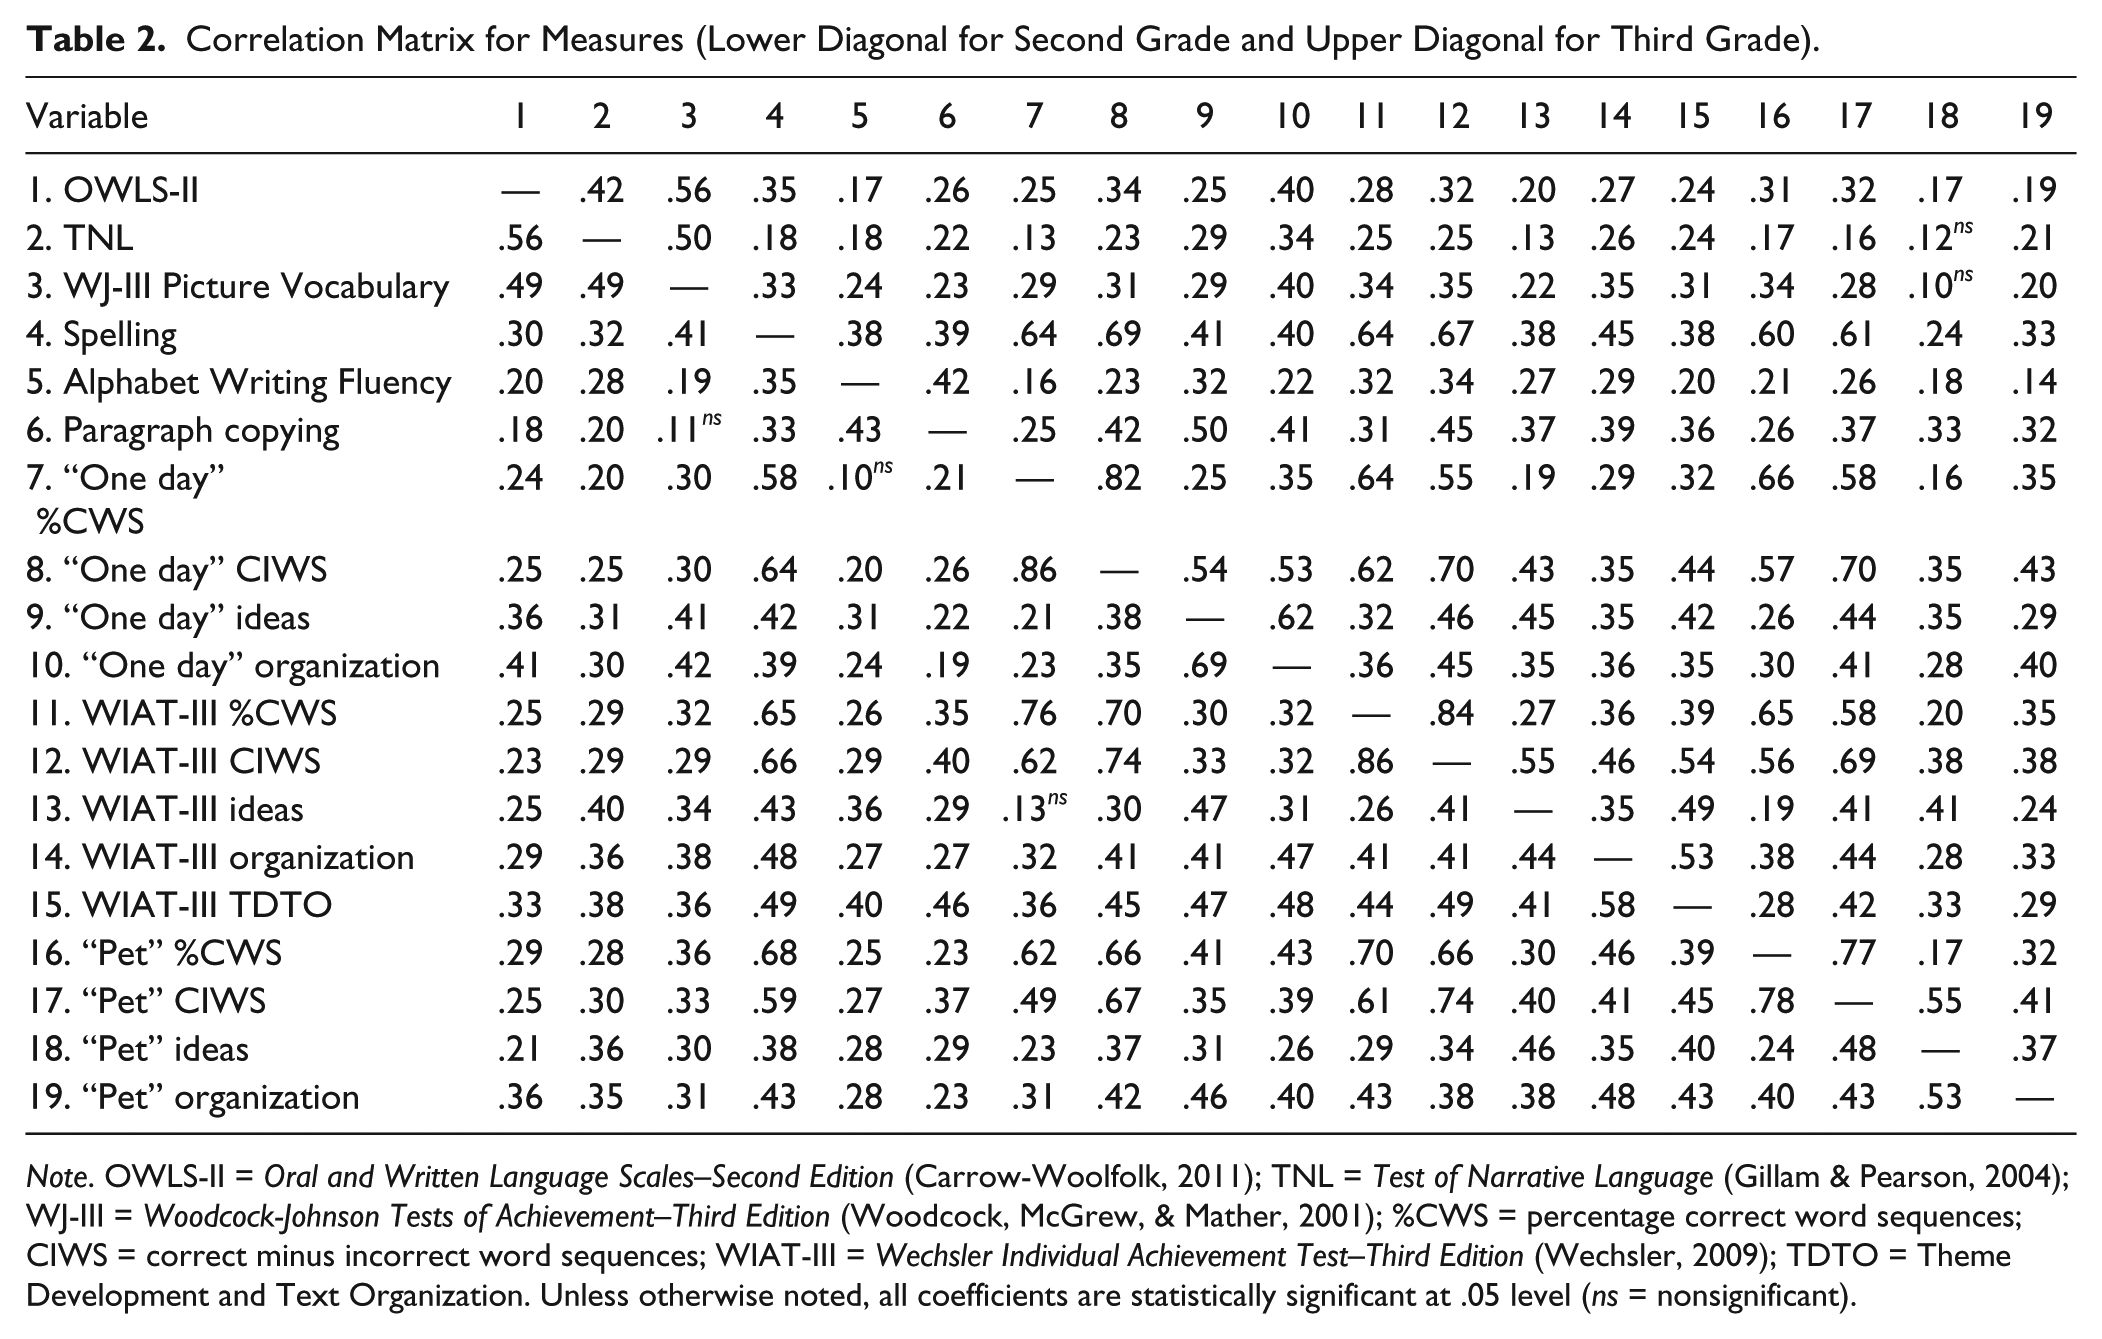
Note. OWLS-II = Oral and Written Language Scales–Second Edition (Carrow-Woolfolk, 2011); TNL = Test of Narrative Language (Gillam & Pearson, 2004); WJ-III = Woodcock-Johnson Tests of Achievement–Third Edition (Woodcock, McGrew, & Mather, 2001); %CWS = percentage correct word sequences; CIWS = correct minus incorrect word sequences; WIAT-III = Wechsler Individual Achievement Test–Third Edition (Wechsler, 2009); TDTO = Theme Development and Text Organization. Unless otherwise noted, all coefficients are statistically significant at .05 level (ns = nonsignificant).
To examine whether %CWS and CIWS captured a dissociable construct, text writing fluency, from productivity (total words written) and writing quality indicators (ideas and organization), three alternative confirmatory factor models were fitted and compared. In the first model, all the indicators were hypothesized to capture a single latent variable. This model yielded a poor fit to the data, χ2(87) = 1096.21, p < .001; CFI = .84; TLI = .77; RMSEA = .15; SRMR = .10. In the second model, writing quality was hypothesized to be a dissociable latent variable from another latent variable composed of %CWS, CIWS, and total words written. This model was improved over the first model, Δχ2(Δdf = 1) = 74.98, p < .001, but model fit was still below criterion, χ2(86) = 1021.23, p < .001; CFI = .85; TLI = .79; RMSEA = .15; SRMR = .10. In the final model, writing quality, writing fluency (%CWS and CIWS), and writing productivity (total words written) were hypothesized to be all related but dissociable latent variables. The model yielded an adequate model fit, χ2(85) = 523.15, p < .001; CFI = .93; TLI = .90; RMSEA = .10; SRMR = .07, and was superior to the first model, Δχ2(Δdf = 2) = 573.06, p < .001, and the second model, Δχ2(Δdf = 1) = 498.08, p < .001. These results suggest that writing quality (quality of ideas and organization), writing fluency (%CWS and CIWS), and writing productivity (total words written) are best described as related but dissociable variables. Writing quality was strongly related to text writing fluency (r = .80) and to writing productivity (r = .73). Text writing fluency was moderately related to writing productivity (r = .53).
On the basis of these results, we used writing quality and text writing fluency (%CWS and CIWS) but not writing productivity in the subsequent analysis because our focal question was structural relations among writing quality, text writing fluency, oral language, handwriting fluency, and spelling. Latent variables were created for oral language and handwriting fluency as well. Spelling was assessed by a single task, and therefore an observed variable was used. As shown in Figures 2 and 3, loadings of each task (or scores) to latent variables were all moderate or strong.
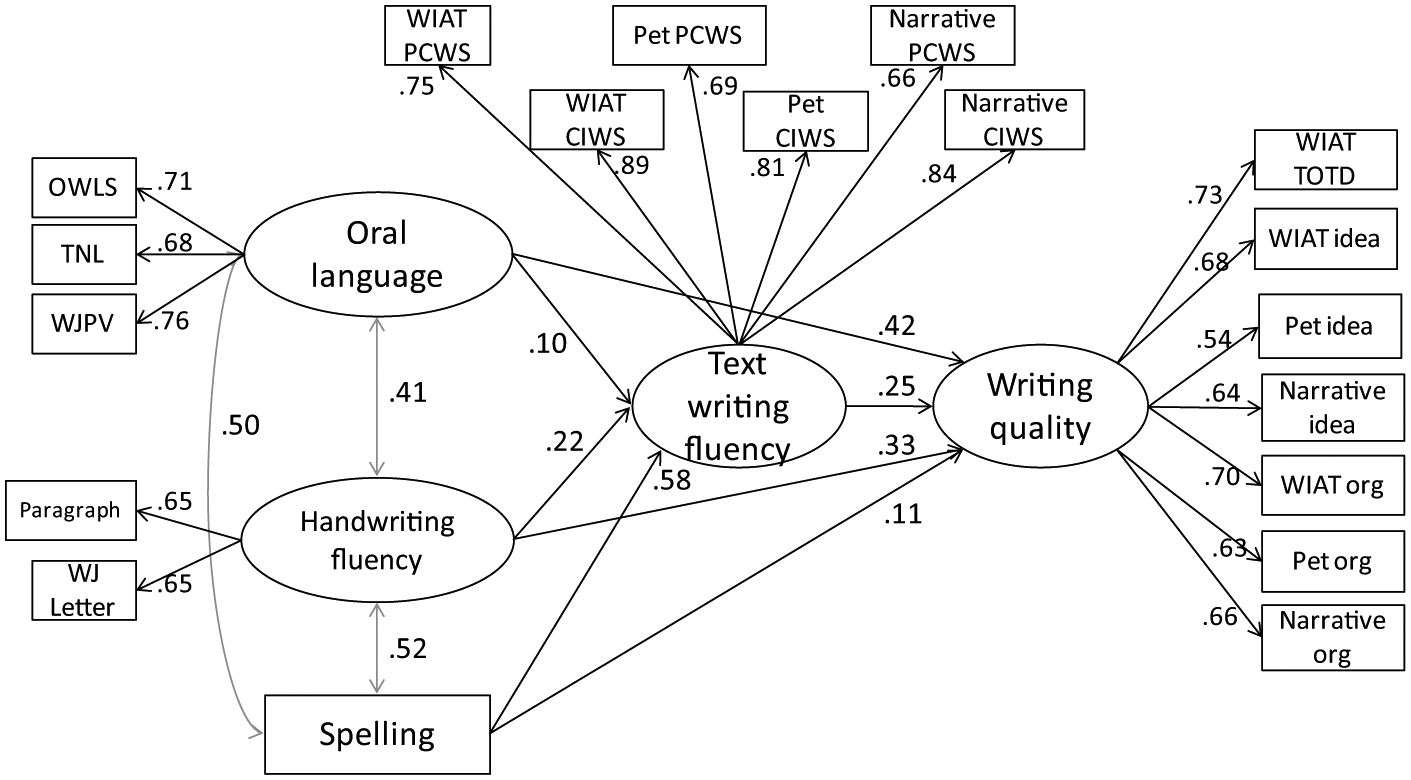
Standardized regression weights of oral language, handwriting fluency, spelling, and text writing fluency to writing quality for Grade 2 children. Solid lines represent statistically significant relationships, dashed lines represent nonsignificant relationships, and gray lines represent correlations.
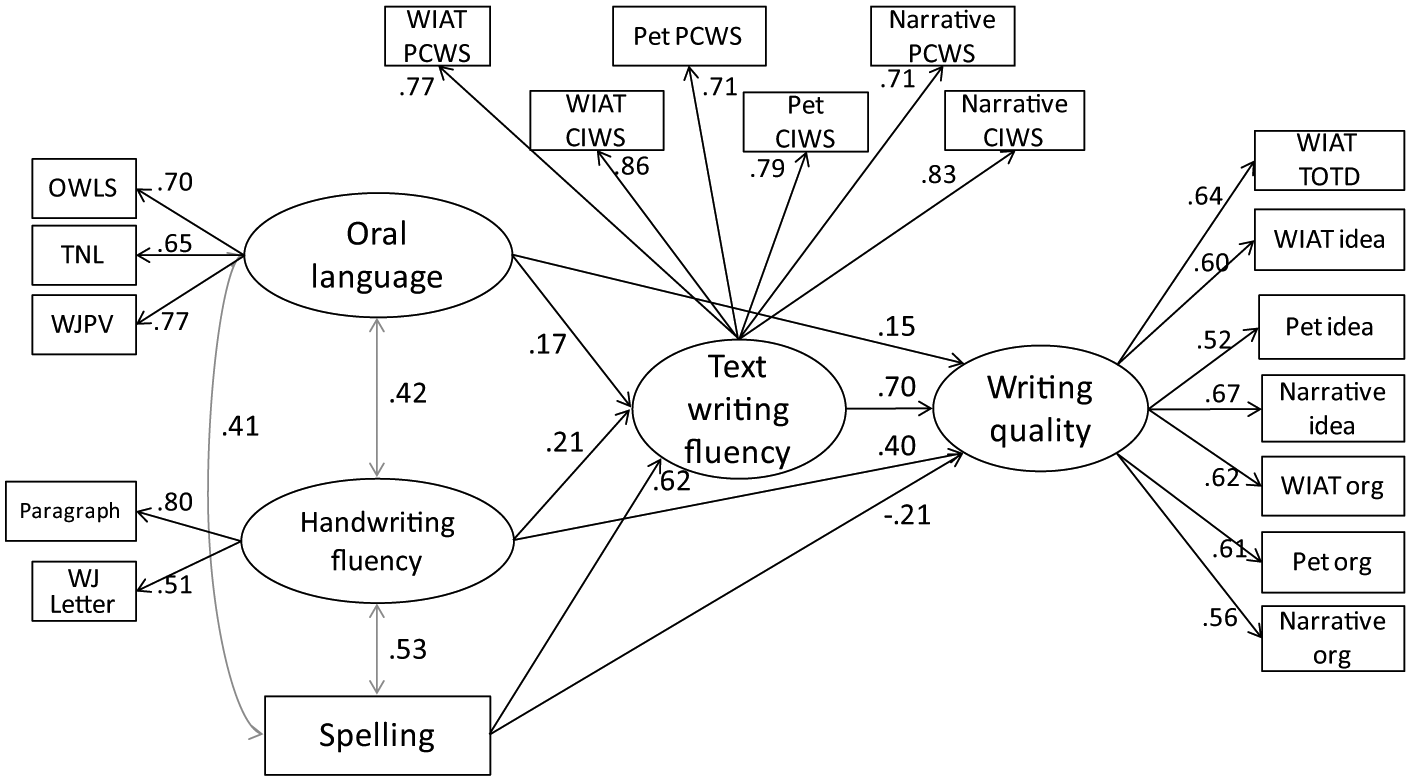
Standardized regression weights of oral language, handwriting fluency, spelling, and text writing fluency to writing quality for Grade 3 children. Solid lines represent statistically significant relationships; gray lines represent correlations.
Relationships of Oral Language, Transcription Skills, and Writing Fluency to Writing Quality
Given that there were two groups of children, multigroup structural equation modeling was employed and measurement invariance was examined following procedures described in Brown (2006) and Thompson and Green (2006). In multigroup analysis, factor loadings of observed measures to hypothesized latent variables are expected to be the same or similar for both groups to ensure unbiased effects of the measures across time points (Byrne & Watkins, 2003; Kline, 2005). First, a baseline model of non-invariance was specified, in which the loadings were allowed to vary completely. This model demonstrated a good fit to the data: χ2(284) = 664.56, p < .001; CFI = .93; TLI = .92; RMSEA = .07; SRMR = .06. When a full invariance model was fitted, the model did not converge, which is an indication of a poor model fit. Therefore, partial invariance models were fitted. After examining the raw loadings of each observed variable on its corresponding latent variable, equal loading constraints were relaxed for the following observed variables: the “One day” prompt CIWS and letter writing fluency. Note that although full measurement invariance is desirable, partial measurement invariance is typically fitted because of subtle changes in measurement properties of indicators (e.g., reliability estimates).
To examine the hypothesized relations among oral language, transcription skills, text writing fluency, and writing quality, the mediation model (partial invariance model described above) shown in Figure 1 was fitted to the data. The model had a good fit to the data: χ2(296) = 695.63, p < .001; CFI = .93; TLI = .92; RMSEA = .07 (.07–.08); SRMR = .07; and standardized path coefficients are shown in Figures 2 and 3 for children in Grade 2 and Grade 3, respectively. In Grade 2, handwriting fluency was weakly but statistically significantly related to text writing fluency (γ = .22, p = .007), and spelling was moderately related to text writing fluency (γ = .58, p < .001). In contrast, oral language was not related to text writing fluency (γ = .10, p = .17). However, the writing quality outcome was only moderately related to oral language (γ = .42, p < .001) and handwriting fluency (γ = .33, p < .001). Spelling, in contrast, was not related to writing quality after accounting for text writing fluency, oral language, and handwriting fluency. Text writing fluency was also weakly but significantly related to writing quality (β = .25, p = .007) after accounting for oral language, handwriting fluency, and spelling. Approximately 60% of total variance in text writing fluency and 78% of variance in writing quality were explained.
In Grade 3, handwriting fluency (γ = .21, p = .003) and spelling (γ = .62, p < .001) were related to text writing fluency. Oral language (γ = .17, p = .005) was weakly but independently related to text writing fluency after accounting for handwriting fluency and spelling. When it came to writing quality, oral language was weakly related (γ = .15, p = .03). Handwriting fluency (γ = .40, p < .001) was moderately related, whereas spelling had a suppressor effect (γ = –.21, p = .02) after accounting for handwriting fluency, oral language, and text writing fluency. Text writing fluency was strongly related to writing quality (β = .70, p < .001). Approximately 71% of total variance in text writing fluency and 86% of variance in writing quality were explained.
Discussion
The primary goal of the present study was to develop a conceptual model of text writing fluency and to empirically test the model using data from children in Grades 2 and 3. To this end, we extended a recent proposal of writing fluency (Ritchey et al., 2015) by specifying the nature of relations from a component-based and developmental perspective. Our shorthand definition of writing fluency was efficiency and automaticity of writing connected texts. On the basis of this definition and previous studies on predictive validity, we hypothesized that two CBM writing scores, %CWS and CIWS, would be appropriate measures of writing fluency because these indicators capture accuracy as well as speed (or the amount of text written). Total number of words written, one of many indicators of CBM writing (see McMaster & Espin, 2007, for a review), has been widely investigated in previous studies as writing productivity (Kim, Al Otaiba, et al., 2014; Kim, Al Otaiba, et al., 2015; Mackie & Dockrell, 2004; Puranik et al., 2008; Wagner et al., 2011) and at times has been labeled as writing fluency (Abbott & Berninger, 1993; Berninger, Abbott, et al., 2002; Graham et al., 1997). When we explicitly tested dimensionality of writing quality (ideas and organization), text writing fluency (%CWS and CIWS), and writing productivity (total words written), results revealed that all three of these constructs are best described as related but dissociable. In fact, the correlation between text writing fluency and writing productivity was moderate (r = .53) compared to strong relations of writing quality to text writing fluency (r = .80) and writing productivity (r = .73; see Note 4).
Extending the developmental models of writing, such as the simple view of writing (Berninger, Abbott, et al., 2002; Juel et al., 1986) and not-so-simple view of writing (Berninger & Winn, 2006), we hypothesized that the text writing fluency construct would draw on both transcription and oral language skills and act as a mediator between these skills and writing quality. In fact, the nature of relations of transcription and oral language skills to text writing fluency was hypothesized to differ across development. During the beginning phase of writing, which may be prolonged for students with writing difficulties or disabilities, transcription skills would severely constrain children’s available cognitive resources to a large extent such that oral language would make a limited contribution to text writing fluency, which in turn may preclude their ability to meet grade-level CCSS standards. With further development in transcription skills, children’s cognitive resources may become available to a greater extent to allow access to their linguistic, meaning-processing capacity, leading to a relation of oral language to text writing fluency. Our findings revealed that for children in Grade 2 who had lower skills in the assessed constructs, text writing fluency was predicted by transcription skills (spelling and handwriting fluency) but not by oral language. For children in Grade 3, in contrast, oral language made an independent contribution to text writing fluency over and above transcription skills. Transcription skills were consistently related to text writing fluency as expected. After all, efficient writing of connected texts (text writing fluency) requires and depends on transcription skills. What differentiates text writing fluency from transcription skills, however, is that text writing fluency involves context, which is inherent in connected texts, and thus, text writing fluency draws on meaning processes (oral language) over and above transcription skills. Overall, a large amount of variance was explained in text writing fluency by the oral language and transcription skills (60% in Grade 2 and 71% in Grade 3).
At the center of theorizing the text writing fluency construct was its mediation role—that is, text writing fluency would mediate the relations of oral language and transcription skills to writing, at least partially. Our findings suggest a partial mediation for children in Grades 2 and 3. Text writing fluency was related to writing quality over and above oral language and transcription skills in both Grades 2 and 3. In addition, oral language and handwriting fluency remained related to writing quality over and above text writing fluency. Therefore, although oral language and transcription skills are captured in text writing fluency to some extent, aspects of oral language and transcription skills not captured in text writing fluency (operationalized by %CWS and CIWS) are important to writing quality. According to recent evidence, aspects that independently contribute to writing might include higher-order cognitive skills, such as inference and perspective taking. Writing requires these higher-order reasoning skills (Hayes, 1996; Kim & Schatschneider, 2017), but the two CBM writing scores primarily examine children’s ability to transcribe and use words in grammatically correct sequences (e.g., correct word sequences and incorrect word sequences). Therefore, higher-order reasoning processes that are important to discourse-level oral language, such as inference (Kendeou et al., 2008; Kim, 2015b, 2016; Tompkins et al., 2013) and perspective taking and reasoning (Kim, 2015b, 2016; Kim & Phillips, 2014; Strasser & del Rio, 2014) are not captured by the CBM writing scores and may explain the independent relation of oral language (i.e., discourse-level oral language) to writing quality over and above %CWS and CIWS.
It is notable that the nature of the mediating role of text writing fluency differed for two transcription skills: handwriting fluency and spelling. For handwriting, text writing fluency partially mediated the relation of handwriting fluency to writing quality, whereas spelling appears to be completely mediated by text writing fluency. In fact, spelling had a suppressor effect in Grade 3; it was positively related to writing quality in bivariate correlations (see Table 2), but after accounting for its relationship to text writing fluency, it had a negative relationship. The %CWS and CIWS, writing fluency indicators in the present study, are derived from correct word sequences and incorrect word sequences. In these scores, spelling accuracy is incorporated, and the present findings suggest that these CBM scores sufficiently capture children’s spelling ability and its role in writing.
The final hypothesis of the component-based and developmental model of text writing fluency was that the strengths of relations of text writing fluency to writing quality would differ as a function of developmental phase of writing (Grade 2 vs. Grade 3 in this study). We found differential magnitudes of relations, with a stronger relation in Grade 3. As noted above, this might be because efficiency and automaticity in writing connected texts (i.e., writing fluency) release attention and working memory to be used for higher-order, meaning-related processes (translating ideas into oral language, chunking propositions and ideas into meaningful units, and organizing ideas in a logical flow), which engender higher-quality writing. By contrast, inefficient and laborious writing of connected texts could interfere with composing processes by disrupting temporary representation of propositions and ideas in working memory.
Overall, the present findings support our conceptualization of text writing fluency and its relations with component skills and writing. Our theoretical model (see Figure 1) and the present results extend the simple view and not-so-simple view of writing by showing the mediating role of writing fluency between oral language and transcription skills, and writing quality. Our model is component based, as we hypothesized that text writing fluency draws on two component skills: transcription and oral language. Furthermore, text writing fluency acts as a mediator between these two component skills and the ultimate outcome of writing, writing quality. Our model is also developmental such that writing fluency is not a static construct but is functionally different for children at different developmental phases. Students with writing difficulties or disabilities may progress through these developmental phases at a slower rate than their peers. In the beginning phase, text writing fluency is largely constrained by transcription skills, whereas with further development of transcription skills, text writing fluency reflects a state where cognitive resources, such as attention and working memory, can be allocated to meaning processes. Thus, students with writing difficulties or disabilities may need to develop these transcriptions skills to greater facility or receive assistive technology in transcription to allow for cognitive resources to be allocated toward meaning processes. Overall, a large amount of variance in writing quality was explained by this component-based and developmental model of text writing fluency: 78% in Grade 2 and 86% in Grade 3.
It should be noted that the two focal CBM writing scores, %CWS and CIWS, were measured using a mixture of CBM writing tasks. As noted earlier, CBM tasks are typically timed (e.g., 5 min), but the tasks used in the present study included one task that was used in a CBM framework in previous studies (i.e., the “One day” prompt), whereas the other tasks were normed and standardized tasks that have not been previously used in a CBM framework. All of these tasks were administered with a 10-min time limit. We argue that this did not present a problem in examining our conceptualization of text writing fluency because, as described above, the task requirement for text writing fluency is assessing writing ability in connected-text writing with a reasonable time limit, whereas the evaluation requirement was capturing accuracy and speed of transcription and oral language.
Limitations and Directions for Future Research
Several limitations and related future directions are worth noting. As is the case with any study, the present findings should be interpreted keeping in mind the study focus and design. First, because our focus in the present study was conceptualizing and testing text writing fluency, other potential component skills of writing, such as discourse knowledge (see Bereiter & Scardamalia, 1987; Olinghouse & Graham, 2009), were not included. Similarly, in line with our conceptualization, writing outcome was writing quality, and therefore other outcomes (e.g., writing productivity) were not examined but could be examined in future studies.
Second, generalizability of the findings is limited to students from similar backgrounds. The majority of our sample children were from low socioeconomic backgrounds, although their mean performances on normed language and literacy skills were in the average range. These results should be replicated with different populations, including children with identified LD, children with writing disabilities, and children learning to write in languages other than English.
Third, the present investigation was conducted with a cross-sectional sample. Although children in Grade 3 had higher mean performances than those in Grade 2 on all the tasks, given the developmental hypotheses, future replication with longitudinal samples is warranted. Longitudinal studies with older children or for a longer time span (e.g., capturing the elementary grades though middle school or from Grades 2 to 6) would also illuminate whether text writing fluency would completely mediate the relations of oral language and transcription skills at a later developmental point than what we observed in the present study. In this study we found that text writing fluency played a partial mediating role. Our speculation is that text writing fluency, as operationalized by %CWS and CIWS at least, would partially mediate the relation of oral language to writing quality, because those two indicators capture only certain aspects of oral language and do not capture higher-order skills as described above. Fourth, we used a single task for the spelling construct, and therefore replication using a latent spelling variable would be informative.
The language measures in the present study included both receptive and expressive measures, and therefore the oral language construct in the present study captured common variance among the receptive and expressive discourse-level tasks. A recent study showed that receptive and expressive discourse-level skills are best described as having a bifactor structure with an underlying core, discourse-level oral language, along with task-specific (receptive vs. expressive) aspects, and it was the core discourse-level oral language construct that predicted reading, rather than task-specific aspects (Kim, Park, & Park, 2015). A future replication of the present study could include only expressive measures of oral language (e.g., see Kim & Schatschneider, 2017).
Implications for Practice
The present findings offer some important implications. First, inadequate efficiency in connected-text writing as measured by %CWS and CIWS is primarily due to transcription skills for children in primary grades. Therefore, systematic and explicit instruction on transcription skills are expected to facilitate children’s text writing fluency as well as writing quality. Instruction and intervention must include explicit and systematic instruction to ensure mastery for these basic skills. Notably, though, to develop writing skills, including text writing fluency, children also need support to develop and use their oral language skills for writing. Therefore, instructional attention to oral language, particularly for low-achieving writers and students with LD in writing, is needed as part of writing instruction, including text writing fluency and writing quality. High scores in %CWS and CIWS indicate that students can transcribe their thoughts in a grammatically accurate manner. In contrast, low scores indicate an instructional need to emphasize transcription and language aspects for writing. For example, in CIWS, low or negative scores indicate that although students can produce connected texts drawing on transcription and certain aspects of oral language skills (e.g., vocabulary and grammar), their accuracy needs to be developed, and students need opportunities to see these aspects, apply them, and receive feedback. Qualitative analysis of errors can reveal whether students need help with transcription, oral language, or both aspects.
In closing, we are mindful of the large number of students in Grades 4 and beyond who cannot write proficiently enough for grade-level standards, including the CCSS. To narrow the gap between their writing skills and the CCSS, we believe that the present study showed emerging evidence about text writing fluency that could provide guidance for instruction and address the need for intervention and adaptations. Developing a solid theoretical conceptualization about text writing fluency is critical to moving the field forward to expand our understanding of children’s writing development. The present study represents an important first step in that direction, but it is clear that much work remains.
Footnotes
Declaration of Conflicting Interests
The author(s) declared no potential conflicts of interest with respect to the research, authorship, and/or publication of this article.
Funding
The author(s) disclosed receipt of the following financial support for the research, authorship, and/or publication of this article: This research was supported by Grant P50HD052120 from the National Institute of Child Health and Human Development. The content is solely the responsibility of the authors and does not necessarily represent the official views of the National Institute of Child Health and Human Development. The authors appreciate participating children, their parents, and teachers and school personnel.