
Abstract
This study investigated the accuracy of three fraction measures (i.e., fraction number line estimation accuracy, general fraction concepts, and fraction arithmetic) for screening fourth graders who might be at risk for mathematics difficulties. Receiver operating characteristic (ROC) curve analyses assessed diagnostic accuracy of the fraction measures for predicting which students would not meet state standards on the state mathematics test in fourth grade (n = 411), fifth grade (n = 362), and sixth grade (n = 304). A combined measure consisting primarily of fraction number line estimation items and general fraction concept items was the most accurate screener of risk status in fourth, fifth, and sixth grades (area under the curve [AUC] = .84, .81, and .85, respectively). To maximize efficiency for classroom use, the length of the combined screener was reduced using best subset automatic linear modeling. The study highlights the importance of fraction knowledge for predicting mathematics achievement more generally and validates an effective and practical screening tool for the intermediate grades.
Proficiency in algebra paves the way for success in science, technology, engineering, and mathematics (STEM) college courses and vocations (National Mathematics Advisory Panel [NMAP], 2008). Fraction knowledge, in turn, is foundational for learning algebra (Booth, Newton, & Twiss-Garrity, 2014). As such, fractions are a critical aspect of mathematics education in the elementary and intermediate grades (National Governors Association Center for Best Practices & Council of Chief State School Officers, 2010; NMAP, 2008). Unfortunately, fractions present challenges for many students. A large number of students struggle to develop even a basic understanding of fractions (e.g., Bailey, Hoard, Nugent, & Geary, 2012; Hansen, Jordan, & Rodrigues, 2017), and many students show minimal growth in fraction magnitude knowledge between fourth and sixth grades (Resnick et al., 2016), the period when fractions are taught in school. Fractions are particularly hard for students with diagnosed learning disabilities (Jordan, Resnick, Rodrigues, Hansen, & Dyson, 2017).
Research demonstrates that fraction knowledge is a uniquely important predictor of later mathematics achievement when controlling for the contributions of cognitive abilities, other number skills, and socioeconomic status (SES; e.g., Resnick et al., 2016; Siegler et al., 2012). In light of the importance of fractions, we were interested in investigating whether fraction measures could serve as predictive screeners of later mathematics difficulties for the intermediate grades. These fraction measures included a single proficiency measure that assessed students’ accuracy when estimating fraction magnitudes on a number line, a more general measure of fraction concepts, and a measure of fraction arithmetic skills.
Using receiver operating characteristic (ROC) curve analyses, this study assessed the diagnostic accuracy of the measures for identifying students who do not meet state benchmarks in mathematics. In addition, we explored the accuracy of combinations of various measures. Research suggests that multiple-proficiency screeners may be more fruitful than a screener that targets only one discrete skill (e.g., Purpura, Reid, Eiland, & Baroody, 2015).
Screening for Mathematics Difficulties
Previous studies on mathematics screeners for identifying students at risk for mathematics difficulties have concentrated on the primary grades (e.g., Jordan, Glutting, & Ramineni, 2008; Lembke & Foegen, 2009). This focus is not surprising, as school personnel want to identify at-risk students as early as possible in hopes of circumventing later difficulties. Yet, there is also a need for screening students in the intermediate grades, when the demands for mathematics shift dramatically (Gersten, Clarke, Haymond, & Jordan, 2011; Gersten et al., 2012). Powell, Fuchs, and Fuchs (2013) describe these shifts in the mathematics curriculum in the intermediate grades as “curricular twists and turns” (p. 42) that can result in late-emerging mathematics difficulties. Powell et al. (2013) highlight fractions as an example of a new challenge in the upper elementary grades that poses difficulties for many students who have not previously struggled with mathematics. Without valid screener measures for the intermediate grades, schools may miss these students who are struggling and will be ill-prepared for more advanced mathematics without intervention.
Next, we provide a review of studies exploring mathematics screeners for the intermediate grades, beginning with studies discussed in the 2009 What Works Clearinghouse practice guide and leading up to more recent investigations.
Mathematics Screeners for the Intermediate Grades
The What Works Clearinghouse practice guide for assisting students struggling with mathematics (Gersten et al., 2009) cites only two studies that assess screeners beyond the second grade (Foegen, Jiban, & Deno, 2007; Jiban & Deno, 2007). The first study mentioned in the practice guide investigated timed, 1-min measures of whole number facts (e.g., 6 – 1 = ?) administered in both third and fifth grades as predictors of performance on a statewide mathematics test at the end of each grade (Jiban & Deno, 2007). A limitation of the study is the reliance on multiple regression analyses to assess the accuracy of whole number fact measures predicting later mathematics achievement. Although regression analyses are considered a good starting point, they are insufficient for assessing the utility of a screening tool. A common goal of screening is often to avoid “false-negative” errors, which refers to the occurrence of a student who is truly at risk being incorrectly identified as not at risk; in other words, a student who needs additional support is not detected by the screener. Regression models do not allow researchers to prioritize avoidance of false negatives because the models weigh positive and negative errors of the same magnitudes equally. The second study cited in the practice guide (Gersten et al., 2009) for providing data on mathematics screeners beyond second grade is a review written by Foegen and colleagues (2007). However, the studies mentioned in the review focus on assessing the reliability and criterion validity of mathematics measures rather than exploring the measures as screeners for predicting likelihood of risk (e.g., Foegen & Deno, 2001).
A subsequent review of the literature following the 2009 What Works Clearinghouse publication reveals that researchers have since turned to a more sophisticated methodology for exploring the accuracy of mathematics screeners: ROC curve analysis.
ROC Curve Analysis
Although the use of ROC curve analysis is a recent trend in mathematics screening literature for the intermediate grades (Keller-Margulis, Shapiro, & Hintze, 2008; Shapiro, Keller, Lutz, Santoro, & Hintze, 2006; VanDerHeyden, Codding, & Martin, 2017), the analysis has been leveraged for years in multiple fields as the state-of-the-art method for describing the accuracy of a diagnostic test (Weinstein, Obuchowski, & Lieber, 2005). ROC curves address limitations of traditional methods of determining diagnostic accuracy such as statistically significant group differences (Cahn-Weiner et al., 2003), correlational designs (Foegen et al., 2007), and regression models (VanDerHeyden et al., 2017). Advantages of the ROC curve analysis include the following: (a) the analysis assesses the overall accuracy of a measure for discriminating individual participants, (b) it is not dependent on the value of a specific cut score along a measure, (c) it is independent of assumptions about the normality of a measure’s score distribution (Hanley & McNeil, 1982), (d) it allows the researcher to prioritize certain decisions such as the avoidance of false negative errors (e.g., VanDerHeyden et al., 2017), and (e) it yields statistics that provide usable information for both research and application in the real world (Youngstrom, 2013).
One of the most valuable ROC statistics is the area under the curve (AUC). If one student is randomly selected from the at-risk population and another student is randomly selected from the higher-achieving population, the AUC is the probability of distinguishing between those two students with the predictor measure (McFall & Treat, 1999). Thus, an AUC of .50 means that the measure correctly places students 50% of the time, which would not be considered a powerful screener as it does not discriminate between students who are at risk and students who are not at risk. An AUC value of .75 and above is recommended in the educational literature as indicative of good screeners for determining risk status (Cummings & Smolkowski, 2015). ROC curve plots allow for a visual interpretation of AUC values (see Figure 1 for examples).
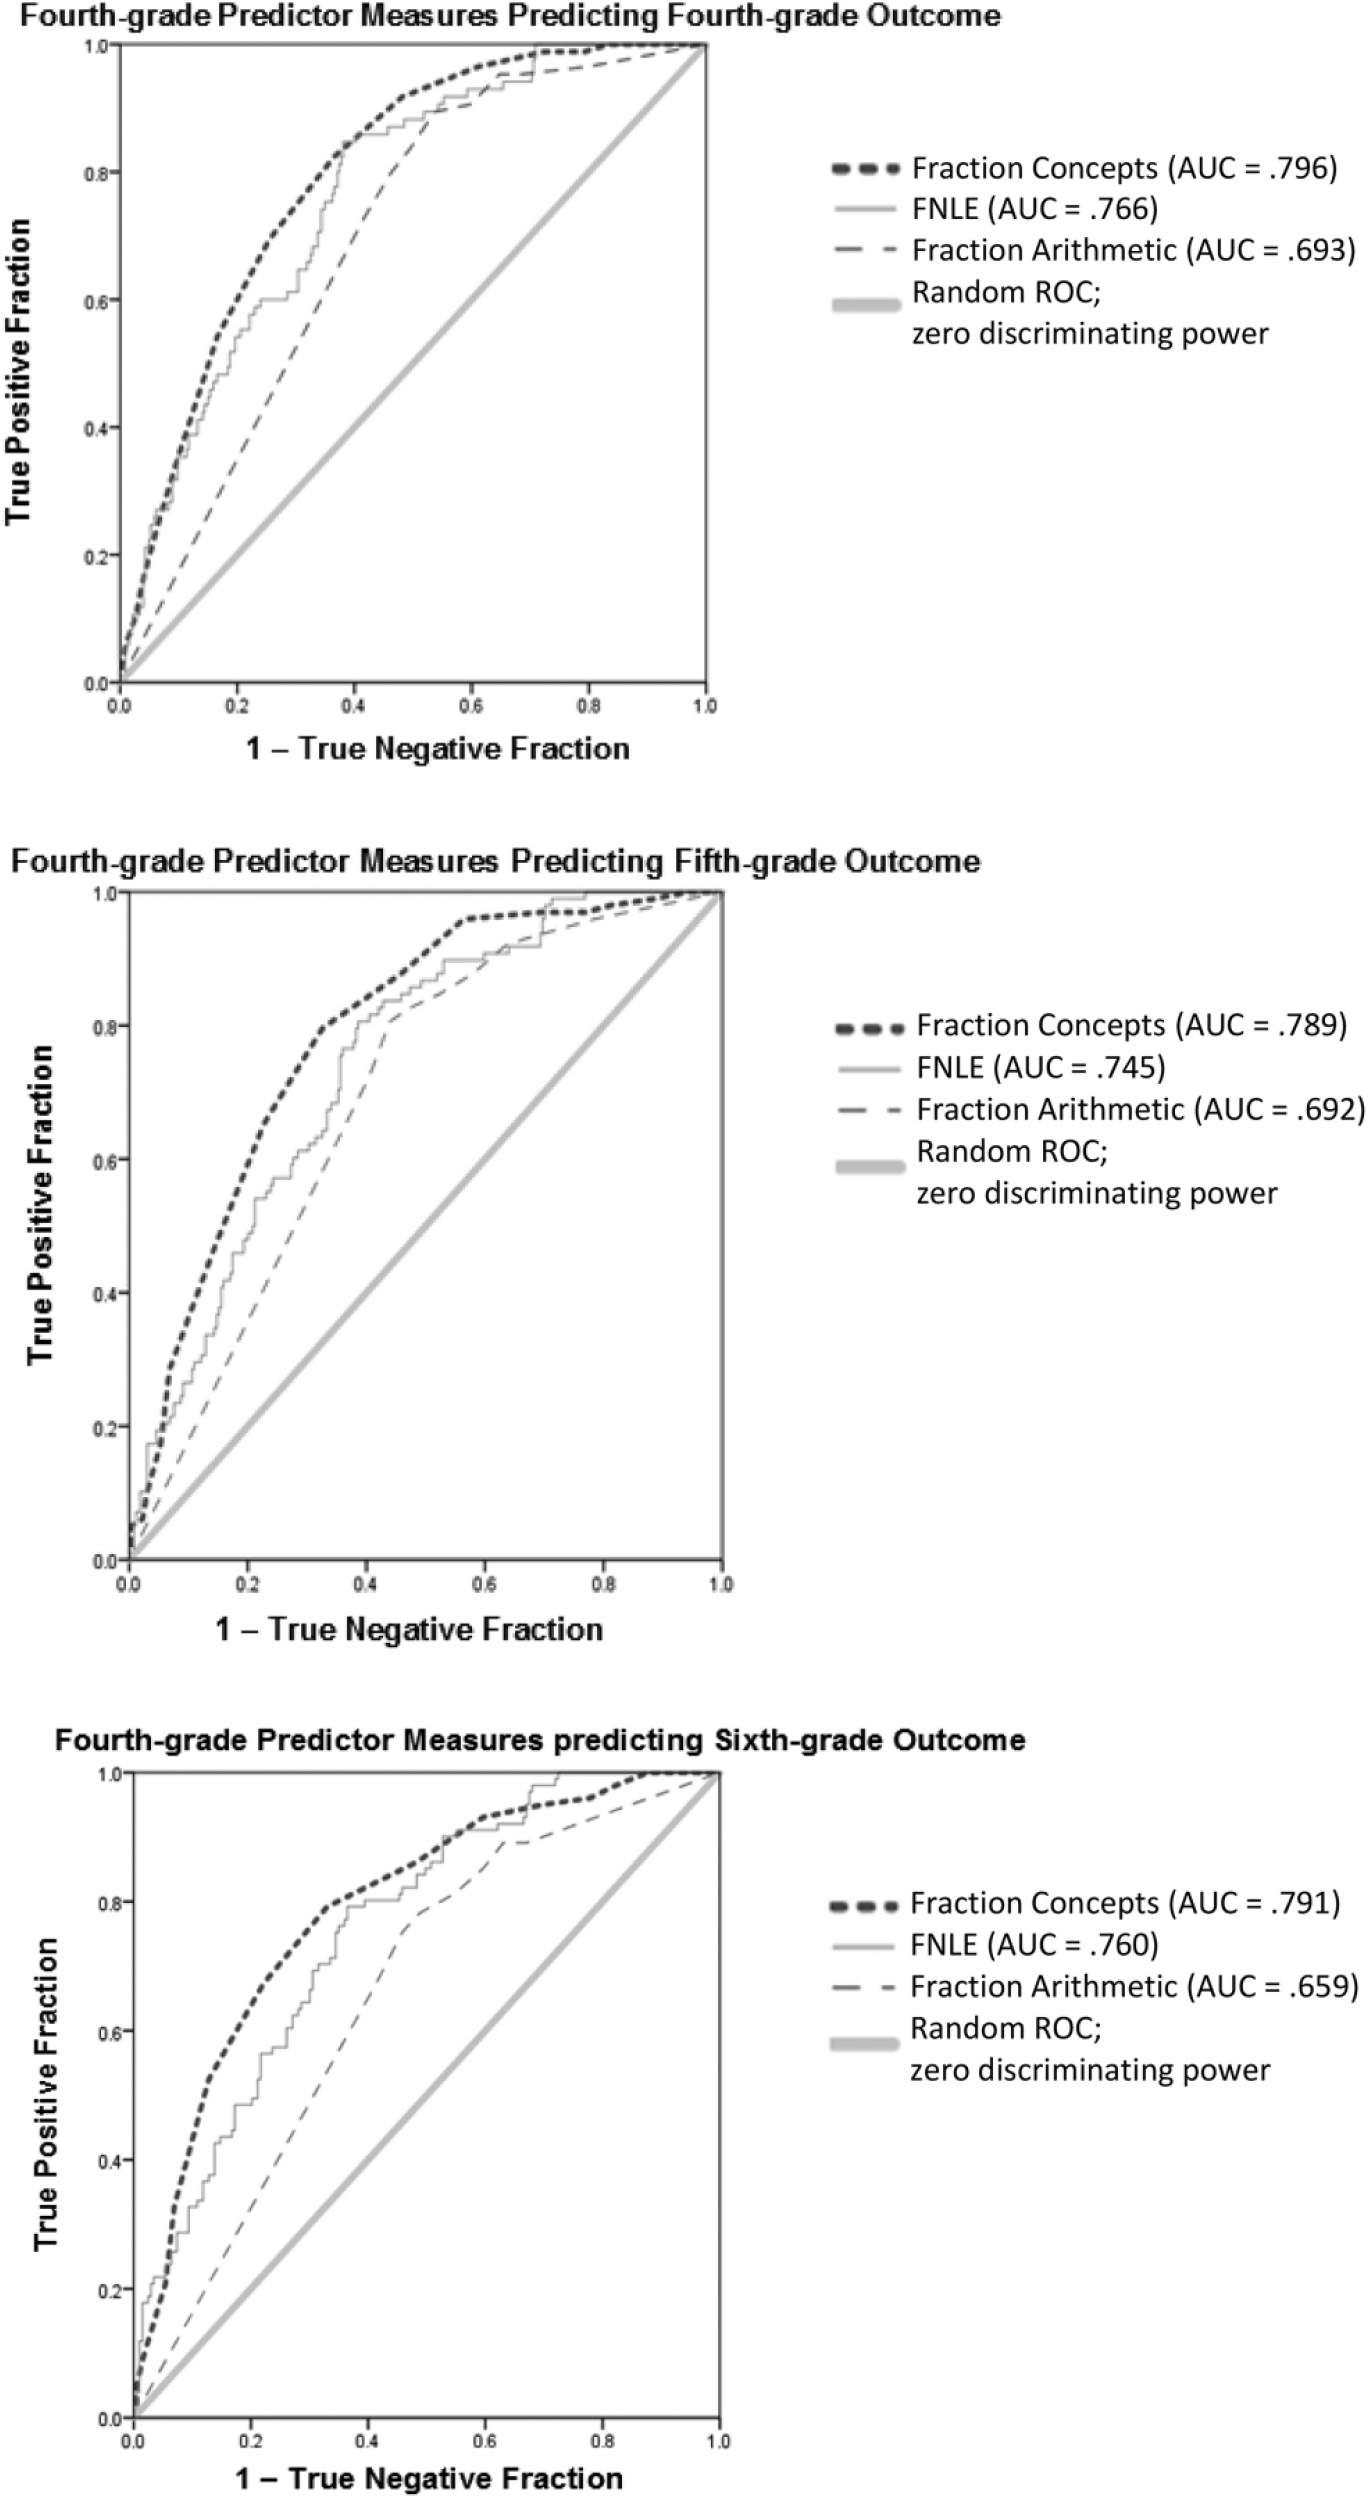
ROC curve plots and AUC values predicting each grade of the outcome.
Researchers Keller-Margulis and colleagues (2008) used ROC curve statistics to assess the accuracy of mathematics measures administered in the intermediate grades for predicting later mathematics achievement on a state standardized test. A fourth-grade mathematics computation measure that included problems of mixed operations and a concepts and applications measure that assessed counting, measurement, charts and graphs, money, fractions, and word problems yielded AUC values meeting and hovering around the threshold of good screeners for determining risk status (AUC = .79 and .72, respectively).
More recently, VanDerHeyden and colleagues (2017) used ROC curve analyses to assess several mathematics areas (multi-skill computation, single skill computation, and concepts/applications) and combinations of the areas administered in third, fourth, and fifth grades that best predicted end-of-year achievement in the same grade on a state mathematics test. Among the measures administered in the fall, the concepts and applications measure yielded the highest diagnostic accuracy for predicting year-end achievement in the third, fourth, and fifth grades (AUC = .80, .85, and .96, respectively). The fall computation measure met the AUC threshold in the third and fifth grades (AUC = .76 and .90, respectively) but did not perform as a strong screener in fourth grade (AUC = .72). The authors also assessed the accuracy of combined measures, finding that a multiple-measure model was the best fit to their data in fourth and fifth grades. Yet, they urge future research be done to replicate their findings with larger samples to assess the benefits of multiple measures versus single measures. Support for using a combination of measures is also found in the reading screening literature (e.g., Clemens, Keller-Margulis, Scholten, & Yoon, 2016). Although the administration of multiple measures requires additional resources and time, one possible solution to the concern is to reduce the number of items on the measures without sacrificing the diagnostic accuracy of the screener (Purpura et al., 2015).
Rationale for This Study
Fraction skills were purposefully selected for examination in this study because they comprise a large and potentially unifying portion of mathematics content during the upper elementary grades (National Governors Association Center for Best Practices & Council of Chief State School Officers, 2010). Moreover, fraction knowledge is associated with later mathematics success (e.g., Booth & Newton, 2012). Fractions are a particularly challenging topic for many students (e.g., Bailey et al., 2012), which further suggests the need to screen for difficulties in this area of mathematics. This study investigated fraction number line estimation (FNLE), general fraction concepts, and fraction arithmetic as screening tools for later mathematics achievement.
FNLE
The integrated theory of numerical development (Siegler & Lortie-Forgues, 2014; Siegler, Thompson, & Schneider, 2011) posits that numerical development is unified by one key understanding: All real numbers have magnitudes that can be represented on a number line. The development of numerical knowledge is considered as a process of broadening the set of numbers whose magnitudes can be accurately represented. The far-reaching importance of magnitude understanding in numerical development has been highlighted in early developmental studies (e.g., Libertus, Feigenson, & Halberda, 2011; Mazzocco, Feigenson, & Halberda, 2011) as well as in studies later in development using symbolic numerical tasks involving whole numbers and fractions (e.g., Resnick et al., 2016; Siegler et al., 2011; Torbeyns, Schneider, Xin, & Siegler, 2015). A valid measure of fraction magnitude knowledge is a FNLE task in which students estimate the locations of individual fractions on a number line (e.g., Resnick et al., 2016; Siegler et al., 2011). FNLE acuity is typically assessed with 0 to 1 and 0 to 2 number lines (i.e., a number line that begins with zero on the left endpoint and extends to 1 or 2 on the right endpoint) in the intermediate grades.
Students who struggle on FNLE tasks do not appear to have an intuitive grasp of fractions and the multiplicative relation between the numerator and the denominator. For example, these students often use a whole number strategy and place a fraction, such as 1/19, to the far right of a 0 to 2 number line, suggesting that they are relying on the magnitude of the denominator rather than the entire fraction (Resnick et al., 2016). Students who cannot accurately place fractions on a number line are likely to continue to struggle in mathematics classes, at least without receiving additional supports (Resnick et al., 2016; Siegler et al., 2011; Tian & Siegler, 2017). As such, we assessed the accuracy of FNLE as a screening tool.
General Fraction Concepts and Fraction Arithmetic
Fraction concepts measures tend to use a broad set of related items that touch on several different fraction concepts, such as finding parts of a whole and parts of a set, ordering fractions, and solving word problems with fractions (e.g., Fuchs et al., 2013; Seethaler, Fuchs, Star, & Bryant, 2011). This is in contrast to the more targeted assessments of fraction magnitudes, such as the aforementioned FNLE task (e.g., Resnick et al., 2016; Siegler et al., 2011). Fraction procedures primarily involve procedures for adding, subtracting, multiplying, and dividing fractions (e.g., cross multiplying; Hecht & Vagi, 2012; Siegler, Fazio, Bailey, & Zhou, 2013). Proficiency in fraction concepts does not always result in procedural fluency or vice versa. For example, a student who successfully uses an algorithm for a fraction arithmetic problem is often not aware of why the algorithm works (Hecht & Vagi, 2012).
A recent study of pathways to fraction knowledge lends additional empirical support for considering fraction concepts and fraction arithmetic procedures as distinct types of fraction knowledge (Resnick et al., 2016). Sixth-grade fraction concepts were assessed with a measure that included various fraction concept items, including set model items (e.g., “Shade 2/5 of 10 circles”) and estimation (e.g., “Estimate the sum: 7/8 + 12/13”). Sixth-grade fraction arithmetic was assessed with fraction addition, subtraction, multiplication, and division items. Researchers used separate mediation analyses to explore pathways to learning fraction concepts and fraction arithmetic procedures via cognitive skills (i.e., attentive behavior, verbal ability, nonverbal ability, and working memory) and whole number skills (i.e., whole number magnitude reasoning and calculation). The pathway to learning fraction concepts differed from that of learning fraction arithmetic. Whole number magnitude reasoning ability in fifth grade fully mediated the relationship between third-grade cognitive processes and sixth-grade fraction conceptual knowledge. In contrast, whole number calculation abilities mediated the relationship between third-grade cognitive processes and sixth-grade fraction arithmetic knowledge. The findings suggest that although fraction concepts and fraction procedures are intertwined, they are not completely overlapping processes.
Overall, the literature on fraction concepts and procedures suggests that they are relatively separate but mutually supportive competencies, with fraction concepts seeming to be most important to mathematics achievement (e.g., Hallett, Nunes, & Bryant, 2010). As such, this study investigated separate measures of fraction concepts and fraction arithmetic procedures as potential screeners of students’ mathematics risk status.
In sum, we assessed the effectiveness of fraction measures in fourth grade as potential screening tools for identifying students who are at risk for poor mathematics achievement. Students were followed from the fourth through sixth grades, which allowed us to explore the accuracy of the fourth-grade measures for predicting later mathematics performance in the spring of fourth, fifth, and sixth grades.
Method
Participants
Students were drawn from nine elementary schools within two school districts serving families of diverse socioeconomic backgrounds. Data were collected as a part of a larger longitudinal study starting in third grade (Jordan et al., 2017). All third-grade students from participating schools were sent informed consent letters. A total of 517 returned consent forms to participate in the study, of whom 36 opted out of the study before the first assessment. Students were then followed through sixth grade. The sample was replenished twice, once in fourth grade (n = 27 new children) and once in fifth grade (n = 28 new children).
Of the total sample from the larger project, 411 students had complete data for this study. The sample was 46.2% male, 52.6% White, 38.7% Black, 5.8% Asian/Pacific Island, and 2.9% American Indian/Alaskan Native, with 16.5% of the students self-identified as Hispanic. More than half of the sample (58.4%) qualified to participate in the free/reduced lunch program and were classified as low income. The sample included 11.2% English learners and 10.7% of the students who were reported to be receiving special education services.
Missing data over the years of the project result in slightly different total students included each ROC analysis (n = 411 in fourth grade, 362 in fifth grade, and 304 in sixth grade). Participating schools followed curriculum benchmarks aligned with the Common Core State Standards in Mathematics (National Governors Association Center for Best Practices & Council of Chief State School Officers, 2010).
Fraction Measures
FNLE
An FNLE task adapted from Siegler et al. (2011) was administered on a laptop computer using DirectRT v2012. Each number line was 17.5 cm long and presented in the middle of the laptop screen. Fractions were presented one at a time beneath the middle of the number line. For each item, the cursor was set at “0”; students used the arrow keys to slide the cursor along the number line and then pressed a different key to indicate their final estimation. After providing their response, a new blank number line and a new fraction were presented and the cursor was reset to “0.” Students had no time constraints to make their individual estimates, but most students responded with 5 s per trial. The total administration time was approximately 2 to 3 min.
Students estimated the location of nine fractions (1/5, 13/14, 2/13, 3/7, 5/8, 1/3, 1/2, 1/19, and 5/6) on a 0 to 1 number line and 19 fractions and mixed numbers (1/3, 7/4, 12/13, 1 11/12, 3/2, 5/6, 5/5, 1/2, 7/6, 1 2/4, 1, 3/8, 1 5/8, 2/3, 1 1/5, 7/9, 1/19, 1 5/6, and 4/3) on a 0 to 2 number line. Estimations were combined to create a single score, which had high internal reliability (α = .91). Scores were calculated as the mean percent absolute error (PAE). Mean PAE was calculated by dividing the absolute value of the difference between the estimated position and actual position by the numerical range of the number line (1 or 2), multiplying by 100 for each item, and averaging across all trials. Higher PAE indicates poorer performance.
Fraction concepts
A paper-and-pencil measure of 18 total released items from the National Assessment of Educational Progress (NAEP; U.S. Department of Education, Institute of Education Sciences, National Center for Education Statistics, National Assessment of Educational Progress, 1990–2009) measured fraction concepts. NAEP items assessed part-whole understanding of area models (e.g., “Which shows 3/4 of the picture shaded?”), set models (e.g., “What fraction of the group of umbrellas is closed?”), equivalence (e.g., “These three fractions are equivalent. Write two more fractions that are equivalent to these.”), fraction magnitude (e.g., “On the number line above, what number does P represent?”), estimation (e.g., “Which fraction has a value closest to 1/2?”), and comparison and ordering (e.g., “In which of the following are the three fractions arranged from least to greatest?”). Items were read aloud in a group setting. Administration lasted for approximately 35 min. Students earned one point for each correct response. The measure had adequate internal reliability (α = .78). Items are publicly available through the NAEP website (https://nces.ed.gov/nationsreportcard/).
Fraction arithmetic
The paper-and pencil-fraction measure was adapted from Hecht (1998). The measure included four addition (e.g., 2/5 + 1/5) and four subtraction (e.g., 3/4 – 1/4) computation items. Each item involved fractions with the same denominators. Administration lasted approximately 10 min. Internal reliability was high (α = .95).
Outcome Mathematics Achievement Measure
In spring of the fourth, fifth, and sixth grades, students’ performance was assessed on the mathematics section of Delaware Comprehensive Assessment System (DCAS; American Institutes for Research, 2014), a statewide test of mathematics achievement. The DCAS requires students to answer multiple choice questions that assess algebraic reasoning (e.g., find a given term in an arithmetic sequence), numeric reasoning (e.g., using and applying meanings of multiplication and division), geometric reasoning (e.g., analyze and classify two-dimensional shapes according to their properties), and quantitative reasoning (e.g., construct and use data displays; American Institutes for Research, 2014). Published internal consistency at each time point of the DCAS was .86 (spring of fourth grade), .89 (spring of fifth grade), and .88 (spring of sixth grade; American Institutes for Research, 2014). The DCAS is highly correlated with the fourth edition of the Wide Range Achievement Test (WRAT; Wilkinson & Robertson, 2006) in mathematics, a standardized measure of general mathematics achievement. Bivariate correlations between concurrent administrations of the DCAS and the WRAT in fourth, fifth, and sixth grades in the present sample ranged from .71 to .76, indicating high criterion validity.
Each student in the state is given an “accountability” score that is determined by his or her performance on items that measure grade-level content only. Accountability scores range from 0 to 1300. Based on these scores, students are classified with scores of 1 (well below standards), 2 (below standards), 3 (meets standards), or 4 (advanced). For the ROC curve analyses in this study, students’ scores were classified as a binary outcome: 1 (below and well below the mathematics standard) and 0 (meets the standard or advanced). Differentiating between passing and not passing a state test is a meaningful classification, as these are the assessments that schools are using to evaluate students’ academic performance. Thus, the goal of the analyses in this study is to predict students with low mathematics achievement who are likely to experience later mathematics difficulties; some of the students may not have an identified learning disability but would benefit from additional support to bolster their mathematics understanding, whereas others may have a learning disability diagnosis (Gersten et al., 2012).
Procedure
Students were given the fraction concepts measure and fraction arithmetic measures in the fall of fourth grade. The FNLE measure was administered in the winter of fourth grade. The DCAS mathematics achievement outcome measure was administered in the spring of the fourth, fifth, and sixth grades. Trained assessors on the research team administered all measures, except for the mathematics achievement outcome measure, which was given by personnel in the school districts. Assessors administered the fraction concepts measure in a whole-class setting and read aloud problems to students. The FNLE measure and fraction arithmetic task were administered individually.
Data Analysis
ROC curve analyses were conducted to assess the diagnostic accuracy of the fraction predictor measures. We also investigated whether measures with higher AUC values were significantly more diagnostically accurate than measures with lower AUC values. We used a method proposed by Hanley and McNeil (1982) that corrects for dependence in AUC values when both measures are assessed within the same sample. The method yields a critical ratio z value; when the value of z = ±1.96, the difference between the AUC values is statistically significant at p < .05.
Gersten and colleagues (2009) advise that screeners be as efficient as possible to enable screening many students in a short amount of time. We used Best Subset automatic linear modeling (ALM) as a follow-up analysis for improving the efficiency of a screener. Best Subset AlM investigates all possible models for a given set of predictor items and determines the best set for predicting the outcome (Yang, 2013). When considering a mathematics screener, challenging items that most students answered incorrectly (e.g., an item that is beyond students’ grade level) hold little variability and thus would not make strong predictions of students’ later performance; this type of item would be excluded from the screener. Likewise, easy items that all students answered correctly are also eliminated. Retained items hold predictive power because some students gave the correct responses for the items, whereas others missed the items (Meyers, Gamst, & Guarino, 2013). When using Best Subset AlM for a combination of measures, all items from all measures are tested in the model. For example, 11 items from Measure A combined with five items from Measure B may emerge as the best combination of items for predicting the target outcome variable. To avoid an overfit model, we assessed the model using the overfit prevention criterion (average squared error, or ASE) as a means of cross-validation (Meyers et al., 2013) and also ran regression analyses as an additional step to test for overall model fit (Bagchi, Holzemer, & Peavy, 2019).
We then ran new ROC curve models to assess the accuracy of the shortened screeners for predicting risk status. We compared AUC values to determine if the shortened screeners significantly differed from the original predictor measures. Combinations of screeners were entered into binary logistic regression to empirically assess whether each predictor measure made significant improvements to the model when predicting the outcome and to provide extra support for combining the measures.
Power Analysis and Consideration of Missing Data
A power analysis was performed (MedCalc Statistical Software, 2016) for calculating the required sample size for an AUC value to be significantly different from an AUC of .50, which signifies a screener has zero discriminating power (i.e., the null hypothesis). The analysis was conducted with the following information: AUC of .75, null hypothesis of .50, power of .80, and alpha of .05. The analysis also requires a ratio representative of the expected amount of negative cases in the sample (students who meet the mathematics standard) as compared with the amount of positive cases (students who do not meet the standard). A ratio value of 2.5 was selected for this study because the amount of negative cases across the time points of the outcome measure was approximately 2.5 times more prevalent than the amount of positive cases. Results revealed that a sample size of 49 students with approximately 14 positive cases and 35 negative cases would be sensitive to capture a difference from the null hypothesis. Additional power analyses revealed that a sample size of 285 to 356 students is required for the comparison of two ROC curves with AUC values that differ by no less than .10 from the same sample.
As is common for longitudinal datasets, missing data must be considered. The most frequently reported remedy for missing data in ROC curve analyses is to assess AUCs only from subjects who have compete information, called the available-case analysis (Martínez-Camblor, 2013). In this study, the available-case analysis yields a total of more than 300 students per ROC curve, which is much greater than the sample size determined by the first power analysis and appropriate for ROC curve comparisons.
Results
Correlations among all variables across grades are shown in Table 1, with the DCAS mathematics achievement outcome entered as a binary variable to align with the ROC curve analyses. All variables are significantly correlated.
Correlations Among all Predictor and Outcome Variables.
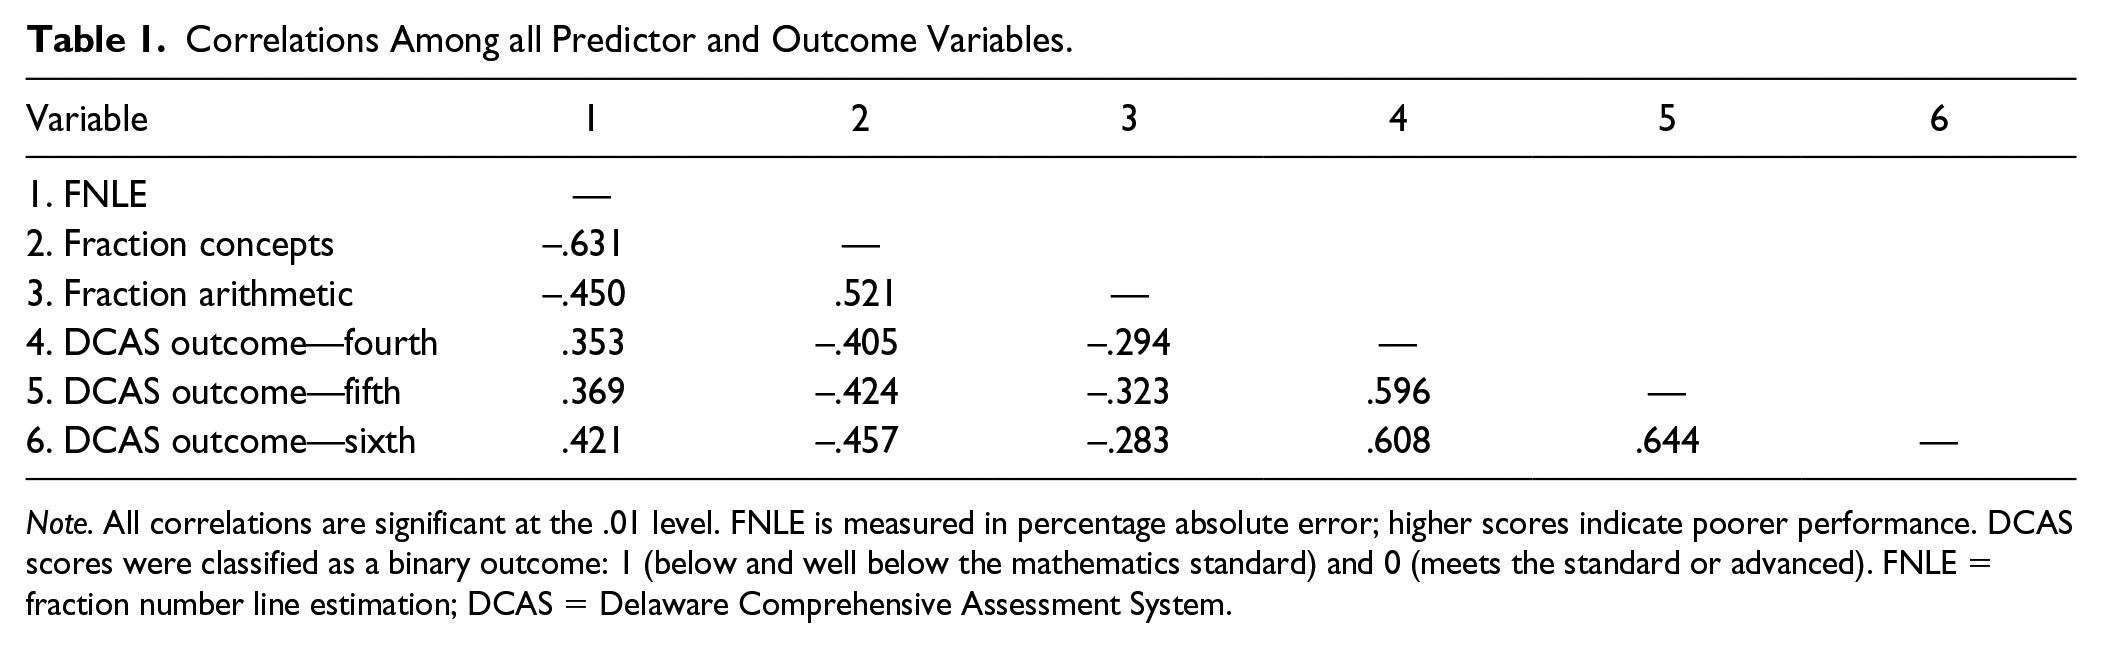
Note. All correlations are significant at the .01 level. FNLE is measured in percentage absolute error; higher scores indicate poorer performance. DCAS scores were classified as a binary outcome: 1 (below and well below the mathematics standard) and 0 (meets the standard or advanced). FNLE = fraction number line estimation; DCAS = Delaware Comprehensive Assessment System.
Table 2 presents means and standard deviations for all fourth-grade predictor measures, separated for students who met the end-of-the-year mathematics standard (i.e., negative cases) and students who did not meet the standard (i.e., positive cases) in fourth, fifth, and sixth grades, respectively. Independent samples t tests revealed that each predictor differentiated students who met the standard from those who did not meet the standard, regardless of the grade of the outcome measure (p = .001).
Mean Differences for Fraction Predictor Measures Between Students Who Did and Did Not Meet the Mathematics Standard in Fourth, Fifth, and Sixth Grades.
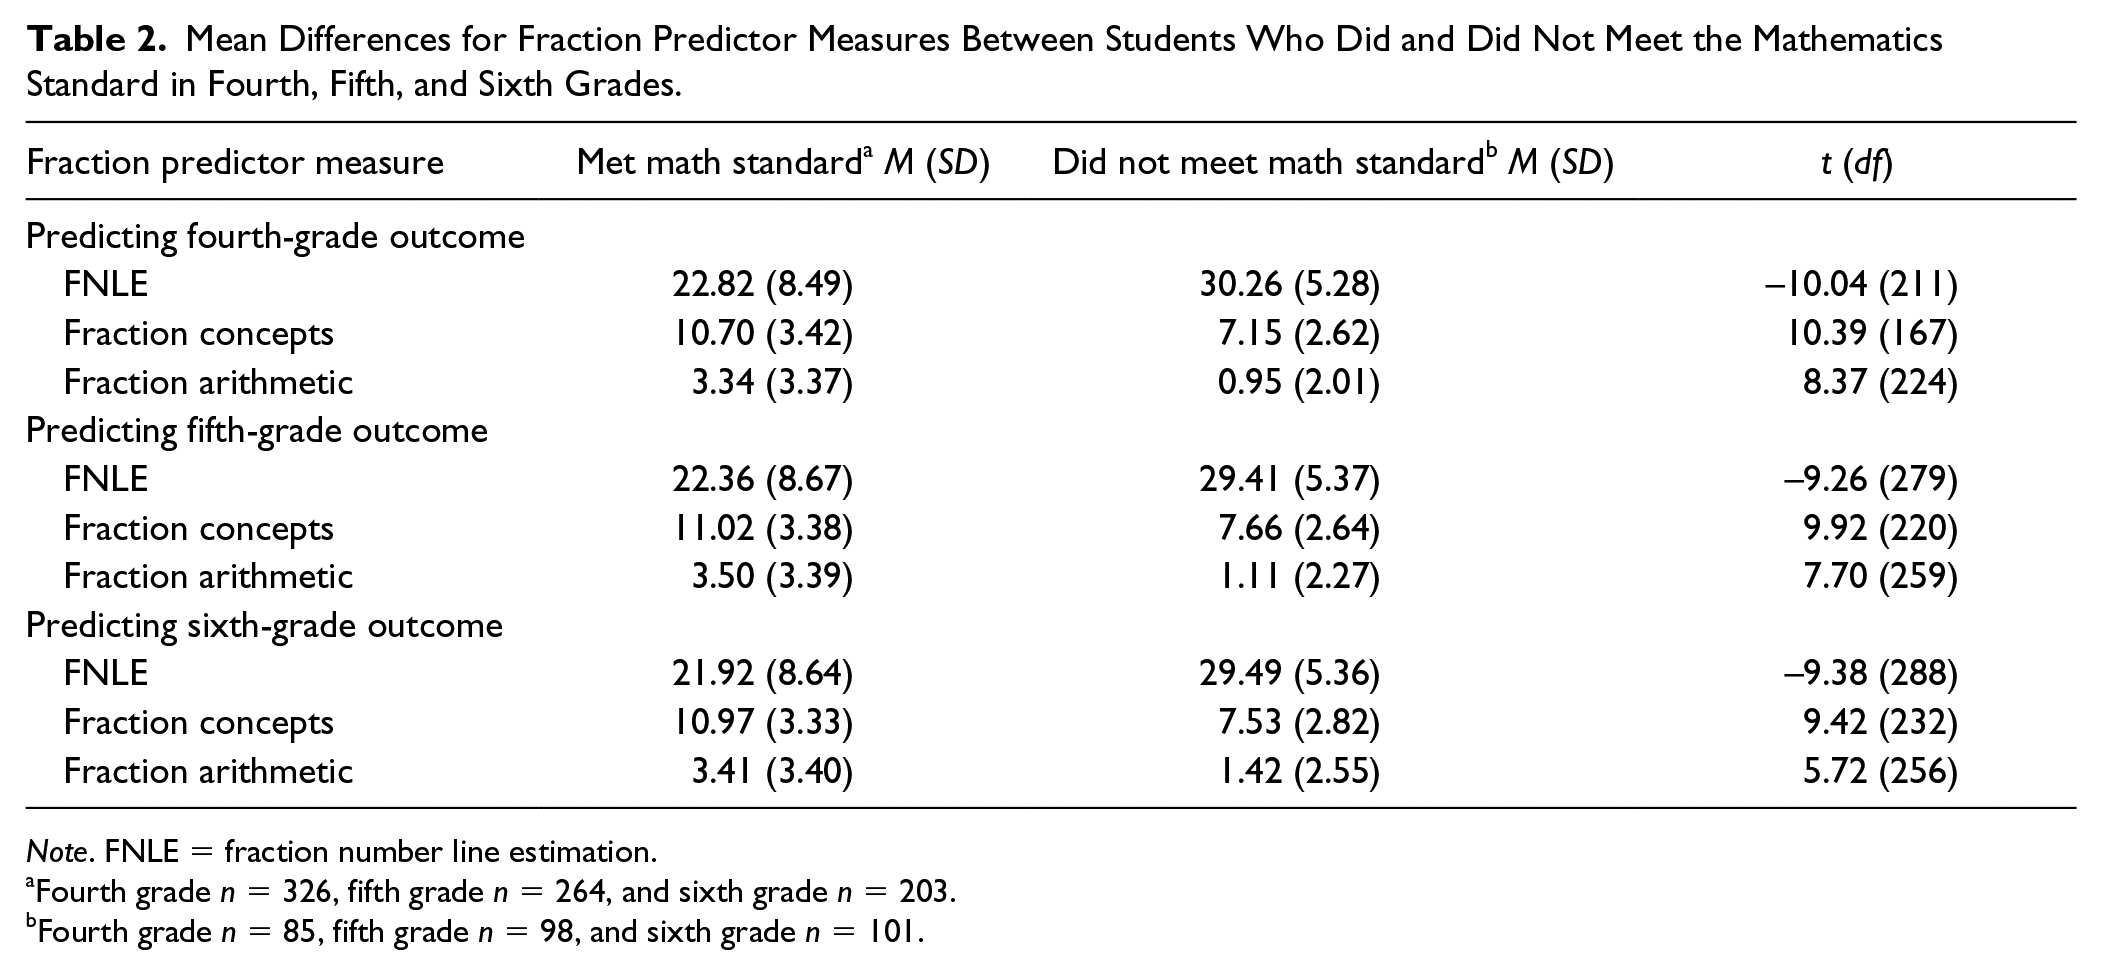
Note. FNLE = fraction number line estimation.
Fourth grade n = 326, fifth grade n = 264, and sixth grade n = 203.
Fourth grade n = 85, fifth grade n = 98, and sixth grade n = 101.
Three ROC curve analyses were conducted to assess the diagnostic accuracy of the predictor measures on later mathematics achievement. The first analysis assessed the measures as potential screeners for predicting the fourth-grade outcome. The base rate of the first ROC curve analysis was .21, meaning that 21% of the students received a positive outcome result (i.e., did not meet the mathematics standard). The second ROC curve analysis assessed the ability of the same measures for predicting the fifth-grade outcome (base rate = .27). The third ROC curve analysis assessed the same measures for predicting the sixth-grade outcome (base rate = .33).
On all ROC curve plots the fraction concepts curve extended furthest to the top left corner, and its AUC value exceeded the .75 threshold to be effective for determining risk status (see Figure 1; Cummings & Smolkowski, 2015). As such, the fraction concepts measure held the highest diagnostic accuracy for predicting mathematics achievement in all grades.
The FNLE measure also emerged as a powerful screener for predicting the outcome, meeting the AUC threshold of .75 for each grade of the outcome (see Figure 1). However, the AUC value for the FNLE measure in each analysis does not exceed those associated with the fraction concepts measure.
The fraction arithmetic measure yielded the lowest AUC values in each analysis (see Figure 1). The AUC values do not meet the .75 AUC threshold. As such, the eight-item fraction arithmetic measure is not considered a powerful screener measure.
Comparing AUC Values
Three AUC comparisons were analyzed per ROC curve analysis (i.e., fraction concepts vs. FNLE, FNLE vs. fraction arithmetic, and fraction concepts vs. fraction arithmetic). It was of particular interest to assess if the measure with the highest AUC value in each analysis (i.e., fraction concepts) was significantly superior to the measure with the next highest AUC value (i.e., FNLE). The fraction concepts measure did not significantly outperform the FNLE measure as a screener for any year of the outcome measure (p = .290 in fourth grade, .129 in fifth grade, and .334 in sixth grade). The fraction concepts measure performed significantly better than the fraction arithmetic measure in each analysis (p < .05). The FNLE measure outperformed the fraction arithmetic measure at fourth and sixth grades (p < .05). Overall, the fraction concepts measure and FNLE measure both met the AUC threshold and one did not outperform the other. These results suggest that an improved screener measure may consist of a combination of fraction concepts and FNLE items and possibly some fraction arithmetic items.
Best Subset Measures
Items from the fraction concepts measure, FNLE measure, and fraction arithmetic measure were assessed with Best Subset AlM to determine the most predictive combination of the 54 total items. Separate analyses of the outcome variable were run for the three grades. ALM analyses allow for a continuous outcome measure, so we used the DCAS accountability scores as the outcome.
For the prediction of the fourth-grade outcome, the final model had an adjusted R2 of .59. That is, 59% of the variance in the fourth-grade mathematics achievement outcome was accounted for by the linear combination of the selected predictor items. Four fraction concepts items, nine FNLE items, and two arithmetic items were included in the model. Overfitting was not detected when the model was run again using the overfit prevention criterion ASE (Meyers et al., 2013). The three best subset measures (i.e., the four-item fraction concepts best subset measure, the nine-item FNLE best subset measure, and the two-item fraction arithmetic best subset measure) were entered into binary logistic regression with hierarchical entry. The fraction concepts best subset measure was entered in the first block because the original measure had a slightly higher AUC value than the FNLE measure. The FNLE measure was entered in the second block and the arithmetic measure in the third block. Regression diagnostics revealed no univariate or multivariate outliers. A further evaluation of assumptions was satisfactory. The Hosmer–Lemeshow goodness-of-fit test showed good model fit with the data (p > .05). The Wald test revealed that all best subset measures were statistically significant (p = .001).
When predicting the fifth-grade mathematics outcome, the final model of fraction predictor items accounted for 43% of the variance in the outcome. The best subset model included seven fraction concepts items, seven FNLE items, and two fraction arithmetic items. Further analysis did not reveal overfitting. A binary logistic regression model met the underlying assumptions, there was good model fit with the data (p > .05), and all best subset measures were statistically significant (p = .001).
When predicting the sixth-grade mathematics outcome, the best subset final model accounted for 55% of the outcome variance. The model included seven fraction concepts items, eight FNLE items, and one fraction arithmetic item. Overfitting was not detected. All best subset measures significantly improved the model (p = .001). Again the model met underlying assumptions and showed good model fit with the data (p > .05).
Overall, the items included in each best subset model differed by the grade of the outcome measure (see the appendices for a list of all items included on each best subset measure). For the prediction of the fourth-grade outcome, the combined best subset measure included a total of 15 items. For the fifth- and sixth-grade outcome, the combined measure included 16 items. Thus, each combined best subset measure consisted of fewer total items than the original 18-item concepts measure and the original 28-item FNLE measure.
Additional ROC analyses were conducted to assess the diagnostic accuracy of the best subset measures. The following seven predictor measures were included in ROC curve analyses of fraction measures predicting each grade of the outcome:
original fraction concepts measure with all 18 items,
best subset fraction concepts measure,
original FNLE measure with all 28 items,
best subset FNLE measure,
original fraction arithmetic measure with all 8 items,
best subset arithmetic measure, and
combination of the three best subset fraction measures.
Table 3 presents a summary of AUC values. The combined best subset measure met the .75 AUC threshold for being a good screener for each grade of the outcome. AUC comparisons between the combined best subset measures and original measures in each analysis yielded consistent results, with one exception: The combined best subset measure performed significantly better than the original fraction concepts measure and the original FNLE measure with high AUC values (p < .05), with one exception of the combined best subset measure performing equally as well as the original concepts measure when predicting the fifth-grade outcome (p > .05). Thus, the combined best subset measure performed better or equally as well but with fewer items. The combined best subset measure also consistently performed just as well as the best subset concepts measure and best subset FNLE measure (p > .05).
AUC Statistics for Best Subset and Original Predictor Measures.
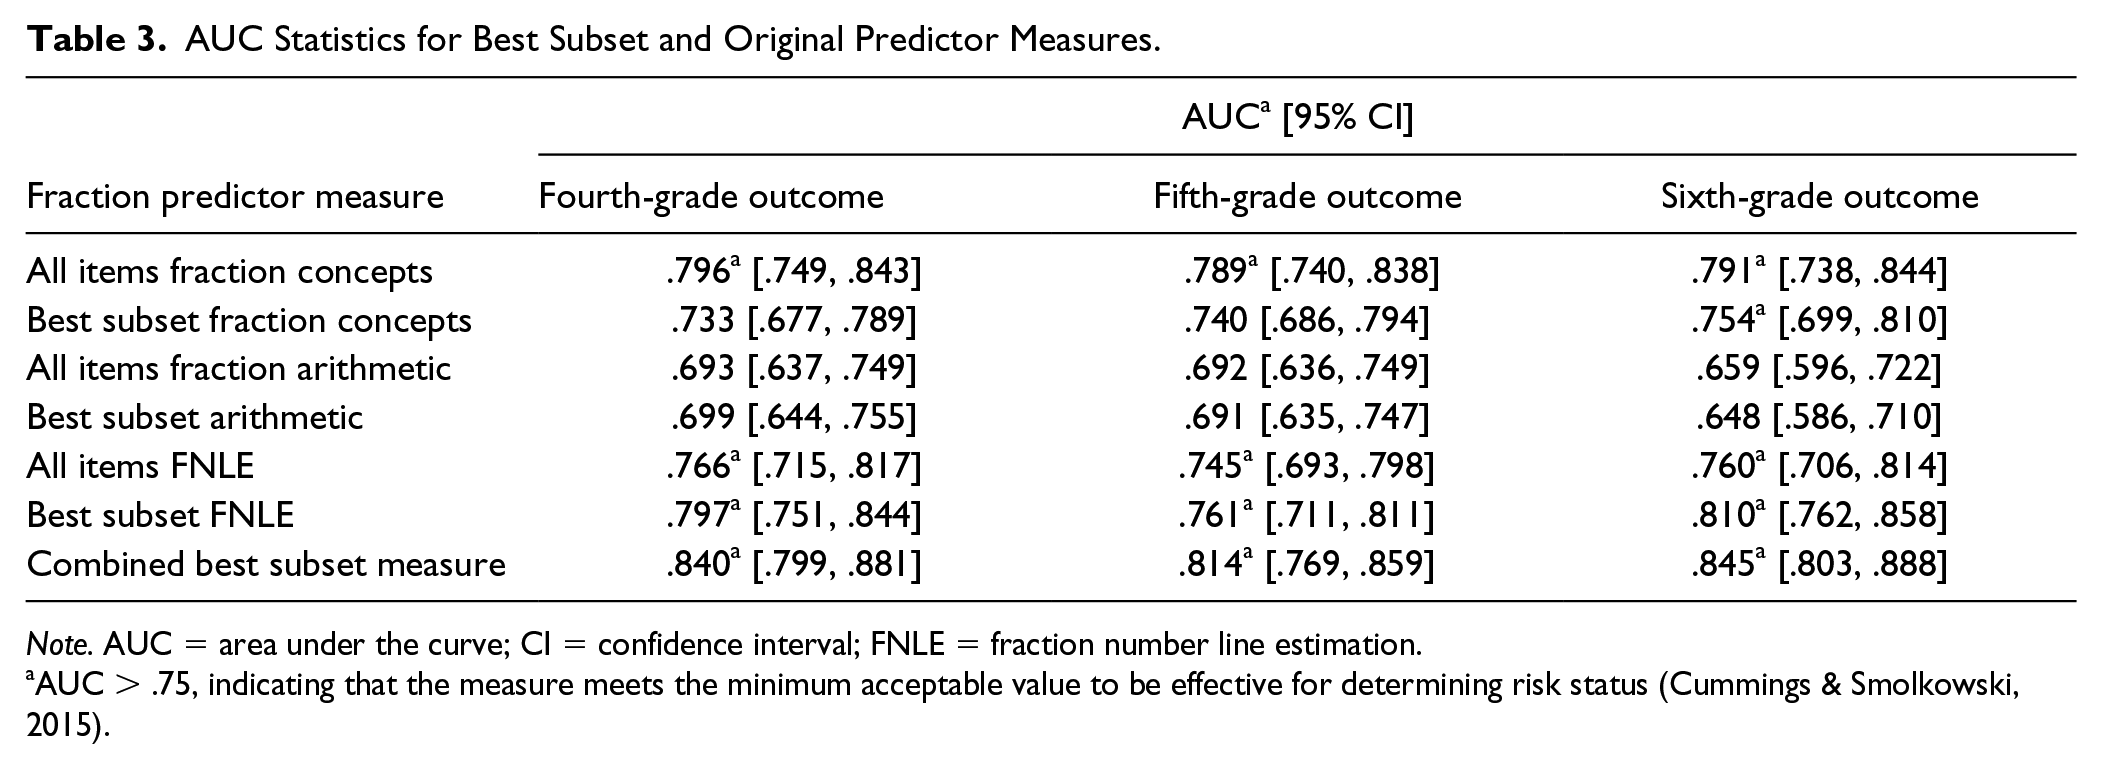
Note. AUC = area under the curve; CI = confidence interval; FNLE = fraction number line estimation.
AUC > .75, indicating that the measure meets the minimum acceptable value to be effective for determining risk status (Cummings & Smolkowski, 2015).
We recommend the combined best subset measure over the individual best subset measures for all grades of the outcome for several reasons. First, the AUC values of the combined best subset measures consistently outperformed the individual best subset measures with only one exception where it performed equally as well as the original concepts measure. Second, results of the regression analyses indicated that the subset measures significantly improved model fit when predicting all grades of the outcome. Third, combining the best subset measures consistently yielded a reasonable total number of items (i.e., 15–16 total items) that would not require extensive time to administer.
Summary of Results
Fraction concepts and FNLE emerged as effective screeners of later risk status. The selected fraction screener for the prediction of fourth-grade mathematics achievement was a combined best subset measure with four fraction concepts items, nine FNLE items, and two fraction arithmetic items. The selected fraction grade screener for the prediction of fifth-grade achievement was also a combined best subset measure with seven fraction concepts items, seven FNLE items, and two fraction arithmetic items. The selected screener for the prediction of the sixth-grade outcome was a combined best subset measure with seven fraction concepts items, eight FNLE items, and one fraction arithmetic item. All three of the combined best subset screeners met the AUC threshold for determining students’ risk status for later mathematics difficulties.
Discussion
Deep knowledge of fractions eludes too many students (e.g., Jordan et al., 2017; Ni & Zhou, 2005). Development of accurate fraction screeners is an important first step for identifying students who might need an intervention. Students who do not acquire fraction knowledge are likely to face cascading mathematics problems when they reach algebra (Booth et al., 2014). To date, however, no fraction screeners have been developed and validated through rigorous analysis. This study fills this gap by examining the effectiveness of fourth-grade fraction measures as screeners for the prediction of later mathematics success in fourth through sixth grades. We sought to identify one “best” screener for each year of the outcome.
The fraction concepts and FNLE measures emerged as accurate screeners of students’ performance on the mathematics achievement outcomes in the intermediate grades. The fraction concepts screener consistently held higher (but not significantly better) predictive power than the FNLE screener. The fraction arithmetic screener, on the contrary, did not meet the statistical threshold for being a good screener of students’ later performance.
Results favoring fraction concepts over fraction arithmetic are consistent with findings of VanDerHeyden and colleagues (2017) for fourth grade. The study assessed several mathematics measures in the fall of fourth grade for the prediction of spring mathematics achievement. The fourth-grade concepts and application measures included items assessing fractions, charts, graphs, money, and word problems. This screener had higher diagnostic accuracy (AUC = .85) than the computation measure, whole number multiplication measure, and whole number division measure (AUC = .72, .66, and .55, respectively). The concepts and applications measure yielded an AUC value comparable with the AUC values of the best subset combination measures of this study (.84 for predicting fourth grade, .81 for predicting fifth grade, and .85 for predicting sixth grade), suggesting that future research might explore the value of adding items to the fraction screeners that tap into other mathematics topics pertinent to the fourth grade curriculum such as decimals and graphs.
Furthermore, as the computation measure in VanDerHeyden et al.’s (2017) study yielded an acceptable AUC value in third grade and a high AUC value in fifth, future work should continue to explore the predictive value of computation items on combined screeners. In the study by Keller-Margulis and colleagues (2008), the AUC value of the fourth-grade concepts and applications measure was far lower than the AUC of the concepts and applications measure reported by VanDerHeyden and colleagues (2017). However, as the predictor measures in the 2008 study were administered in the spring of fourth grade rather than the fall or winter, it is challenging to compare the AUC values with the results of the study by VanDerHeyden and colleagues and with the results of this study.
Although both mathematics concepts and procedures are recognized as important competencies (e.g., Hallett et al., 2010), the results of this study provide further support for the claim that fraction conceptual knowledge is the better predictor of mathematics achievement. Knowledge of fraction concepts allows students to make sense of procedures, to estimate solutions, and to notice procedural errors in their own work (Hecht, 1998). For example, students with good conceptual knowledge can reason that they cannot add across denominators for a fraction addition problem (2/3 + 2/6 = 4/9), a common mistake (Newton, Willard, & Teufel, 2014). Moreover, numerical magnitude knowledge, including that of fraction magnitudes, provides a supporting structure for learning mathematical concepts (Siegler et al., 2011). It is also possible that fraction arithmetic is more sensitive to instruction, and relatedly, that fraction arithmetic algorithms may receive more attention in classroom instruction than fundamental fraction concepts.
Teachers frequently lament the amount of instructional time lost in the classroom due to testing (Cobb, 2003). In response, we sought to limit the amount of items on each screener by identifying the most predictive subset of items and removing the least predictive items while ensuring that the best subset of items maintained the high diagnostic accuracy of the original measures with all items included. Excluding items that did not discriminate well between students who are at risk for later difficulties and students who are not at risk minimizes the amount of time required for administration and for scoring, making the screener much more practical for classroom use. Furthermore, examining retained items on each best subset screener provides information about the type of items and/or concepts that are most important for predicting students’ later success.
In this study, we combined the fraction concepts items, FNLE items, and fraction arithmetic items into one screener. Initially, the combined screener had a total of 54 items (i.e., 18 items on the fraction concepts screener, 28 items on the FNLE screener, and eight items on the fraction arithmetic screener). The combined best subset analyses reduced the screener to 15 items for the prediction of the fourth-grade outcome and 16 items for the fifth- and sixth-grade outcome (the items differed by grade of outcome; see Supplemental Material). Importantly, the estimated time required to administer these shortened screeners is 11 to 17 min (i.e., an estimated 2 min per concepts item, an estimated 5 s per FNLE item, and an estimated 1 min per arithmetic item) as compared with approximately 46 min for the longer screener. Analyses demonstrated that, with only one exception, the shorter best subset screeners in fourth grade performed significantly better in predicting overall mathematics achievement at the end of fourth, fifth, and sixth grades as the original measures for the prediction of later mathematics achievement.
The number of FNLE items retained on each fourth-grade combined screener exceeded the number of fraction concept items when predicting the fourth- and sixth-grade outcomes and matched the number of fraction concept items for the fifth-grade outcome. Thus, although the full fraction concepts measure was slightly more predictive than the full number line measure, the best subset number line screener actually outperformed the best subset concepts measure for two grades of the outcome. This finding indicates that a small subset of number line items in fourth grade held especially high predictive power. Specifically, proper fractions (i.e., fractions less than one) emerged as most consistently predictive over many NAEP fraction concepts items, mixed numbers (i.e., numbers composed of a whole number and a fraction) on FNLE, and improper fractions (i.e., fractions equal to or greater than one) on FNLE. Students’ estimates of two proper fractions on the 0 to 1 number line (i.e., 1/2 and 5/6) and one proper fraction on the 0 to 2 number line (i.e., 3/8) consistently emerged as highly predictive items. The whole number 1 as estimated on the 0 to 2 number line also emerged on all three best subset screeners.
The importance of students’ estimations of proper fractions early is in keeping with previous research showing that fourth-grade students have greater understanding of proper fractions than improper fractions (Resnick et al., 2016), most likely because early fraction typically emphasizes proper fractions rather than improper fractions (Vosniadou, Vamvakoussi, & Skopeliti, 2008). It is important to consider that improper fractions likely were not predictive of students’ later achievement because they are hard for students at this grade level.
Examination of best subset fraction concepts items provides insight into the type of concepts that predict fourth-grade students’ later achievement. Overall, simpler items were retained on the best subset screener for predicting fourth-grade achievement (e.g., area model questions in which the denominator of the fraction matched the number of pieces shown in a model), likely because these items represented a similar difficulty level to the fourth-grade outcome measure. More challenging items were retained on the screeners predicting fifth-grade achievement and sixth-grade achievement (e.g., “Which fraction has a value closest to 1/2?” and an item requiring students to order three fractions from least to greatest magnitude). Only one item emerged on all three best subset measures, suggesting that the item may be tapping into an important concept predictive of later mathematics achievement. The item is multiple choice and asks: “Luis had two apples and he cut each apple into fifths. How many pieces of apple did he have?” The response options are 2/5, 2, 5, and 10. Many students seemed to focus on “fifths” and thus selected “5” as the answer. It is also interesting to note challenging items that were not retained on any of the best subset measures. For example, item 10 (see Appendix A) presents students with a 0 to 2 number line and asks them to identify the number that is represented by a dot located on the line (the dot represents the mixed number 1 3/4). Even high-achieving fourth-graders struggled with this number line item, suggesting that students need more practice identifying magnitudes on number lines that extend beyond the number 1 (Resnick et al., 2016).
A similar pattern emerged with the fraction arithmetic items: simpler items were retained when predicting the fourth-grade outcome (e.g., adding two fractions with like denominators) and more challenging items predicted the fifth- and sixth-grade outcome (e.g., adding two mixed numbers).
Study Limitations and Future Directions
Several limitations must be kept in mind when interpreting the results of this study. The generalizability of the results may be limited because students were recruited from two school districts in only one geographic location. It is also important to consider that some of the predictor measures were administered before students received targeted fraction instruction in the classroom and certain fraction items were challenging for the majority of students (e.g., estimating improper fractions on the number line). Another limitation is the relatively small scope of measures evaluated as potential screeners, as there are several other potential measures that may also predict mathematics achievement during these grades. Nevertheless, we argue that fractions are a critical skill for math learning and that knowledge in this area should be screened in fourth grade to determine which students may be at risk. Fraction screeners may also point to avenues for instruction (e.g., learning about fractions on the number line).
The standardized mathematics test as the outcome variable may also raise some concerns when interpreting the results. The test was administered by the school district and the specific items included on the test at each grade are unknown. The proportion of fraction items on each test is also unknown. Previous research, however, also relies on these state tests for predicting student achievement (e.g., Jiban & Deno, 2007; Siegler et al., 2011; VanDerHeyden et al., 2017). Also, it may be possible for researchers and schools to determine the diagnostic accuracy of the screeners shared in this study (see Appendix A) with other mathematics achievement tests using the relatively simple ROC procedures described here.
In conclusion, this study makes a clear contribution to the literature by identifying useful mathematics screeners for identifying students in upper elementary school at risk for mathematics difficulty. To our knowledge, this study is the first to develop and validate fraction screeners through rigorous analysis. Findings suggest that screeners focused on core components of the mathematics curriculum—such as fractions—may be powerful approaches for predicting mathematics achievement more generally. Although this study highlights the importance of fraction understanding for at-risk students, it simultaneously points to the importance of fraction knowledge and especially fraction conceptual understanding for all children’s mathematics development.
Footnotes
Appendix
Best Subset Fraction Arithmetic Items.
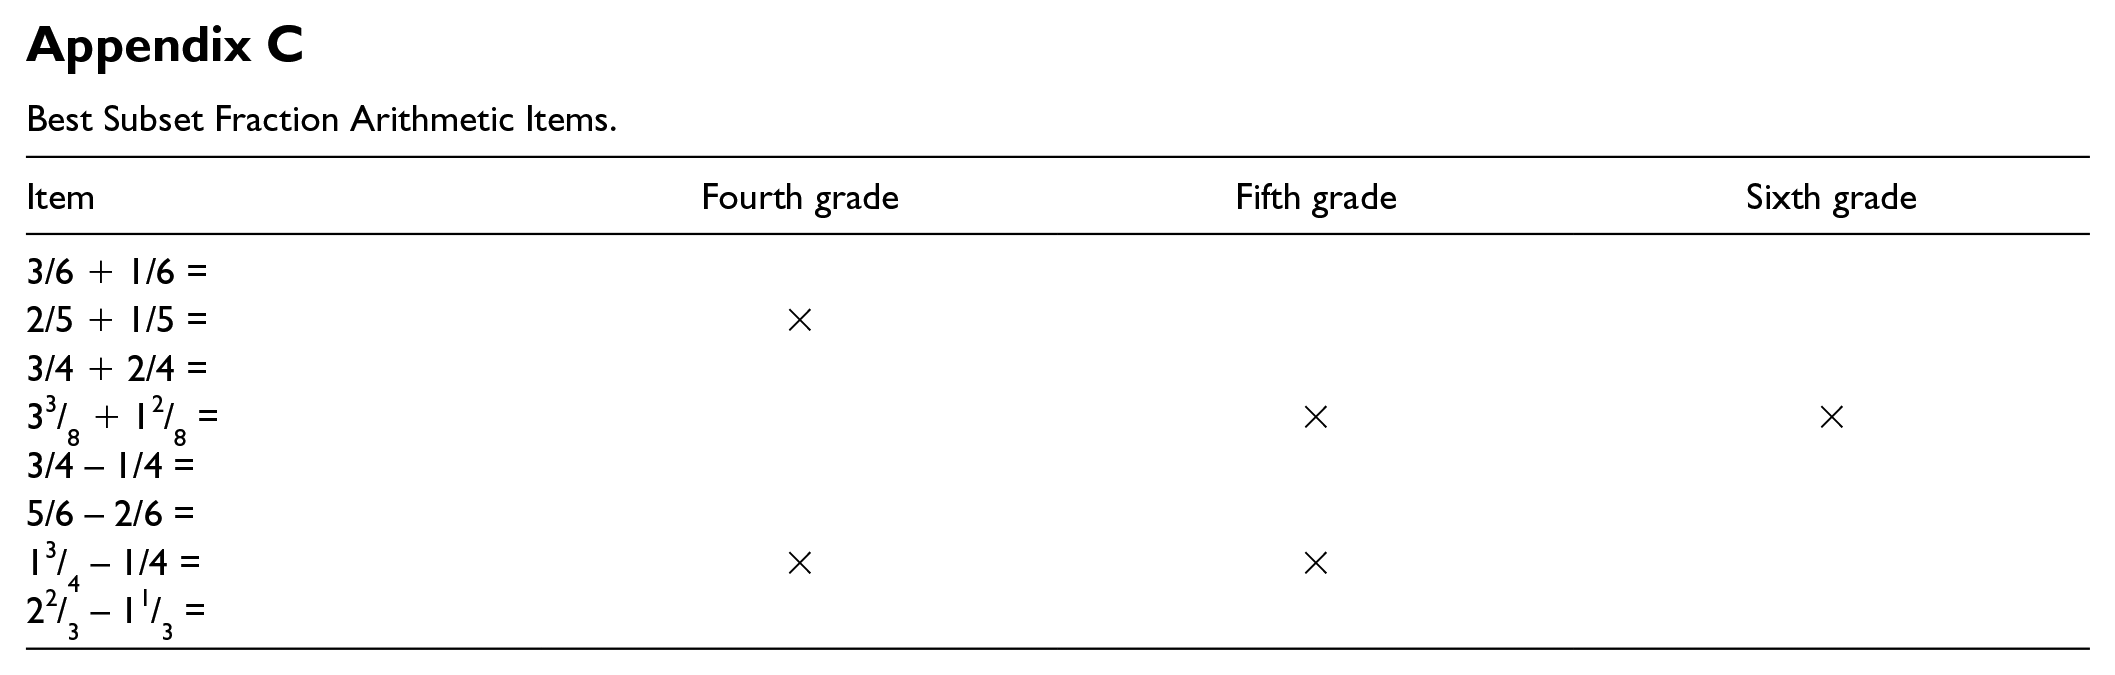
| Item | Fourth grade | Fifth grade | Sixth grade |
|---|---|---|---|
| 3/6 + 1/6 = | |||
| 2/5 + 1/5 = | × | ||
| 3/4 + 2/4 = | |||
| 33/8 + 12/8 = | × | × | |
| 3/4 – 1/4 = | |||
| 5/6 – 2/6 = | |||
| 13/4 – 1/4 = | × | × | |
| 22/3 – 11/3 = |
Declaration of Conflicting Interests
The author(s) declared no potential conflicts of interest with respect to the research, authorship, and/or publication of this article.
Funding
The author(s) disclosed receipt of the following financial support for the research, authorship, and/or publication of this article: Funding for this research was provided by the Institute of Education Sciences, U.S. Department of Education, Grant number R324C100004 to Nancy C. Jordan at the University of Delaware.