
Abstract
Research on the question of creative benefit accompanying dyslexia has produced conflicting findings. In this meta-analysis, we determined summary effects of mean and variance differences in creativity between groups with and without dyslexia. Twenty studies were included (n = 770 individuals with dyslexia, n = 1,671 controls). A random-effects robust variance estimation (RVE) analysis indicated no mean (g = −0.02, p = .84) or variance (g = −0.0004, p = .99) differences in creativity between groups. The mean summary effect was moderated by age, gender, and creativity domain. Compared with adolescents, adults with dyslexia showed an advantage over nondyslexic adults in creativity. In addition, a higher proportion of males in the dyslexia group was associated with poorer performance compared with the controls. Finally, the dyslexia group showed a significant performance disadvantage in verbal versus figural creativity. Regarding variance differences, they varied across age and creativity domains. Compared with adults, adolescents showed smaller variability in the dyslexia group. If the creativity task measured verbal versus figural or combined creativity, the dyslexia group exhibited smaller variability. Altogether, our results suggest that individuals with dyslexia as a group are no more creative or show greater variability in creativity than peers without dyslexia.
The Diagnostic and Statistical Manual of Mental Disorders (5th ed.; DSM-5; American Psychiatric Association, 2013) defines dyslexia as an alternative term to “specific learning disorder with impairment in reading” to refer to a “pattern of learning difficulties characterized by problems with accurate or fluent word recognition, poor decoding, and poor spelling abilities” (p. 67). Reading and learning disabilities researchers are in agreement about the characterization of dyslexia as an impairment related mostly to verbal deficits, such as problems in phonological awareness and word decoding. There is less absolute agreement, however, when dyslexia is discussed in the context of cognitive abilities that include also nonverbal processing. One such cognitive area is creativity. Generally, creativity can be defined as “the ability to produce work that is both original (new, unusual, novel, unexpected) and valuable (useful, good, adaptive, appropriate)” (Dietrich, 2004; Sternberg & Lubart, 1999). Research has shown that dyslexia is not entirely incompatible with creativity (e.g., Shaywitz, 2003; Wolf, 2007). In fact, some researchers suggest that dyslexia might be associated with enhanced creativity (e.g., Chakravarty, 2009; Eide & Eide, 2011; West, 1997), and examples of creative individuals with dyslexia are abundant (e.g., Rack, 1981; Wolff & Lundberg, 2002). However, the theoretical and empirical evidence for such claims is mixed at best. To address the conflicting theoretical and empirical accounts, the goal of this study is to estimate summary meta-analytical effects of mean and variance differences in creativity between groups with and without dyslexia.
At least four hypotheses have been proposed to describe the possible relation between dyslexia and enhanced creativity. The first three hypotheses are related to the neurobiological mechanisms that become incidental to the dyslexia-creativity link early in the development. On the other hand, the fourth hypothesis speculates that enhanced creativity is related to the development of compensatory coping strategies that arise later in life.
The first hypothesis is a hypothesis on a disequilibrium of magno- and parvocellular systems in individuals with dyslexia (Stein, 2001; Stein & Walsh, 1997). Visual magnocellular processing is specialized for processing fast temporal information (Stein & Walsh, 1997). It is also important for orthographic aspects of single-word reading, including accurate letter position encoding necessary for skilled reading (Cornelissen et al., 1998). The hypothesis on a disequilibrium of magno- and parvocellular systems proposes that the functions of the weak magnocellular systems in individuals with dyslexia are compensated with the emergence of a more efficient parvocellular system (e.g., Stein, 2001; Stein & Walsh, 1997). The role of the parvocellular system is that of discriminating fine details and providing greater spatial resolution than the magnocells. Some authors suggest (e.g., Stein, 2001; Stein & Walsh, 1997) that individuals with dyslexia might take advantage of the stronger connections in the parvocellular system which would make them creative talents in space, time, and logic and enable them to display holistic lateral thinking and seeing the big picture that, for example, artists and inventors display (Stein, 2001). This view, however, is not widely accepted and the disequilibrium hypothesis has been disputed in a more recent review of literature.
Latest research argues that the disequilibrium hypothesis cannot clearly delineate why only some individuals with magnocellular deficits have dyslexia, while others do not (Skoyles & Skottun, 2004). Moreover, the authors argue that if the prevalence rate of dyslexia is taken into account, then magnocellular deficits are just as prevalent in individuals with as they are in individuals without dyslexia (Skoyles & Skottun, 2004). To test this hypothesis, researchers proposed to examine potential magnocellular deficits across the entire spectrum of reading ability. Edwards and Schatschneider (2020) demonstrated that across the reading continuum, performance on magnocellular tasks (temporal gap detection and coherent motion), reading rate, and rapid letter naming were not significantly related among each other, providing evidence against the idea that magnocellular deficits would necessarily be related with dyslexia status. This idea has been corroborated in another study showing that weakness in magnocellular pathway may not be caused by dyslexia. Individuals with dyslexia might have failed to produce the same functional activation in one part of the magnocellular visual subsystem when compared with age-matched controls; however, when individuals with dyslexia were matched to younger controls on reading, no such differences emerged. Researchers believe that magnocellular dysfunction might not be causal to dyslexia but may instead be consequential to impoverished reading (Olulade et al., 2013).
Similarly to the first hypothesis, the second and third hypotheses are related to the compensatory neurological augmentation mechanisms that may drive the dyslexia-enhanced creativity link. The second hypothesis is a hypothesis of a compensatory cognitive benefit (Chakravarty, 2009). The hypothesis speculates that the low activity in the dominant left hemisphere for verbal processing exhibited by individuals with dyslexia boosts the activity of the nondominant right parietal lobe, which, in turn, allows for more creative associations to be expressed in the right hemisphere. In other words, disinhibited functioning of the nondominant right parietal lobe responsible for creativity takes a compensatory role over the dysfunction of a left dominant hemisphere responsible for verbal processes. This mechanism then augments creativity, which is manifested in a higher prevalence of artistic talents in individuals with dyslexia (Chakravarty, 2009).
The development of the second hypothesis might have been prompted by the third hypothesis—the Geschwind–Galaburda hypothesis from the 1980s (Geschwind & Galaburda, 1987). The Geschwind–Galaburda hypothesis of cerebral lateralization suggests that alterations in the growth of the left hemisphere affect the development of verbal processing skills, resulting in dyslexia, among others. At the same time, changes in the left hemisphere entail the development of an altered right hemisphere, resulting in modification of various cognitive abilities, including enhanced creativity. Similarly to the disequilibrium hypothesis, though, the Geschwind–Galaburda hypothesis has been criticized on many grounds (Bryden et al., 1994; McManus & Bryden, 1991). Researchers have argued that there is no empirical evidence to support alleged significant associations between traits that are represented in the left versus the right hemisphere (Bryden et al., 1994; McManus & Bryden, 1991).
While the three abovementioned hypotheses speculate a neurological basis for the alleged link between dyslexia and enhanced creativity, the fourth hypothesis attributes the link to several coping compensatory mechanisms that emerge and develop over time later in life (e.g., Everatt et al., 1999; Wolff & Lundberg, 2002). Supporters of the coping compensatory mechanisms hypothesis propose that to compensate for reading and writing failures in educational settings earlier in life, individuals with dyslexia develop creative and unconventional coping mechanisms and modes of thinking in adolescence and adulthood as an effort to overcome frustrating obstacles related to academic achievement outcomes. Moreover, based on this hypothesis, individuals with dyslexia seek out opportunities in fields that generally do not place heavy emphasis on academically valued skills, but which, instead, entail support skills, such as visual arts (e.g., Wolff & Lundberg, 2002).
As noted already, though some of the hypotheses have been disputed, they represent important steps in delineating a possible association between dyslexia and enhanced creativity. Collectively, the hypotheses describe how the alleged link between enhanced creativity and dyslexia is reflected in individuals with dyslexia in particular, rather than the entire population of people with dyslexia. The hypotheses do so based on the notion of compensatory mechanisms, be it in the form of neurobiological or behavioral/educational sources. While there is empirical evidence speaking in favor of the relation between dyslexia and enhanced creativity (e.g., Bigozzi et al., 2016; Everatt et al., 1999), it is less clear whether such effects are consistent across the entire body of work examining differences between dyslexia and control groups.
The line of research supporting the link between dyslexia and enhanced creativity has been counterbalanced by research that shows no evidence of such link. This research lends support to the idea that enhanced creativity may not be a distinct trait in a particular group of individuals, as suggested by the abovementioned compensatory hypotheses but rather there might be variability in creativity in a general population (e.g., Ren et al., 2019). This idea is supported by data showing that protective genes associated with individual differences in creativity have not been identified across various groups. Rather, much like other complex heterogeneous traits, creativity is shaped by polygenic influences, which are small and numerous (e.g., Liu et al., 2018; Ren et al., 2019; Simonton, 2008). As such, they interact, aggregate, and work in concert to form a quantitative continuum of creativity (e.g., Kovas et al., 2007), making it unlikely that distinct groups of individuals would benefit differently as a function of polygenic factors. Furthermore, genetic influences related to differences in creativity interact and correlate with environmental mechanisms, making it even less likely that such complexity would cohere into enhanced creativity being characteristic of only a distinct group of individuals (i.e., individuals with dyslexia).
In sum, much like intelligence, and essentially any other cognitive ability, creativity shows clear individual differences, shaped by a myriad of small genetic and environmental influences (Kandler et al., 2016) which do not aggregate to the extent to produce differences that would vary across groups. Ample support for this possibility can be found in empirical studies in which individuals with dyslexia do not show advantage in creativity over their nondyslexic peers (e.g., Alves & Nakano, 2014; Łockiewicz et al., 2014).
Overall, it appears that the conclusions drawn from theoretical and empirical studies on the relation between dyslexia and enhanced creativity are indeed quite inconclusive. To date, there have been no attempts to collate and synthesize the evidence of the extent to which effects of the dyslexia-enhanced creativity link are consistent across studies. A meta-analysis is a uniquely suited method to assess such evidence, while accounting for heterogeneity of existing research findings. It does so by systematically pooling together a body of literature, increasing both power and sample heterogeneity. This provides a more precise picture of a true effect and enables for generating a more robust summary effect estimate. In addition, moderators in a meta-analysis have the potential to quantify and pinpoint any variations in study characteristics that may be driving the strength of the true summary effect.
In psychology and education, meta-analyses typically quantify differences in trait means among two groups. As such, testing for differences in trait variances is rarely conducted. This is due to the fact that in a typical individual study there is less power to detect variance differences than mean differences. In the current meta-analysis, we elected to analyze both mean and variance differences. This enabled us to determine the extent to which dyslexia versus control groups might show individual differences in creativity regardless of whether creativity results in mean differences between groups or not. The idea of no mean differences between groups can be attributed to the fact that creativity is simply a heterogeneous trait running on a continuous spectrum with no clear characterization of a specific subset of individuals. However, it is still possible that there might be increased individual differences in one subpopulation, but this has not yet been tested. As previously outlined, there is a precedent (see compensatory hypotheses) to assume that advantage of dyslexia might manifest in the right tail of the (figural) creativity distribution because creativity is the skill that is considered as a dyslexia-related gift. This idea is, in part, mirrored in the explanations about the overrepresentation of successful individuals with dyslexia in highly creative fields, such as visual arts and entrepreneurship.
In examining the literature on creativity and dyslexia, it was important to consider a number of moderators to test for heterogeneity of research findings. The first moderator included in our study was age. Prior investigations have shown that the coping compensatory mechanisms will more likely emerge in adolescent and adult years, once the accumulation of impoverished reading and writing experience has had an impact on individuals with dyslexia. On this basis, researchers speculate that mean group differences in creativity would be apparent in older but not younger participant samples (e.g., Everatt et al., 1999). The second moderator was gender. A recent meta-analysis (Quinn, 2018) has shown that gender differences in reading impairment are not a product of ascertainment bias (i.e., males are more likely to be referred for evaluation than females) but are, in fact, real and represent a true male vulnerability for reading problems. In addition, a comprehensive review concluded that females tend to score higher on creativity tests than males (Baer & Kaufman, 2008). Thus, we tested for moderation by gender to examine its association on the true effect size found between creativity and dyslexia status. The third moderator was the creativity domain captured by assessments. The most widely used assessment to measure creativity, the Torrance Test of Creative Thinking (TTCT; Torrance, 1990), measures the verbal as well as the nonverbal or figurative domains of creativity. It has been suggested, however, that tasks of verbal domains of creativity should be excluded when assessing individuals with dyslexia, as the outcome might be influenced by the dyslexia-related deficits in the phonological domains (Cancer & Antonietti, 2019). Therefore, we coded for the creativity domains (verbal vs. nonverbal/figurative vs. combined) to test for the potential relation of this aspect on the link between dyslexia and enhanced creativity.
The approach of this meta-analysis was to include and synthesize a comprehensive set of studies to assess mean and variance differences in creativity between dyslexia and control groups. Based on prior investigations collectively reporting mixed findings on mean differences, we hypothesized to find no significant mean differences in creativity between the groups. Based on the fact that variance differences of creativity between our two studied groups have not been previously tested, we offer no a priori hypothesis regarding individual differences. As to moderators, we expected that the relation between dyslexia and enhanced creativity would vary as a function of age, gender, and creativity domain. Specifically, based on Everatt et al. (1999), we expected to find mean differences in creativity in older, but not younger samples. As to gender, we expected to find mean differences, such that females would outperform males in creativity (Baer & Kaufman, 2008). Finally, based on Cancer and Antonietti (2019), we hypothesized that compared with the figurative domain, the verbal domain of creativity would exhibit significant mean differences between individuals with and without dyslexia.
Method
Literature Search Procedure
A four-step process was used to identify studies that explored the relation between dyslexia and creativity. First, we conducted a comprehensive computerized search of PsycINFO, ERIC, Academic Search, Medline, and EBSCOHost databases using the Boolean search terms ((DE “Dyslexia” or TI dyslex* or AB dyslex*) or (DE “reading disabilities” or TI reading disab* or AB reading disab*) or (DE “reading abilities” or TI reading abilit* or AB reading abilit*) or (DE “specific reading disabilities” or TI specific reading disab* or AB specific reading disab*) or (DE “reading difficulties” or TI “reading difficult* or AB reading difficult*)) AND ((DE “Creativity” OR TI (creativity or originality) OR AB (creativity or originality)) with no restrictions on the year of publications. The search was conducted on November 1, 2020. Peer-reviewed articles, book chapters, theses, and dissertations were queried. This search yielded a total of 372 studies (PsychINFO 105, ERIC 113, Academic Search 58, Medline 22, EBSCOHost 74). Second, we examined the references of relevant articles to search for additional potential studies to be included, which were not identified by the electronic search (backward search). Three additional studies (i.e., Cockcroft & Hartgill, 2004; Martinelli & Camilleri, 2016; Martinelli et al., 2018) were identified as eligible through hand searching references. Third, we performed a forward search of the relevant articles to find any studies that cited these works. To this end, two resources were used—Google Scholar with its “Cited By” link and the Web of Science Cited Reference Search. From this search method, two studies were identified (Avitia, 2019; Everatt et al., 2008). Fourth, in an effort to find gray literature, social media platforms (Facebook and Twitter) and listservs (Society for Scientific Studies of Reading, American Psychological Association Division 7 Developmental Psychology, and Special Education Pro Listservs) were utilized to request any unpublished data; unpublished manuscripts; manuscripts in preparation, under review, and/or in press; conference presentations and/or submissions, theses; and dissertations. In addition, authors who have published in this field (e.g., Sally Shaywitz) were emailed directly and asked to provide any unpublished data or literature relevant to the current study. From this search method, two additional conference presentations (i.e., Kwok, 2019; Wolff & Lundberg, 2001) were included in the study pool.
In total, the search yielded 379 eligible studies. After removing 73 duplicates, the pool consisted of 306 studies for review. The first and third authors reviewed all studies by reading titles and abstracts on the platform Rayyan, locating any studies that were eligible for the inclusion in the meta-analysis based on the inclusion and exclusion criteria described below. The preliminary screening excluded 285 studies for different reasons (see Figure SI1 in Supplemental Materials). The primary screening resulted in 21 studies, which were eligible for secondary screening. For secondary screening, full articles and conference presentations of the resulting 21 studies were obtained and reviewed carefully for eligibility. Of the 21 studies, one study (LaFrance, 1997) was further excluded because it did not report quantitative information for calculating effect sizes. This resulted in a total of 20 studies that were included in the final meta-analysis, of which 16 were peer-reviewed articles, 2 dissertations, and 2 conference presentations. The flowchart presented in Figure SI1 in Supplemental Materials illustrates the literature search procedure described above.
Inclusion and Exclusion Criteria, Study Coding Procedure
Inclusion and exclusion criteria together with study coding procedure and the codebook are reported in the online supplemental materials.
Effect Size Calculations for Mean and Variance Differences and Moderator Analyses
Hedges’ g, adjusted for small-sample size bias, was used as the measure of effect size. A positive effect size reflected the dyslexia group outperforming the control group. Hedges’ g was chosen over Cohen’s d as Cohen’s d tends to overestimate the population effect size, particularly with smaller sample sizes (studies in this review mostly had small sample sizes) (Cumming, 2012; Lakens, 2013). In terms of interpretability, Hedges’ g and Cohen’s d are directly comparable.
First, we computed an average weighted effect size to estimate the mean difference in creativity between groups with and without dyslexia. All eligible effect sizes from each individual study were used. As such, studies contributed multiple effect sizes as long as the sample for each effect size was independent. For example, all effect sizes from the studies that reported separate effects for different creativity domains (e.g., Everatt et al., 1999) were eligible. To account for statistical dependencies of multiple effect sizes from the same sample (i.e., effect sizes nested within samples), we conducted the random-effects RVE analysis (Hedges et al., 2010). RVE allowed for the clustered data by correcting the study standard errors to take into account the correlations between effect sizes from the same sample. The RVE requires that an estimate of the mean correlation (ρ) between all the pairs of effect sizes within a cluster be estimated for calculation of the between-study sampling variance estimate, τ2. In all analyses, we estimated τ2 with ρ = .80; sensitivity analyses showed that the findings were robust across different reasonable estimates of ρ. A random-effects model was chosen over a fixed-effect model because it was hypothesized that the body of literature reported in the current study was incidental to a distribution of effects with significant between-studies variance rather than no variability between studies (Lipsey & Wilson, 2001). After calculating an average weighted effect size, a forest plot was created to depict the summary effect from the random-effects model, along with the effect sizes extracted from each individual study, displaying the full distribution of effect sizes that comprised the average weighted effect size. Two statistics, I2 and τ2, were used to examine the presence and magnitude of heterogeneity among effect sizes (Borenstein et al., 2011). The I2 assesses the percentage of between-study variance that is attributable to true heterogeneity rather than random error, while the τ2 represents the true between-study variance from the observed studies (Borenstein et al., 2011).
Next, we conducted meta-regression analyses to estimate the moderation effects of age, gender, and creativity domain based on the mean comparison between dyslexia and control groups. Each moderator was examined controlling for other moderators in one meta-regression model. Moderators with more than two categories (e.g., age had three categories—children, adolescents, adults) were first dummy coded before entering the model to enable comparison examination across categories (Cohen et al., 2013), while continuous moderators (e.g., gender defined as a proportion of males in the dyslexia and control groups) were entered directly into the model. Weighted, random-effects meta-regression analyses using Hedges et al.’s (2010) corrections were conducted with ROBUMETA in R. Again, the I2 and τ2 were used to report heterogeneity alongside with R2 which is the proportion of between-study variance explained by the meta-regression model.
Then, we examined variance differences. Specifically, to evaluate effect sizes for group differences in standard deviation, we followed the approach of Chamberlain et al. (2018) to calculate the ratio of standard deviations (SDR):
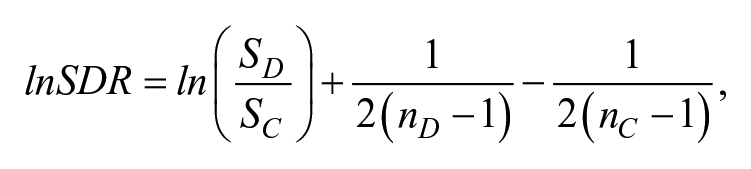
where ln() is loge(), the natural logarithm to base e; SD is the standard deviation of the group with dyslexia, and Sc is the standard deviation of the age-matched typically developing control group. lnSDR has the advantage that equality of standard deviations is indicated by lnSDR = 0, and the distribution is unbounded and symmetric around zero. The sampling variance of lnSDR is calculated as
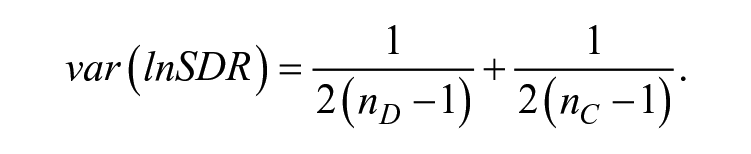
Finally, we conducted meta-regression analyses to estimate the moderation effects of age, gender, and creativity domain based on the variance differences between dyslexia and control groups. While controlling for other moderators, each moderator was examined in one meta-regression model. The moderator analysis procedure was identical to the one described above for mean comparisons.
Publication Bias and Outliers
Publication bias was examined conducting Egger’s regression test (Sterne & Egger, 2005), inspecting contour-enhanced funnel plots, and using precision effect estimation with standard error (PEESE; Stanley & Doucouliagos, 2014). In the absence of publication bias, the Egger’s publication bias statistic is statistically nonsignificant (p > .05). In the contour-enhanced funnel plot, the contour lines indicate conventional milestones in levels of statistical significance (e.g., <.01, <.05, <.1) that are added to funnel plots. If studies appear to be missing in areas of statistically nonsignificant areas, then this may mean the asymmetry of funnel plot is due to publication bias. If the supposed missing studies are in areas of higher statistical significance, this would mean the cause of the asymmetry may be due to factors other than publication bias, such as variable study quality (Peters et al., 2008). The contour-enhanced funnel plot was also used to detect any outliers. Finally, in PEESE, in which we used a random-effects RVE to regress the study effect size on the squared standard error, a statistically nonsignificant association suggests no publication bias.
Results
Effect Size Calculations for Mean and Variance Differences and Moderator Analyses
Our search yielded a total of 20 independent studies that were included in the present meta-analysis. Sample sizes in the dyslexia group ranged from 4 (Cockcroft & Hartgill, 2004) to 95 (Bigozzi et al., 2016), with a total of 770 individuals. In the control group, sample sizes ranged from 13 (Alves & Nakano, 2014) to 415 (Ritchie et al., 2013), with a total of 1,671 controls. (Sample sizes from the Cockcroft & Hartgill’s 2004 study are not included in the controls sample size estimate because that study reports control sample sizes from normed samples.) All 20 included studies subsumed 89 effect sizes for mean differences and 76 effect sizes for variance differences. As hypothesized, results of the random-effects RVE analysis showed that, on average, there was no evidence of enhanced creativity in dyslexia group compared with the control group (g = −0.02, 95% CI [−0.22, 0.18], p = .84). Supplemental Figure SI3 shows the RVE-based forest plot related to the standardized mean differences in creativity outcomes between dyslexia and control groups. The open diamond at the bottom of the forest plot crosses the line of no effect, reflecting statistically nonsignificant differences between groups on creativity. Confidence intervals in the forest plot indicate some variability in the effect sizes. In fact, around four-fifths of the variance was estimated to be true effect size heterogeneity (I2 = 79.87%, τ2 = 0.22), suggesting that there may be meaningful differences among studies that can be further explored through moderator analyses.
Following RVE analyses, moderator analyses were conducted to determine whether mean differences varied as a function of age, gender, and creativity domain. All moderators were entered together in one meta-regression model. Compared with the intercept model, the moderators explained some between-study variance, which is reflected in I2 decreasing from 79.87% to 54.57% and τ2 from 0.22 to 0.09. The total estimated amount of heterogeneity accounted for by our moderators was R2 = 59.09%. Consistent with our hypothesis, mean differences in creativity differed as a function of all three moderators. As shown in Table 1, age was a statistically significant predictor of effect sizes when treated as a variable with three categories (children, adolescents, adults). Results indicated that compared with adolescents, adults with dyslexia showed an advantage over nondyslexic adults in creativity measures, β = −0.74, t(5.01) = −2.93, p = .033. There was no evidence that age moderated any of the other mean difference comparisons in the model. In addition, when age was entered into the multivariate regression model as a continuous variable, it did not turn out to be a significant predictor of heterogeneity in effect sizes (p = .353). The nonsignificance was probably due to too little variability in the observed values of the moderator. There was a narrow range of values in a continuous moderator age. (See the codebook in supplemental materials for detailed information.) Therefore, from the perspective of theory and simplicity, we elected to report results with age being treated as a trichotomized variable. As to gender, a higher proportion of males in the dyslexia group was associated with poorer performance in creativity compared with the controls, β = −0.02, t(4.14) = −3.06, p = .036. Finally, creativity domain also accounted for the heterogeneity in the effect sizes. The dyslexia group performed significantly poorer on verbal creativity tasks (e.g., creative writing about four imaginary creatures; Avitia, 2019) versus figural/nonverbal tasks (e.g., using shapes to make novel drawings, Everatt, 1997; Everatt et al., 1999) compared with the control group, β = −0.73, t(5.13) = −3.86, p = .011. Regarding particular creativity tasks, we also conducted a multivariate regression model, in which we included a fourth moderator named types of creativity tasks. We tested whether mean differences in creativity differed as a function of tasks that depended on reading questions and/or writing answers. The moderator proved to be nonsignificantly related to the unit change in effect sizes. The estimates from this moderation analysis are presented in Supplemental Table SI1.
Moderation Analysis on Creativity Mean Differences Between Dyslexia and Control Groups.
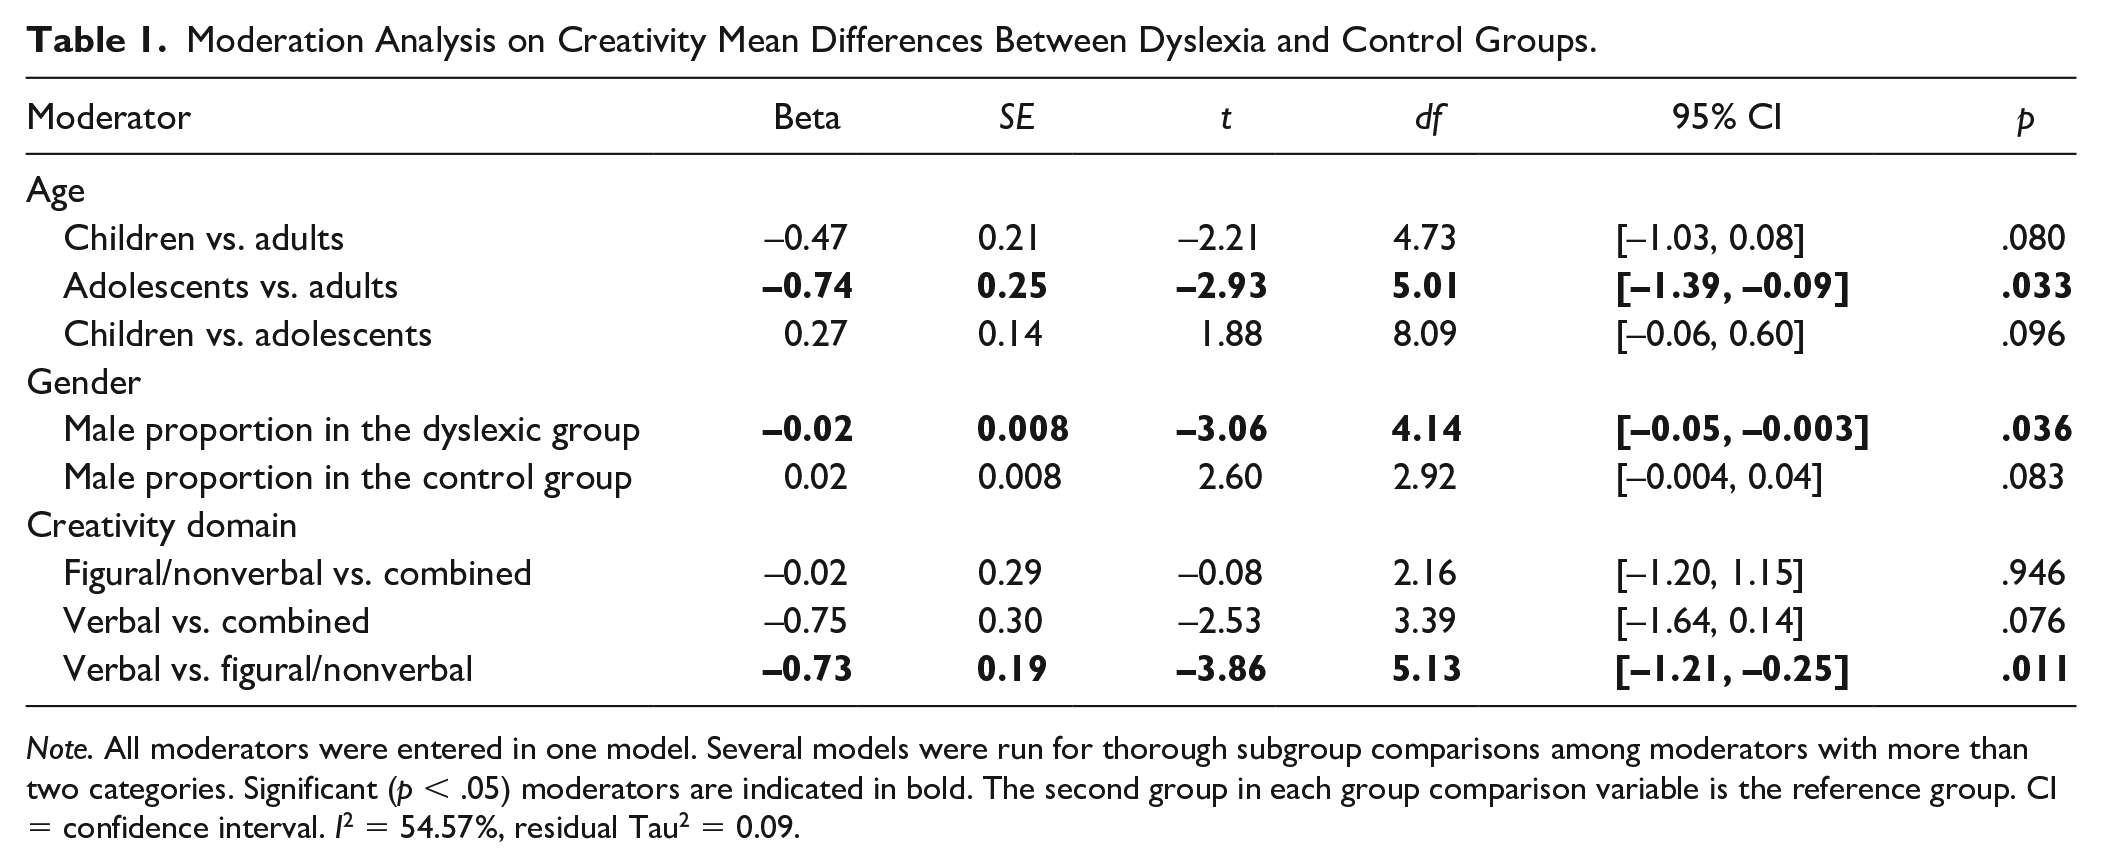
Note. All moderators were entered in one model. Several models were run for thorough subgroup comparisons among moderators with more than two categories. Significant (p < .05) moderators are indicated in bold. The second group in each group comparison variable is the reference group. CI = confidence interval. I2 = 54.57%, residual Tau2 = 0.09.
Next, we conducted analyses to explore variance differences. In general, the dyslexia group was not more heterogeneous in creativity compared with its age-matched controls (g = −0.0004, 95% CI [−0.11, 0.11], p = .99). Almost two thirds of the sampling variance was due to heterogeneity (I2 = 63.51%; τ2 = 0.05), again suggesting potential meaningful differences among studies.
All moderators were entered together in one meta-regression model. The moderators explained some of the between-study variance with I2 decreasing from 63.51% to 53.64% and τ2 from 0.05 to 0.04. The total estimated amount of the heterogeneity explained by the group-level moderators was R2 = 20.00%. The group with dyslexia did exhibit smaller individual differences in creativity as a function of age and creativity domain. As indicated in Table 2, compared with adults, adolescents showed decreased variance in creativity in the dyslexia group relative to the control group, β = −0.43, t(4.94) = −3.11, p = .027. As to creativity domain, if the creativity task measured verbal creativity versus measuring both verbal and nonverbal creativity (i.e., combined), then the dyslexia group exhibited smaller individual differences in creativity compared with the control group, β = −0.50, t(3.42) = −3.37, p = .036. Note, however, that because of the small number of studies (df < 4), this result has to be interpreted with caution. Finally, if the creativity task measured verbal creativity versus only nonverbal creativity, the dyslexia group exhibited less variability in creativity compared with the controls group, β = −0.39, t(5.15) = −2.81, p = .036.
Moderation Analysis on Creativity Variance Differences Between Dyslexia and Control Groups.
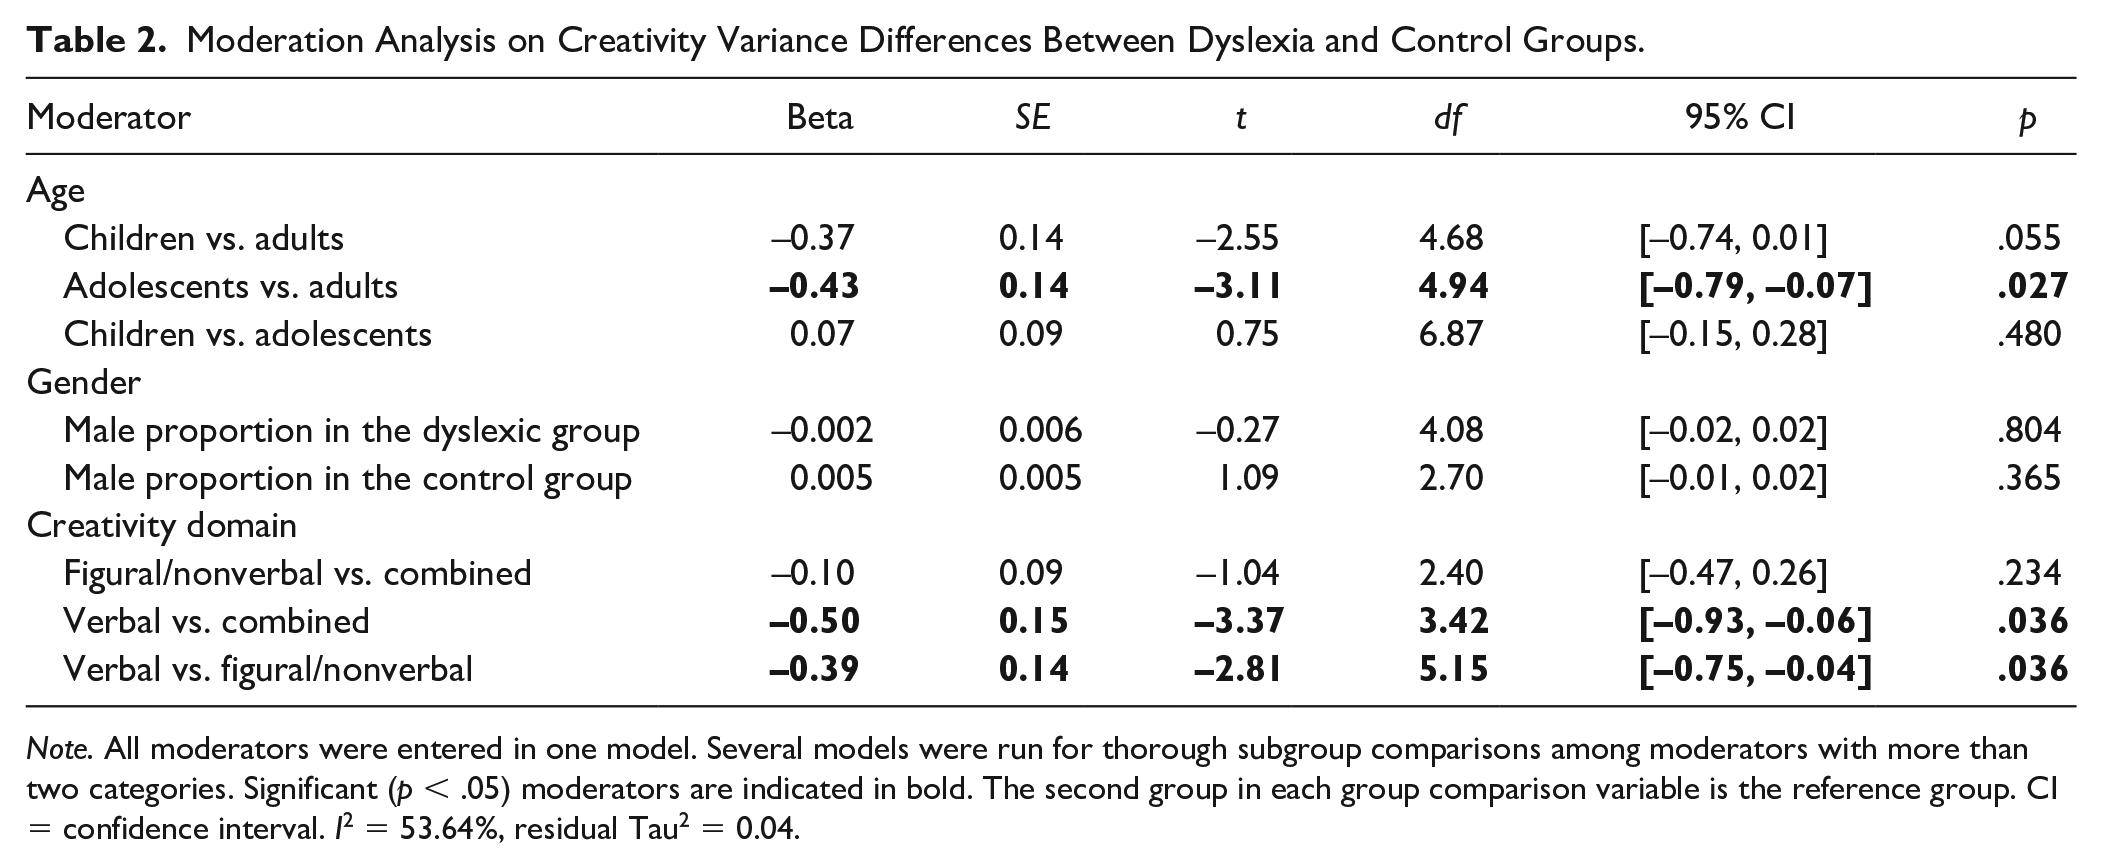
Note. All moderators were entered in one model. Several models were run for thorough subgroup comparisons among moderators with more than two categories. Significant (p < .05) moderators are indicated in bold. The second group in each group comparison variable is the reference group. CI = confidence interval. I2 = 53.64%, residual Tau2 = 0.04.
Publication Bias and Outliers
Based on the Sterne and Egger’s (2005) publication bias statistics (ps > .05), inspection of the contour-enhanced funnel plots (see Supplemental Figure SI2), and PEESE (ps > .05) there was little likelihood of publication bias affecting the conclusions of the present meta-analysis. As to the outliers, based on our inspection of the funnel plots, which demonstrated relative symmetry, we did not detect any obvious outliers.
Discussion
Some researchers have argued that dyslexia might be accompanied by superiority in creativity; however, theoretical and empirical research has resulted in conflicting findings with regard to this assumption. Considering the controversy in the literature, the present meta-analysis is the first to quantitatively synthesize a comprehensive set of studies to investigate the connection between dyslexia and creativity. Specifically, we explored summary effects of mean and variance differences in creativity between dyslexia and control groups. Across 20 included studies, results collectively supported the hypothesis that no such differences exist, disconfirming the belief of a creative benefit accompanying dyslexia.
As expected, our primary finding was that individuals with dyslexia as a group, on average, did not perform better on creativity tasks when compared with their peers without dyslexia. Notably, the magnitude of the effect was negligible. This finding refutes the compensatory hypotheses that individuals with dyslexia are compensated with enhanced creativity (e.g., Chakravarty, 2009; Wolff & Lundberg, 2002). Rather, results are consistent with the hypothesis that much like any other continuous trait, creativity runs on a spectrum, meaning that enhanced creativity simply represents the high end of the continuous distribution of a trait, regardless of the dyslexia status of a particular individual. In other words, creativity fluctuates for each individual and superiority in creativity does not appear to be characteristic of a dyslexia group as a whole. While the present meta-analysis cannot determine whether particular individuals with dyslexia are creative because of their genetic and neurological make-up or any other compensatory mechanisms, the results help justify the idea that, on average, no differences between groups exist. As such, the claims that populations with dyslexia might operate in a “right-brained” way associated with superiority in creativity seem to be contested by the results of the present meta-analysis.
There was some variability in the effect sizes as indicated by the estimates of heterogeneity and confidence intervals. Hence, we explored whether some factors were associated with more pronounced mean differences in creativity. According to our hypothesis, age was a significant factor of heterogeneity. This finding is in line with previous work which has shown that age might be one likely driver of heterogeneity. For example, in a study by Everatt et al. (1999), adults with dyslexia showed a small advantage over nondyslexic adults in creativity measures; however, this effect could not be replicated in children. This led Everatt and colleagues (1999) to suggest that superior creativity in individuals with dyslexia compared with the controls might develop over time as a coping mechanism for low literacy skills. This explanation was further supported by reports of enhanced creativity in older children with dyslexia compared with their nondyslexic peers (e.g., Everatt et al., 2008; Tafti et al., 2009). The findings of our meta-analysis appear to mirror Everatt et al.’s (2008) findings, suggesting that mean differences in creativity might not be stable across age groups but seem to be more pronounced in adult years.
Similarly to age and in line with our hypothesis, creativity domain was identified as a source of heterogeneity. We intuitively think that differences between dyslexia and control groups are plausible and apparent when creativity is measured with verbal versus nonverbal/figural creativity tasks (due to verbal processing deficits of the dyslexia group). This, indeed, appears to be the case. The dyslexia group showed a significant performance disadvantage in verbal creativity relative to figural/nonverbal creativity compared with the control group.
Based on the literature, gender was also a good candidate as a moderator of the relation between dyslexia and creativity. Gender ratio was associated with mean differences in creativity between groups. As expected, a higher proportion of males in the dyslexia group was associated with poorer performance in creativity compared with the controls. This finding is in line with previous research (e.g., Quinn, 2018) showing a pronounced role of gender effects on dyslexia status, which seems to manifest also in creativity performance. Moreover, data are consistent with previous findings that consistently showed females outperforming males in creativity (e.g., Baer & Kaufman, 2008). Researchers believe that this is associated with significant relations between regional white matter volume and creativity in females, but not males (e.g., Takeuchi et al., 2017), gender differences in gray matter volume in the left temporo-occipital junction (e.g., Shi et al., 2017), and other gender-related differences in cortical networks that mediate creativity (e.g., Silberstein et al., 2019). Together, our results provide initial unifying evidence of the relation between dyslexia and enhanced creativity being more pronounced in females than males.
Turning to variability in creativity, results showed that, in general, there were no individual differences between groups. This finding does not support the hypotheses about the putative neurobiological mechanisms giving rise to heterogeneity in creativity in the dyslexia population (e.g., Chakravarty, 2009). Some studies do suggest that there might be a wider variation in neurological framework in individuals with dyslexia, such that these individuals exhibit distinct forms of excessive neural variability in comparison to controls (Dinstein et al., 2015). However, our results suggest that such mechanisms might be incidental only to particular individuals with dyslexia. As a whole, though, individual differences in creativity are stable across the population continuum, as our results seem to imply. In this regard, it is senseless to conclude that at the population level dyslexia group exposes any smaller or larger variability in creativity compared with the controls. Rather than being a result of any neurobiological or behavioral compensatory mechanisms, no differences in variability is more likely to be a consequence of the interplay between genetic predispositions and the embedding of environment and experience (e.g., Simonton, 2008) across the population regardless of a dyslexia designation.
A noteworthy finding, however, is that the variance effect sizes did vary as a function of age and creativity domain. That is, there was less variability in creativity among adolescents compared with adults in the dyslexia versus the control group. It appears that if certain compensatory mechanisms do, in fact, turn on in adulthood (Everatt et al., 1999), this is manifested by greater variability in creativity later in life. It is worth noticing, though, that in many reported studies, university students were considered as a population of adults with dyslexia. Therefore, no definite conclusions can be drawn with regard to the general adult population with dyslexia. Moreover, in most cases, studies did not account for the specific field of study the students were drawn from, which is likely to account for differences in their creativity (e.g., Cancer & Antonietti, 2019). Considering these caveats, while our meta-analysis does show variation by age, it cannot identify the mechanisms that contribute to greater variability in creativity in adulthood. Hence, further empirical work is needed to determine those.
As to creativity domain, compared with controls, the group with dyslexia showed smaller variability in verbal creativity domain versus nonverbal/figurative or combined. This is a noteworthy, yet not surprising, finding since individuals with dyslexia share similar characteristics related to verbal processing, such as deficits in phonological decoding. These deficits contribute to similarities within the group, which, in turn, seems to manifest in homogeneity in the verbal creativity domain. Conversely, variation in nonverbal/figural domain is larger in the dyslexia group compared with the general population. The current meta-analysis cannot determine why and how individual differences are larger. It can be speculated, however, that a source of variability exists in the dyslexia group in addition to that found in controls. On the left side of the spectrum, this might be attributed to comorbidities of dyslexia with other learning disabilities, such as dyscalculia and attention-deficit/hyperactivity disorder (ADHD; e.g., Daucourt et al., 2020) while on the right side of the spectrum, this might be due to compensation strategies or giftedness (e.g., LaFrance, 1997). As some of the literature of compensatory mechanisms suggests (e.g., Chakravarty, 2009; Stein, 2001), many particular individuals with dyslexia (e.g., visual artists, entrepreneurs) can be highly creative, out-of-the-box thinkers, who might be “naturally creative” because of their neurological make-up or heightened lateral thinking abilities. If such advantages do exist in some individuals, then they appear to be manifested as higher variability in nonverbal/figural creativity in the dyslexia group.
Collectively, the findings of no mean or variance differences between individuals with dyslexia and their nondyslexic peers are informative for future decisions in educational, as well as clinical, realms. Proponents of the idea that dyslexia gives rise to enhanced creativity might have driven the general consensus within the field alluding to the notion that such differences may, indeed, exist. Our meta-analytic summary effects did not support these premises. As such, the results demonstrate that an individual proponent or research lab perpetuating the myth of superiority in creativity in dyslexia group should not be relied upon as the deciding factor.
Limitations and Future Directions
This work should be viewed in the context of some limitations and future directions. The critical appraisal of primary evidence which we discuss here warrants some attention. We used the GRADE system (Grading of Recommendations Assessment, Development, and Evaluation) to evaluate the quality of evidence in primary studies. GRADE is used widely by, for example, Cochrane and the World Health Organization (Guyatt et al., 2008, 2011). Observational studies, such as the ones used in this meta-analysis, are rated based on their limitations and risk of bias. Here, we will discuss quality indicators relevant to our primary studies under three categories: failure to develop and apply appropriate eligibility criteria, flawed measurement, and failure to control for confounding variables (see Table 5.5 in “The GRADE Handbook,” 2013). As to failure to develop and apply appropriate eligibility criteria, we found considerable variability in the sampling methods employed within reviewed studies. For example, low rates of participation (e.g., a study by Cockcroft & Hartgill, 2004) give rise to concerns regarding sampling bias. It may be that procedures to select individuals with dyslexia excluded a particular subsample of the dyslexic population (e.g., socioeconomically disadvantaged students), which could indicate a potential bias and might inhibit our ability to generalize the findings. In addition, in many studies no screening was done for comorbid neurodevelopmental conditions (e.g., ADHD, speech-language impairments) that might be associated with creativity in any direction. Regarding flawed measurement, the conceptualization and measurement of creativity differed among studies. Not all studies have used data on standardized outcome measures. A variety of different tests was employed to assess creativity. Though the majority of tests have been developed on the basis of the same theoretical model of creativity, Guilford’s (1967) original model, the testing procedure, and characteristics of the tasks were not consistent across studies. With these differences may come limitations associated with the reliability and validity of the methods employed. Finally, regarding failure to control for confounding variables, lack of screening for comorbid disorders limits the conclusions. If the dyslexia group contains some individuals with primary impairments of speech and language, this could be related to their difficulties in verbal creativity. The other co-occurring risk factor might be attention problems (e.g., Daucourt et al., 2020). In short, there is a need for research that tracks the association of creativity and impaired reading skills in individuals with different co-occurring risk factors. In summary, research on the association between dyslexia and creativity has strengthened evidence for a nonsignificant relation between these two traits in this population. However, there is still a pressing need for higher quality studies which would incorporate appropriate eligibility criteria, standardized outcome measures, and potential confounders.
Other limitations and biases to consider are the following. There were only a few studies that matched our inclusionary criteria and were included in the examination. In addition, some data that we requested could not be included because authors failed to provide data and/or estimates. As such, there might be some bias in the estimates of unknown origin. Next, caution is warranted in generalization of some of the moderation results. When the number of included studies is small, meta-regression may suffer from lower statistical power to examine all moderators simultaneously (Tanner-Smith & Grant, 2018). This calls for caution when interpreting some results, as noted in our example of estimating variability in creativity by creativity domains. Another cautionary note linked to this limitation is related to a wide array of domains that encompass the creativity ability. We tested for the verbal versus nonverbal/figurative versus combined domains since the number of effect sizes was quite sufficient to explore their roles. It is possible that more specific creativity domains not tested here, such as originality, elaboration, and fluency, are related to dyslexia-creativity link. However, the number of effect sizes across specific domains was too small for this to be tested rigorously. This illustrates the need for future studies to include sufficient information across specific creativity domains to afford comparisons. As such, further examinations of between-project differences should focus on these aspects that might influence the magnitude of the connection between dyslexia and creativity. Next, though the TTCT is the most common creativity assessment, some have argued that it lacks real-world relevance (Baer, 2011). A related issue is that the test assumes domain-generality, and the format or domain of expression is less critical (Baer & Kaufman, 2017). However, creativity can be expressed in many domain-specific, real-world applications, from cooking to computer science, which might not be meaningfully mirrored by measures of creativity, as the ones used in primary studies. Finally, reviewed studies could not incorporate and control for a disparate range of moderators that might have obscured or induced the association between dyslexia and enhanced creativity. The importance of context when considering creativity should be acknowledged. Even our more comprehensive multivariate model was unable to completely account for all of the variance in individuals’ creativity.
Conclusion
Despite these caveats, our meta-analytic results are broadly informative in that they are the first to provide a component of a unifying empirical basis supporting the hypothesis of no mean and variance differences in creativity between groups with and without dyslexia. Such findings not only serve to underscore the absence of a dyslexia-enhanced creativity link but also highlight the need for school practitioners not to assume that, on average, any superior creativity will be expressed in academic achievement outcomes. What our results do not suggest is that educators should fail to support and nurture creativity. As indicated, creativity runs on a continuum, suggesting that some individuals will be greater creative talents than others, irrespective of their dyslexia status.
Supplemental Material
sj-pdf-1-ldx-10.1177_00222194211010350 – Supplemental material for No Evidence of Creative Benefit Accompanying Dyslexia: A Meta-Analysis
Supplemental material, sj-pdf-1-ldx-10.1177_00222194211010350 for No Evidence of Creative Benefit Accompanying Dyslexia: A Meta-Analysis by Florina Erbeli, Peng Peng and Marianne Rice in Journal of Learning Disabilities
Footnotes
Declaration of Conflicting Interests
The author(s) declared no potential conflicts of interest with respect to the research, authorship, and/or publication of this article.
Funding
The author(s) received no financial support for the research, authorship, and/or publication of this article.
Supplemental Material
Supplemental material for this article is available on the Journal of Learning Disabilities website with the online version of this article.
References
Supplementary Material
Please find the following supplemental material available below.
For Open Access articles published under a Creative Commons License, all supplemental material carries the same license as the article it is associated with.
For non-Open Access articles published, all supplemental material carries a non-exclusive license, and permission requests for re-use of supplemental material or any part of supplemental material shall be sent directly to the copyright owner as specified in the copyright notice associated with the article.