
Abstract
Understanding consumers’ associations with brands is at the core of brand management. However, measuring associations is challenging because consumers can associate a brand with many objects, emotions, activities, sceneries, and concepts. This article presents an elicitation platform, analysis methodology, and results on consumer associations of U.S. national brands. The elicitation is direct, unaided, scalable, and quantitative and uses the power of visuals to depict a detailed representation of respondents’ relationships with a brand. The proposed brand visual elicitation platform allows firms to collect online brand collages created by respondents and analyze them quantitatively to elicit brand associations. The authors use the platform to collect 4,743 collages from 1,851 respondents for 303 large U.S. brands. Using unsupervised machine-learning and image-processing approaches, they analyze the collages and obtain a detailed set of associations for each brand, including objects (e.g., animals, food, people), constructs (e.g., abstract art, horror, delicious, famous, fantasy), occupations (e.g., musician, bodybuilder, baker), nature (e.g., beach, misty, snowscape, wildlife), and institutions (e.g., corporate, army, school). The authors demonstrate the following applications for brand management: obtaining prototypical brand visuals, relating associations to brand personality and equity, identifying favorable associations per category, exploring brand uniqueness through differentiating associations, and identifying commonalities between brands across categories for potential collaborations.
Keywords
Understanding how consumers perceive brands is at the core of brand management. It helps managers develop and position new products, understand the competitive landscape, and create effective marketing communications. Brand perception is often conceptualized as an associative network, where concepts related to the brand attributes, benefits, and attitudes are represented as memory nodes. Keller (1993) argues that these associations are diverse: they can relate to the brand’s functional benefits, to its symbolic value, to the marketing-mix elements, to consumer experiences and attitudes, and to usage situations. The favorability, strength, and uniqueness of these associations determine the brand’s position relative to other brands, its competitive advantage, and its brand equity. In this framework, a brand manager’s task is to manage the associations—that is, strengthen desired associations and weaken undesired ones. Because consumers can associate a brand with any number of objects, emotions, activities, sceneries, and concepts, it is challenging to elicit and measure them in an interpretable way across brands and individuals.
Ideally, a comprehensive elicitation of brand associations should have several properties. First, it should not require predefining the set of associations of interest but rather should elicit them in an unaided way. Second, it should be scalable and quantitative to allow for monitoring a large number of respondents and brands. Third, to minimize the effect of intervening variables, the elicitation task should directly ask respondents for their associations rather than tease them out from a secondary source such as social media. The existing methods for obtaining brand associations are broadly categorized into quantitative surveys, qualitative surveys, and social media mining. Quantitative surveys (e.g., brand personality [Aaker 1997], brand equity [Mizik and Jacobson 2008]) are perhaps the most widely used. They typically define several theoretically driven brand attributes, on which participants are asked to rate brands. While these methods are scalable and quantitative, they are not ideal for free, unaided mining of associations. Qualitative surveys, such as collage methods (Zaltman and Coulter 1995) or association maps (John et al. 2006), are known to elicit a broad, diverse, and detailed range of associations; however, they are costly to apply on a large number of brands and respondents and cannot generate quantitative assessment.
The proliferation of online social media platforms has enabled scalable, quantitative, and unaided brand tracking by mining user-generated content (UGC) (Culotta and Cutler 2016; Klostermann et al. 2018; Lee and Bradlow 2011; Liu, Dzyabura, and Mizik 2020; Nam, Joshi, and Kannan 2017; Nam and Kannan 2014; Netzer et al. 2012; Tirunillai and Tellis 2014). However, for understanding consumer associations, UGC suffers from some shortcomings. First, it is available for only certain categories; whereas Nike generates a lot of social media chatter, social media posts about Colgate, for instance, are less abundant (Lovett, Peres, and Shachar 2013). Second, it is difficult to control for the characteristics of the content contributors. For example, users with a stronger relationship with the brand (Labrecque 2014) or those who hold a particularly strong positive or negative opinion may contribute more (Lovett et al. 2013). Finally, even a given consumer who contributes brand content may not offer their true opinion of the brand: consumers may post strategically to signal about themselves to the public (Han, Nunes, and Drèze 2010; Lovett et al. 2013) and serve their self-presentation needs (Seidman 2013).
In this article, we propose an elicitation that is direct, unaided, scalable, and quantitative and use it to retrieve the associations of a large number of national U.S. brands. Our elicitation consists of a platform and an analysis methodology. Inspired by qualitative elicitation approaches in psychology and marketing, we developed an online brand visual elicitation platform (B-VEP) that asks respondents to create an online collage of images representing their relationship with the brand. Participants can choose photos for their collages from a broad repository of tens of thousands of photos, using free browsing as well as keyword search. We analyze the collages using a machine-learning back end to derive brand associations at the individual-respondent level. The content extraction combines several machine-learning algorithms: image tagging, word embedding, and topic modeling. The combination of word embedding and topic modeling is a unique contribution of this research. By using unaided elicitation and unsupervised learning algorithms, we do not limit the dimensions on which the brand perceptions are measured. Unlike most existing unaided surveys, our approach allows for scaling to a large consumer population.
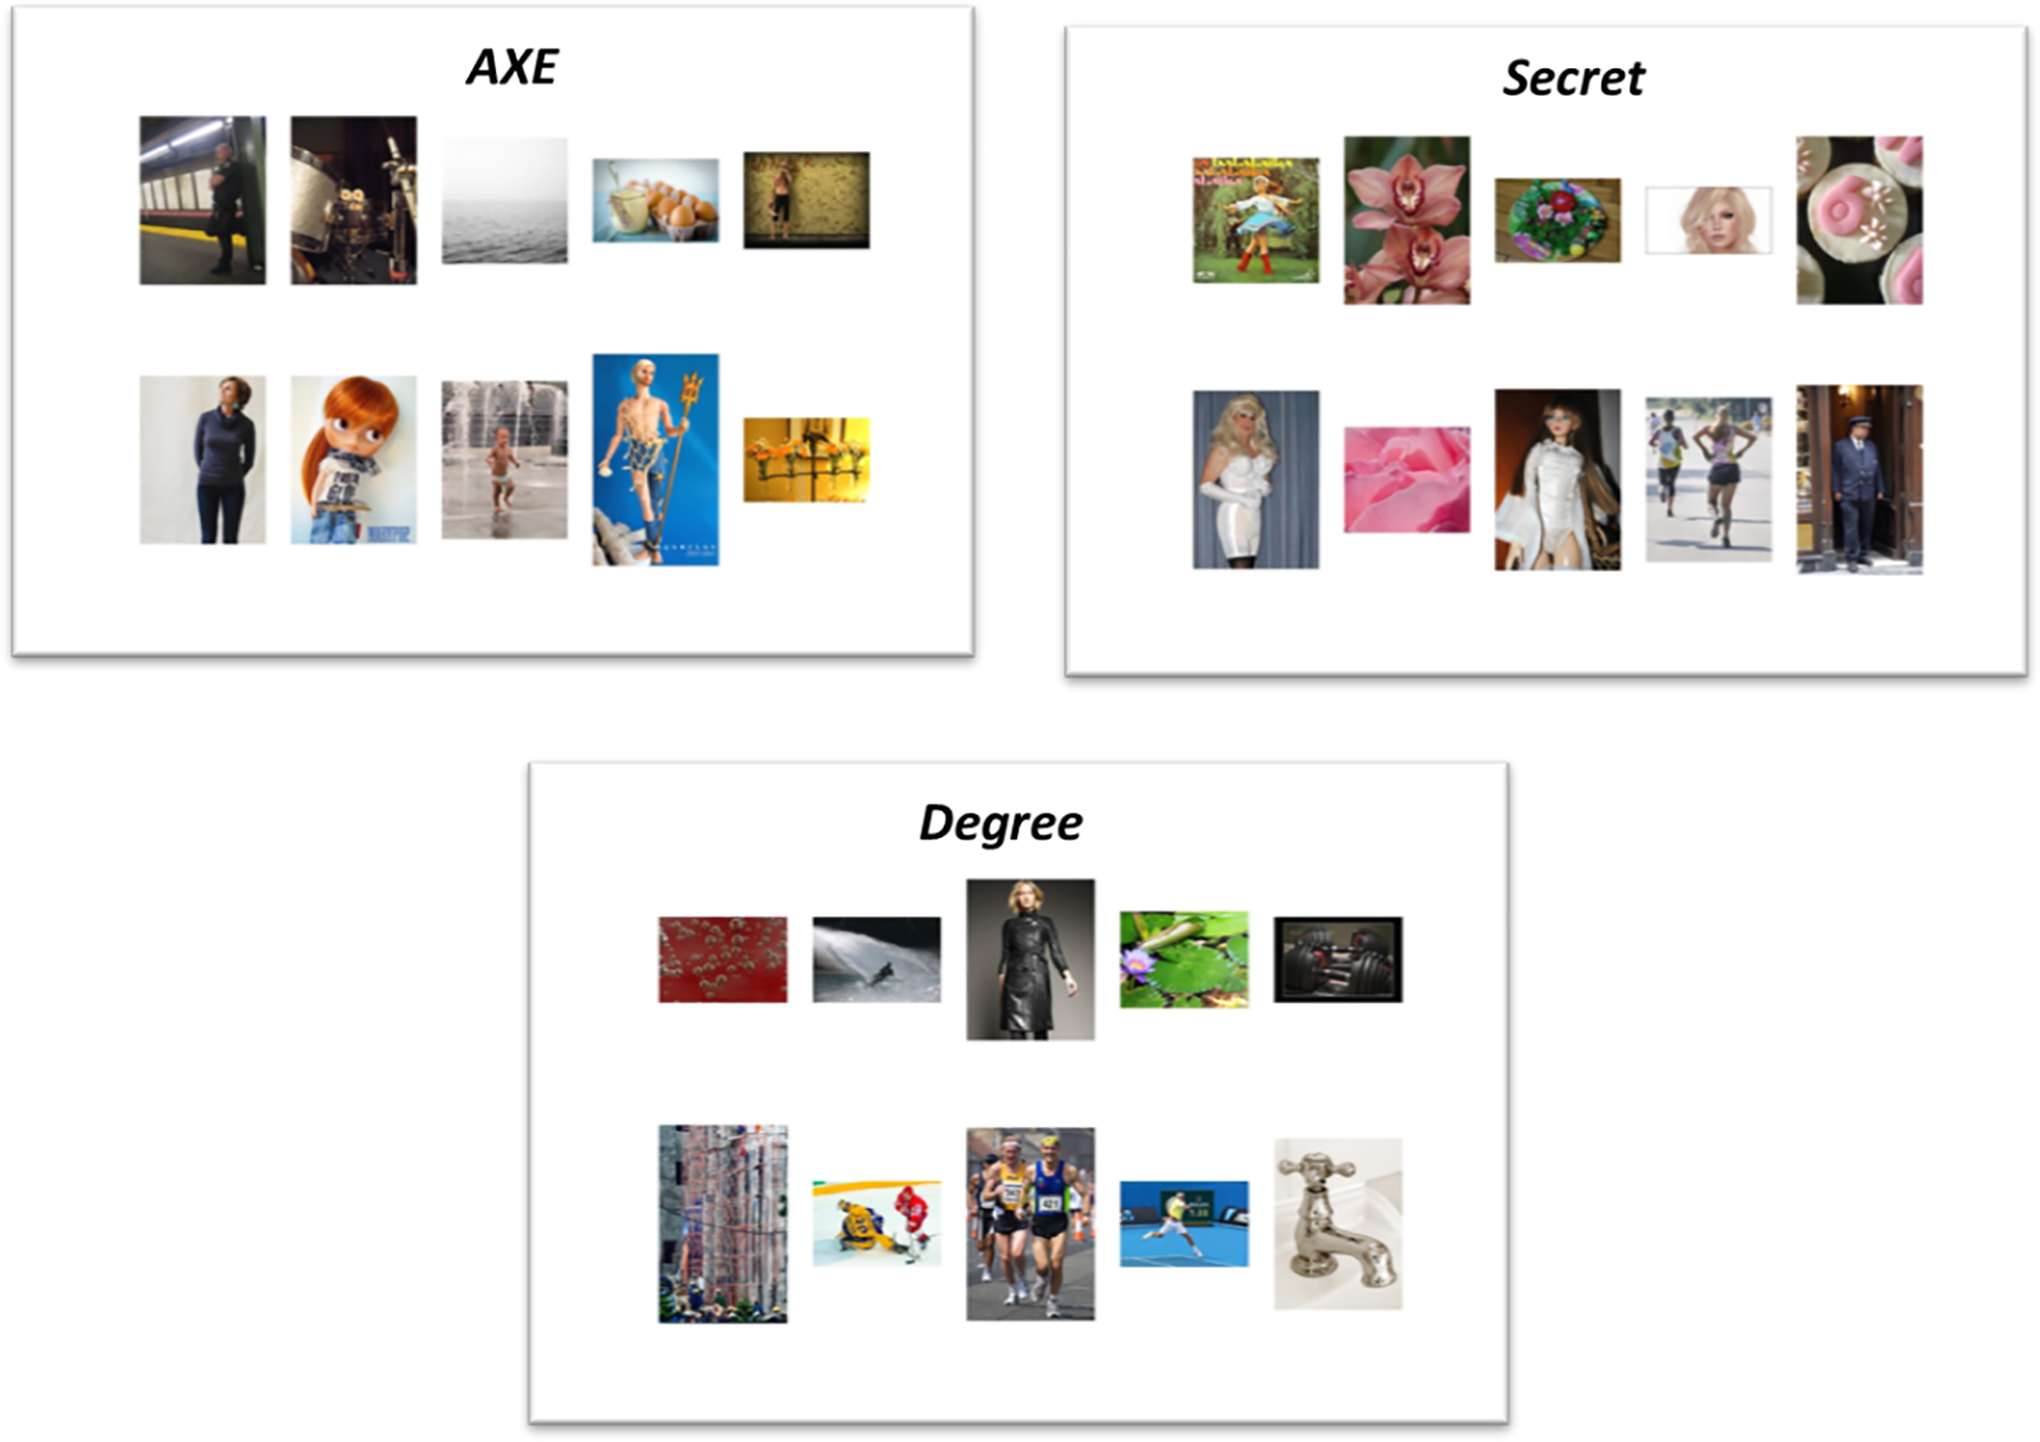
We use the proposed approach to elicit the brand associations of 303 major national U.S. brands using 4,743 collages from 1,851 respondents. We retrieve 150 brand associations relating to objects, actions, adjectives, characters, places, sceneries, concepts, and metaphors, on which all of these brands are mapped, to form the equivalent of a very high-dimensional perceptual map. Figure 1 presents three sample brands from our data—Axe, Degree, and Secret—and their most frequently occurring associations. Note that these associations relate to attributes, benefits, and attitudes (Keller 1993) that go beyond the standard dimensions of brand personality and brand equity. Although the three brands describe functionally similar deodorants, each brand has a distinctive set of associations: Axe is associated with fashion, urban youth, astronomy, and bodybuilding. Degree has athletic associations, such as running, water, sports, and fitness. Secret’s associations are more romantic and delicate, including lingerie, rain, and beauty salon.

An illustration of the strongest associations,in decreasing order, for Axe, Degree, and Secret.
We demonstrate the power of these findings through several potential applications for the creative and strategic functions of the brand management team. First, we show how to create prototypical collages by indexing photo repositories according to their fit to a given brand’s associations. These collages can serve as mood boards to help graphic designers generate visual brand content and to visually convey the brand’s associations. Second, we relate the associations to the well-established brand personality (Aaker 1997) and brand equity (Lovett et al. 2014; Mizik and Jacobson 2008) metrics, such that each metric has a clear, specific set of related associations (e.g., the “wholesome” metric is associated with herbs, baby, winter, happy nature, and insects; the “masculine” metric is associated with bicycle, military, heavy vehicle, auto racing, and photography; see the Web Appendix). Third, we relate the associations to brand favorability to identify desirable and undesirable associations in each of the nine product categories in our data. Fourth, we show how to measure brand uniqueness relative to its category—namely, what consumers associate with the brand significantly more or less than with other brands in its category. Finally, we show how to use the distance in the association space to detect potentially valuable commonalities between brands (e.g., for potential collaborations).
Our methodology shares some elements with Zaltman’s metaphor elicitation technique (ZMET), a collage-based interviewing technique (Zaltman and Coulter 1995; Zaltman and Zaltman 2008). In ZMET, participants are asked to create a collage of pictures to represent how they view a brand. The method, which has been widely used by practitioners (Catchings-Castello 2000), argues that consumers store a rich visual representation of their relationship with the brand, and these relationships can be efficiently elicited by creating collage metaphors (Zaltman and Coulter 1995). Like other qualitative direct-elicitation approaches (for a review, see Steenkamp and Van Trijp [1997]), ZMET results in data that are less directed by consumers’ strategic goals when posting on social media, can be applied for any brand, and can be used to gather responses from a controlled sample of consumers. ZMET also has the advantage of being fully unaided and free-form, allowing consumers to express their views in terms of a wide range of concepts. However, because it requires the presence of an interviewer, it is costly to conduct at scale.
The basic premise behind using visuals is that although the exact representation of brand associations in the human brain is not known, thoughts occur, in many cases, as images and visual metaphors. Therefore, visual research methods are considered to better reflect the emotions, cultural experiences, and attitudes that constitute the associations, in contrast to verbal methods, which focus more on the discourse of these experiences (Reavey 2011). In addition, use of images has been demonstrated to successfully disrupt well-rehearsed narratives (Reavey 2011) and thus might be effective in revealing hidden, often unarticulated associations and ideas.
The practice of using images to reveal brand associations is supported by the extensive use of visual stimuli by firms (Wedel and Pieters 2008). The human ability to process pictures and images (Kress and Van Leeuwen 1996; Palmer 1999) and to associate them with feelings and emotions (Cho, Schwarz, and Song 2008) makes visual elements a key factor in brand communications (McQuarrie 2008; Wedel and Pieters 2008). Research has shown that visual elements such as product packaging (Greenleaf and Raghubir 2008), store design (Meyers-Levy and Zhu 2008), graphic design of ads (Pieters, Rosbergen, and Wedel 1999; Rayner, Miller, and Rotello 2008; Wedel and Pieters 2000), and the visual context in which the brand is displayed (Cho, Schwarz, and Song 2008) have considerable impact on consumers’ responses to brands.
Our contribution is methodological, substantive, and managerial. Our methodology, consisting of an elicitation platform and an analysis procedure, is unaided, scalable, quantitative, and direct. We validate the associations and show that our method is superior to free verbal elicitation. Substantively, we obtain, for the first time, a detailed set of associations for 303 major U.S. brands from nine product categories. Our associations contain objects, actions, constructs, occupations, sceneries, and institutions. Managerially, we show how B-VEP can aid and enhance the creative and strategic functions of the brand management team. The creative teams can use B-VEP to index photo repositories and generate visual brand content to convey the brand’s associations. They can also connect each brand metric (e.g., “young,” “confident”) to sets of visuals. Strategically, insights from B-VEP can be used to manage brand health by relating the associations to brand favorability and identifying desirable and undesirable associations in each category. They can also help monitor the brand’s unique positioning in its category. Finally, by identifying brands in different categories with similar associations, B-VEP can be used as an aid to suggest strategic alliances.
Eliciting Brand Associations: Literature
Measuring how consumers perceive brands has received much attention in the academic literature, as well as in practitioners’ best practices. We review some of these methods next and summarize them in Table 1.
Mapping the Literature on Brand Perception Measurement Methods: Description and Benefits.
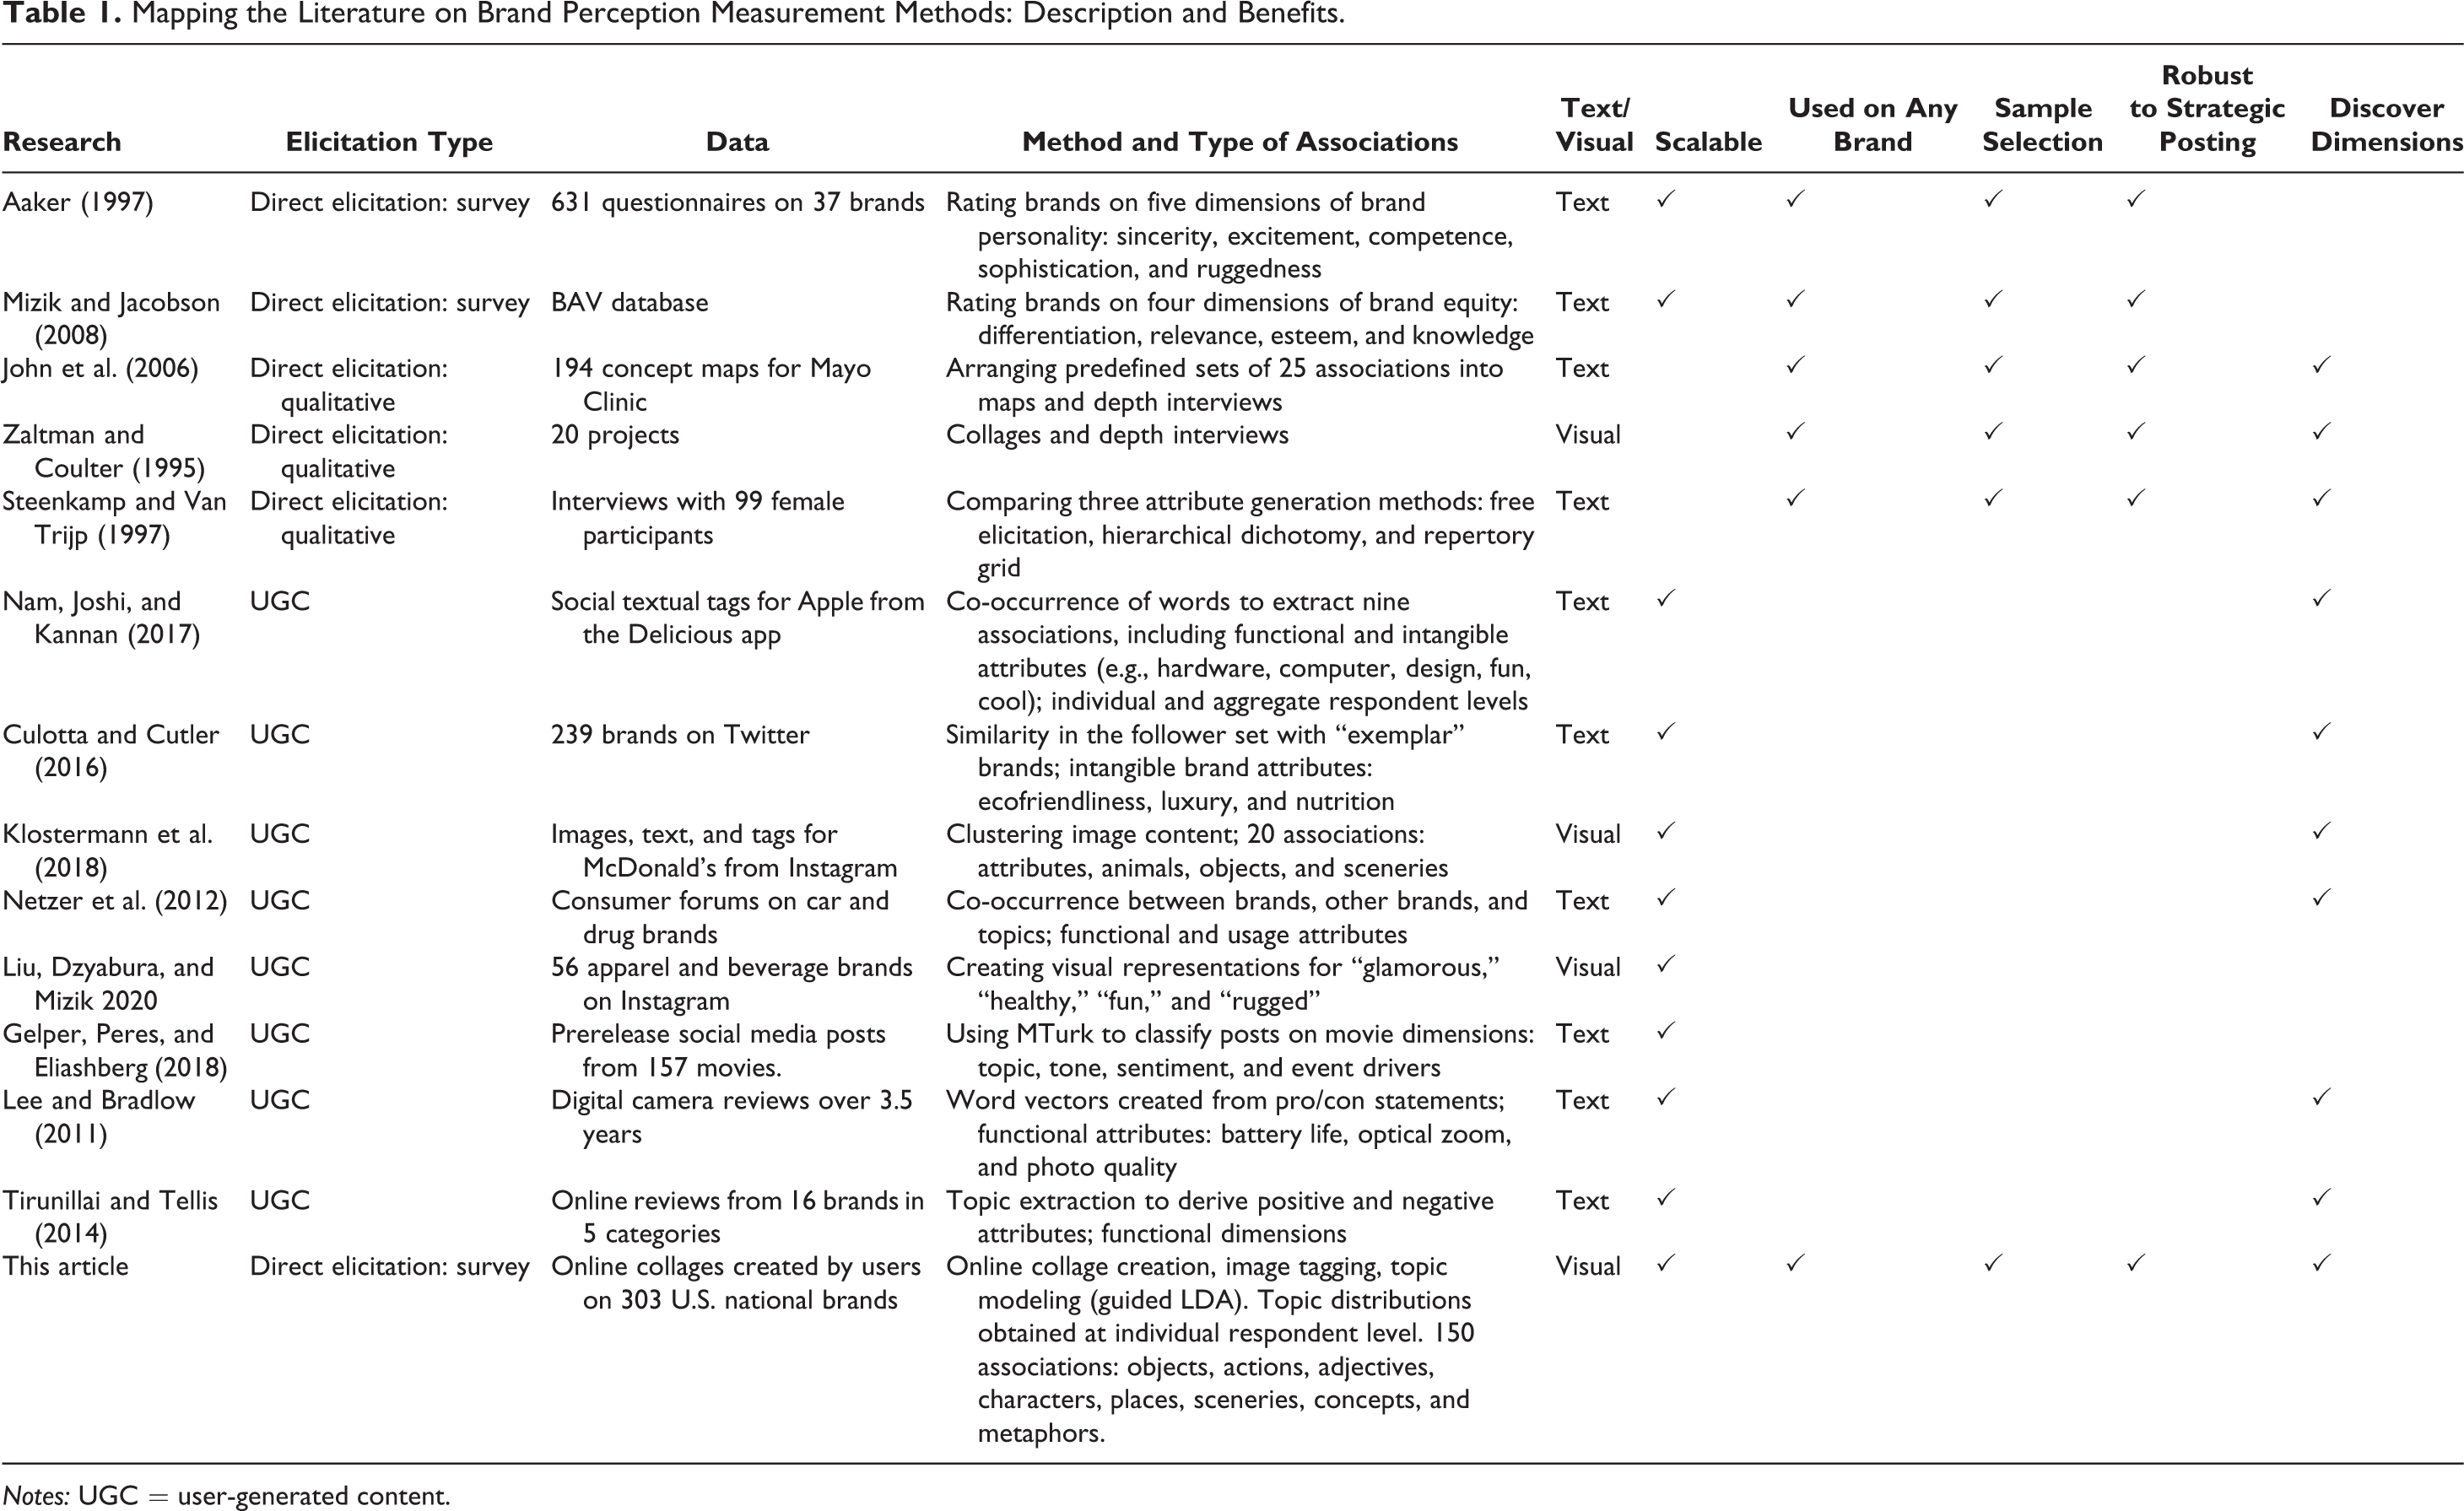
Notes: UGC = user-generated content.
Survey Methods
Traditional brand perception methods approach respondents directly, asking them for their perceptions of the brand. Some of these methods are surveys in which respondents rate the brands on sets of theoretically derived predefined attributes. The brand personality scale (Aaker 1997) rates brands on sets of five personality traits: sincerity, excitement, competence, sophistication, and ruggedness. The BrandAsset Valuator (BAV) scale, developed by Young & Rubicam, rates brands on four dimensions (differentiation, relevance, esteem, and knowledge) that have been shown to relate to brand financial performance (Mizik and Jacobson 2008) and to the volume of the brand’s online and offline word of mouth (Lovett, Peres, and Shachar 2013). Survey methods have become very popular due to their clear advantages: they are scalable for a large number of brands and respondents, can be applied to any brand, and enable the researcher to choose the sample according to the research needs (e.g., brand loyalists, potential users, a specific target market). The main drawback of surveys is that they require the researcher to predefine a set of attributes and thus cannot be used to discover new dimensions and associations.
Qualitative Methods
To reveal new brand associations from consumer responses, researchers have developed qualitative methods. These methods usually involve a one-on-one interview, a detailed protocol for how the interview should be conducted, and post hoc guidelines for interpreting the data. Similar to surveys, some qualitative methods use a predefined set of attributes. For example, John et al. (2006) presented respondents with a set of 25 associations derived from conversations with consumers and marketing professionals and asked them to arrange these associations into a map. Other methods, such as free elicitation (in which respondents are asked to describe the relevant dimension of the brands within a product category), hierarchical dichotomization (in which respondents classify brands into groups based on perceived similarity), and the repertory grid (in which respondents are asked to indicate similarity between triads of brands) enable researchers to elicit relevant attributes from the respondents (see Steenkamp and Van Trijp 1997).
A notable qualitative technique, which served as a motivation for this article, is ZMET (Zaltman and Coulter 1995; Zaltman and Zaltman 2008). In ZMET, participants are given seven to ten days to either take their own photographs or cut out pictures from books and magazines and arrange them into a collage describing how they view a brand. Then, respondents sit for a guided one-on-one conversation with an interviewer to describe their collage. The method, which has been widely used by practitioners (Catchings-Castello 2000), argues that consumers store a rich visual representation of the brand’s associations and metaphors, and creating collages is an efficient method for eliciting them (Zaltman and Coulter 1995). Zaltman and Coulter (1995, p. 40) state that because consumers create their own collage, rather than being presented with stimuli by the researcher, it is the consumers themselves (rather than the researchers) who are “in control of the stimuli used in the guided conversation.” The salient advantage of the qualitative techniques is that, being less restrictive and unaided (or nearly so), they do not constrain the respondents to dimensions predefined by the researchers and therefore generate new sets of associations and concepts. However, being qualitative, they are costly to scale and cannot be used to generate quantitative measures. In B-VEP, we aim to combine the advantages of the unaided, less restrictive elicitation methods with the scaling and quantification of the survey approaches.
User-Generated Content
Recently, consumers have begun contributing a large quantity of brand-related content on social media outlets, such as Twitter and Instagram. These data have the advantage of scalability due to the abundance of data contributed by consumers. These data are also unaided, as consumers are free to discuss any topic. A stream of research has developed ways to use this UGC for deriving valuable insights on product and brand perceptions. Researchers have used text data such as reviews (Lee and Bradlow 2011), blogs (Gelper, Peres, and Eliashberg 2018), microblogs (Culotta and Cutler 2016), social tags (Nam, Joshi, and Kannan 2017; Nam and Kannan 2014), and discussion forums (Netzer et al. 2012), as well as visual social media content (Jalali and Papatla 2016; Liu, Dzyabura, and Mizik 2020; Pavlov and Mizik 2019), for this purpose.
Some of the aforementioned studies exploited the richness of the data to apply unsupervised algorithms to derive relevant associations. Such associations include functional attributes (e.g., for cameras: battery life, optical zoom, photo quality [Lee and Bradlow 2011]; for cars: full warranty, roomy, highway mileage, cargo capacity [Netzer et al. 2012]; for Motorola mobile phones: instability, portability, receptivity, compatibility [Tirunillai and Tellis 2014]) and some intangible brand attributes (e.g., for Apple: design, fun, cool [Nam, Joshi, and Kannan 2017]).
Other research has used these data to query for predefined attributes of interest. Such attributes include brand functional attributes (e.g., in UGC on movies: opinion, call for action, actor, storyline [Gelper, Peres, and Eliashberg 2018]) and intangible attributes (e.g., ecofriendliness, luxury, nutrition [Culotta and Cutler 2016] and glamorous, healthy, fun, rugged [Liu, Dzyabura, and Mizik 2020]). Jalali and Papatla (2016) extract color features such as hue, color, and brightness from brand Instagram photos and relate them to click-through rates. Klostermann et al. (2018) combined Instagram images, post text, and tags for McDonald’s. Rather than querying for predefined attributes, they conduct unsupervised clustering on the image labels to extract brand associations. Their article demonstrates the power of unsupervised analysis on visual data: while the UGC text contains associations related to brand functional and intangible attributes, unsupervised analysis of images generates a broad spectrum of associations for the brand, ranging from burger and McCafé to cartoon and urban.
As explained previously, UGC data have several shortcomings: they are available for some brands but not others; they do not enable the researcher to easily select the sample according to the research goals (e.g., those who purchased the brand, those who are in the market for a car); and, finally, they may lack validity, as consumers do not simply respond about their brand perceptions but also strategically signal social and personal cues to their own target audiences.
Our Approach
Our goal in this article is to build on the aforementioned literature to create a platform and conduct a large-scale brand-mapping process that combines the following five benefits: (1) it is fairly robust to strategic posting, (2) it allows for flexibility and control over the sample as needed, (3) it can be applied to any brand, (4) it is able to discover new dimensions of associations from the data, and (5) it should be scalable to any number of brands and respondents. Table 1 describes selected research along these benefits and positions B-VEP’s contribution. Our elicitation task is direct: it asks respondents explicitly for their associations, and thus it is less subject to strategic signaling by consumers and can be applied to any brand and sample. The data collection using online collages is unaided, and the analysis uses unsupervised machine learning to extract a data-driven set of diverse associations that go way beyond functional or intangible attributes. The online data collection and the quantitative analysis make the method scalable to a large number of brands and respondents.
Following the large body of literature demonstrating the power of visuals in extracting deep metaphors and depicting consumers’ attitudes, moods, and associations (Jalali and Papatla 2016; Liu, Dzyabura, and Mizik 2020; Pavlov and Mizik 2019; Reavey 2011; Zaltman and Coulter 1995; Zhang et al. 2017), our method uses data of visual images. However, extant visual methods either were qualitative (Zaltman and Coulter 1995) or used predesigned sets of attributes (Jalali and Papatla 2016; Liu, Dzyabura, and Mizik 2020; Pavlov and Mizik 2019; Zhang et al. 2017). Our elicitation is also among the first (see also Klostermann et al. 2018) to provide unsupervised extraction of associations from visual data.
Brand Visual Elicitation Platform
Our main data-collection tool is a software platform that we developed, on which consumers can create collages for brands. Collage creation is an expressive technique that has been used in psychology (Koll, Von Wallpach, and Kreuzer 2010) and marketing (Zaltman and Coulter 1995; Zaltman and Zaltman 2008). Collage making is an unaided visual elicitation technique that helps uncover hidden associations and emotions that could have remained undetected by other techniques (Davis and Butler-Kisber 1999; Koll, Von Wallpach, and Kreuzer 2010) and therefore is appropriate for eliciting visual brand representation. Although collage making is traditionally a qualitative research method, we develop an online collage-creating platform that can be used for a large number of brands and respondents and analyzed quantitatively.
The Respondent Task
The collage-making procedure was conducted as follows: a respondent was shown several instruction screens explaining how to create the collage. Then, they were assigned a brand and asked to think, “What are your emotions, associations, and expectations with respect to the brand? What does the brand mean to you? Recall your experiences with the brand. What are the colors associated with the brand? What shapes? What objects? What images?” Next, the respondent was taken to the collage-making screen. Figure 2 provides a screenshot of the screen on which the collages were created. 1 The screen is divided into two sections: The left-hand side is the “canvas” on which the respondent creates the collage (in Figure 2, the brand is Starbucks), and the right-hand side contains a large repository of photos for the respondent to choose from. Respondents could drag photos from the right- to the left-hand side to create the collage onto the canvas. They could move, resize, and rotate the images once they had dropped them on the canvas. Respondents were able to either scroll through photos randomly or search for keywords and retrieve photos relevant to that keyword. For example, in the screenshot in Figure 2, the user searched for the keyword “laptop.”
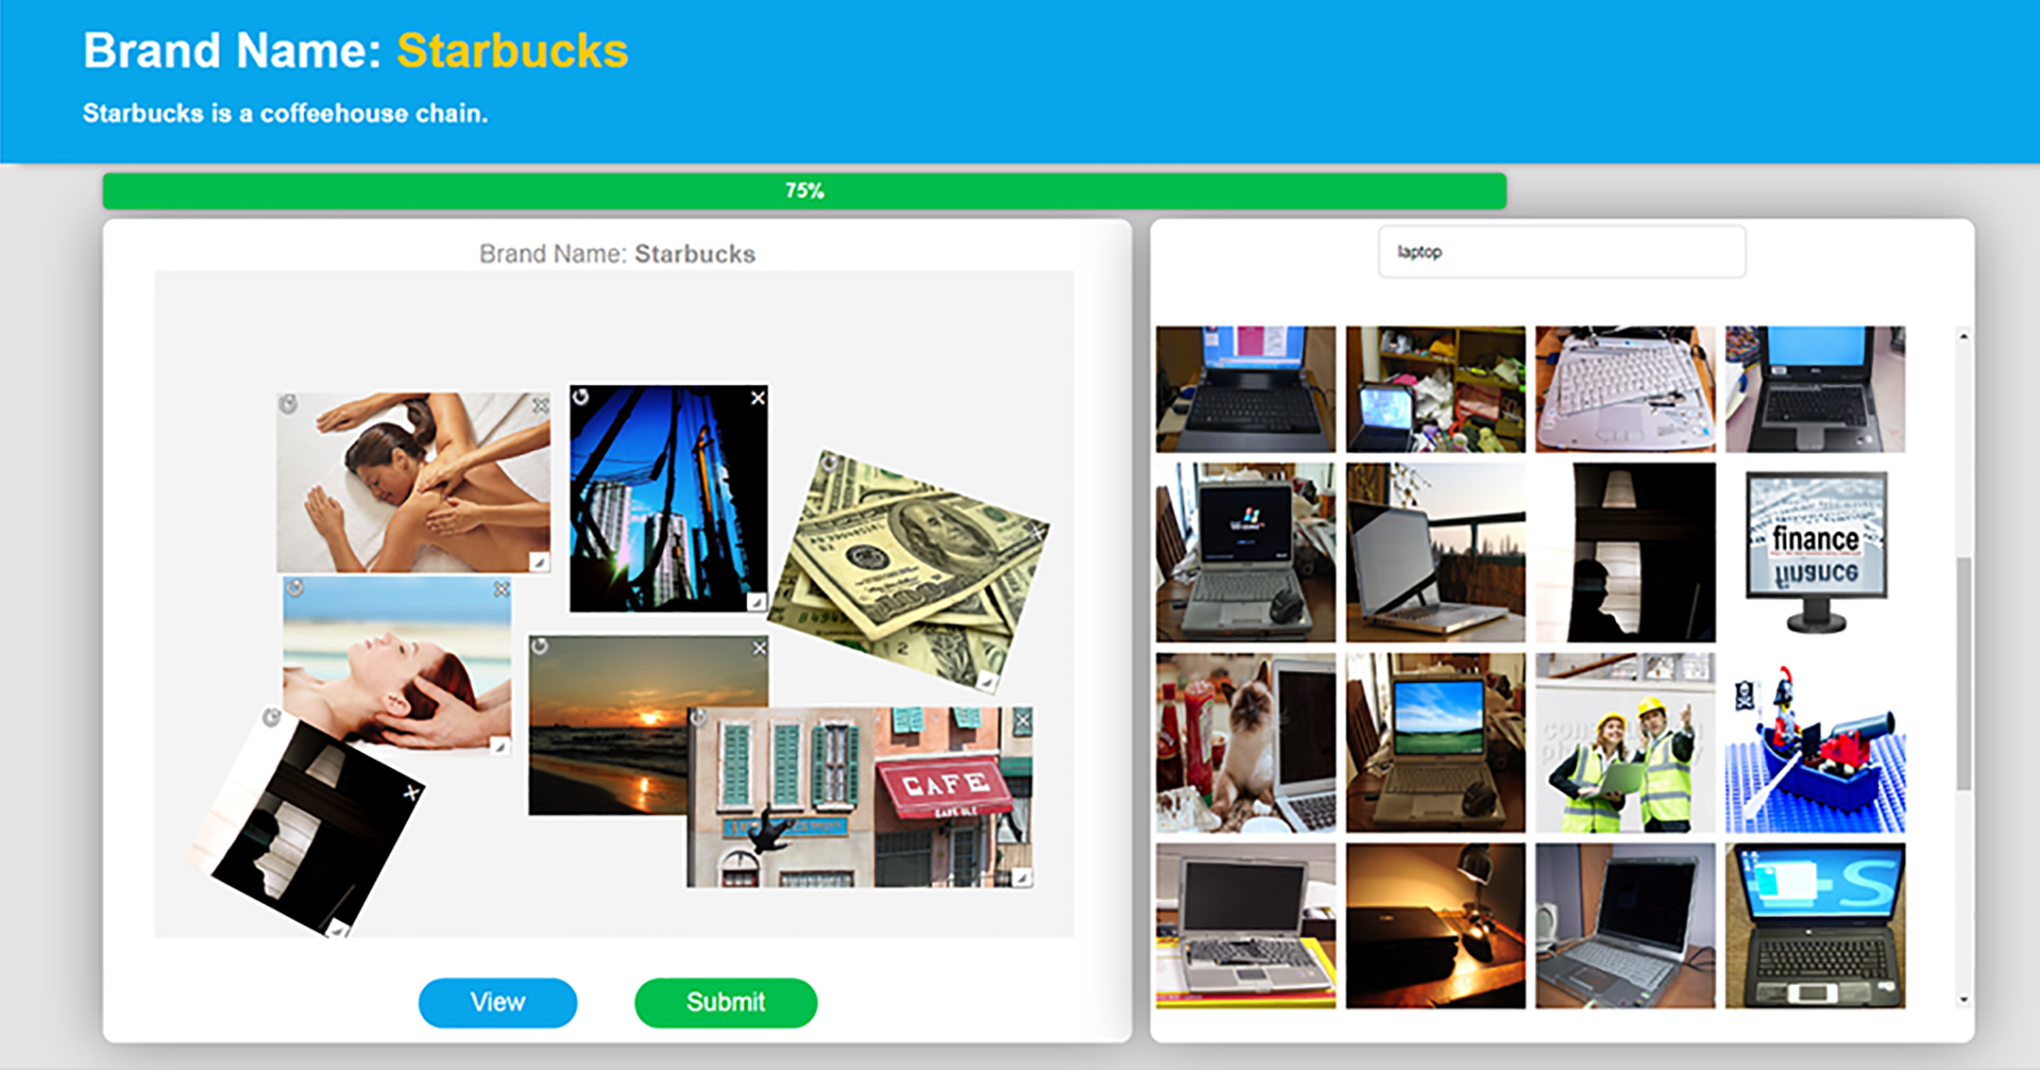
The collage canvas.
The Photo Repository
The photo repository is a key element in the platform. First, it should be large and diverse enough for respondents not to feel constrained by the images and to be able to accurately convey their perception of the brand with the available images. Second, the images should prompt the respondents to think about the entire spectrum of associations, beyond the product-related attributes or the obvious brand elements, so that a collage for Levi’s, for example, will not simply be a collection of photographs of jeans or the Levi’s logo.
With these goals in mind, we created the photo repository and designed the right-hand side of the screen. We began by downloading a large set of photographs from Flickr, a photo-sharing website that allows users to label the photographs that they upload or view. To make the repository as rich as possible, and to ensure that participants could find photographs that represented what they were trying to communicate, we queried Flickr’s application programming interface for the top 4,000 nouns, verbs, and adjectives in English and downloaded the first 50 photo results for each. The resulting image database consists of ∼100,000 unique photos (many photos have multiple labels).
We also embedded a search feature on the platform that returns photos, in randomized order, that have the labels of the queried term on Flickr. For example, in Figure 2, the user searched for “laptop.” The ability to retrieve photos by search terms helped respondents tailor the collage to better represent their brand perception. As each search term retrieved many photos (e.g., 46 photos labeled with “laptop,” 318 labeled with “family,” 3,621 labeled with “nature”), the search option did not limit the users but rather was used as an initial aid in browsing through the repository. We wanted to ensure that the collage represented the respondent’s perception of the brand beyond simply the product category and the company’s own marketing efforts. We also wanted to encourage respondents to retrieve personal and meaningful associations. To that end, we constrained the terms for which respondents could search. The system does not allow them to search for the brand itself, the category, or the product type. If they did, they saw an error message, saying the term was not allowed as a search term for this brand. For example, when creating a collage for Levi’s, the user would not have been able to search for “Levi’s,” “clothing,” “apparel,” or “jeans.” Research assistants manually generated the list of these “banned” keywords for each brand.
Ensuring Collage Quality
Each respondent was assigned elicitation tasks for three brands sequentially. To ensure that respondents created collages only for brands with which they were familiar, respondents first had to rate their familiarity with ten brands on a five-point scale (1 = “not at all familiar,” and 5 = “very familiar”). Three focal brands were selected randomly from those that the respondent rated as a 4 or 5. If a respondent was not familiar with any of the brands, another set of ten brands was presented, and if, after three sets of ten brands, no brand was scored a 4 or 5 on familiarity, the survey terminated for that respondent.
Respondents were encouraged to spend as much time as needed to create a thoughtful collage. If a respondent submitted a collage after less than two minutes, or if the collage contained fewer than six photographs, a pop-up screen appeared asking them if they were sure they wanted to submit. After submitting the collage, respondents were asked to score the task’s level of difficulty on a five-point scale, with 5 being very difficult. To ensure that respondents understood the task, respondents were also asked to briefly describe the collage and explain their choice of images. Finally, research assistants checked each collage manually 2 and removed the data if the participant did not appear to have invested sufficient effort in the collage. The criteria for deletion were to delete collages that took less than one minute to make, that used only one or two photos, and for which the responses for the brand characteristics were identical for all items (e.g., respondent rated the brand only 1 or only 5 on all 49 items). In total, 17% of the collages were removed.
Designing the software platform was a major undertaking. Its user-friendliness and clarity were essential to engaging respondents and obtaining high-quality collages. The user interface was designed following design best practices (Johnson 2013), using professional web designers. All screen, instruction, and error messages were extensively tested for comprehensibility by an internal team of 10 users and an external beta test team of 50 Amazon Mechanical Turk (MTurk) users.
Data
Respondents for the task were recruited on MTurk and received $2.50 for completing the entire task. Although our sample was not created to be demographically representative, it is quite balanced, skewed toward younger adults. In total, all of our respondents were U.S. residents, 43.5% were male (56.5% female), 26% were 18–29 years old, 41% were 30–39 years old (the age group 18–39 forms 36.5% of the U.S. population), and 33% were 40–69 years old (this age group forms 54% of the U.S. population). Note that we used MTurk as a proof of concept and a means to recruit a large number of respondents from the general population. If needed, a firm could use a more representative sample of respondents. Each respondent completed the task for up to three brands, or 30 minutes, whichever came first. That is, if the respondent was only finished with their first or second brand after 30 minutes, they were taken to the final screen, which thanked them for participating and terminated the study. The time limit helped us avoid fatigued respondents.
Brand Collages
We collected 4,743 collages from 1,851 respondents (3,937 were approved by the research assistants). The data include an average of 15.6 collages per brand, for 303 national U.S. brands from nine categories: beauty (40 brands), beverages (65 brands), cars (29 brands), clothing (23 brands), department stores (17 brands), food and dining (84 brands), health products and services (10 brands), home design and decoration (16 brands), and household cleaning products (19 brands). The brand list is an updated version of Lovett et al. (2013), excluding TV shows, video games, movies, and since-discontinued brands. Web Appendix A presents the full list of brands. The average collage took eight minutes to create and included 11.45 photos. The average reported level of difficulty of creating the collages was 2.5 (on a 1–5 scale).
Mostly, respondents used mixed methods of browsing through the photo repository and searching for specific terms. The search feature was not always used: 690 collages (17.5% of the approved collages) did not use it at all. The median number of search terms used in a collage was 5, and the average was 6.4. In addition, respondents did not make many attempts to use the “banned” words: of the 25,262 search terms used, only 1,111 (<5%) attempts were made to use the “banned” words. To further verify that the search function did not restrict or bias the collages, we compared, for each brand, the associations derived from the brand’s collages that used an above-median number of search words with collages in which the number of search words used was below median. We found that this specific split was not significantly different from any random split of collages (for details, see the Appendix).
Figure 3 presents a sample of four collages for the brand Starbucks, from four different respondents, along with the verbal description. The collages contain rich, meaningful information about the brands’ associations: they do not simply show people drinking coffee or images related to Starbucks’ brand elements. At first glance, these collages appear to be very different from each other, without obvious commonality. However, as we show next, they share specific visual elements that create a distinctive set of associations that is unique to Starbucks and differentiates it from the other brands in the sample as well as from brands in its category. Next, we discuss how associations are extracted.

Examples and verbal descriptions of four collages for Starbucks, made by four different respondents.
Brand Characteristics
In addition to the collage, we collected data on respondents’ perceptions of the brands on well-established brand metrics. After completing each collage, respondents rated the brand on each of 49 items on a five-point scale. The set of items is the combination of Aaker’s (1997) personality dimensions and BAV brand equity items (Lovett et al. 2014). The items were presented in a randomized order. We consulted with a BAV team to operationalize the survey as closely as possible to how they operationalize theirs. A major difference is that BAV’s survey is conducted on a representative sample, whereas our sample, as explained previously, is not truly representative. The correlation between the average brand score on each BAV item in our survey and the scores that we received from BAV 2016–2017 data for these brands is .58 (p < .05). This correlation is high, given that the survey was conducted in a different format, included additional items, surveyed a different population (e.g., those who indicated high familiarity with the brand), and was done a year later.
Extracting Associations from the Collage Data
The collage-creation task generated a set of collages for each brand. Our goal was to extract and summarize interpretable associations from the collages and organize them into a single, unified space on which all brands can be mapped and analyzed. To do so, we use image-tagging to extract the visual elements of the collages and identify patterns among tags in brand collages.
Feature Extraction: Image Tagging
In many image-processing applications (e.g., Liu, Dzyabura, and Mizik 2020), the goal is to solve an image-classification problem. The visual features extracted from images do not have to be interpretable and typically include low-level features such as edges, corners, color histograms, shapes, line directions, and texture, or even more abstract deep-learned features. Our goal in this article is different from previous applications: we do not use the visual elements as an intermediate stage in solving a prediction problem. Rather, we look for what associations set one brand’s collages apart from others, thus creating mapping from visuals to brands and brand characteristics. Therefore, we are interested in extracting and summarizing interpretable features. For this reason, we turn to image tagging.
We used a commercially available image tagging tool called Clarifai (Rangel et al. 2016), which is pretrained on a corpus of millions of photos and uses deep convolutional neural networks to classify the content of photos into over 11,000 semantic tags (labels) relating to the objects, scenery, actions, emotions, adjectives, and other visual elements (Howard 2013). Clarifai offers several options for pretrained models, of which we used “general 1.3.” Each photo is assigned the 20 tags with the highest confidence scores. For example, the photo at the bottom left of the bottom-right collage for Starbucks in Figure 3, showing men in a running competition, is tagged with athlete, competition, race, runner, marathon, track and field, jogger, running, athletics, fitness, action, energy, exercise, footrace, hurry, endurance, motion, effort, jog, man, and sport. The 4,743 collages in our data set contain 91,856 photos, yielding 5,426 unique tags (the approved 3,937 collages had 4,601 unique tags). We next extract the associations in each collage and compare the associations across brands and individuals.
Extracting Associations from Collage Tags
We analyzed the tags using a topic modeling approach called guided latent Dirichlet allocation (LDA), a semisupervised variation of the popular unsupervised topic-modeling algorithm, LDA (Jagarlamudi, Daume, and Udupa 2012). LDA is a widely used text-mining approach that discovers topics in documents (e.g., research articles, books, news articles). Each topic is a sparse Dirichlet probability distribution over all of the words in the vocabulary, and each document has a probability distribution over all topics. The model is estimated using an iterative Bayesian approach, with one parameter being updated in each iteration. Typically, this procedure is initialized with a uniform distribution, with all words being equally likely to occur in all topics.
We treat each collage as an individual document and a tag as a word. On average, each collage contains 11–12 photos with 20 tags each, resulting in a very short document for training the LDA. We avoided aggregating collages of a single brand into one document, as we wanted to extract associations at a collage level to be able to relate the associations to individual brand perceptions. To overcome the challenge of the short documents, we used guided LDA. The guided LDA method changes the priors of certain words to increase the probability that they have a high weight in one topic. For example, one might seed the words “girl,” “boy,” and “child” toward being included in topic 1. As we show subsequently, we chose the priors using a method that groups words according to their linguistic similarity. This enabled us to incorporate knowledge of word meanings, which LDA alone does not take into account.
Generating the seeds
We obtained the sets of seed words for the guided LDA by computing a word embedding for each tag and clustering the tags in the embedded space. We used Stanford’s Global Vectors tool (GloVe), an unsupervised algorithm pretrained on over 6 billion text tokens from Wikipedia and the linguistic data from English GigaWord, 5th edition. During the training phase, the algorithm uses global matrix factorization methods, in combination with local context window methods, to create a 300-vector dimensional space (Pennington, Socher, and Manning 2014). The algorithm takes into consideration factors such as word-to-word co-occurrence, context similarities, and word analogies. We used this 300-dimensional space provided by GloVe as input to our analysis and represented each tag in our data set as a point in this space. As is common in text mining, we removed the most and least frequently occurring tags. Specifically, we removed tags occurring fewer than 10 and more than 2,000 times in the corpus, resulting in a total vocabulary of 2,596 unique tags (out of the original 4,601).
We then clustered the resulting vectors using a k-means clustering algorithm (Scikit-learn machine learning Python package). The role of the clustering step is to generate seeds for the guided LDA. We did not require a full clustering of the vocabulary; rather, we wanted to identify groups of only very similar words. Words that do not have linguistically similar neighbors do not need to be included. Therefore, we began with a large number of 465 clusters (10% of the vocabulary). Naturally, this resulted in many spurious clusters. We removed clusters that occurred in fewer than 50 collages and fewer than 6 tags, leaving us with 120 word clusters to use as the priors (presented in Web Appendix B). In this procedure, we balanced the need to obtain meaningful seeds on the one hand without allowing the seeds to dominate the collage data. 3
Applying the guided LDA
The guided LDA process can be described as the following generative model: in regular LDA (Blei, Ng, and Jordan 2003), for a vocabulary
In guided LDA, a topic is a mixture of two multinomial distributions: a “seed-topic” distribution Input: For each topic Draw regular-topic Draw seed-topic For each collage
For each Draw a topic Draw an indicator If If
For our analysis, we used the implementation of this process of the Python library guidedlda2.0.0.dev22.
The guided LDA provides two outputs: (1) a set of topics, each topic being a distribution over tags, and (2) the distribution over topics for each collage. The main parameter to be set by the researcher is the total number of topics
Naming topics to create associations
We named each of the 150 topics manually, using three research assistants, all English literature majors, based on the tags with the highest probability of the topic, to ensure that topic names were meaningful. These 150 topics form a rich set of brand associations, including objects (e.g., animals, food, people), constructs (e.g., abstract art, horror, contemporary, delicious, famous, fantasy, illness), occupations (e.g., musician, bodybuilding, baking), nature (e.g., beach, misty, snowscape, wildlife), and institutions (e.g., corporate, army, investment, school). In Keller’s (1993) terminology, these associations represent product-related attributes (e.g., alcoholic drinks); non-product-related attributes (e.g., baby, holiday party); functional, experiential, and symbolic benefits (e.g., fitness, cityscape, pop star); and attitudes (e.g., American flag).
Web Appendix C contains the distribution of tags in the association topics, as well as the topic names. For example, the aeronautics association topic has the tags air, flight, airplane, aircraft, flying, military, and jet, with probabilities 7.7%, 7.4%, 6.3%, 6.3%, 5.1%, 4.8%, and 3.9%, respectively. The cityscape topic has downtown, cityscape, skyline, skyscraper, modern, office, tower, and bridge tags, with probabilities 9.4%, 9.4%, 7.9%, 7.4%, 7.4%, 5.3%, 5.0%, and 4.4%, respectively. The running topic is composed of athlete, runner, race, action energy exercise, fitness, marathon, and jogger tags, with probabilities 7.8%, 6.4%, 5.9%, 5.8%, 5.7%, 5.7%, 5.0%, and 4.5%, respectively. These 150 association topics (“associations” hereinafter) constitute the set of dimensions on which we will map the brands. Note that the dimensions may change for a different set of brands.
Validation
To validate the results of the association extraction, we ran an additional study as follows. Participants were given a set of associations extracted from a collage, and two different collages to choose from, where only one is the correct collage (from which the presented associations were extracted). They were asked to indicate which of the two collages best matches the presented set of associations. Participants were recruited on MTurk and paid $1. A total of 46 participants completed the study, each completing 20 tasks, giving us a total of 920 choices. Of these, 784, or 85.2% were correct, which validates the association extraction algorithm. 5
Concluding remarks
Note that our association extraction methodology combines two state-of-the-art text-mining methods in a novel way and is a unique contribution of this research. Recall that extracting associations from collages is a challenging problem, especially when allowing for a large number of topics, and off-the-shelf tools are not able to extract good associations. Although topic models such as LDA work well on long documents, such as books or articles, we only have about 200 image tags per collage. Moreover, the LDA model does not take into account the meanings of words but rather the co-occurrence of words in documents. Clustering word embeddings, in contrast, does not take into account the co-occurrence of tags in one collage. Using the word-embedding clusters to seed the guided LDA enables us to extract the most appropriate associations that take into account both types of information.
Indeed, the clustering alone (without the LDA) does not result in good associations. First, as with any clustering algorithm, it allows each tag to belong to only one association. However, a word can be a part of multiple associations. For example, “flowers” can belong to a romantic or wedding association, as well as a nature association. Clearly, a brand associated with nature differs from one associated with wedding. In LDA, each topic is a probability distribution over all the words in the vocabulary; therefore, each word is included in all the topics, with different weights. Second, embeddings are based on linguistic similarity, which does not necessarily mean that they are a part of the same association. For example, one of our resulting clusters (see Web Appendix B) included humor, creepy, amusing, affectionate, and erotic, which are all emotions occurring in similar contexts in ordinary texts but have different implications for branding. Third, clustered word embeddings do not use the fact that tags appear in the same collages (for example, “humor” and “erotic” are not together in the same collages). The LDA step provides that.
Results: Brand Associations
For each brand, we averaged the association distribution extracted from the brand’s collages. Guided LDA outputs the probability of each of the 150 topics occurring in each collage. Let
The Top Five Most Frequently Occurring Associations for Beauty Brands (in Decreasing Order of Probabilities).

Consider, for example, the shampoo brands Garnier Fructis and Pantene. Both are associated with romantic flowers; Garnier Fructis has stronger associations for fruits and fashion, while Pantene is more strongly associated with hairstyling and bathroom. Of the beer brands (Web Appendix D), Budweiser is associated with ball sports, fire, water, auto racing, and youth and Corona with beach, ocean, breakfast, lingerie, and pool. Recall that each of these associations represents a large number (see Web Appendix C) of objects, concepts, emotions, and activities. The associations relate to the brand’s product attributes; usage; users; functional, symbolic, and experiential benefits; and attitudes toward the brand. The association weights enable us to measure the strength of each association for a given brand. As we show in the “Applications for Brand Management” section, the association weights also allow for the calculation of brand uniqueness, relative positioning, favorability, and relationships with other brand metrics.
To validate the brand–association relationship, we ran an additional validation study that follows a similar format to the study used for collage validation. Participants were given a set of associations for a brand and two different brands to choose from, one of which is the correct brand (for which the presented associations were extracted). They were asked to indicate which of the two brands best matches the presented set of associations. Participants were recruited on MTurk and paid $1. A total of 91 participants completed the study, giving us 1,707 choices. Of these, 1,280, or 75% were correct, which validates the brand association relationship. 6
We assessed split-half reliability (similar to John et al. [2006]) to determine the consistency of the elicited brand associations across respondents. We randomly divided the collages of each brand in half and calculated the average topic weights for all 150 topics. That is, each brand had two 150-dimensional topic distribution vectors, one for each split. We then computed the correlation across these two vectors. For 222 out of the 303 brands, the correlations are positive and significant at p < .05. The remaining correlations are not statistically significant. This is a high number given that the brands have only 7–10 collages in each half-split (the original sample size of 15 per brand was optimized to balance costs and stability of associations).
Table 2 indicates that associations such as flowers, water, and hairstyling are particularly prevalent in the beauty category. Table 3 presents category averages (i.e., the five most frequently occurring associations in each category) and their average probability of occurring in a collage. The results have face validity in that most of the high-probability associations are closely related to the category (e.g., “traffic” for cars, “furniture” for home design and decoration).
The Top Five Most Frequently Occurring Associations for Each Category with Their Category Averages (in Decreasing Order of Probabilities).

Comparing the Content of Collages to Verbal Free-Elicitation Descriptions
To demonstrate the richness of associations elicited via images relative to those elicited via text, we created an elicitation tool 7 that is identical to B-VEP, except that instead of creating a collage, participants write a free-text paragraph describing their associations with the focal brand. The task is an online large-scale version of free elicitation described by Steenkamp and Van Trijp (1997).
Similar to the B-VEP task, participants were paid $2.50 for completing three brand descriptions. To ensure the quality of these text responses and to make our comparison as conservative as possible, we asked participants to write their own original text (not copy from the internet) and disabled the paste option on the page. Research assistants manually evaluated all responses and rejected those that were copied (by searching for the exact text). We collected these descriptions for the 40 brands in the beauty category, 5–7 descriptions per brand, for a total of 235 descriptions by 85 participants.
The key takeaway is that it is hard to obtain brand associations in this format. First, many participants found it difficult to write detailed descriptions. A typical description was 50–60 words (3–5 sentences). Second, the associations derived from this task are very similar to product reviews. Despite our clear instructions to “recall experiences” and describe the “objects, feelings, actions and images” associated with the brand, which successfully generated rich and diverse visual collages, in the textual setting, respondents tended to review the brand. Therefore, the descriptions are not distinctive and do not yield terms that are unique to the brand.
Specifically, participants focused on product/brand evaluation (e.g., “I like the smell,” “brand that I can trust and rely upon”), product usage (e.g., “Nivea is a company that I use quite often,” “I am regularly using this brand [Pantene]”), target audience (e.g., “Revlon makes beauty products for older people”), and functional attributes (e.g., “Garnier products are environmentally friendly”).
Table 4, Panel A, presents the ten most frequently occurring terms for the three brands in Figure 1 (Axe, Degree, and Secret). The most frequent terms for all 40 brands appear in Web Appendix E. For Axe, the words “use” and “used” pertain to usage; “good,” “love” (as in “I love its smell”), and “favorite” pertain to evaluation; and “body” (as in “body spray”) is a functional attribute. For Degree and Secret, the words “frequently” and “using” pertain to product usage; “enjoys,” “good,” and “famous” (as in “famous brand”) pertain to evaluation; and “women” is the target audience. A TFIDF analysis reveals that the most salient differences in verbal descriptions between brands are the brand name and product type.
Top Ten Most Frequently Occurring Words in Verbal Descriptions.

We also computed the most frequently occurring bigrams, or two-word sequences, in all of the text descriptions combined. The top five most frequent bigrams are “skin care,” “good product,” “good quality,” “toilet paper,” and “product used.” This bigram analysis further demonstrates the focus of these descriptions on product quality and usage, much like a product review. While this is certainly valuable information, it is less relevant for brand association research.
These findings are consistent with the literature on brand associations: Table 1 indicates that most text-based elicitation methods (e.g., Nam, Joshi, and Kannan 2017; Netzer et al. 2012) extract information on the brands’ functional attributes and brand evaluation. In contrast, the associations generated by unaided visual methods (Klostermann et al. 2018; Zaltman and Coulter 1995) contain a broad range of objects, emotions, activities, sceneries, and concepts.
We also analyzed the verbal descriptions of the collages provided by B-VEP participants after completing their collage task. In B-VEP, after completing the collage, participants were asked to “describe how your collage relates to brand X.” The sequence of completing a collage and then explaining it verbally was similar to the ZMET process. Table 4, Panel B, presents the top ten most frequently occurring terms in the collage verbal descriptions for the same three deodorant brands. The terms for all the brands are presented in Web Appendix E. Although some words relate to evaluation (e.g., “good,” “like”) and usage (e.g., “use”), there are also words such as “confident,” “happy,” “strong,” and “cool,” which relate more to brand associations and intangible attributes. While this is far from substituting for a direct analysis of the visual content of the collages, the mere fact that respondents wrote the verbal description after creating a collage results in more relevant associations than does the free-elicitation verbal task.
The Role of Search Terms in Collage Creation
Recall that in B-VEP, participants select the images for their collages from a large photo repository (right-hand side of Figure 2). To aid in browsing, we implemented the option to search for keywords. Participants were not requested to use the search option; it was implemented as an aid to help users navigate through this very large repository. One might wonder if the search terms are the associations themselves: when respondents create their collage, they may search for their association, such as “flowers,” to find corresponding pictures. However, as we show next and in the Appendix, the association elicitation process is more intricate, and constraining the analysis to the search terms generates only a small fraction of the association space.
First, search terms are not used in every collage: 17.5% of collages did not use the keyword search at all; their creators simply scrolled through the photo repository (in random order). The median number of search terms (e.g., “pine tree”), used in a collage is 5, and the average number of key terms used per collage is 6.4, which is low compared with the 11.45 photos and 229 extracted tags per collage on average. Second, the keywords used in the search are limited and repetitive. The top 30 words (.5% of total unique words) account for 17% of total searches. This limits the search words’ ability to provide unique associations. Third, each search retrieves a large number of photos. For example, “family” retrieves 318 photos, “nature” retrieves 3,621 photos, “child” retrieves 629 photos, and “happy” retrieves 210 photos. The chosen photo contains additional information about the respondent’s relationship with the brand, over and above the search term. Using only the search terms ignores this additional information, which, as our collage analysis shows, contains meaningful, distinctive associations. For more details on the search words analysis, see the Appendix.
We also tested whether the search terms provide additional information that is not contained in the collage itself. In line with the pooling approach suggested by Klostermann et al. (2018), we appended the search words to the Clarifai image tags as an input to the LDA algorithm. The resulting distribution of topics does not change relative to having the image tags only.
Applications for Brand Management
B-VEP can be used to support both the creative function and the strategic function of the brand management team. For the creative function, we demonstrate how to create a prototypical collage, or a mood board, for each brand—that is, a collection of photos that together capture the average distribution of associations and provide a visual representation of the brand. This is done by indexing a photo repository and computing, for each set of photos, how closely it resembles the association distribution of the brand. We also use B-VEP to match brand commonly used brand metrics—brand personality (Aaker 1997) and brand equity (Mizik and Jacobson 2008)—with brand association (e.g., the personality trait “charming” is positively associated with the visuals of hand, wedding, painting, eye, and beauty salon). The creative personnel could use this matching for choosing associations that execute the brand’s desired positioning.
For the strategic function of brand management, insights from B-VEP are useful in assessing brand health, positioning relative to other brands, and collaboration opportunities. We measured the relationship between the associations and brand favorability and found that the corresponding associations differ by category (e.g., favorable associations for cars differ from those for beverages). We also measured brand uniqueness: for each brand, we tested how its set of associations differs from those of other brands in its category. Finally, we use similarity and distance in the association space to detect potentially valuable commonalities between brands, which could prove useful for potential collaborations.
Photo Indexing and a Brand’s Prototypical Collage
Our method can be used to index repositories of images as per their fit with the association set of a brand. Such indexing can have various applications. For example, it can help brand managers and graphic designers search for images that reflect the current set of a brand’s associations and create mood boards, or prototypical collages for brands, by visually displaying their associations.
First, we used guided LDA to calculate the distribution of associations of all of the images in our photo repository. Then, we chose for each brand the set of ten photos (not contained in any of the original brand collages) that together generate the highest similarity to the brand associations vector. To reduce computational complexity, we used a greedy algorithm that adds photos to the set one at a time to move the collective topic distribution maximally toward the desired distribution. We measured cosine similarity between the normalized 150-dimensional topic vectors of the photos and the brand. The average similarity between the brand association vector and the representative collage is .899, indicating that the collages are prototypical. 8 Figure 4 presents the prototypical collages for the three deodorant brands Axe, Degree, and Secret. Note that we could have chosen photos from other photo repositories or created collages containing more or fewer than ten photos.
Prototypical collages for Axe, Degree, and Secret, based on cosine similarity between the brand association distribution and the photos in the photo repository.
Brand Associations and Brand Personality and Equity Characteristics
We explore the relationship of the brand associations extracted from the collages with the frequently used brand characteristics: Aaker’s brand personality characteristics (Aaker 1997) and Young & Rubicam’s BAV equity characteristics (Lovett et al. 2014). Understanding the relationships between specific brand associations with brand dimensions of personality and equity can assist brand managers in cultivating and using the visual representation that will support the brand’s desired personality and equity characteristics. For example, what brand associations should a manager develop to make the brand more down-to-earth?
Recall that each respondent, after completing the collage for a brand, was asked to score the brand on the items of the brand personality and brand equity characteristics. Altogether, the respondents rated the brand on 49 characteristics, a combined set of the Aaker brand personality traits and the BAV brand equity pillars. To measure relationships between these characteristics and our identified brand associations, we regressed these ratings on the corresponding collage’s distribution of topics (associations).
Specifically, let

The resulting coefficients
Figures 5 and 6 present the significant associations with the five most positive coefficients and the five with the most negative coefficients, for each of the items used to construct the “sophistication” and “ruggedness” factors of brand personality characteristics (Figure 5) and the “differentiation” equity pillar (Figure 6). Web Appendix F presents the full results. For example, the personality trait “glamorous” (part of the “upper-class” facet in the “sophistication” personality factor of Aaker’s [1997] scheme) is associated with wedding, eye, fashion, and glamour. It is not associated with heavy vehicles, construction, and patriotism (for the complete associations, see Web Appendix D), meaning that brands that are rated high on “glamorous” contain fewer of these visuals in their collages. The personality trait “rugged” (which is part of the “ruggedness” factor in Aaker’s scheme) is positively associated with the associations of heavy vehicle, military, bicycle, industry, and desert and not associated with therapy, church, candy, arts and crafts, and sparkling (for the complete tags related to each association, see Web Appendix C). The equity characteristic “innovative,” which is part of the “differentiation” BAV equity pillar, is correlated with high frequency of associations such as hand, religion, painting, cityscape, and light and negatively correlated with patriotism, chest, ruin, symbol, and cowboy, meaning that brands that score high on “innovative” will contain fewer visuals of these associations in their collages.

The associations with strongest positive and negative coefficients relating to the personality characteristics of “sophistication” and “ruggedness.”

The associations with the strongest positive and negative coefficients associated with the “differentiation” brand equity pillar.
The results presented in Figures 5 and 6 and Web Appendix F demonstrate that brand personality and equity traits systematically relate to particular associations. Mapping brands in this very rich, unstructured space of visual content reveals that the meaning of certain visual content is systematically related to established brand measures.
Brand Favorability
Next, we identify desirable and undesirable associations in each category. Recall that after submitting each brand collage, the respondent was asked a series of questions about the brand. One of the survey items was to rate the brand on being “high quality,” with 1 being the lowest quality and 5 being the highest. We regressed this rating on the associations extracted from the collage. One collage is a data point, and we ran the regressions on collages separately for each category. Web Appendix G presents the results.
For example, for cars, the associations alcoholic drink, cityscapes, house, fashion, and suit have positive and significant coefficients—that is, they occur more frequently in collages for which the respondent rates the brand as higher quality. As presented in Web Appendix D, car brands whose collages include alcoholic drinks as one of their top associations are the luxury brands—Audi, Lamborghini, Porsche, and Mercedes Benz—and their collages contain images of mansions, Riviera vacations, and expensive alcohol. The associations music festival, healthy cooking, breakfast, rain, dance, and ruin have negative coefficients. Interestingly, while certain associations, such as ruin, have either a negative or nonsignificant coefficient for all categories, some associations have opposite signs in some categories. For example, while breakfast and healthy cooking are negative for cars, both are positive in food and dining. Negative associations for food and dining include pollution, traffic, industry, vehicle, finance, computer, and ruin. The beach association is positive for food and dining but negative for beverages. The house association is positive for cars but negative for beverages.
Because the “high-quality” characteristic is vertical (i.e., one on which all brands would want to be rated highly), we conducted this analysis at the category level. Indeed, one would expect positive and negative associations to be specific to a product category. Next, we examine more horizontal brand characteristics (i.e., those that some brands want to have, and others do not). For example, while some brands want to be perceived as “sincere” and “down-to-earth,” others may aim to be perceived as “glamorous” or “sophisticated.”
Brand Uniqueness
To determine how a brand stands out from others in its category, we tested whether an association occurs with a significantly higher/lower probability in collages for the focal brand than for other brands in the same category. We chose to compare the brand with its category, rather than simply with all other brands in the set, to remove category-level averages. For example, beauty brands have on average more flowers, water, hairstyling, and glamour associations than car brands. Specifically, we performed a Mann–Whitney test to compare
Beauty Brands: Associations with Significantly Higher/Lower Probability Relative to Other Brands in Its Category, Ordered from Most to Least Unique.

The left-hand columns of Table 5 (“Most Associated With”) contain the five associations that occur significantly more frequently in the collages for the brand, whereas the right-hand set of columns (“Least Associated With”) contain the five associations that occur significantly less frequently for this brand relative to other brands in the category. We see that some brands are prototypical of their categories, while others stand out. For example, Dasani and Diet Pepsi are not much differentiated from the beverages category (at p < .05), while Jamba Juice has more distinctive associations.
Relative to the average beauty brand, the deodorant brand Axe is more associated with urban youth, bodybuilding, band, ball sports, and suit, meaning that these associations appear in its collages significantly more frequently than they do in the average beauty brand. The romantic flowers association has a strong presence in the category; although it exists in Axe’s associations (Table 2), it does not differentiate Axe from the category. In the cars category, while most cars are associated with traffic, cityscape, and steel (see Table 3), Ferrari has, relative to other car brands, strong associations with aeronautics, delicate fabrics, and lingerie and less strong associations with industry, school, and church than the average car brand (see Web Appendix H). Jeep, positioned as an outdoorsy brand, has significantly lower weights, in the association distribution vector of its collages, of cityscape and modern building than the average car brand.
Note that the usage and interpretation of these results should be done with caution. The large number of tests is subject to multiple comparisons concerns. A brand manager who runs 150 tests at the p < .05 level would expect to find 7–8 spurious effects when running such an analysis.
Detecting Commonalities Between Brands
Our association elicitation method enables measuring the similarity of associations between brands. We calculated the cosine similarity between the normalized (sum of squares is equal to 1) association distribution vectors of all of the brand pairs in our sample. Cosine similarity is a way to compare two vectors by calculating the angle that they create. The number ranges from 0 to 1, where 1 indicates identical vectors. Web Appendix I describes the similarity matrix, a symmetric 303 × 303 matrix, whose elements take values between 0 and 1, with higher values corresponding to more similar brands and diagonal elements equal to 1. We see, for example, that the associations of Cheesecake Factory are highly similar to the baking appliances brand KitchenAid (cosine similarity of .84): they share common associations (baking, dining, candle, family). The family dining chain Golden Corral is very similar in its associations to the supermarket convenience food brand Hormel (cosine similarity of .91). Barnes and Noble has similar associations to the pain drug brand Aleve (cosine similarity of .7, sharing the associations of school and bedroom). Febreze has a .7 cosine similarity to Ashley Furniture. These similarities can be an indication for potential brand alliance, cross-category perceptual maps, and positioning inquiries.
Discussion
In this article, we propose and implement a novel brand-association-elicitation tool (which we term B-VEP). The elicitation task enables participants to portray their relationships with brands through a collage of photographs. Visual images have the advantage of better reflecting the emotions, cultural experiences, and attitudes that constitute consumer associations, as opposed to verbal methods that focus more on the discourse of these experiences (Reavey 2011). Use of images has been demonstrated to successfully disrupt well-rehearsed narratives, revealing hidden, unarticulated ideas. The analysis uses unsupervised machine learning methods to avoid “strangling” the data: rather than looking for specific predefined associations, we let the data speak and identify associations using topic modeling. The resulting set of associations is rich and spans a variety of objects, occupations, natural elements, constructs, and institutions, to name just a few.
Using this tool, we gathered a large set of consumer brand perceptions on 303 brands. We applied it to explore several important challenges for brand management: creating mood boards for each brand, consisting of a collection of photographs that capture the distribution of consumers’ associations with the brand; testing which associations are related to commonly used brand metrics such as brand personality and brand equity; identifying favorable and unfavorable associations for each category; finding unique associations, in which the brand differs from others in its product category; and, finally, measuring association-based similarities between brands from different categories, which may identify potential for brand alliances or strategic partnerships.
We see these applications as just scratching the surface of the potential of using visual elicitation. We hope that future research will build on this work in other directions. One future direction might be identifying brand extension strategies. Starbucks’s top associations include baking and dining (see Web Appendix D). While Starbucks does offer baked goods and food, this association might imply a need for more dining choices. Interestingly, Dunkin Donuts, which by definition offers baked goods, has much weaker association with baking and dining. In the beauty category (Table 2), Clinique has a strong association with hairstyling; however, its product line contains few hair products. These insights can be a starting point for exploring brand extensions.
Another potential avenue for future work is to identify systematic relationships between perceptual dimensions and elements of visual design, such as shapes, colors, texture, and so on. While modern visual design provides many guidelines on how these elements can be used in a composition to create a certain perception, few of these are empirically tested on brand-related imagery. In addition, elements such as a photo’s location on the canvas relative to other photos, its size, and its rotation angle may carry additional meaning of which we are currently unaware.
An interesting theoretical question is the evolution of brand associations and their relationships with brand characteristics (Torres and Bijmolt 2009). On the one hand, one could argue that consumers think about brands in terms of characteristics such as personality and equity and then create in their minds images to represent these characteristics (e.g., they perceive the brand as innovative, and the concept of innovativeness evokes metaphors such as transistors, and therefore, they associate the brand with visuals containing transistors). On the other hand, one could think of the brand as evoking sets of metaphors, and the characteristics of these metaphors reflect, in turn, how consumers perceive the brand (e.g., the brand evokes the association of a transistor, transistors are perceived as innovative, which forms, inter alia, the innovative perception of the brand). B-VEP can help address this question through tasks such as collage building of synthetic brands with predefined controlled characteristics, or creating collages describing characteristics (e.g., innovative) and testing their similarity to associations of brands.
Our tool can aid in exploring heterogeneity among consumers’ brand perceptions. By collecting a large number of collages per brand, we can learn how individual differences in personality, values, lifestyle, and other variables of interest influence brand perception. Insights from such studies can be useful for performing segmentation, optimizing marketing communications, and creating a better fit between brands and their consumers. This could be done by methods such as hierarchical topic models, unsupervised machine-learning-based clustering, and latent class models.
In summary, modern software and image-processing tools open many new opportunities for marketing researchers. B-VEP enables researchers and firms to gather and harvest visual brand-related data directly from consumers, which complements existing brand metrics as well as the rapidly growing field of visual social media monitoring.
Supplemental Material
Supplemental Material, sj-xlsx-1-jmx-10.1177_0022242921996661 - Visual Elicitation of Brand Perception
Supplemental Material, sj-xlsx-1-jmx-10.1177_0022242921996661 for Visual Elicitation of Brand Perception by Daria Dzyabura and Renana Peres in Journal of Marketing
Footnotes
Appendix: The Usage of Search Words
Participants select the images for their collages from a large photo repository (the right-hand side of Figure 2). To help them browse through the repository, we implemented the option to search for keywords. Because the search uses words, one may wonder whether this undermined B-VEP’s main focus as a visual elicitation tool. To verify that this is not the case, we have conducted the following tests and measurements:
Acknowledgments
The authors thank their research assistants Liav Alter, Ivan Belov, Michal Elchanan, Yuval Friedman, Itay Manes, and Roni Tamir for their help. They thank Akshay Narvekar, Simona Weisberg, and the Chelem group for their assistance in the platform design and development. They thank Liav Alter for creating the association icons. They thank Eitan Muller, John Hauser, Liu Liu, Artem Timoshenko, and Raluca Ursu for their helpful comments.
Associate Editor
David Schweidel
Declaration of Conflicting Interests
The author(s) declared no potential conflicts of interest with respect to the research, authorship, and/or publication of this article.
Funding
The author(s) disclosed receipt of the following financial support for the research, authorship, and/or publication of this article: This article was supported by the Marketing Science Institute, the Israeli Science Foundation, and the KMart foundation.
Notes
References
Supplementary Material
Please find the following supplemental material available below.
For Open Access articles published under a Creative Commons License, all supplemental material carries the same license as the article it is associated with.
For non-Open Access articles published, all supplemental material carries a non-exclusive license, and permission requests for re-use of supplemental material or any part of supplemental material shall be sent directly to the copyright owner as specified in the copyright notice associated with the article.