
Abstract
This article examines why some brands are able to ride the wave of macroeconomic expansions, whereas other brands are better able to successfully weather contractions. Using a utility-based framework, the authors develop hypotheses on how the impact of these shocks on brand equity is moderated by six strategic brand factors: price positioning, advertising spending, product line length, distribution breadth, brand architecture, and market position. The authors utilize monthly data on 325 national consumer packaged goods brands in 35 categories across 17 years from the United Kingdom to obtain quarterly sales-based brand equity estimates. The two preeminent brand factors are distribution and assortment. Distribution is by far the most important factor in contractions. It is also the most important factor in expansions. In short, in good times and bad times, extensively distributed brands win. A wide assortment is also a strong contributor to brand equity in expansions, while it does not destroy brand equity in contractions. The authors further find that advertising spending, premium price positioning, umbrella branding structure, and market leadership matter in expansions and/or contractions, and the magnitude of their effects on brand equity is relatively modest. The discussion concludes with managerial implications.
Keywords
The ups and downs of macroeconomic cycles provide brand managers with opportunities to grow their brand or insulate it from harm. In economic contractions, consumers have lower disposable incomes and thus face tighter budgets. This makes them more price sensitive (Gordon, Goldfarb, and Li 2013; Van Heerde et al. 2013), less brand loyal (Pointer Media Network 2009), and more inclined to shift their purchases to (cheaper) private labels (Lamey et al. 2007, 2012; Scholdra et al. 2022). The opposite effects occur in good times. Consumers change their cross-category consumption behavior across the business cycle (e.g., Deleersnyder et al. 2004; Du and Kamakura 2008), but we know little about how business cycles affect different brands within a category. Dekimpe and Deleersnyder (2018, p. 54) raise this issue as an important research question: “Are all brands equally affected?” We examine this issue for brand equity, regarded by academics and practitioners alike as a key performance metric of a brand (Aaker 1991; Datta, Ailawadi, and Van Heerde 2017; Millward Brown 2017).
There is a rich literature on the effects of various marketing-mix instruments on brand equity (e.g., Ailawadi, Lehmann, and Neslin 2003; Sriram, Balachander, and Kalwani 2007; Yoo, Donthu, and Lee 2000). This important work focuses on a short-term, tactical view. Academics recommend that brand equity be built and maintained for the long run, using the various elements of the marketing mix (Aaker 1991; Lodish and Mela 2007). In this article we complement previous work by adopting a strategic perspective. Our perspective is that of the firm—and in particular brand management—that uses the marketing mix not only tactically but also strategically to position the brand relative to its competitors. We examine six strategic brand factors: price positioning, advertising spending, product line length, distribution breadth, brand architecture, and market position.
The purpose of this article is to examine how brands with different positioning along these six strategic brand factors are more or less able to weather economic shocks. Our research straddles two important research streams: drivers of brand equity and the effects of macroeconomic conditions. Our contribution is twofold. First, we adopt a strategic view on the effect of managerial decisions on brand equity, by focusing on the role of strategic brand factors. Second, we examine how and to what extent the effects of these strategic brand factors differ systematically between expansions and contractions. The context in which we test our hypotheses is consumer packaged goods (CPG) in the United Kingdom. We estimate the effect of business cycles on brand equity of brands with different characteristics utilizing data on 325 CPG national brands in 35 categories across 17 years.
Background Literature
Macroeconomic Fluctuations
There is a rich and growing marketing literature on the effects of macroeconomic fluctuations on marketing-related phenomena. Previous research (see Web Appendix A for a summary) shows that macroeconomic fluctuations influence consumers’ category preferences (Kamakura and Du 2012), budget allocation (Du and Kamakura 2008), purchase of durable goods (Deleersnyder et al. 2004), shopping frequency, and purchase volume (Ma et al. 2011; Scholdra et al. 2022). They also affect brands’ price elasticity (Gordon, Goldfarb, and Li 2013; Van Heerde et al. 2013), advertising effectiveness (e.g., Srinivasan, Lilien, and Sridhar 2011; Steenkamp and Fang 2011; Van Heerde et al. 2013), research and development (R&D) effectiveness (Srinivasan, Lilien, and Sridhar 2011; Steenkamp and Fang 2011), and marketing conduct over the macroeconomic fluctuations (Lamey et al. 2012). Consumers switch more frequently to private labels in downturns (Lamey et al. 2007, 2012; Scholdra et al. 2022). For the most part, existing research does not focus on examining customers’ heterogeneous behavior across different types of brands and investigating why some brands fare better than others during different economic conditions. We extend this body of research by considering the link between strategic brand factors and brand equity during expansions and contractions.
Brand Equity
A widely used definition of brand equity is the value added by the brand name to a product (Farquhar 1989). The two basic approaches to operationalizing the value added to a product by its brand name are consumer mindset metrics and market outcomes (Datta, Ailawadi, and Van Heerde 2017). The first approach is known as consumer-based brand equity (CBBE) and is grounded in metrics such as awareness, attachment, and attitudes toward the brand. The second approach, sales-based brand equity (SBBE), is based on market outcomes that can be attributed to the brand, such as price, volume, or revenue premia (Ailawadi, Lehmann, and Neslin 2003; Datta, Ailawadi, and Van Heerde 2017; Sriram, Balachander, and Kalwani 2007). Extant research shows that SBBE and CBBE are positively related, but that the magnitude of the correlation is modest, around .3 (Datta, Ailawadi, and Van Heerde 2017), because what consumers think and feel is far from perfectly aligned with what they actually do (Sheppard, Hartwick, and Warshaw 1988). Our interest is in SBBE, as it is the ability of managers to generate superior market performance that provides the ultimate justification for spending money on branding activities.
Previous research examines the effect of marketing-mix activities on SBBE. Ailawadi, Lehmann, and Neslin (2003) and Sriram, Balachander, and Kalwani (2007) find that advertising had a positive effect on brand equity, whereas promotion had no effect. Sriram, Balachander, and Kalwani further find that innovation activity increased the equity of toothpaste brands, but not of dish detergent brands. Previous research does not examine the heterogeneity in SBBE across brand characteristics in different economic conditions. We extend research on SBBE by examining how the equity of different types of brands is affected during business cycles.
Research Framework and Hypotheses
Overview of Theoretical Framework
Figure 1 presents the research framework that guided our study. In our framework, we include six strategic brand factors: price positioning (value vs. premium), advertising spending (low vs. high), line length (short vs. long), distribution breadth (selective vs. extensive), brand architecture (single-category vs. umbrella branding strategy), and market position (follower vs. leader). Strategic brand factors are sticky but not fixed over time. For example, it is possible to change the price positioning of a brand, but such a change should only be executed gradually. A brand manager cannot change a value brand to a premium brand in the short run. The same applies to the other strategic brand factors.

Research Framework.
These six factors tap into the three components of brand image as identified by Keller (1993). In Keller's theory of customer-based brand equity, strong brands elicit strong, favorable associations that are unique. Keller's work has inspired various brand consultancies to propose their own branding models. These models share the same components, broadly speaking, albeit they use different labels. In our work, we adopt Kantar's BrandZ model because it is closest to Keller's original work. Kantar (2021) identifies three pillars of strong brands: differentiation (akin to Keller's uniqueness), meaningfulness (favorability), and salience (strength). According to Kantar (2021, p. 13), differentiation refers to the brand being distinct from others. Price and advertising are among the key strategic factors contributing to brand differentiation (Mela, Gupta, and Jedidi 1998). Meaningful brands meet people's heterogeneous needs and make people feel emotionally connected to the brand. Line length (multiple stockkeeping units [SKUs] to meet varying consumer needs; Ataman, Mela, and Van Heerde 2008) and advertising (to create emotional connections; Aaker 1991) are strategic brand factors that contribute to meaningfulness. Finally, salient brands are brands that come to mind quickly in purchase situations. Distribution and market position contribute to brand salience, as does ubiquity across product categories (umbrella brand; Bronnenberg, Mahajan, and Vanhonacker 2000; Sharp 2010).
Brand Utility Framework
We examine whether and how the effect of macroeconomic conditions on brand equity plays out differently depending on these six strategic brand factors through the lens of multiattribute decision making under uncertainty and informational constraints (Meyer 1981; Pras and Summers 1978). We draw on Pras and Summers (1978), Erdem and Keane (1996), and Erdem, Zhao, and Valenzuela (2004) and propose that the utility consumers derive from a brand attribute l (Ul) depends on the brand's perceived score on attribute l (Xl) and the importance of attribute l to consumers (ωl), as well as the uncertainty about the ability of the brand to deliver attribute l (σl), weighed by consumers’ tolerance for risk for that attribute l (rl): Ul = ωlXl − rlσl. 1 We assume that consumers on average are risk averse (Erdem, Zhao, and Valenzuela 2004; Van Ewijk, Gijsbrechts, and Steenkamp 2022), and thus rlσl captures the disutility from risk associated with uncertainty in attribute delivery.
We distinguish between functional (tangible) and emotional/self-expressive (intangible) attributes (Aaker 1996; Erdem, Zhao, and Valenzuela 2004; Myers and Shocker 1981). Functional attributes are related to the tangible functions performed by the brand. Emotional/self-expressive attributes refer to the intangible feelings the brand provides to consumers and what the consumption of the brand tells others about the kind of person the consumer is. We aggregate across functional and emotional attributes and risks, and we include the disutility of price. Thus, the utility brand i provides can be expressed as a function of five elements:

We propose that the relative importance of price, functional attributes and risks, and emotional attributes and risks varies across the business cycle (i.e., change in magnitudes of α,
Predictions
We use these insights to develop hypotheses about the role of the six strategic brand factors in moderating the effect of the business cycle on brand equity.
Price positioning
Following Van Heerde et al. (2013), we distinguish between value brands and premium brands. Value brands are lower priced and utilitarian in scope (Steenkamp 2014). They are positioned on tangible attributes, providing high value because they offer reasonable quality for a low price. Premium brands cost more (PPRM > PVAL), but are also higher on functional and emotional attributes relative to value brands (
In contractions, both price (αCON > αEXP; Lamey et al. 2007; Van Heerde et al. 2013) and functional utility (
Advertising spending
We distinguish between brands with low and high advertising expenditures. Economists (e.g., Kihlstrom and Riordan 1984; Klein and Leffler 1981) derived analytically that advertising expenditure is positively related to product quality. This confirms the old dictum that it does not make sense to advertise a bad product. Kirmani and Wright (1989) showed empirically that high advertising expenditure is perceived by consumers as an indicator of marketing effort, which is a clue to the marketer's confidence in product quality. Consequently, brands with high ad spending should be perceived by consumers as being higher on functional utility (
Line length
Line length refers to the number of SKUs offered by a brand in a category. The more SKUs a brand carries, the more difficult it is for consumers to accurately gauge their respective qualities. Consumers may be exposed to varieties (e.g., taste) about which they have little idea. In a recent study, Van Ewijk, Gijsbrechts, and Steenkamp (2022) document that adding new SKUs has a “dark side,” as it increases consumer uncertainty about quality of the brand. This suggests that longer line length is associated with higher functional risk:
Brands that carry a wider assortment are able to more closely meet the heterogeneous needs of consumers (Nevo 2001) and allow consumers to choose the product that aligns best with their psychosocial values. This is likely to increase consumer perceptions of emotional attributes (
Distribution
Wider distribution is a key factor in market success of CPG brands (Ataman, Van Heerde, and Mela 2010; Srinivasan, Vanhuele, and Pauwels 2010). Although Klein and Leffler (1981) focus on advertising as brand-specific marketing program investment, their analytical conclusions apply to any kind of observable brand-name expenditures (Milgrom and Roberts 1986, pp. 799–800), including distribution (Rao and Mahi 2003). Consumers interpret a brand's ubiquitous presence as a sign of its consistent performance across different markets. Extensive distribution costs, associated with high expenditures on slotting allowances, in-store promotion material, and other expensive retail investments, would be lost if the brand does not deliver on its promises (Rao and Mahi 2003). Thus, extensively distributed brands score higher on functional attributes than selectively distributed brands (
Brand architecture
We distinguish between umbrella brands and single-category brands (Erdem 1998; Erdem and Sun 2002). Umbrella branding helps consumers in cross-category learning, which helps transfer favorable brand associations from one category to another (Erdem and Chang 2012). Firms that adopt umbrella branding have more incentives (relative to single-category brands) to maintain and improve quality of their offerings as they face greater risk of poor-quality attribution (Erdem 1998; Miklós-Thal 2012; Montgomery and Wernerfelt 1992):
Market position
Here we distinguish between whether the brand is a leader versus a follower in the category. Aaker (2007, p. 17) maintains that “the most influential exemplars [of leader brands] will be those that are perceived to be superior in terms of quality, performance, and reliability.” Market leader brands have greater incentives to maintain higher quality and meet the brand's promise as the financial consequences of failure are much larger for them (Milgrom and Roberts 1986):
What about emotional payoff? On the one hand, brands with a dominant market position might generate more positive emotions because of the bandwagon effect—the pleasure that consumers have from using a product when more people are using it (Edeling and Himme 2018; Hellofs and Jacobson 1999)—and the “fitting in” effect, which enhances consumers’ sense of belonging to a larger social group (Van Herpen, Pieters, and Zeelenberg 2009). On the other hand, using popular and well-known brands might decrease consumers’ emotional utility because of the loss of exclusivity effect: “consumers feel worse about the product and perhaps even themselves (through loss of image) when the brand they are using is popular” (Hellofs and Jacobson 1999, p. 18). Thus, leading brands may or may not be more favorably perceived on emotional attributes than their follower counterparts. Given the competing theoretical arguments, we refrain from hypothesizing for the effect of market position during expansions. For contractions, we hypothesize:
Method
Our empirical strategy consists of two general steps: (1) estimating brand equity using the SBBE approach, and (2) explaining heterogeneity in the SBBE estimates using strategic brand factors and their interactions with macroeconomic expansions and contractions. Following Datta, Ailawadi, and Van Heerde (2017) and Sriram, Balachander, and Kalwani (2007), we operationalize SBBE using the brand intercept method, whereby, after accounting for marketing-mix investments and tangible product characteristics, what is left in the brand intercept is a measure of the ability to leverage the brand to generate sales. In the first step, we follow Datta, Ailawadi, and Van Heerde (2017) and estimate quarterly brand intercepts using a model with marketing activities and product attributes of the focal brands, and other control variables, as predictors and brand volume market share as the dependent variable. In the second step, we use six strategic brand factors (i.e., price positioning, ad spending, distribution breadth, line length, brand architecture, and market position), as well as their interactions with the magnitude of macroeconomic expansions and contractions, to explain the variation in the quarterly brand intercepts (i.e., brand equity estimates). 3
We investigate our hypotheses in the context of CPG categories in the United Kingdom. We acquired U.K. household scanner panel data from Kantar Worldpanel for 35 CPG categories. The monthly brand-level data set covers 17 years from January 1994 to November 2010 (203 months) and includes information on marketing conduct and performance of national brands in each CPG category. We retained all brands that satisfied the following two conditions: (1) nonzero sales in at least 95% of the months during the data window, and (2) average monthly volume market share exceeding .1%. Our resulting sample consists of 325 national brands. We complement our data with monthly ad expenditures for brands in our sample, which we get from Nielsen Media U.K. 4
Step 1: Estimating SBBE
We follow Datta, Ailawadi, and Van Heerde (2017) and use market share attraction model (Cooper and Nakanishi 1988) at the monthly level to estimate SBBE at the brand-quarter level. We specify a model that allows for heterogeneous brand-specific coefficients (Datta, Ailawadi, and Van Heerde 2017; Gielens 2012). Market share of brand i in category j during month t is expressed as the attraction of that brand (Aijt) relative to the aggregate attractions of the Ij brands in category j during month t (Ij represents the number of brands in product category j):


Variables in Step 1.

In our data, we only observe paid price. Using Gielens’s (2012, p. 412) approach, we decompose the paid price into the regular price (average price level of a brand defined over a six-month moving window) and the price promotion depth (the same approach is also used in Geyskens, Gielens, and Gijsbrechts [2010]). We thank an anonymous reviewer for this suggestion.
Model estimation
The attraction model for each product category j can be written as a system of Ij equations that is estimated simultaneously using seemingly unrelated regression. After Equation 2 is substituted into Equation 1, the system of equations can be linearized and normalized by first taking its logarithm and then using either of the two approaches discussed by Cooper and Nakanishi (1988): (1) normalizing with respect to a base brand (base-brand approach) or (2) normalizing by centering (log-centering approach). The two approaches are equivalent (Cooper and Nakanishi 1988), and we use the latter. Finally, we estimate this system of seemingly unrelated equations using feasible generalized least squares:
9
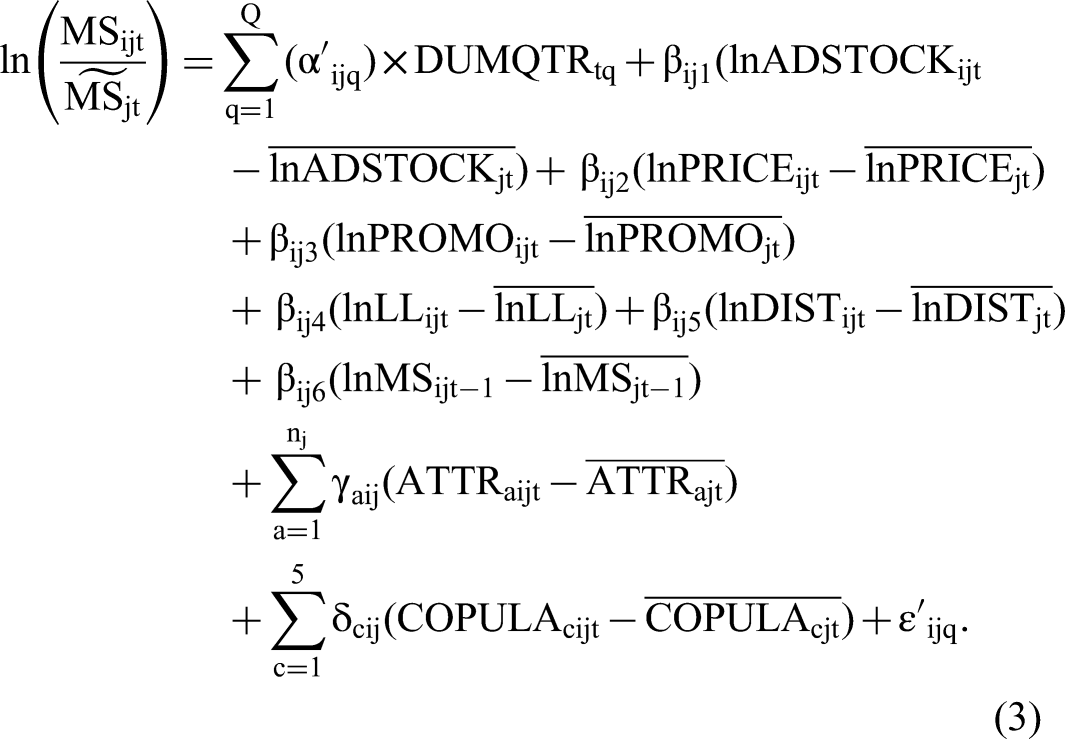
In the preceding equation,
Estimation results
Table 2 reports the weighted mean marketing-mix elasticities across all 325 brands (for category-specific results, see Web Appendix F). All elasticities have the expected sign, and their meta-analytic Z-statistics (Rosenthal 1991) are significant. We find a small but significant mean advertising elasticity (.0149), close to the value of .0021 in Van Heerde et al. (2013). Our mean price elasticity (−.8895) is smaller in magnitude than the value of −1.4266 reported by Van Heerde et al. (2013). However, the elasticities in Van Heerde et al. (2013) are based on absolute sales rather than market share. 11 Bijmolt, Van Heerde, and Pieters (2005, Table 2) report that price elasticities based on market share are on average .32 smaller in absolute magnitude than price elasticities based on sales. The weighted average price promotion elasticity of .1966 is in line with the value of .146 reported by Srinivasan, Vanhuele, and Pauwels (2010). The mean distribution elasticity of .3392 is consistent with the value of .40 in Datta, Ailawadi, and Van Heerde (2017) and the value of .368 in Datta et al. (2022). Finally, our mean elasticity for line length (.6396) is in the range of values (from .348 to 1.511) reported by Jindal et al. (2020) and comparable with the value of .459 reported by Datta et al. (2022).
Marketing-Mix Elasticity Estimates.

*p < .10.
**p < .05.
***p < .01.
Weighted means across 325 brands in 35 categories, with weights being the inverse of the estimated standard errors. Significance tests are based on meta-analytic Z-values.
We illustrate quarterly SBBE estimates for some brands across four product categories (Figure 2). As seen in the figure, Mr Muscle, Lavazza, and Wilkinson are consistently valuable brands in the United Kingdom. Some brands (e.g., Sensodyne) have experienced considerable growth over years, whereas other brands (e.g., Ajax, Mentadent) have declined over time, and others (e.g., Douwe Egberts, Cif) have remained fairly stable. We report category-specific statistics on SBBE scores in Web Appendix G.
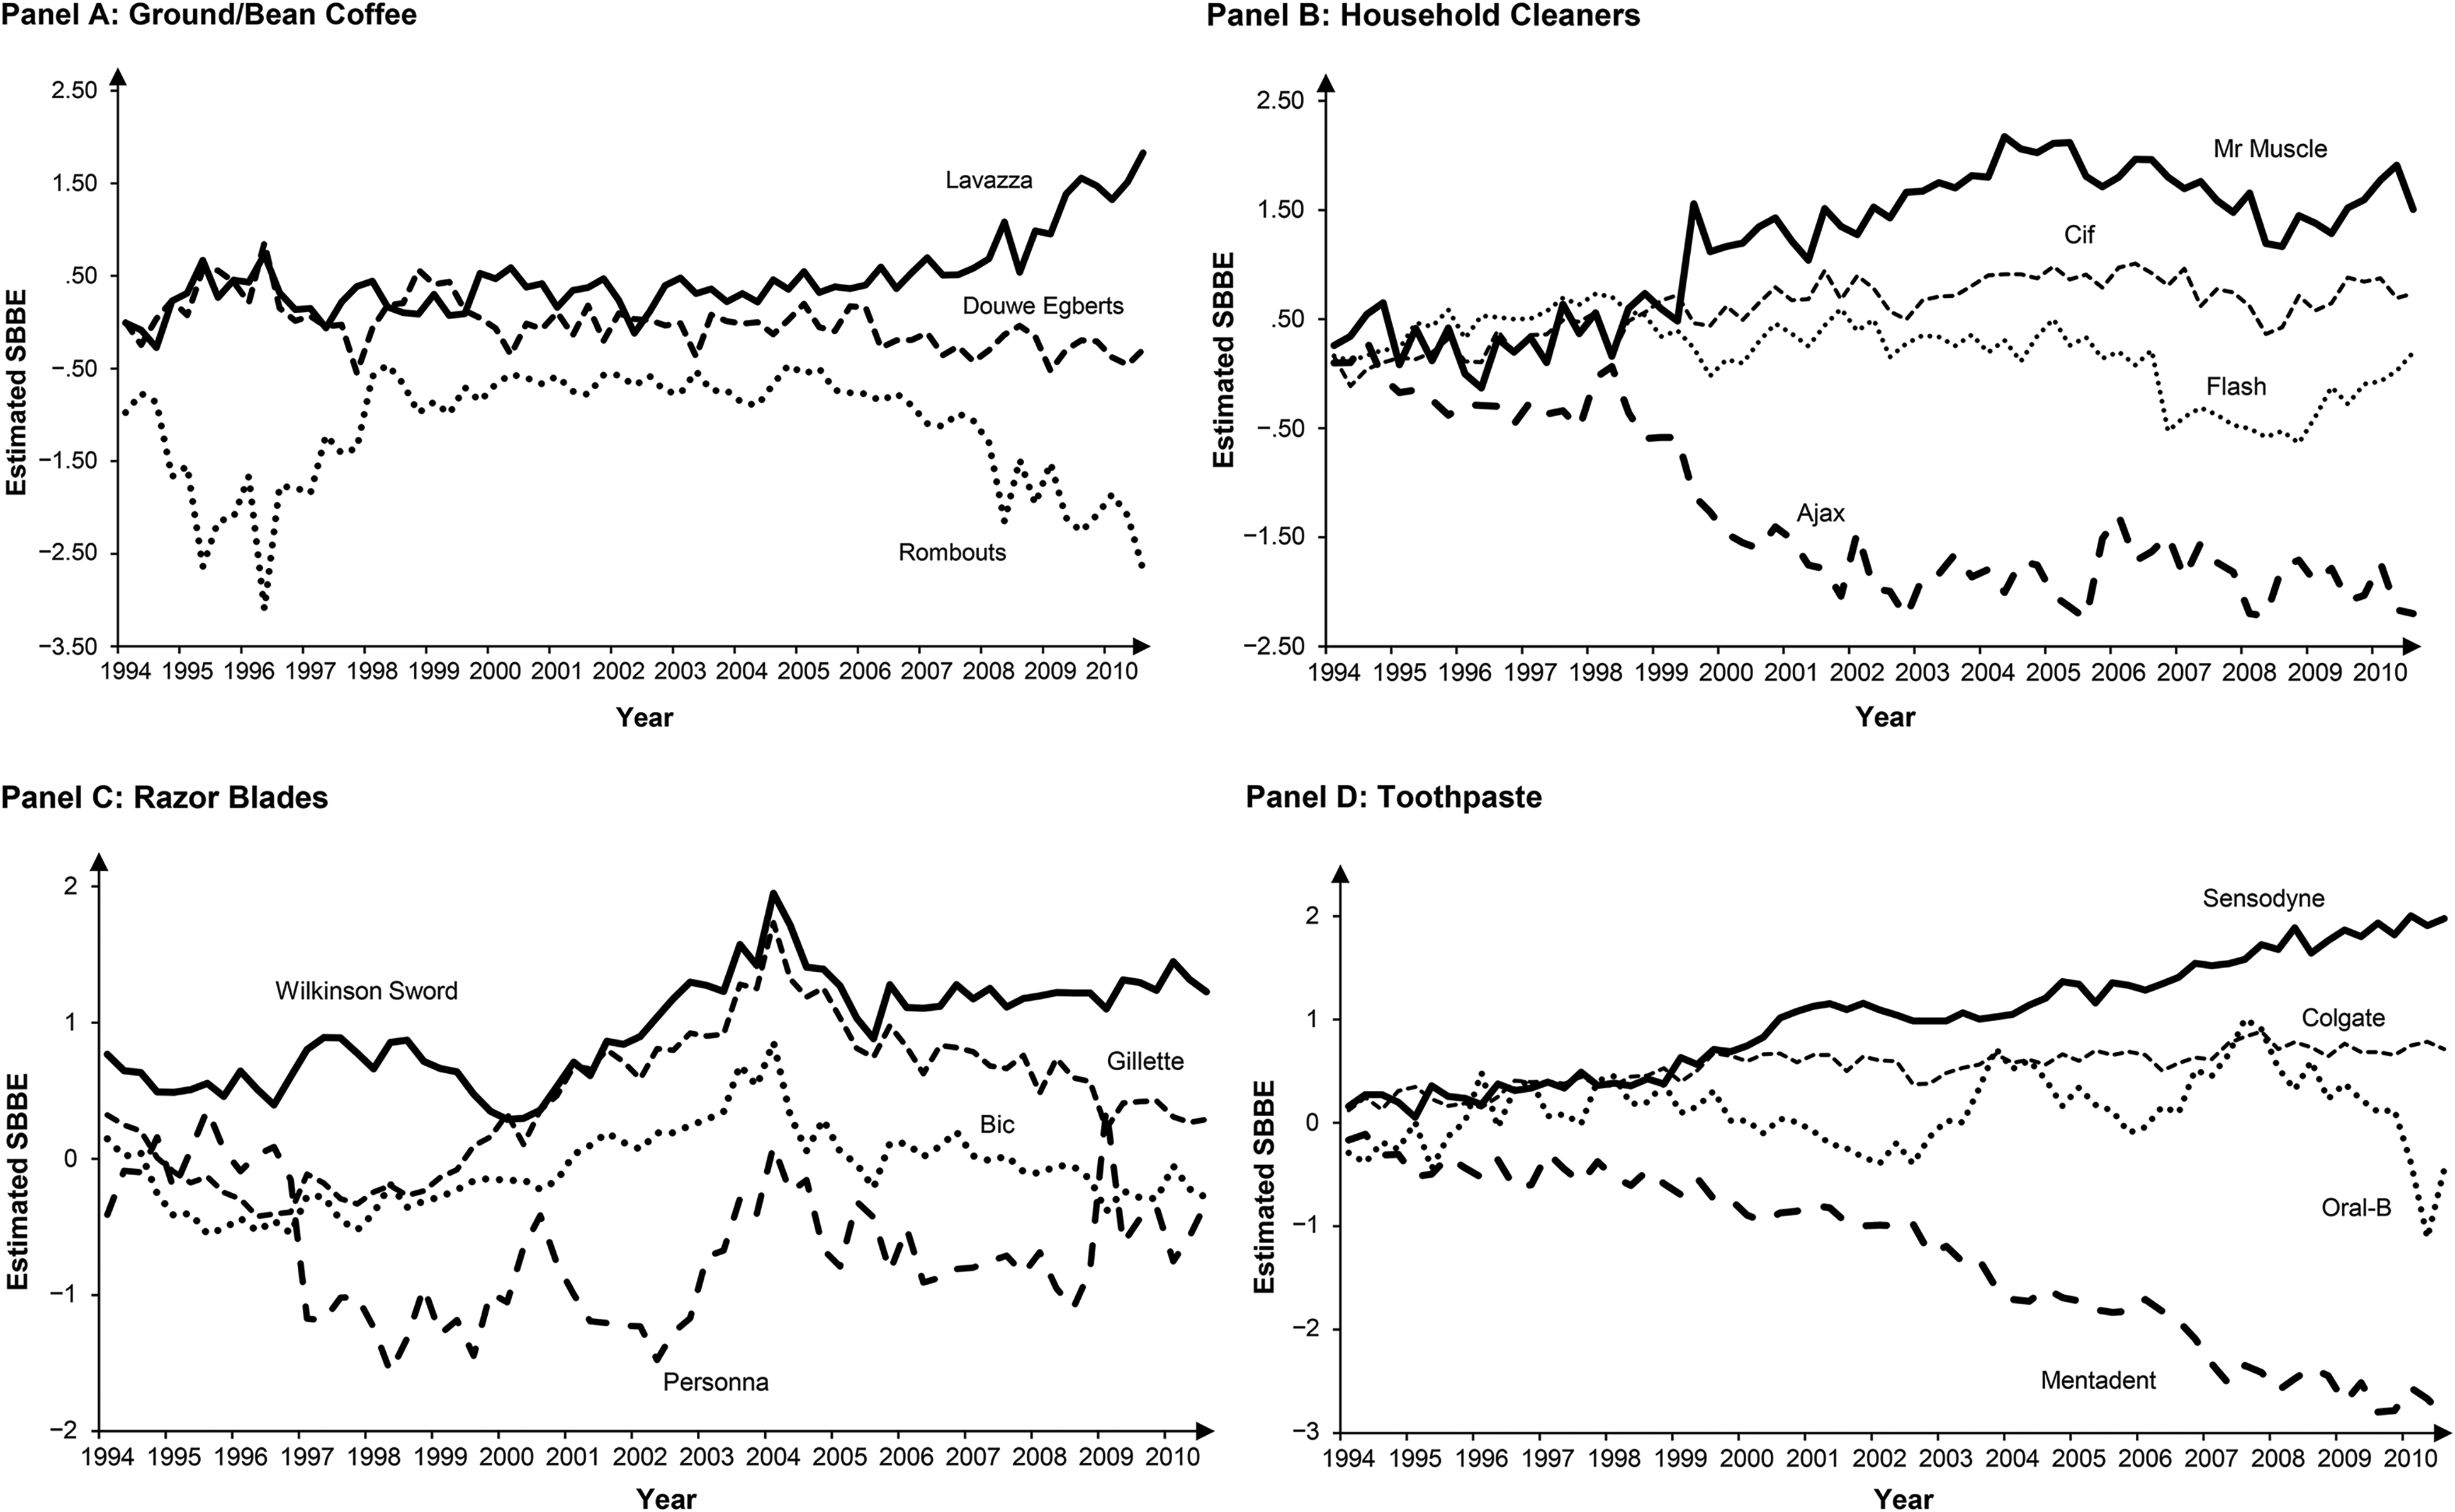
SBBE Estimates in Four Product Categories.
Step 2: Explaining the Dynamics of Brand Equity
Operationalizing business cycles
We use quarterly data on inflation-adjusted gross domestic product per capita (GDPPC) from the United Kingdom's Office for National Statistics to extract macroeconomic fluctuations. We follow previous research (e.g., Lamey et al. 2007, 2012) and adopt time-series filtering to extract the cyclical component of (log-transformed) macroeconomic fluctuations (

Model specification
To examine how different strategic brand factors help (or hurt) brands during expansions and contractions, we use the following model: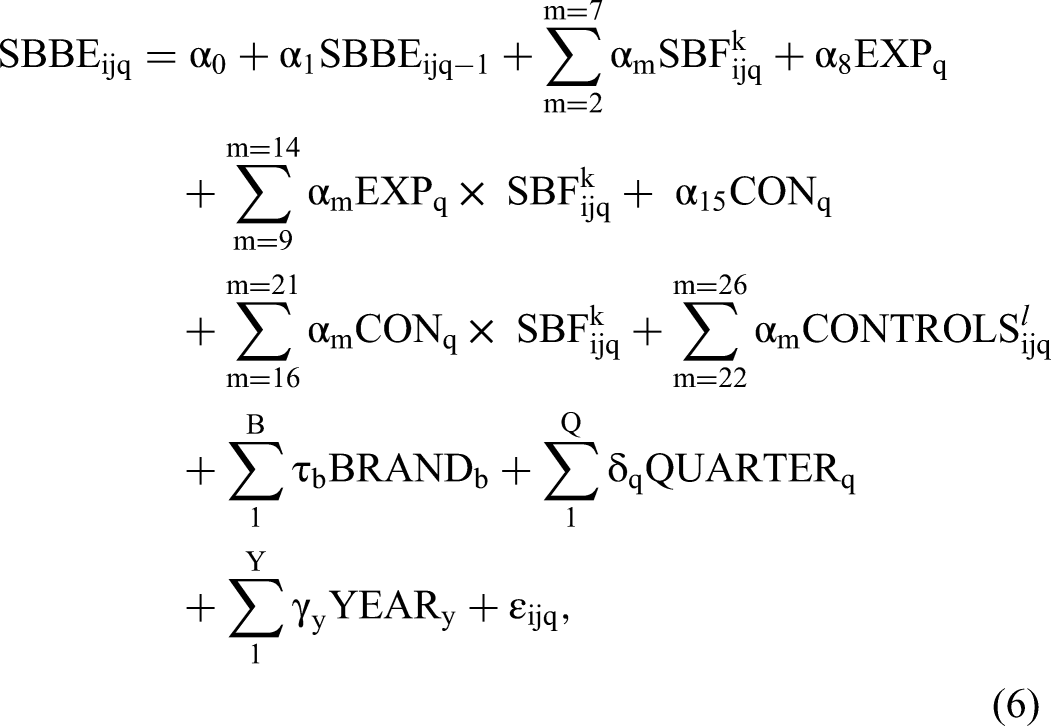
In Equation 6, α2 through α7 capture the main effect of the strategic brand factor variables on SBBE (i.e., general differences in SBBE due to the strategic brand factors, irrespective of economic conditions). The main effect of ARCH is not identified since it is a time-invariant characteristic and thus the effect is subsumed within brand fixed effects. In addition, α8 holds the main effect of macroeconomic expansions on SBBE, and α15 holds the main effect of macroeconomic contractions on SBBE. The variables α9 through α14 capture how the equity of brands with different strategic brand factors is affected differentially during expansions, and α16 through α21 do the same for contractions. Thus, our modeling approach distinguishes between the general effect of strategic brand factors and how these effects change during expansions and contractions, which is in line with Van Heerde et al. (2013).
Variables Used in Step 2.
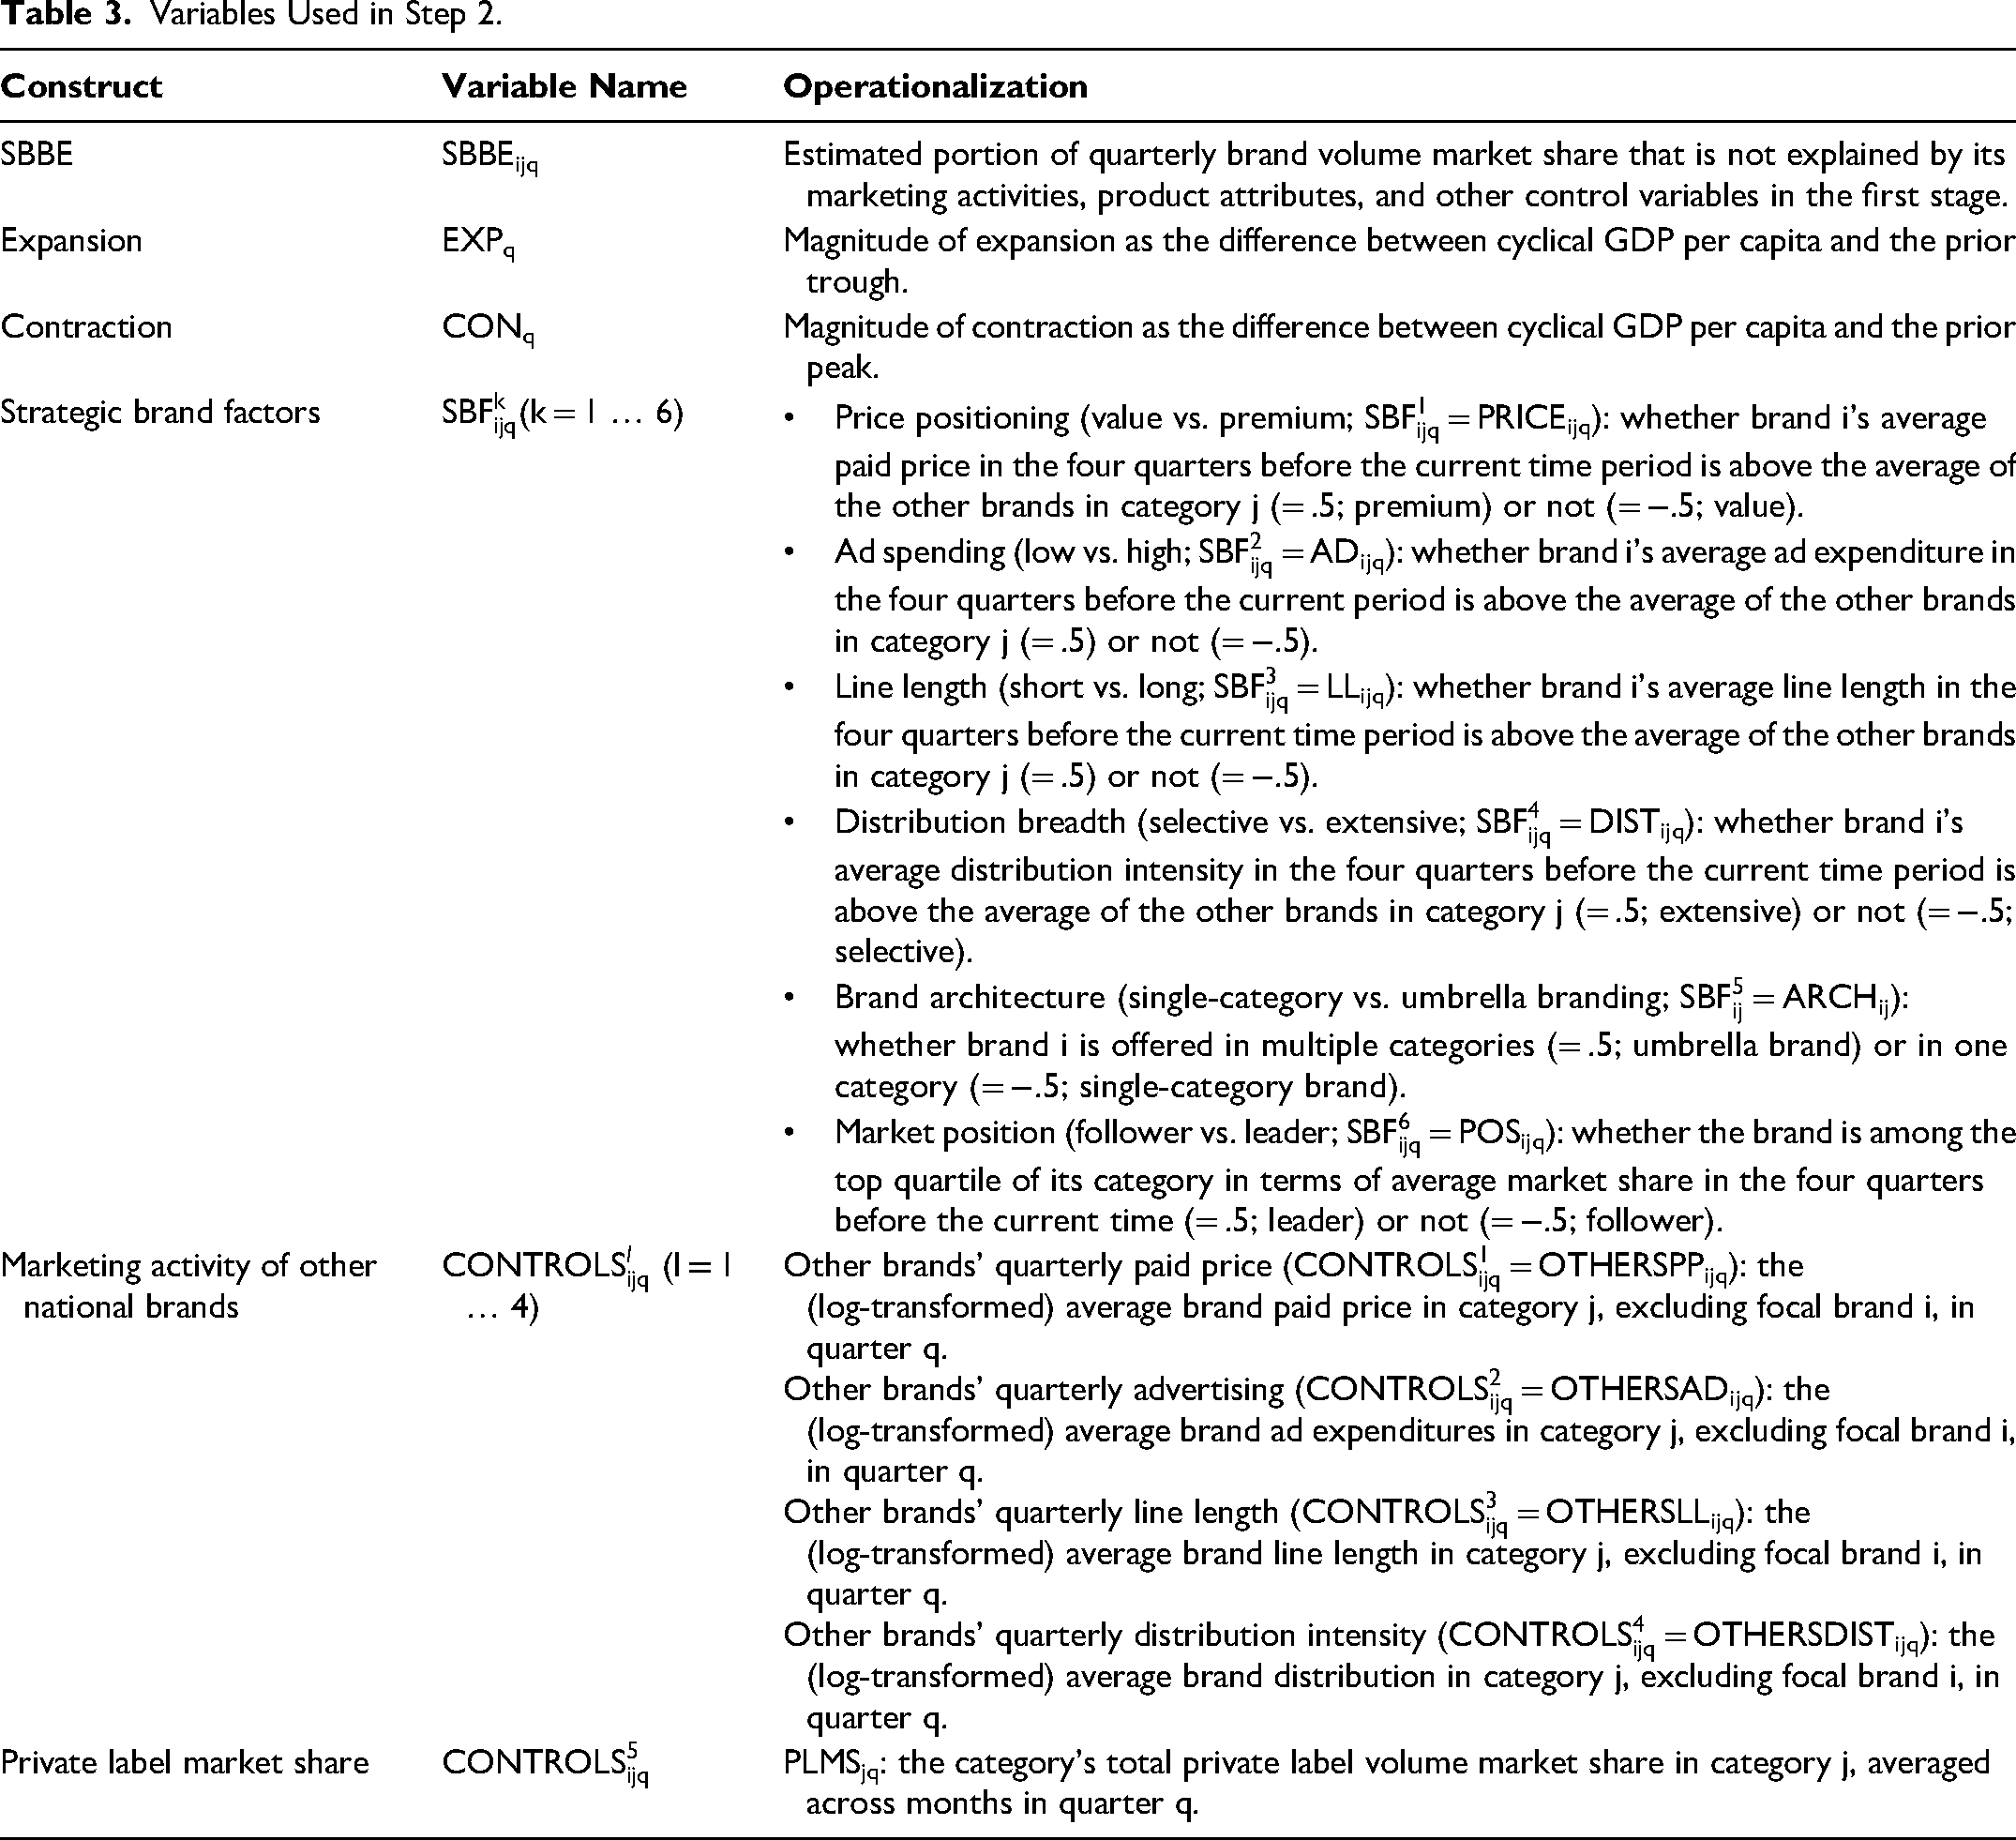
Control variables and fixed effects
We include several control variables in the model (
We also include several sets of fixed effects in our model. First, we include 324 brand dummies (∑BRANDb) to account for unobserved time-invariant brand-specific factors that might influence SBBE (e.g., country of origin, heritage). To control for seasonal fluctuations in SBBE estimates in some categories (see Figure 2), we include three quarterly dummies (∑QUARTERq). To account for general year-specific shocks to SBBE, we include yearly dummies (∑YEARy).
Multicollinearity
Having a large number of interaction terms might lead to multicollinearity. In our empirical setting, all the variance inflation factor values are well below 10 (average = 2.80), thereby alleviating multicollinearity concerns. Further, as shown in Web Appendix I, all correlations between our focal independent variables (and their interactions) are below .7.
Estimation
Since the dependent variable in Equation 6 is an estimated variable, we use weighted least squares, with the inverse of the SBBE standard errors from Equation 3 as weights in our estimation (Bezawada and Pauwels 2013; Datta, Ailawadi, and Van Heerde 2017). We estimate standard errors using two-way cluster-adjusted robust standard errors (at brand and quarter levels) that account for within-panel and within-time dependencies across observations (Seiler, Tuchman, and Yao 2021).
Results
We present model-free evidence in Web Appendix J. We build our final model by successively adding blocks of predictors to arrive at our full model (see Web Appendix K). Table 4 provides the parameter estimates for Equation 6. We find that brands with long line length (α4 = .0341, p < .01), extensive distribution (α5 = .0418, p < .01), and market leadership (α7 = .0246, p < .05) on average have higher SBBE than brands that are selectively distributed, have short line length, and are market followers. We do not find a significant difference in the SBBE of value versus premium brands (α2 = −.0012, p > .10) or brands with low versus high ad spending (α3 = .0083, p > .10). The main effects of expansions (α8 = −.0949, p > .10) and contractions (α15 = −.1011, p > .10) on SBBE are nonsignificant, suggesting that the SBBE of an “average brand” does not change during expansions and contractions. 12
Main Results.
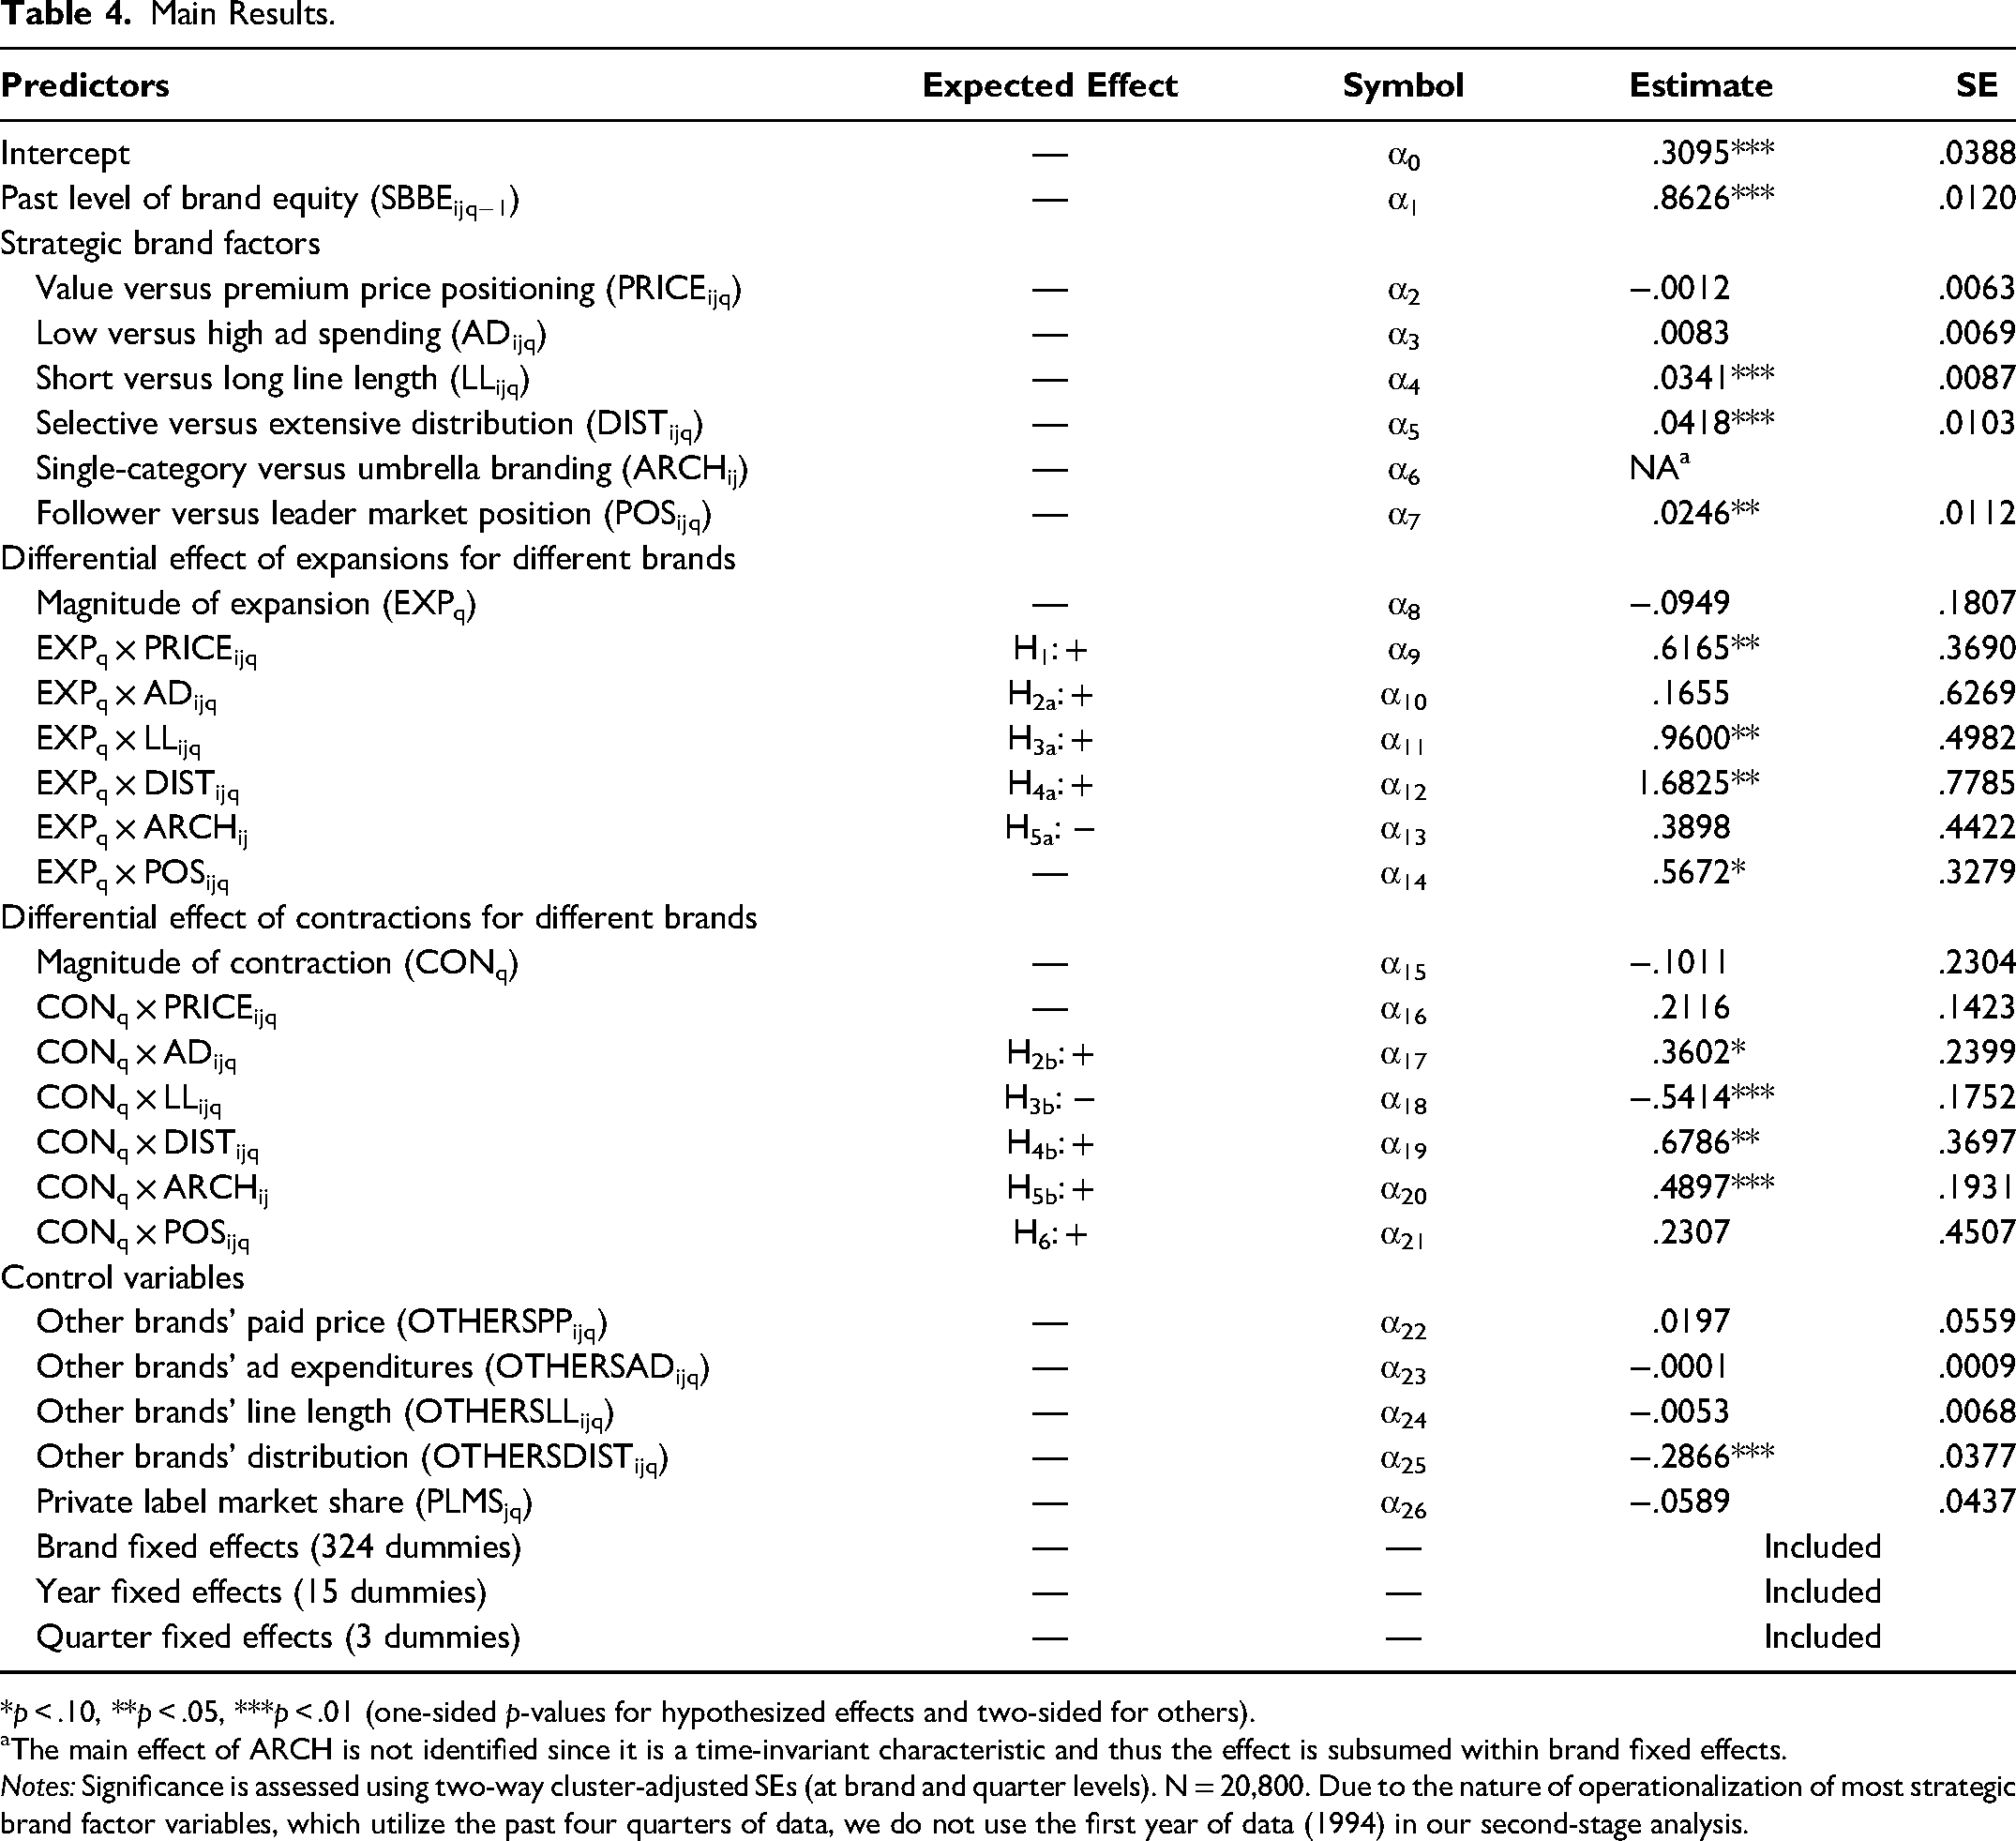
*p < .10, **p < .05, ***p < .01 (one-sided p-values for hypothesized effects and two-sided for others).
aThe main effect of ARCH is not identified since it is a time-invariant characteristic and thus the effect is subsumed within brand fixed effects.
Notes: Significance is assessed using two-way cluster-adjusted SEs (at brand and quarter levels). N = 20,800. Due to the nature of operationalization of most strategic brand factor variables, which utilize the past four quarters of data, we do not use the first year of data (1994) in our second-stage analysis.
Expansions and Strategic Brand Factors
Although the main effect of expansions on SBBE is not significant, we find that brands with different strategic characteristics are differentially affected by expansions. In line with H1, the SBBE of premium brands is higher than the SBBE of value brands during expansions (α9 = .6165, p < .05). This suggests that in good economic times, when consumers have fewer budgetary restrictions, premium brands are preferred by consumers. We do not find significant evidence for differences in SBBE during expansions of brands with low versus high ad spending (α10 = .1655, p > .10); thus H2a is not supported. During expansions, brands with long line length outperform brands with short line length (α11 = .9600, p < .05). Thus, H3a is supported.
In line with H4a, in expansions, extensively distributed brands do better equity-wise than selectively distributed brands (α12 = 1.6825, p < .05). We do not find any difference in brand equity of single-category versus umbrella brands during expansions (α13 = .3898, p > .10), thus H5a is not supported. The SBBE of market leader brands outperforms that of follower brands during expansionary periods (α14 = .5672, p < .10), which provides support for the bandwagon effect (i.e., the pleasure that consumers gain from using a product when more people are using it). 13
Contractions and Strategic Brand Factors
Although the nonsignificance of CONq suggests that contractions do not generally affect the SBBE of brands, there is significant heterogeneity with respect to strategic brand factors. The SBBE scores of value and premium brands do not significantly differ during contractions (α16 = .2116, p > .10). We conjecture that higher product quality associated with premium brands (and thus higher functional utility) provides a countervailing force to the higher price associated with them. In line with H2b, brands with high ad spending have higher SBBE during contractions than brands with low ad spending (α17 = .3602, p < .10).
Consistent with H3b, we find that brands with short line length do better in contractions than those with long line length (α18 = −.5414, p < .01). Brands with extensive distribution are estimated to have higher SBBE during contractions relative to brands with selective distribution (α19 = .6786, p < .05). Thus, H4b is supported. 14 In line with H5b, we find that in contractions, umbrella brands have higher SBBE, compared with single-category brands (α20 = .4897, p < .01). Finally, we do not find a significant difference in the SBBE of market leaders and followers in contractions (α21 = .2307, p > .10). Therefore, H6 is not supported. It is possible that during contractions, when consumers lose trust in the economic system, they react more negatively toward leading brands since these brands “may be seen to benefit most from this unfair system” (Dekimpe and Deleersnyder 2018, p. 54). This alternative mechanism might have outweighed the higher functional utility associated with market leadership. 15
Long-Term Effects
Our main findings in Table 4 present the short-term differences in equity of different types of brands during the business cycle. Such differences carry over into subsequent quarters because of the inertia of brand equity, which is around .86 (Table 4), implying that 86% of brand equity carries over into the next quarter. This renders brand equity stickier than revenues, which have a quarterly carryover coefficient of .6 (Clarke 1976). The greater stickiness of brand equity makes it even more worthwhile to invest in brands because the long-term differences across different types of brands are substantially larger than their short-term differences. Figure 3 shows the long-term implication of our main findings, using αlong-term = αshort-term/(1 − αSBBE(t−1)).

Long-Term Effects of the Business Cycle on Different Types of Brands.
Figure 3 shows that entering expansions or contractions with different strategic brand factors has considerable long-term SBBE implications. In assessing the magnitude of differences observed in Figure 3, note that the average brand-specific standard deviation in SBBE is .54 (median = .46).
In expansions, the most important factors are strategic decisions made with regard to line length and distribution. Their effects can be categorized as large, according to Cohen (1988), with Cohen's d values of .87 and 1.29, respectively. 16 Next is market position (d = .58), and strategic decisions made with respect to price also play a role, although only modest in size (d = .27). The outcome of the strategic decisions regarding distribution is the single most important factor by far in determining how or whether brand equity will hold up in contractions (d = 1.10). Other factors that matter are brand architecture (d = .39), market position (d = .33), and advertising (d = .29).
Validation Checks
Relation with CBBE
Datta, Ailawadi, and Van Heerde (2017) show that SBBE and CBBE are moderately correlated with each other. If we correctly followed the SBBE procedure in estimating brand equity, our estimates should show similar correlations with CBBE values. We obtained Young & Rubicam's Brand Asset Valuator (BAV) scores in the United Kingdom. For the period of our study, Young & Rubicam collected BAV data in 1997, 2000, 2002, 2005, 2006, and 2008. We calculated correlations between our SBBE estimates and BAV aggregate scores (see Table 5). The correlations range between .27 and .35 across years and are significant and comparable in magnitude to correlations reported by Datta, Ailawadi, and Van Heerde (2017). Moreover, the correlations of within-category rankings of SBBE and BAV values range from .52 to .66. These observations provide evidence for the validity of our SBBE measures.
Correlation Between Our SBBE Estimates and BAV Brand Equity Scores.

To the best of our knowledge, Datta, Ailawadi, and Van Heerde (2017) did not report the correlation between their SBBE estimates and the BAV Brand Asset score. Instead, they reported correlations between their SBBE estimates and the four dimensions of the BAV Brand Asset score. The four correlations were .39, .35, .53, and −.14, suggesting an average (unweighted) correlation of .28, which is comparable to our .31 correlation.
Notes: All correlations are significant at p < .001. Following Datta, Ailawadi, and Van Heerde (2017, p. 10), to allow for comparability, we standardize SBBE estimates and BAV scores across brands in each product category.
Relation with Revenue Premium
Ailawadi, Lehmann, and Neslin (2003) proposed revenue premium—operationalized as the differential revenue that a brand generates compared with that of a baseline private label product in its category—as measure of SBBE. We assess how well our intercept-based SBBE measure aligns with Ailawadi, Lehmann, and Neslin's revenue premium measure. To measure revenue premium, we considered quarterly sales of an average private label brand in the product category as our benchmark (i.e., total sales of all private labels in the category divided by the number of private labels in the category). The resulting correlation between our SBBE estimates and the revenue premium measure is .34. The by-category correlation between SBBE estimates and the revenue premium measure has a median of .47, a 10th percentile value of .16, and a 90th percentile value of .63. Moreover, the rank correlation between SBBE and revenue premium is .70. These results provide evidence for the convergent validity of our measure.
Stability of Brand Equity Estimates
Following Ailawadi, Lehmann, and Neslin (2003), we calculated the correlation between brand equity estimates and their first lag to assess the relative stability of our equity estimates over time. The correlation is .96 in our sample, which is highly similar to the values reported by Ailawadi, Lehmann, and Neslin: .96 (local sample) and .98 (national sample). In Web Appendix G, we report correlations between brand equity estimates and their first lag separately for each category. The correlations are above .88 across all 35 product categories. These findings suggest that our estimates do not exhibit erratic changes.
Other Robustness Checks
We also conducted a series of additional robustness checks, reported in Web Appendix L. We briefly mention the nature of these analyses and refer the reader to Web Appendix L for details. We include the following second-stage robustness checks:
Operationalizing CONq via a different time-series filtering approach; Specifying cluster-adjusted standard errors at different levels of aggregation; Accounting for category-specific and brand-specific seasonal patterns; Controlling for marketing-mix activities in the current time period; and Using category medians to operationalize the first four strategic brand factor variables. Controlling for lagged effects of marketing-mix instruments; Allowing the effects of marketing variables to vary across the business cycle; Using value (instead of volume) market share as the dependent variable; Removing lagged market share as an independent variable; and Removing Gaussian copulas from the first stage.
We include these first-stage robustness checks:
Our results are mostly robust across the 12 analyses that we report in Web Appendix L.
Discussion
Our study straddles the brand equity and business cycle literatures. We proposed a framework for examining the impact of macroeconomic expansions and contractions on brand equity, analyzed through the lens of strategic brand factors. Using a utility-based framework, we developed specific hypotheses that underlie this framework. We tested these hypotheses using household panel data on 325 national CPG brands in 35 categories across almost two decades in the United Kingdom. We found evidence that the effect of economic conditions on brand equity is systematically moderated by six strategic brand equity factors.
Managerial Implications
For many firms, brands constitute one of their most valuable assets. Edeling and Fischer (2016) reported that a 1% change in brand equity translates into .33% change in market capitalization. Our study documents that macroeconomic conditions affect brand equity and that the effect depends on the strategic positioning of the brand. Kantar (2021, p. 6) maintains: “In good times and tough times, strong brands win.” In Kantar's work, strong brands are brands that are high on differentiation (captured by our strategic brand factors of premium pricing and high advertising), high on meaningfulness (captured by long line length and high advertising), and high on salience (extensive distribution, umbrella brand architecture, and leading market position). Table 6 summarizes our long-term findings (Figure 3), taking into account both main effects and interaction effects, organized along Kantar's three components of strong brands.
Aligning Our Findings with Kantar's Three Components of Strong Brands.

aLarge effect (as determined by Cohen's d).
The strong negative interaction effect and the strong positive main effect cancel each other out.
Our findings provide broad support for Kantar's claim. Table 6 shows that in expansions as well as in contractions, strong brands do indeed win in terms of creating more brand equity than weak brands, at least if we take the aggregate of the strategic brand factors for each Kantar component.
Yet, the overall support for Kantar's sweeping claim disguises the fact that various strategic brand factors have a notably different effect on brand equity. Some strategic brand factors matter much more than others. In particular, the outcomes of strategic decisions with respect to distribution and line length emerge as the key factors to consider.
In contractions, the effect of distribution is the largest contributor to brand equity by far. It is important to keep this in mind in times of economic turmoil. Further, distribution has a large effect in expansions as well. In short, in good times and bad times, extensively distributed brands win. Managers of brands that have a selective distribution need to consider whether this is a strategic choice or the unwanted result of bad implementation of strategies to expand distribution. If it is a strategic choice, our findings point to the consequences. If it is an unwanted outcome, they may need to either increase investments in channel incentives (Ailawadi and Farris 2020) or, if the firm already spends a lot on trade marketing, examine why channel incentives do not result in expanded distribution.
A wide assortment is also a strong contributor to brand equity in expansions, while it does not destroy brand equity in contractions. Given this finding, expanding the assortment should be a priority for brand management, unless there are other overriding considerations (e.g., lack of resources). As mentioned previously, strategic brand factors are sticky but not immutable. It is possible to change a brand's competitive positioning from a limited-variety brand to a brand with a broad assortment, if brand management so decides. However, this change will take time. A starting point is to invest more in R&D. With the elevated risks of a recession in 2023−2024 (Kiley 2022; Torry and DeBarros 2022), managers planning for the long term might want to go against the general practice of cutting R&D expenditures during recessions (Barlevy 2007; Steenkamp and Fang 2011) and instead invest more in R&D. Given the time it takes to develop new products, they might be ready to launch just when the economy bounces back, reaping full benefits of assortment expansion.
Further, a premium price position and market leadership build brand equity in expansions, whereas advertising, an umbrella brand architecture, and market leadership contribute to brand equity in contractions, but the effect of management decisions with respect to these factors has only a modest effect on brand equity. Thus, although these factors do matter, they are of secondary importance when it comes to growing brand equity. The key takeaway is that if a brand manager wants to grow brand equity for the long term, expanding distribution and line length are the two strategic brand factors to concentrate on.
To further illustrate the role of strategic brand factors in influencing SBBE during the business cycle, Figure 4 presents SBBE of four brands that had “successful” or “unsuccessful” strategic brand factors during the 2008 financial crisis and the expansionary period that followed. We define “successful” and “unsuccessful” strategic brand factors on the basis of our results regarding the strategic brand factors that significantly help or hurt brands during contractions or expansions. As depicted in Figure 4, “successful” strategic brand factors led to growth in SBBE for Johnson’s during the 2008 financial crisis and for Fairy (known as Dawn in the United States) in the expansionary period after the financial crisis. In contrast, brands with “unsuccessful” strategic brand factors, Mornflake and Heinz, lost SBBE during the global recession and the subsequent expansion, respectively.
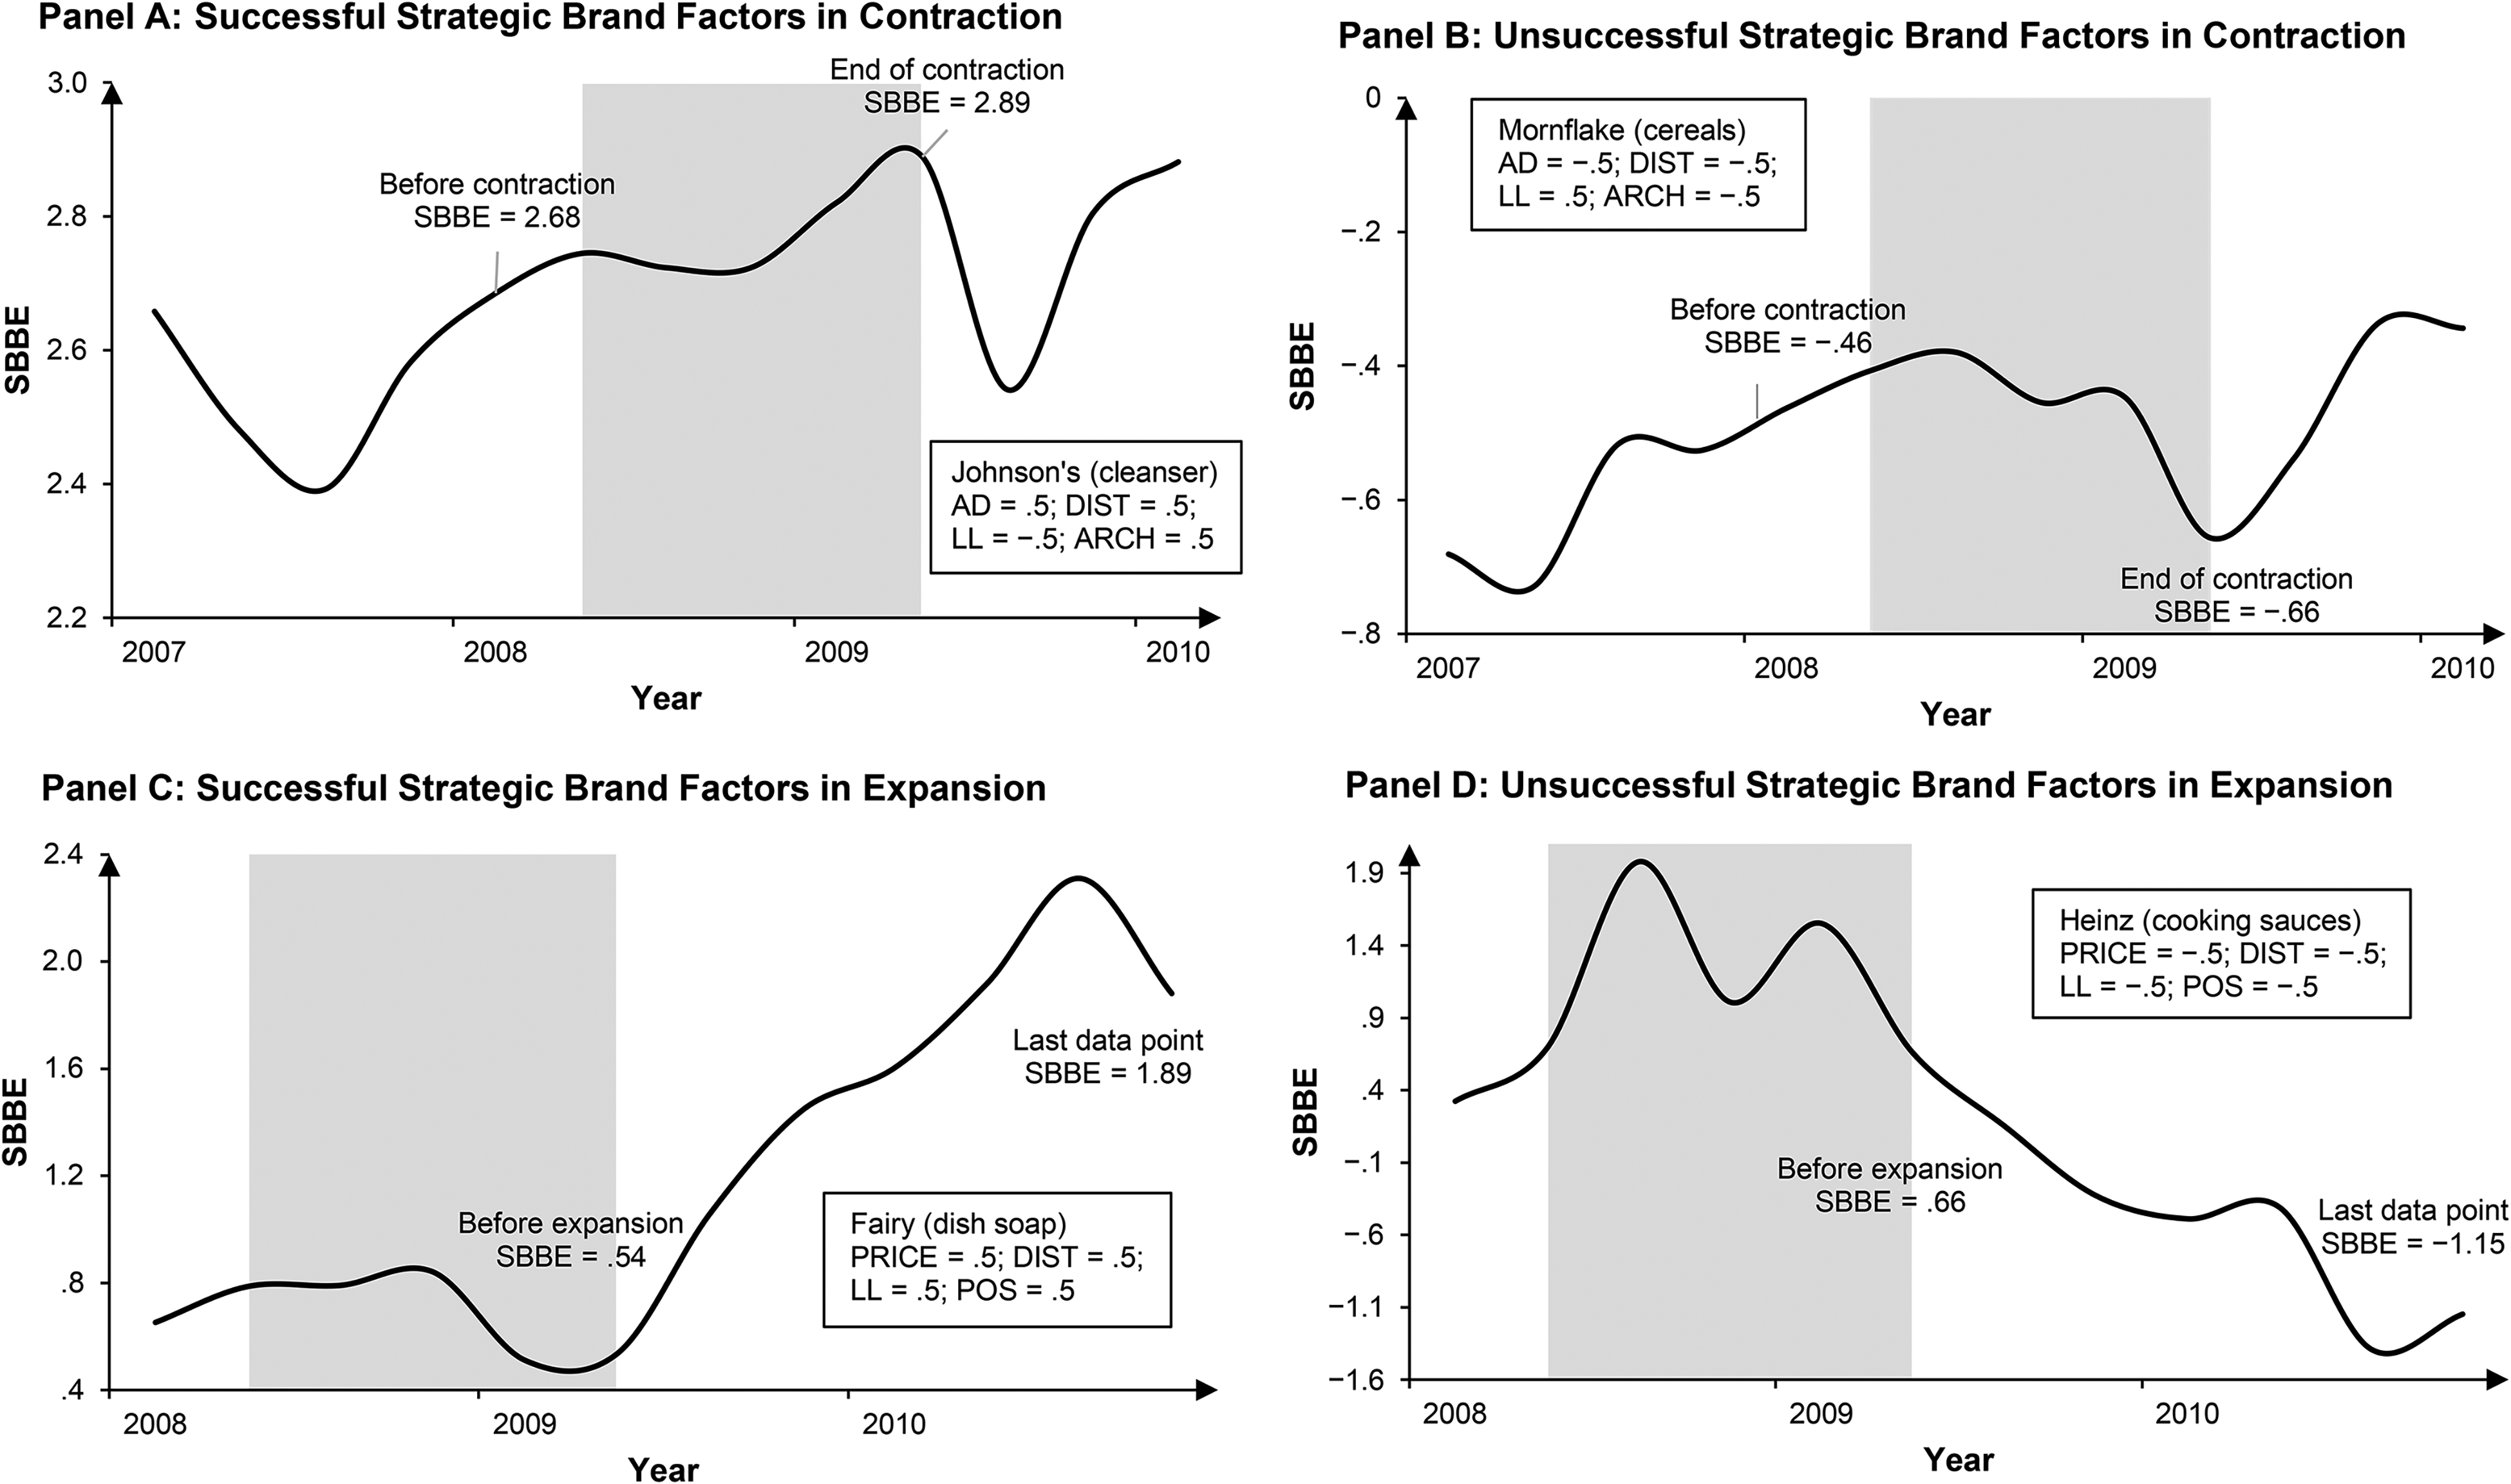
Examples of Brands with Different Strategic Brand Factors in Expansions and Contractions.
Limitations
This study has several limitations that future research should address. Our study focused on the CPG industry in the United Kingdom. Future research should examine other industries in different countries to generalize or nuance our findings and uncover additional patterns regarding how different types of brands are affected by macroeconomic fluctuations. Further, we focused on examining the equity of national brands. It could be argued that in the current marketplace private labels command considerable equity (Keller, Dekimpe, and Geyskens 2016). Since the distribution of private labels is typically restricted to the retailer's own stores and product-level advertising is limited, current brand equity methods are not ideal for the estimation of private label brand equity. We need new methods for the measurement of brand equity of private labels.
Our research examined the overall patterns across brands in 35 CPG categories and did not examine category-specific patterns. Product categories vary along many dimensions, such as consumer involvement (Zaichkowsky 1985), brand relevance (Fischer, Völckner, and Sattler 2010), perceived risk (Bettman 1973), and complexity (Agustin and Singh 2005). Future research should examine heterogeneity in our results across product categories in function of these (and other) important category-level characteristics.
In this research, we focused on SBBE. Although SBBE captures observed value added by the brand in the marketplace, it does not say anything about consumers’ attitudes and thought processes. To better understand why and how consumer attitudes toward different brands change during expansions and contractions, future research could also consider CBBE measures. Finally, we conceptually linked the six strategic brand factors in our framework to Kantar's three components of brand strength. Future research should conduct in-depth conceptual and empirical examination of the relationships between different elements in the two frameworks.
Conclusion
Our research documents the role that management decisions with respect to strategic brand factors play in helping (or hurting) a brand during macroeconomic expansions and contractions. We show that a premium price position and market leadership build brand equity in expansions, whereas advertising, an umbrella brand architecture, and market leadership contribute to brand equity in contractions. However, two factors dominate: distribution and line length. A wide assortment plays a key role in growing brand equity in expansions, and extensively distributed brands win in expansions and contractions. If the brand manager wants to grow brand equity in the long term, expanding distribution and line length are the two strategic brand factors to concentrate on.
Supplemental Material
sj-pdf-1-jmx-10.1177_00222429221122698 - Supplemental material for Brand Equity in Good and Bad Times: What Distinguishes Winners from Losers in Consumer Packaged Goods Industries?
Supplemental material, sj-pdf-1-jmx-10.1177_00222429221122698 for Brand Equity in Good and Bad Times: What Distinguishes Winners from Losers in Consumer Packaged Goods Industries? by Koushyar Rajavi, Tarun Kushwaha and Jan-Benedict E.M. Steenkamp in Journal of Marketing
Footnotes
Acknowledgments
The authors acknowledge help from AiMark and Kantar Worldpanel for providing data for this study. They also acknowledge the kind help of Hannes Datta, Maarten J. Gijsenberg, and Molly Borden and the constructive feedback received from the JM review team.
Associate Editor
Marc Fischer
Declaration of Conflicting Interests
The author(s) declared no potential conflicts of interest with respect to the research, authorship, and/or publication of this article.
Funding
The author(s) received no financial support for the research, authorship, and/or publication of this article.
Notes
References
Supplementary Material
Please find the following supplemental material available below.
For Open Access articles published under a Creative Commons License, all supplemental material carries the same license as the article it is associated with.
For non-Open Access articles published, all supplemental material carries a non-exclusive license, and permission requests for re-use of supplemental material or any part of supplemental material shall be sent directly to the copyright owner as specified in the copyright notice associated with the article.