
Abstract
Can TV advertising affect societal outcomes beyond traditional marketing outcomes such as sales and brand awareness? The authors address this question in the context of the COVID-19 pandemic by analyzing daily advertising and mobility data for 2,194 counties across 204 designated market areas in the United States. By employing a border identification strategy that exploits discontinuities across television markets, the authors find a significant positive causal relationship between TV ads from brands containing COVID-19 narratives and people's social distancing behavior, while controlling for government policy interventions (e.g., shelter-in-place, mask mandates). The estimated effects are almost 11 times larger in counties without government policy interventions compared with counties with policy interventions. Notably, while the overall impact of government ads on social distancing behavior is nonsignificant, the effect becomes significantly negative (positive) in the presence (absence) of policy interventions. The results are robust to alternative model specifications, variable operationalizations, and other data considerations. The findings underscore the critical role that spillover effects from brand-sponsored TV ads can play during major public crises, including mitigating the lack of local governments' policy interventions. The findings bear substantive implications for managers and policy makers regarding how advertising strategies may help improve public health outcomes or advance social good.
The primary objective of advertising is typically to influence brand-related outcomes. As such, there have been numerous investigations into the effects of advertising on a multitude of brand-related outcomes, including market share, sales, firm value, awareness, and competition (Köhler et al. 2017; Sethuraman, Tellis, and Briesch 2011). However, advertising effects can also spill over to influence nonmarketing outcomes such as public health and social good, although rigorous academic work studying such effects on nonmarketing (societal) outcomes is limited (e.g., Kim and KC 2020; Shapiro 2022). Such social effects of marketing have recently been in the spotlight as academics and practitioners rethink the role of marketing in today's society (Chandy et al. 2021). The need for research on societal outcomes becomes particularly pronounced in the face of public health emergencies and other crises wherein marketers may play an important role in influencing individual behaviors. Public health crises (especially outbreaks, epidemics, and pandemics) are no longer rare events and are increasingly likely in the future (Marani et al. 2021). The initial response to such crises then becomes crucial to determining the extent of the impact on public health (Mizrahi, Vigoda-Gadot, and Cohen 2021). Primary mitigation steps to most outbreaks are typically quarantining and social distancing. How then can marketing communications encourage individuals to engage in socially beneficial behaviors? Using the COVID-19 pandemic as an empirical setting, our research is a first step in understanding how (if at all) marketing can influence such behaviors.
COVID-19 has had an unprecedented impact on society, including on public health 1 and the economy (Cutler and Summers 2020). During the early stages of the COVID-19 pandemic in the United States, the spread of the virus was rapid, with no available vaccines. Local governments predominantly used nonpharmaceutical interventions such as mask mandates and stay-at-home orders to prevent the rise in infections. Social distancing played an important role in reducing the COVID-19 growth rate and the number of deaths (Courtemanche et al. 2020). However, the associated policies and communications at the local (i.e., state and county) government level was inconsistent and often chaotic (Haug et al. 2020). This, along with other factors such as (lack of) belief in science (Brzezinski et al. 2021) and political ideology (Painter and Qiu 2021), contributed to varying degrees of compliance with critical social distancing norms required to contain the spread of COVID-19 across the United States (Courtemanche et al. 2020).
Brands, however, were nearly immediate in their response. Even in the early days of the pandemic, brands started incorporating COVID-19-related narratives in their TV advertisements (as early as February 27, 2020). Some of these ads directly or indirectly promoted social distancing measures. For example, Burger King's “Stay Home of the Whopper” ad urged people to order food through their contactless delivery service. Several other COVID-19-related ads did not explicitly promote social distancing. Examples include the “Most Important Meals” ad by McDonald's, which talked about feeding first responders for free, and Kraft Heinz's “We Got You America” ad, which focused on making its products available to people in difficult times. In fact, certain brands adopted narratives that could be perceived as promoting behaviors contrary to social distancing (e.g., BMW's “Rejoin the Road” and Infiniti's “Back into the World” ads). In summary, brands adopted a wide variety of COVID-19-related narratives that were not necessarily aimed at promoting social distancing.
While COVID-19-related ads seemed to garner more attention, and brands seemed to enjoy a public perception of being more “reactive” to the pandemic (Edelman Trust Barometer 2020), it is unclear how—if at all—such advertising led to socially beneficial outcomes. This article takes the first step toward understanding and documenting the role of brand advertising in influencing socially beneficial behaviors in the context of a global public health crisis, even if it was unintended. Specifically, we ask: (1) Can TV advertisements that include COVID-19-related narratives influence societal outcomes such as social distancing? If so, does the source (government vs. brands) matter? (2) Does the effect vary depending on the presence or absence of public policy interventions (such as stay-at-home mandates and mask mandates)? In other words, can brands “fill the void” in the absence of government policy interventions? (3) What potential mechanisms may be driving this effect?
To address these questions, we assemble longitudinal data from multiple sources and analyze the causal relationship between COVID-19-related ads and the social distancing behavior of individuals while controlling for various fixed effects and related factors. We exploit sharp spatial discontinuities along television markets for exogenous variation in advertising, otherwise known as the “border identification” strategy, to estimate the advertising effects. We find that exposure to COVID-19-related ads from brands significantly affected aggregate social distancing behavior. However, the effect is moderated by local-level government policy interventions. Specifically, in the presence of government policy interventions, a 10% increase in the percentage of COVID-19-related ad gross rating points (GRPs) (from brands) from the mean leads to a .74% increase in aggregate social distancing behavior in the region. However, the impact on social distancing increases by almost 11-fold (i.e., 8.32%) in the absence of policy interventions, thereby offering empirical evidence of the extent to which brand advertising may offset/mitigate lapses in local government policy interventions during a public health crisis. We also find that the source of advertising matters. On average, while brand ads positively and significantly impact social distancing, government ads do not. However, we find that government ads have a significant negative (positive) effect on social distancing in the presence (absence) of policy interventions and a negative effect in more rural counties. Across our various analyses, we find that the standardized coefficients for brand ads are always greater in magnitude than for government ads.
We discuss and empirically test the role of salience as a possible mechanism by exploring heterogeneous advertising effects. Next, we empirically show that COVID-19-related ad effects are most pronounced in counties where pandemic salience is lower and diminished for counties where the salience is already high. We also find heterogeneous advertising effects based on brand-level and demographic variables. For instance, the results indicate that the effect of advertising on social distancing behavior is amplified among more educated populations but attenuated in more conservative counties, which tend to contain a higher proportion of white residents. Overall, our findings bear substantive implications for the power of brand advertisements to affect important societal outcomes and for government communication strategies. We discuss the implications of our findings for other public health emergencies (e.g., climate change) as well.
Research Contributions
Extant research on advertising can be broadly classified based on whether the outcome of interest is brand-related (e.g., sales, demand, awareness) or societal (e.g., drunk driving, birth rate, work absenteeism) and whether the advertising effect on the outcome is a primary effect or a spillover. Figure 1 lists representative studies based on this broad classification.
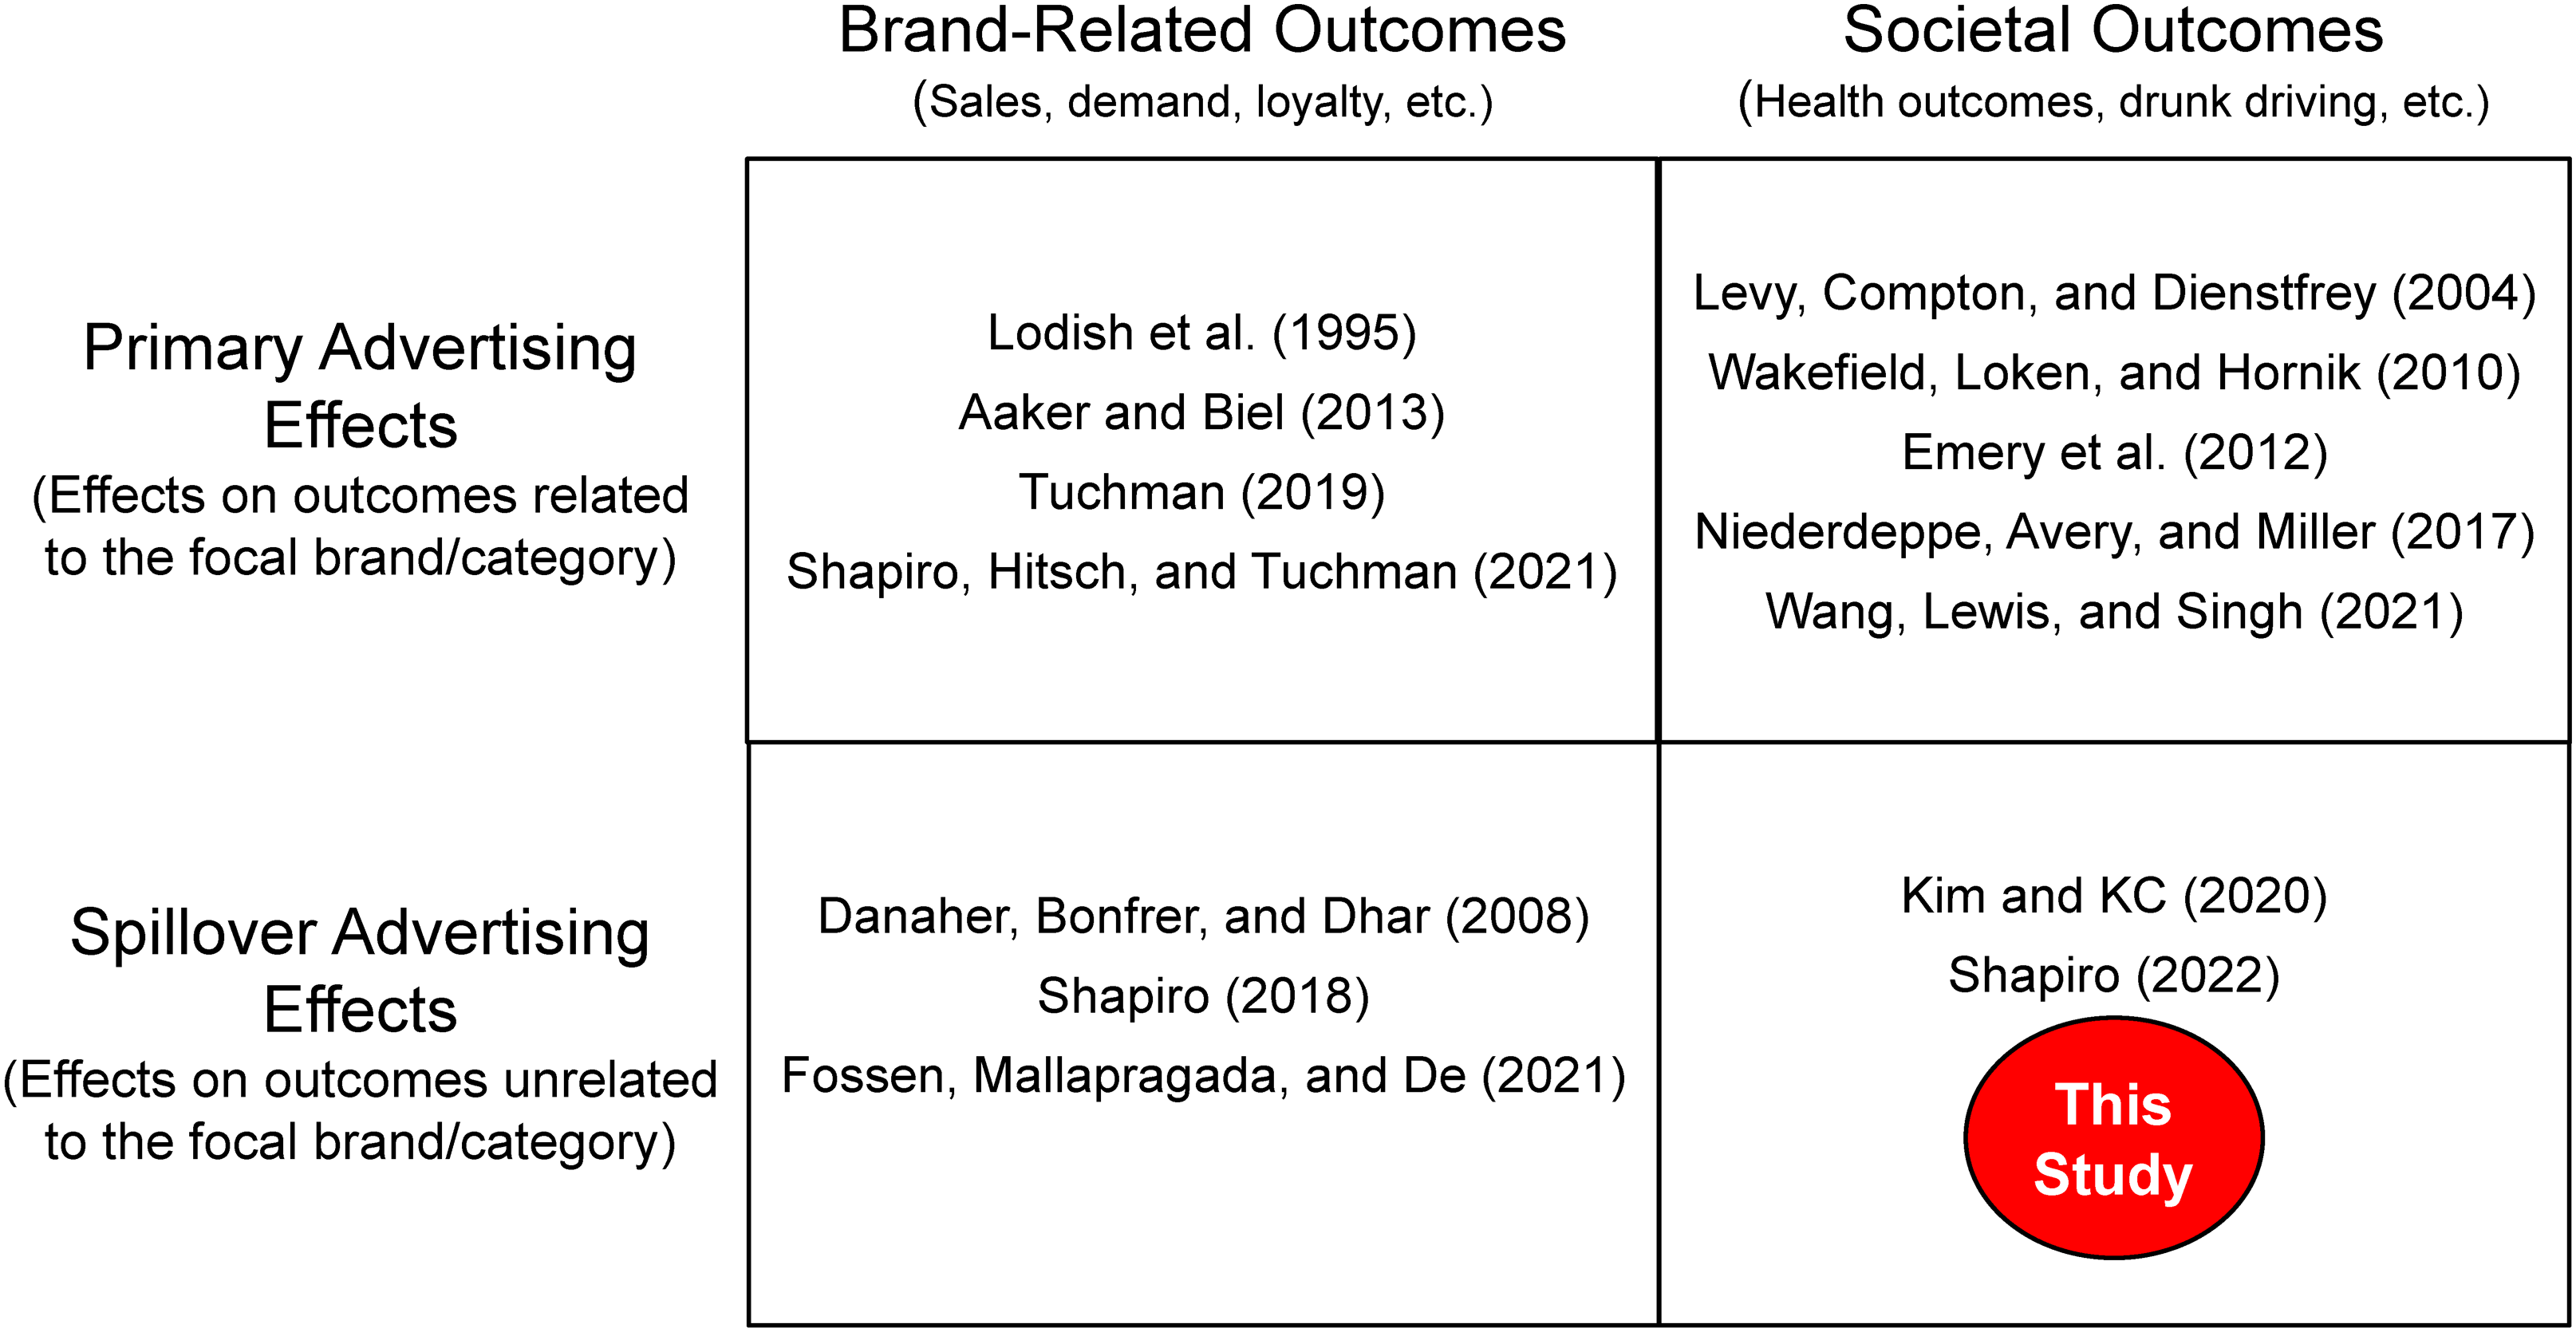
Representative Literature on Advertising Effects.
A majority of studies from extant research are related to analyzing the primary impact of advertising on brand-related outcomes (e.g., Aaker and Biel 2013; Lodish et al. 1995; Shapiro, Hitsch, and Tuchman 2021). Fewer studies in comparison have investigated the impact of advertising on social-behavioral outcomes, with mixed results. For example, some researchers find significant effects of TV advertising on smoking cessation (Emery et al. 2012) and drunk driving (Niederdeppe, Avery, and Miller 2017), while others find modest to nonsignificant effects (Levy, Compton, and Dienstfrey 2004; Wakefield, Loken, and Hornik 2010; Wang, Lewis, and Singh 2021). A growing stream of research has focused on studying the “spillovers” of advertising on brand-related outcomes (e.g., Danaher, Bonfrer, and Dhar 2008; Fossen, Mallapragada, and De 2021; Shapiro 2018). In particular, ad effects that influence outcomes unrelated to the focal brand are referred to as spillover effects.
Our research aims to investigate the spillover effects of TV advertising that could potentially contribute to a societal outcome. This area of research is represented by the bottom-right cell of Figure 1. A review of literature in this domain indicates only a handful of empirical studies, which includes the work of Kim and KC (2020) and Shapiro (2022). Using antidepressant drug advertising as context, Shapiro finds that the impact of direct-to-consumer ads on new prescription behavior is positive and can lead to reductions in workplace absenteeism. Kim and KC study the impact of erectile dysfunction drug advertising on birth rates and find that such advertising led to a significant increase in birth rates in the United States.
We contribute to this emerging stream of research by investigating whether and to what extent TV advertising from brands positively affected an important antecedent of a public health outcome during a global pandemic, namely social distancing behavior. Further, our research takes place in the context of a major public health emergency in which government policy interventions are expected to play a role. As such, unlike prior studies in this domain, our context enables us to estimate the effect of TV advertising while accounting for local governments’ heterogeneous policy interventions that were often inconsistent and uncoordinated. Our work is uniquely different from studies in this stream of literature in at least two important ways. First, to the best of our knowledge, ours is the first study that examines the socially beneficial spillover effects of advertising in the context of a global public health crisis. Second, we demonstrate the critical role that brands can play when government policy interventions are absent or inadequate during an emergency; that is, we show that ads from brands can help mitigate (to some extent) lapses in government policy measures in dealing with emergencies. From the standpoint of policy makers, we show that the effect of government ads depends on government policy interventions; that is, government ads positively influence social distancing in places with no policy interventions and negatively in places with policy interventions.
Our study also contributes to the fast-growing and critical body of literature on compliance with social distancing in response to the COVID-19 pandemic. Studies have identified several factors such as access to the internet (Chiou and Tucker 2020), viewership of conservative news (Simonov et al. 2022), belief in science (Brzezinski et al. 2021), economic status (Wright et al. 2020), and political ideology (Painter and Qiu 2021) that influence people's social distancing behavior. However, there is a limited (if any) exploration of the role of brand advertising in the context of social distancing. To the best of our knowledge, this is the first study that looks at social distancing with a marketing lens and establishes COVID-19-related brand ads as a causal factor influencing social distancing behavior.
The remainder of this article is organized as follows. First, we discuss the data sources used in our analyses and provide descriptive evidence to motivate further empirical investigations of our research questions. Second, we discuss our empirical approach and identification strategy. Third, we discuss our main findings, robustness analyses, potential mechanisms underlying the effects, and heterogeneity analyses. We conclude with a summary of our findings and discuss implications, limitations, and future research opportunities.
Data
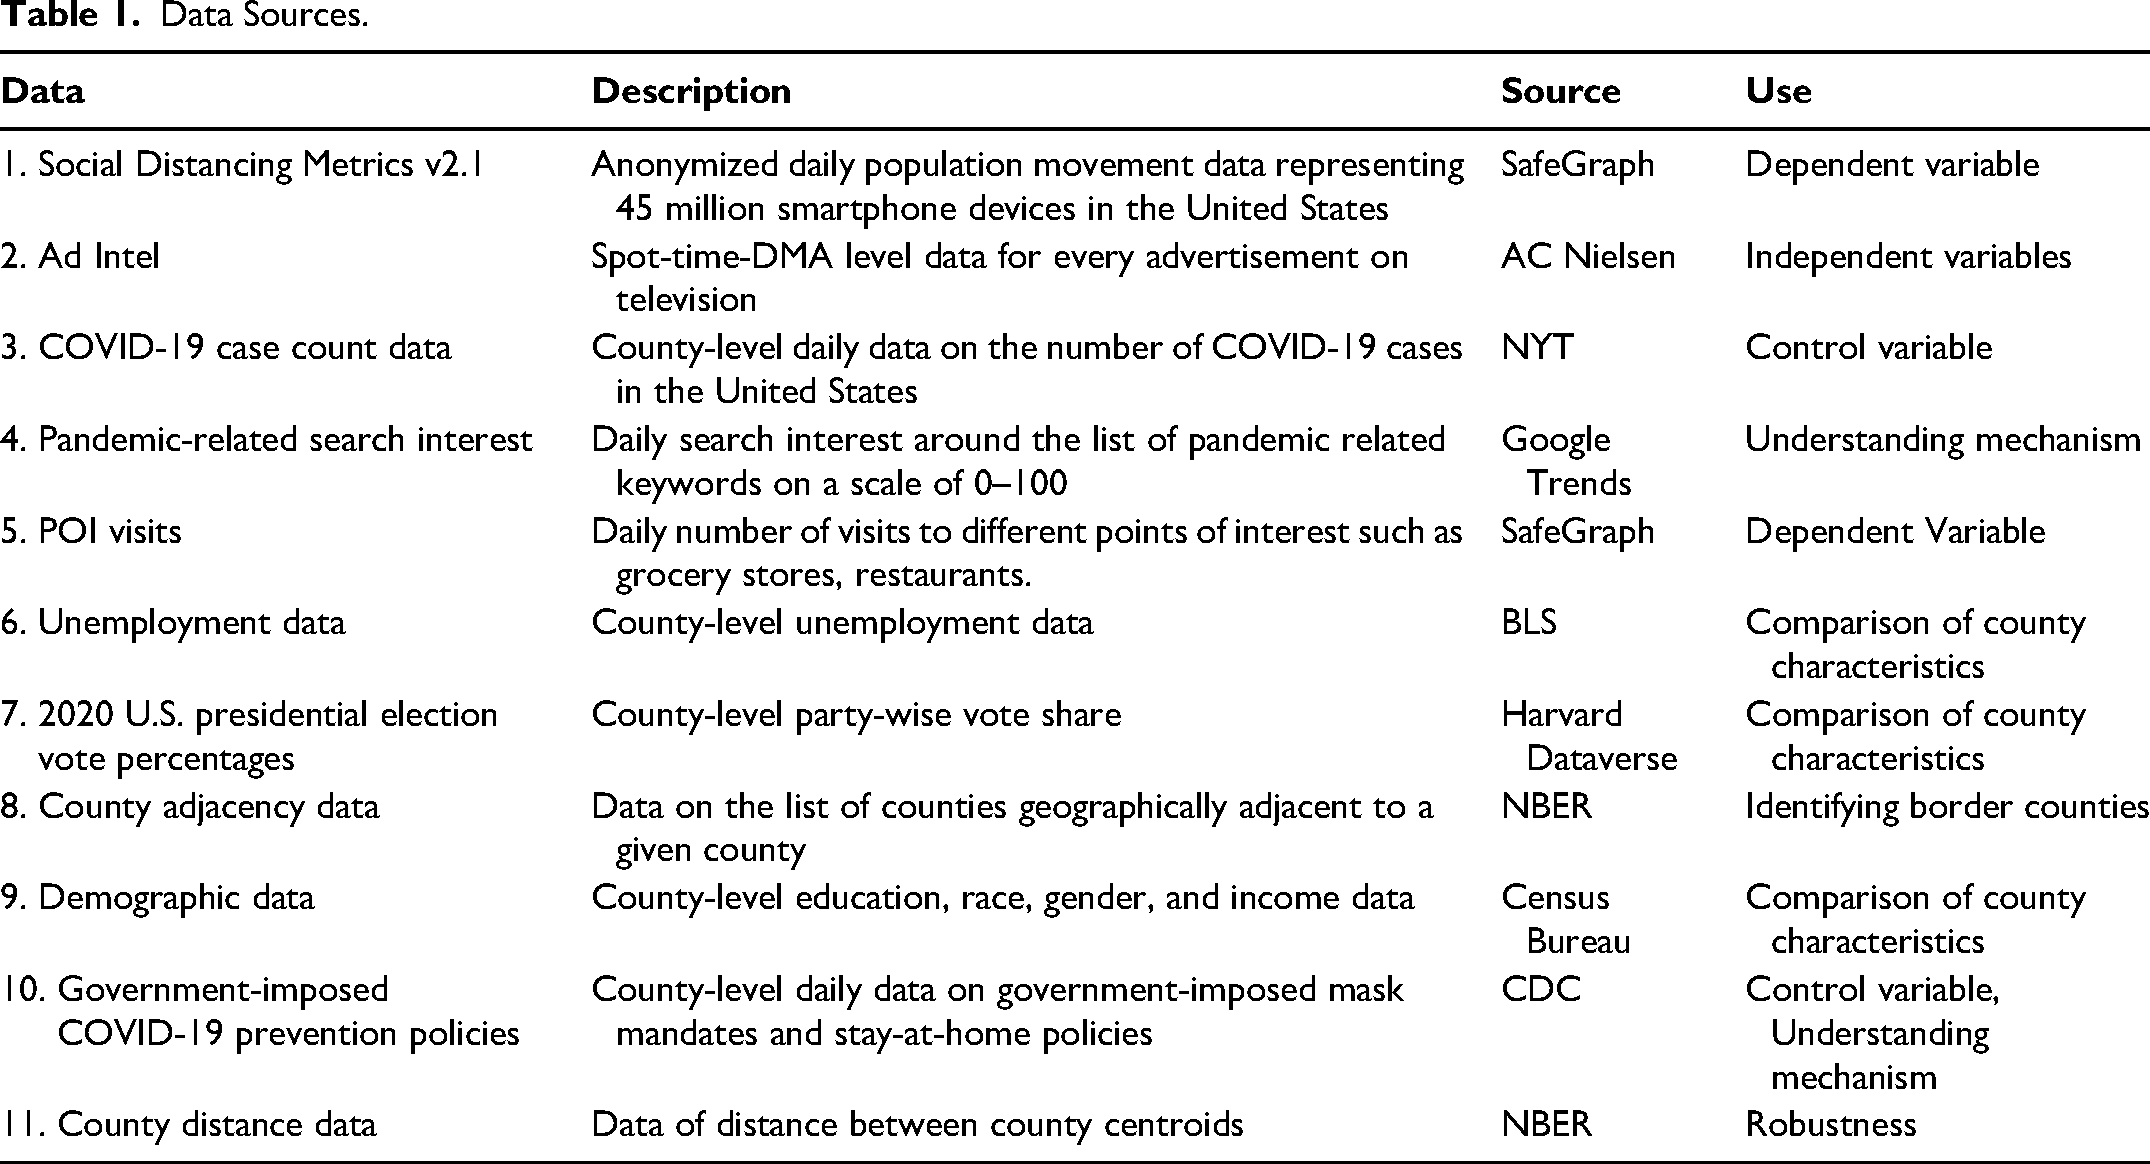
We obtain data from multiple sources and choose an observation period of January 1 to May 31, 2020, for our analyses. This timeframe represents the onset of the pandemic and a time when some brands started broadcasting COVID-19-related ads. It also represents the period when there was considerable confusion and inconsistency in policy mandates from local governments, thereby offering rich variance in the data for empirical investigations. The relevant data are not available in a single publicly accessible data set. Therefore, we collected and assembled a data set from 11 different sources, as summarized in Table 1. Table 2 contains descriptive statistics of the variables used in our models. A detailed description follows.
Data Sources.
Descriptive Statistics of Model Variables.
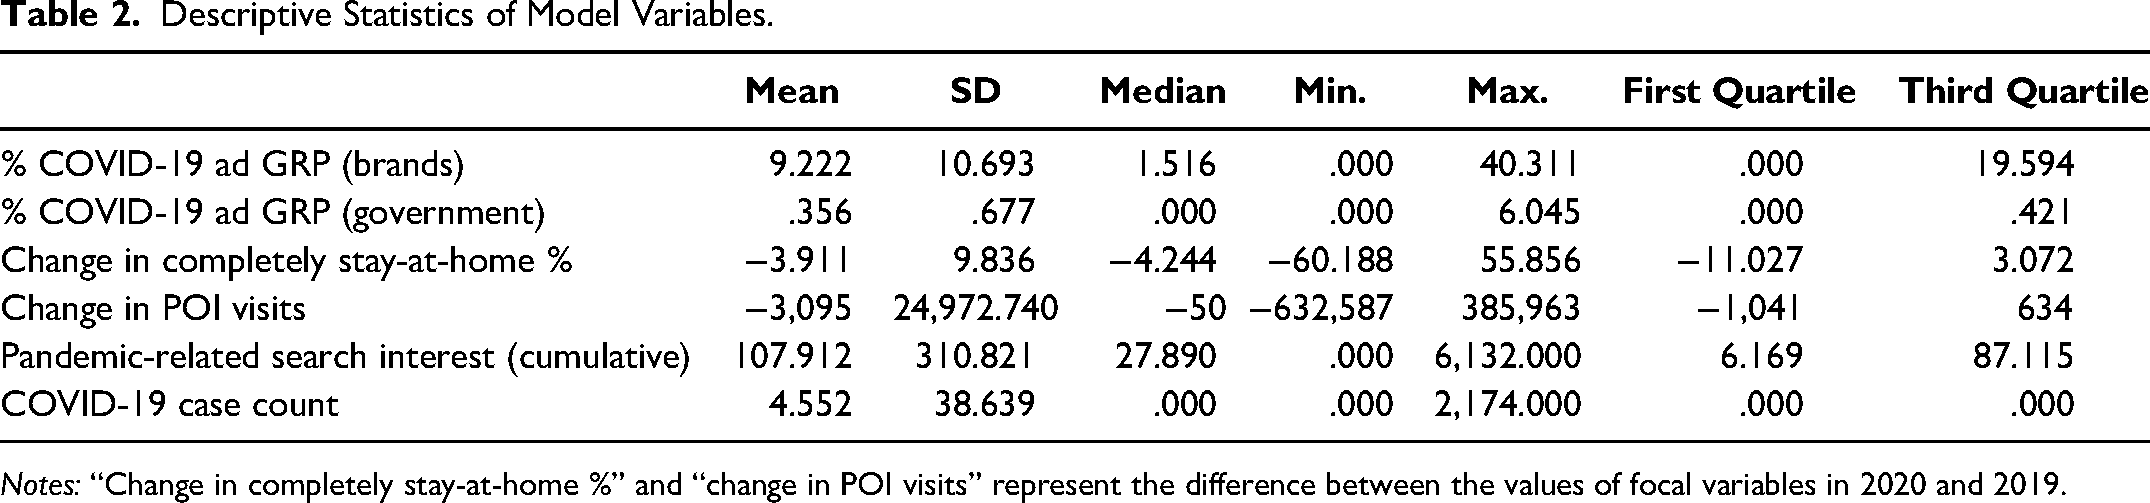
Notes: “Change in completely stay-at-home %” and “change in POI visits” represent the difference between the values of focal variables in 2020 and 2019.
Social Distancing Behavior
Social distancing data were obtained from SafeGraph, a data company that aggregates anonymized location data from numerous applications to provide insights about physical places. We use the Social Distancing Metrics v2.1 data set, which is built using a daily panel of GPS pings from approximately 45 million anonymous mobile devices. The default option on the tracked mobile phones is “opt-in” with an option for manual opt-out. The panel of devices in the data is geographically and demographically representative, and the correlation between the panel's and the U.S. Census's population density at the county level is 97% (Brzezinski et al. 2021). SafeGraph determines a specific nighttime (i.e., home) location of each mobile device over a six-week period to a “home area” of approximately 153 m × 153 m. When the data are provided to researchers (such as in our case), the home location for each device is aggregated at the Census Block Group (CBG; designed to contain around 600–3,000 people) level, and CBGs with fewer than five devices are omitted. Some mobile phones may get dropped from the sample if location tracking apps are deleted or the phone is permanently switched off. In our data, we observe 18.83 million devices daily across the United States (approximately 5,848.3 devices in a county). We also collect the data for the corresponding period in the year 2019 for deseasonalizing the data.
We consider people's tendency to stay at home as an indicator of their social distancing behavior (e.g., Brzezinski et al. 2021; Painter and Qiu 2021). This choice is based on the rationale that when people stay at home (either completely or for an increased amount of time), they automatically come into less contact with other people and thus are more socially distant. The reliability of SafeGraph's mobility measures has been validated by prior studies in two major ways: (1) with consumer data (Kang et al. 2020) and (2) by comparison with other mobility data (Huang et al. 2022). For example, Kang et al. (2020) find a high correlation (Pearson's r > .93) between peoples’ reported mobility (from the American Community Survey) and SafeGraph mobility data, while Huang et al. (2022) find that the mobility of individuals captured by geotagged Twitter data in 2019 correlates strongly with the mobility of individuals documented by SafeGraph (Pearson's r = .86). In addition, we triangulate our findings using alternative measures of social distancing (time, number of devices, visits/footfalls, etc.). Please see Web Appendix W1.A for more details.
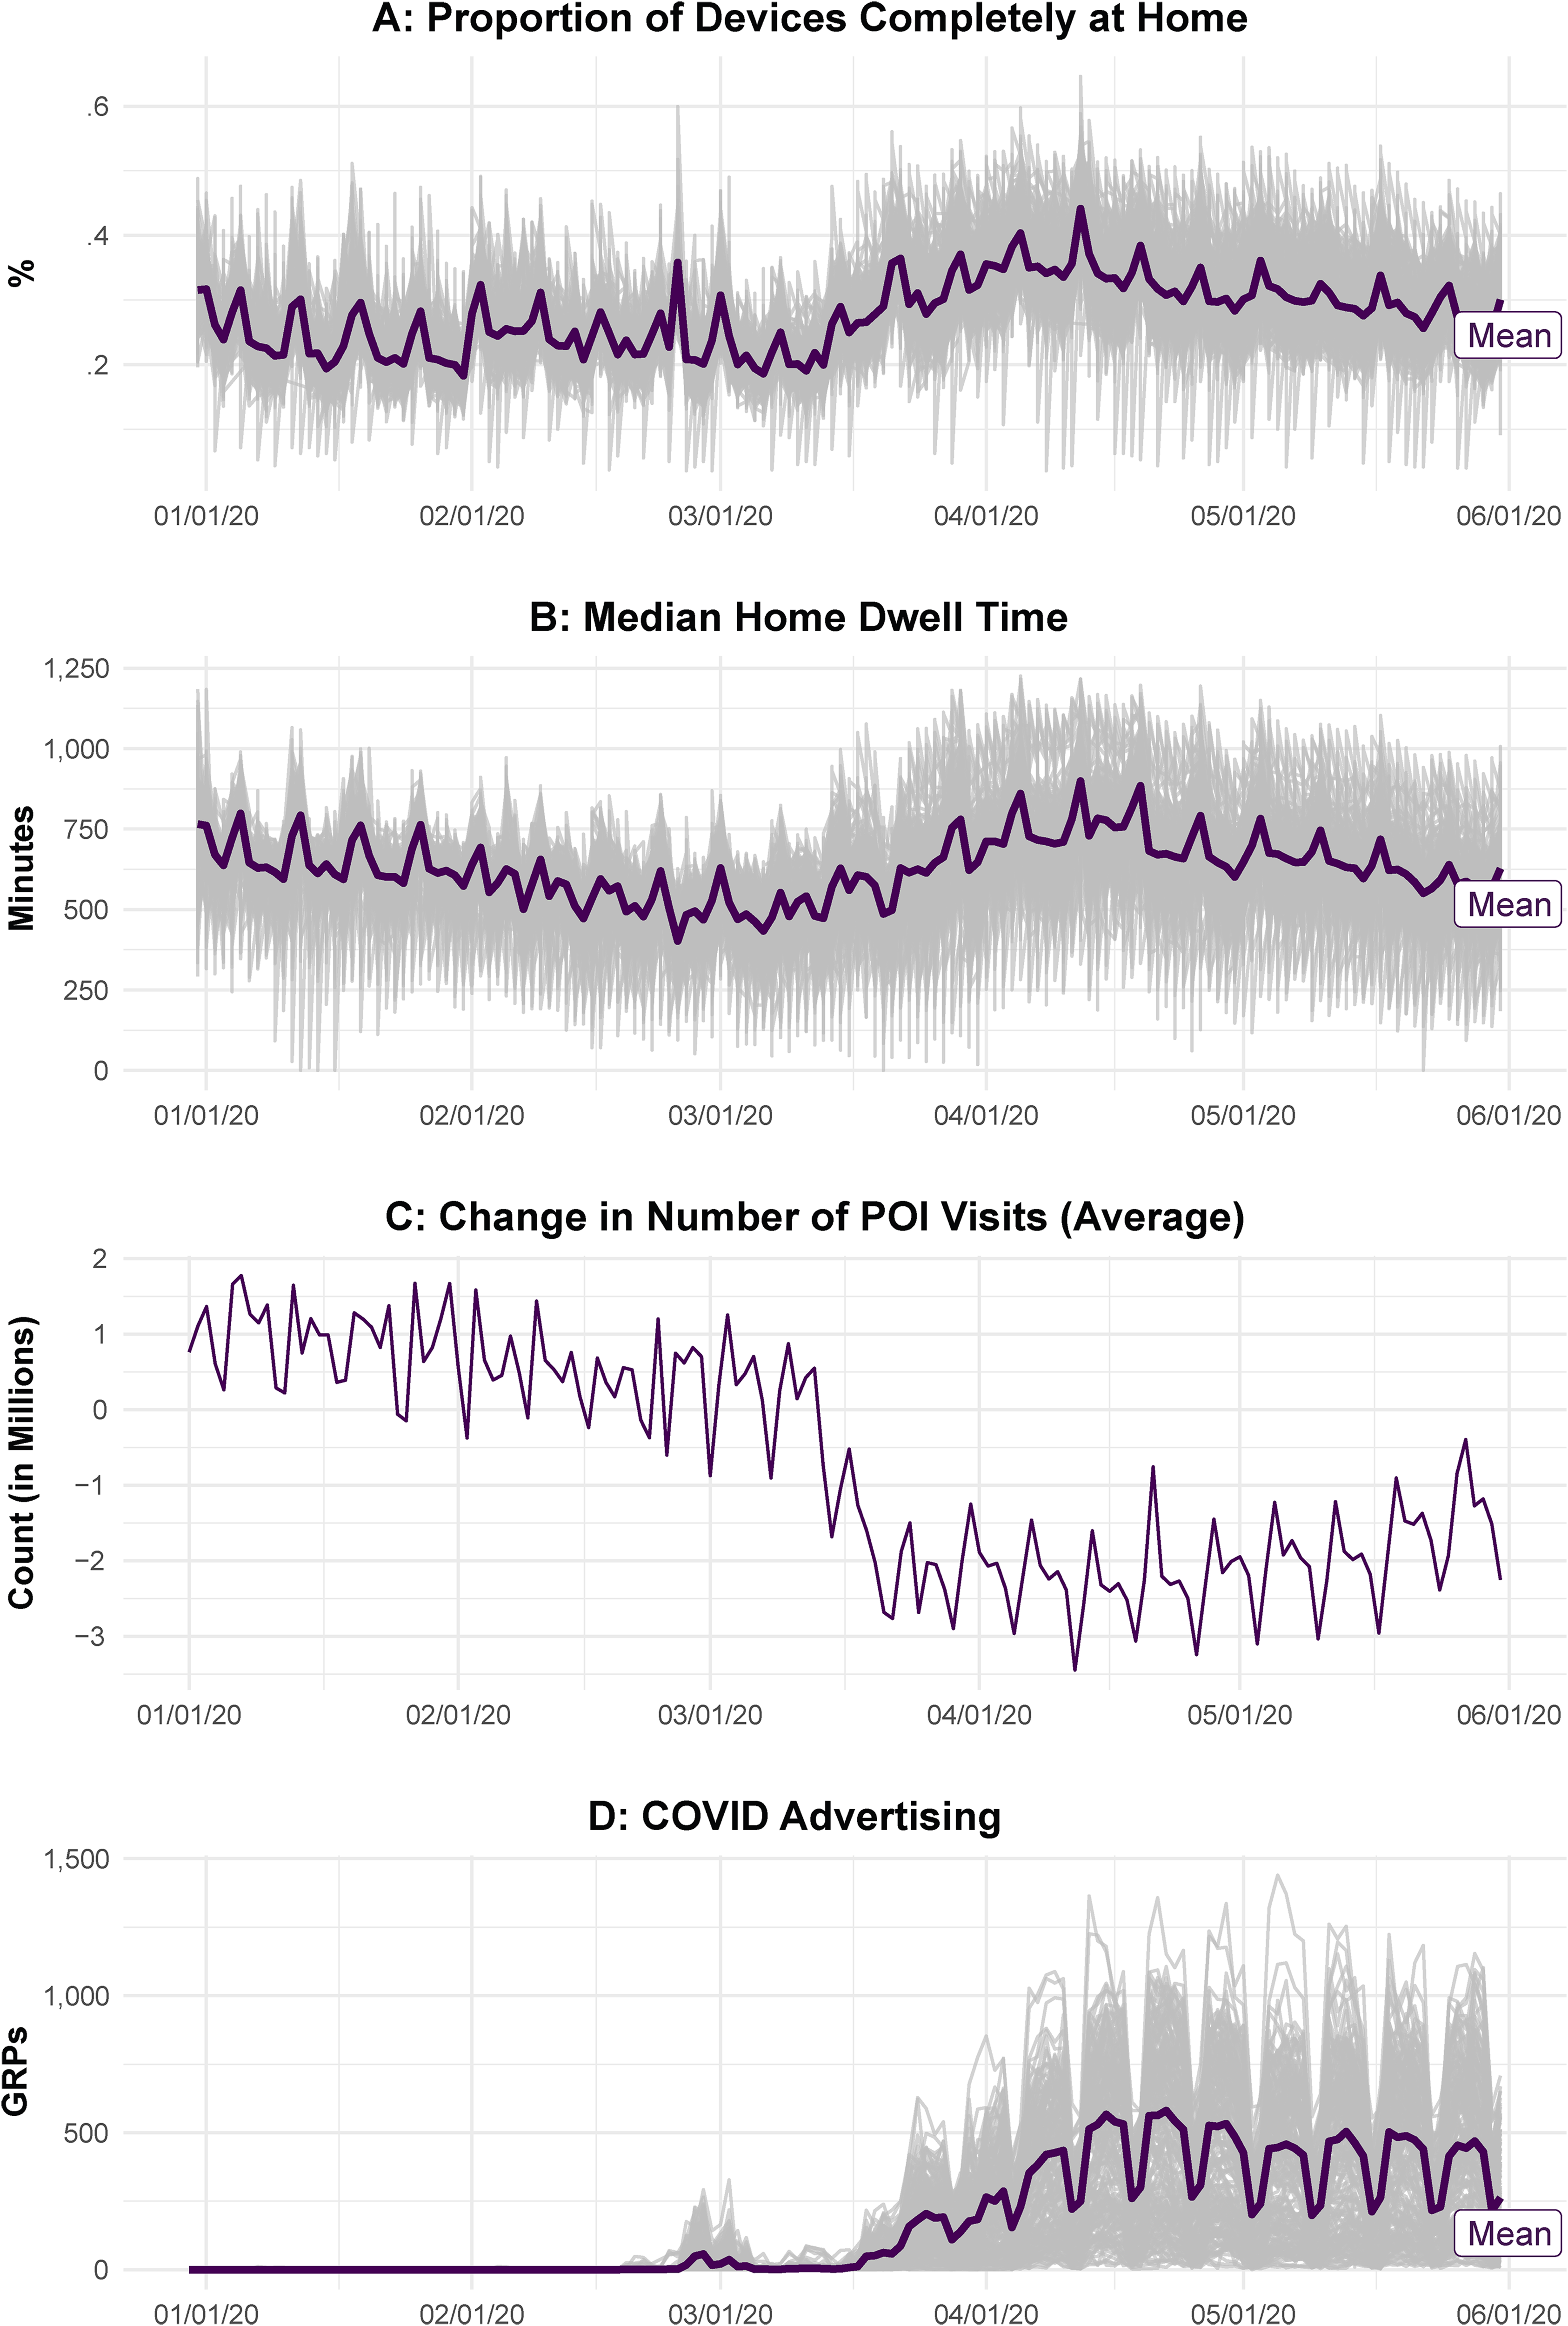
Panels A and B in Figure 2 plot the temporal variation in the social distancing across the counties. Panel A reports the daily proportion of devices staying completely at home, while Panel B reports the median home dwell time (in minutes) for a county on a given day. The thin lines describe the completely stay-at-home behavior for each county in the data, and the thick lines denote the mean completely stay-at-home behavior. A few patterns are noteworthy. We see that the general trend in panels A and B are remarkably similar, suggesting that these two variables may be capturing the same behavior—social distancing. There is a notable increase in completely stay-at-home behavior after March 13, 2020, when the federal government declared a national emergency for COVID-19. Further, there is significant variation across counties. Some counties display higher completely stay-at-home behavior (perhaps due to increases in COVID-19 cases or stay-at-home policies), while others are at lower levels. We also see from Figure 2 that there seem to be day-level peaks and troughs in completely stay-at-home behavior. Since our subsequent analysis is at the day level, we account for these differences.
Mobility Patterns.
We can also study social distancing from the perspective of how much people travel outside of their homes to points of interest (POIs), such as grocery stores and restaurants. We use SafeGraph's Patterns data set to obtain the daily number of visits to various POIs. These data are collected by SafeGraph using a process similar to that used for the Social Distancing Metrics v2.1 data set (see Web Appendix W1.B for additional details and analyses using the Patterns data set). Figure 2, Panel C, plots the number of visits to different POIs at the county level. We see that there was a significant decrease in footfalls during mid-March. Panels A through C in Figure 2 show a clear behavioral response (in terms of social distancing) to the pandemic.
From a measurement standpoint in our main analyses, we operationalize social distancing as people's completely stay-at-home behavior (SDct) and calculate it as the percentage of mobile devices staying completely at home on a given day in a county. Our measure (completely stay-at-home behavior) is a conservative measure of social distancing because it only considers devices that completely stayed home on a given day. To account for seasonality (e.g., holidays, seasons), we focus on the difference between completely stay-at-home behavior on a given day in our observation window (
Television Advertising
We obtain designated market area– (DMA-) level data for every spot TV advertisement from Nielsen's Ad Intel database for the period January 1 to May 31, 2020. 2 The data include advertising occurrences across the United States, which is segmented into 210 DMAs. For each advertisement, we observe the day and time of ad occurrence, number of exposures (units), expenditures (in dollars), GRPs, the genre of program, the brand name, and the product category. GRP is a measure of advertisement intensity and is computed as a percentage of per capita impressions. One could also measure advertising intensity using the frequency of ad exposures (units) and ad spend (expenditure), but both of these measures suffer from certain drawbacks. For example, ad frequency fails to account for the reach of individual ads that may vary by the time of day or type of program it was shown on. Similarly, ad spending may differ by DMAs because the cost of purchasing ads varies by media market. Therefore, consistent with the prior literature (Tuchman 2019; Wang, Lewis, and Schweidel 2018), we use GRPs as our measure of advertising intensity. The data also include an indicator to identify whether an advertisement was related to the COVID-19 pandemic. Nielsen designated ads as being related to the COVID-19 pandemic if (1) the keywords “Coronavirus,” “crisis,” “pandemic,” “social distancing,” “self-quarantine,” “we’re all in this together,” “hard times,” “tough times,” “keep you safe,” “stay inside,” or “our company is changing” appeared in the ad or (2) the ad featured people wearing face masks. We externally validated Nielsen's classification scheme manually using independent coders and found a high congruence (see Web Appendix W1.C for details).
Panel D in Figure 2 shows the temporal variation in COVID-19-related ads (GRPs) that were aired across U.S. counties. We observe that, as the pandemic raged through the country, brands modified their advertising to include messaging about the pandemic. We operationalize our primary covariate of interest, COVID-19-related advertising intensity for a given county on day (t), as the percentage of COVID-19-related advertising GRPs relative to overall advertising GRPs in the same county and day (%COVIDAdsct). The operationalization of this variable varies by source (brands and government). In robustness analyses, we use alternative measures of advertising intensity (e.g., actual GRPs of COVID-19-related ads).
Additional Data Sources
We obtain county-level mask mandate and stay-at-home policy types (e.g., advisories, restrictions) and implementation dates across the United States from the Centers for Disease Control and Prevention (CDC) for our observation period. These policies or interventions from local governments (e.g., state, county) varied from advisories and recommendations to stringent mandatory stay-at-home orders. The information was available for 3,142 counties, out of which 1,696 (53.98%), 820 (26.1%), and 350 (11.14%) counties had no policies in place as of March 25, April 1, and April 10, 2020, respectively. Further, as of April 1, 39.4% (1,238) of the counties did not have a government-imposed mandatory stay-at-home order in place. We collect daily data on the COVID-19 infection numbers for each county for our observation period from the New York Times. In addition, we obtain demographic data from the U.S. Census Bureau and poverty and unemployment data from the U.S. Bureau of Labor Statistics. To identify bordering counties (used in our identification strategy) and to measure the distance between counties (used for robustness analyses), we use the county adjacency and county distance databases, respectively, from the National Bureau of Economic Research (NBER). Finally, we collect data on county-level vote shares in the 2020 U.S. presidential election from Harvard Dataverse and the daily search interest data of pandemic-related keywords from Google Trends.
Methodology
The identification of advertising effects can be challenging due to endogeneity issues arising from strategic decision making on the firm's side. For instance, the firm may target specific regions based on past sales or specific demographic/regional profiles that may lead to selection and reverse causality concerns. We address these concerns next.
Empirical Strategy
We exploit the variation arising from how TV advertisement purchasing and media markets are set up. Specifically, there exist sharp discontinuities in the level of advertising at the borders of local advertising markets that create exogenous variation. The usefulness of such market-level discontinuities (or “border strategies”) has been documented in the literature. For instance, the border identification strategy has been employed to study advertising effects in health insurance and pharmaceutical contexts (Shapiro 2018), e-cigarettes (Tuchman 2019), and success of satellite TV operators (Yang, Lee, and Chintagunta 2021). The border identification strategy is essentially a special case of a regression discontinuity approach that leverages exogenous variation just above and below a cutoff. The cutoffs, in our context, are spatial in nature. That is, geographic borders of local advertising markets act as sharp cutoffs and create plausible exogenous variation in advertising for individuals living very close to the market boundary.
In our context, the local advertising market indicator is a DMA, defined as a geographical area of grouped counties in which local television viewing is measured by Nielsen. A DMA may include urban centers and suburbs, as well as surrounding counties where small towns and rural homes receive the same television signals. Local advertising spots are sold at the DMA level, so all households in a specific DMA see the same TV ads. In addition, households on opposite sides of a DMA border may be exposed to different advertising levels due to regional variations in advertising. The effect of COVID-19-related ads on social distancing behavior is then identified by comparing the social distancing behavior (identified through pings from mobile devices) on each side of the DMA border. The identifying assumption is that the border counties are subject to the same unobserved shocks such that adjacent counties on each side of a DMA border may act as counterfactuals to one another. Consequently, in the absence of advertising, mobility patterns in both sets of counties should follow the same trend. This allows us to think about the DMA border counties as natural “experiments” consisting of two treatment groups where the variation comes from differences in advertising (treatment) levels after controlling for a host of observed and unobserved factors at the DMA, border, county, and time levels (Shapiro 2018).
The unit of our analysis is at the border county–day level because it is the level at which we observe both the advertising information (available at the DMA level) and the mobility data (available at the CBG level) without having missing or sparse data points. Out of the 210 DMAs into which the United States is divided, Nielsen categorizes 130 DMAs as “full discovery markets” because all television advertisements in these markets are measured using monitoring devices. For the remaining markets, Nielsen reports only those advertisements that match ads airing in the full discovery markets or national TV. Therefore, to avoid biases in our results due to measurement errors (e.g., incomplete or inaccurate data on advertisements), we perform our analysis using the top 100 ranked DMAs. Our final data include 97 DMA markets spanning 894 counties in the United States (Honolulu, Mobile-Pensacola, and Harlingen-Weslaco-Brownsville belong in the top 100 DMAs but do not share any borders with other DMAs in the top 100 and thus are not part of the analysis). We identify 159 DMA-border-county pairs (a DMA-border-county pair consists of two sets of border counties on opposite sides of a DMA border), or 318 border-county sets that serve as natural experiments to assess the advertising effect. Figure 3 illustrates the border identification strategy and the construction of border-county pairs for three sets of adjacent DMAs. Panel A plots the border counties for two DMAs: Boston and Burlington-Plattsburg, New Hampshire. There are a total of five counties (county nos. 10, 11, 12, 13, and 16 labeled in Figure 3, Panel A) in Boston (shaded) that are adjacent to three counties (county nos. 17, 18, and 33 labeled in Figure 3, Panel A) in the Burlington-Plattsburg DMA (shaded), thus making them border counties of a DMA pair. By comparing the difference in mobility patterns between the border counties on each side of the DMA borders, we can estimate the causal effect of COVID-19-related ads on social distancing behavior. In Panel B, we provide more examples of border counties for two other DMAs: Lexington/Louisville and Atlanta/Macon. Similar to Panel A, the border counties are shaded.
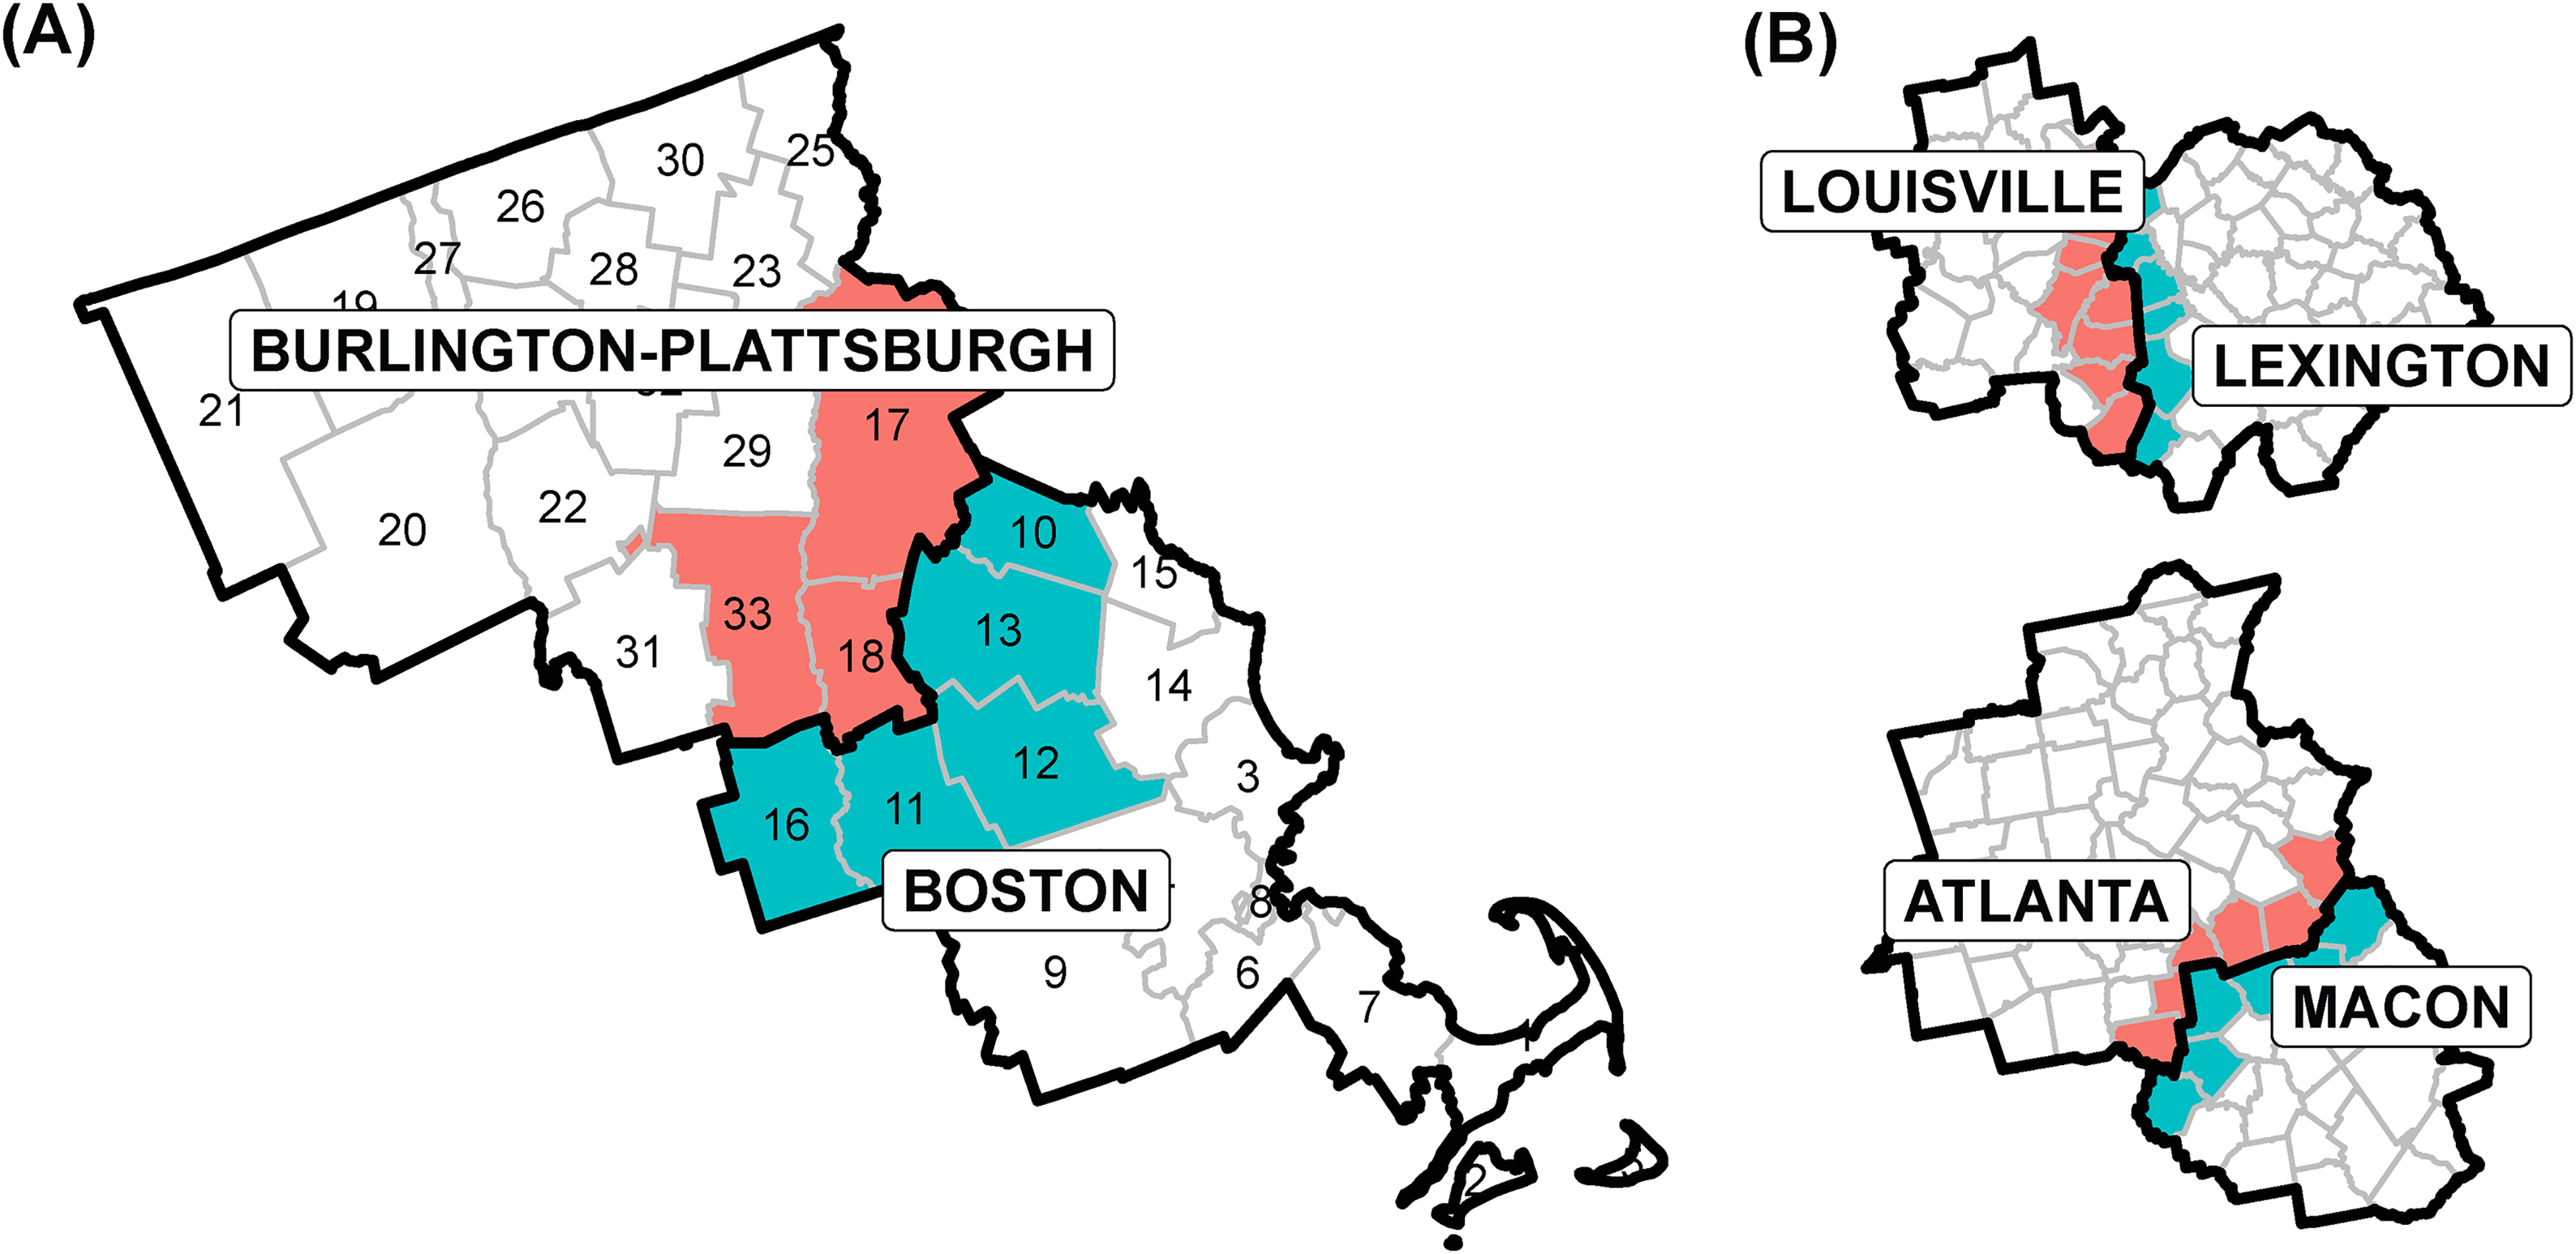
DMA Border Counties (an Illustration).
The border identification strategy relies on the fact that there is variation in COVID-19-related advertising intensity across border counties. To illustrate the variation, Figure 4, Panel A, plots the COVID-19-related advertising for the border counties across two DMAs: Boston and Burlington-Plattsburg. Panel A shows that households in one DMA may see more COVID-19-related ads in a single day than their neighbors in another DMA. For the 159 borders (318 border-county pairs), we check for the variation in advertising intensity in markets across borders by calculating the absolute differences in the GRP of COVID-19-related ads between DMAs for each of the 24,168 border-day observations. In 59.96% of these border-day observations, the difference in advertising intensity in the markets on either side of a border was nonzero. The average absolute difference in daily COVID-19-related ad GRPs (aggregated across all ad exposures) across DMA borders was 68.33 (see Web Appendix W2 Table W2.1), indicating that there is indeed a spatial discontinuity in COVID-19-related advertising intensity. Further, the average coefficient of variation (standard deviation of daily COVID-19-related ad GRPs divided by the mean) for all (1.2), brands (1.2), and government (1.7) ads shows that there is significant within-DMA variation as well, which is also demonstrated in Figure 4, Panel A.
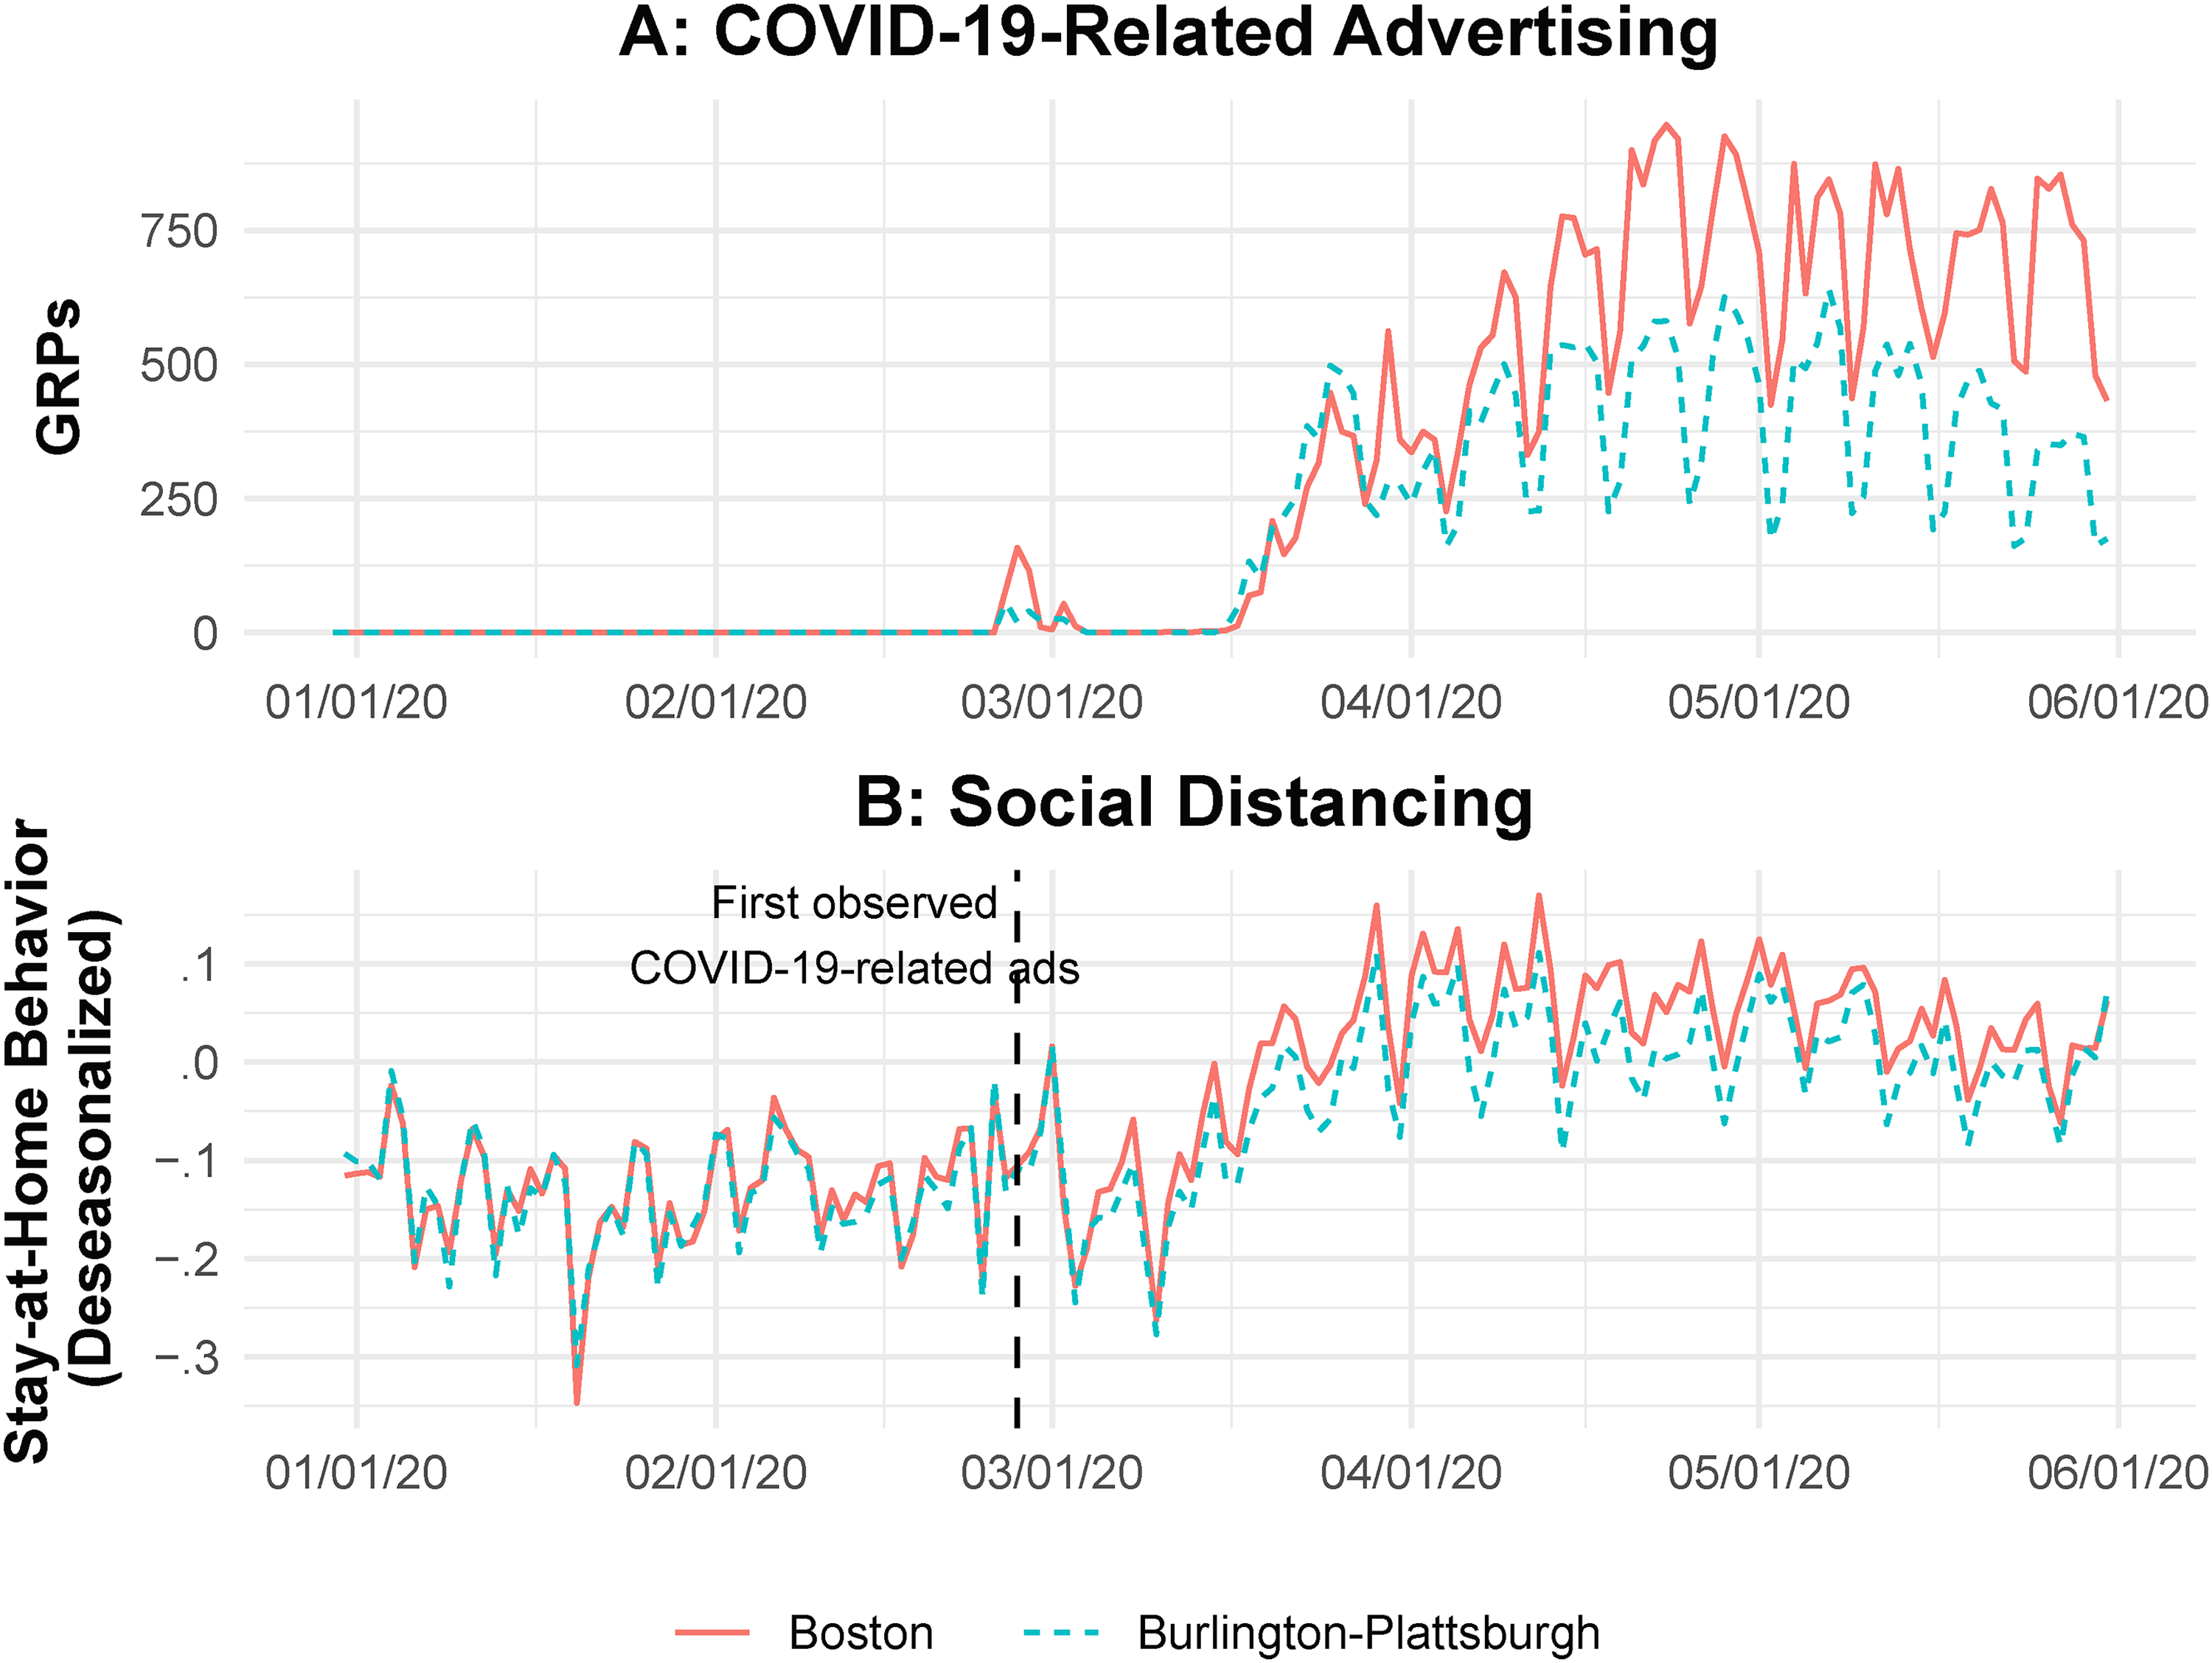
COVID-19-Related Advertising and Stay-at-Home Behavior in Boston and Burlington-Plattsburgh DMA Border Counties.
An identifying assumption is that people in border counties on both sides of the border would behave similarly on average and follow the same trend in mobility in the absence of COVID-19-related ads. To visualize whether this common trend assumption holds, in Figure 4, Panel B, we plot the stay-at-home behavior for the border counties for the Boston and Burlington-Plattsburg DMAs before and after the first known airing of COVID-19-related advertising in both markets. As we can see, the border counties follow the same “common” mobility trends before the airing of COVID-19-related advertising. However, after the airing of COVID-19-related ads, the stay-at-home behavior gradually starts varying in magnitude for the two DMAs. We also compare mobility trends (completely stay-at-home and median dwell time at home) across all border counties in our sample before March 1, 2020 (when COVID-19-related ads were either absent or negligible). We observe no statistically significant difference in the mobility trends between border counties in this period, further supporting the common trend assumption (Table 3). In the subsequent analyses, we evaluate whether (and to what extent) such differences in social distancing may be attributed to differences in TV advertising across border counties.
Comparison of Observed Characteristics of Counties on Opposite Sides of DMAs.

To further rule out observable differences between border counties (our identifying assumption requires border counties to be similar), we compare them across a series of sociodemographic variables and voting patterns (see Table 3). We find no significant difference between the sets of border counties for population, race, household income, unemployment, poverty, education level, and percentage of Republican voters (2020 U.S. presidential elections).
Model
Our main model uses a linear specification to estimate the impact of COVID-19-related advertising on stay-at-home behavior. As mentioned previously, the level of analysis is at the border county–day level, resulting in 166,371
3
observations. Indexing c as counties, b as the border-market combination, and t as time (in days), we specify the following:
Main Estimation Results and Robustness Analyses.

*p < .05, **p < .01, ***p < .001.
aValues scaled by 10−2.
bValues scaled by 10−1.
Notes: “Main IV operationalization” denotes the operationalization of the COVID-19-related advertising variable (brand and government). FE = fixed effects; BIC = Bayesian information criterion.
Last, we include a set of controls at the county level that may be correlated with ΔSDbct as well as advertising. During the timeline of our data, there were multiple public policy interventions at the national, state, and county levels. These interventions typically included stay-at-home orders of various levels of stringency (advisories, stay-at-home mandates, shutdowns, etc.) and mask mandates. Policy changes at the national level are not of great concern to the focal analysis because they would affect both counties in the border experiment equally and be subsumed within αt. County-level policy (imposed by state or local governments) differences, however, may confound the advertising effect if unaccounted in the model. Therefore, we obtain data on county-level interventions by local governments from the CDC and include an indicator variable Policyct that takes the value of 1 if the county c was under a policy intervention and a value of 0 otherwise. 5 Similarly, we also control for the lagged number of COVID-19 cases (DailyCasesct − 1) at the county-day level to account for county-level differences in infection spread that may be correlated with social distancing behavior. We take a one-day lag of the daily number of COVID-19 cases because the complete information on the total number of infections is generally available only toward the end of that particular day.
In summary, we have 159 DMA-border-county natural experiments comprising 894 counties spanning 97 DMAs across the United States. Our primary model is a linear specification of completely stay-at-home behavior at the border county–day level, and the parameters of interest are β1 and β2, which capture the causal effect of COVID-19-related ads conditional on the county, border, and time fixed effects, as well as county-level time-varying variables (policy and case count).
Results
Effect of COVID-19-Related Ads on Social Distancing
To see if there is a relationship between social distancing behavior and COVID-19-related advertisements, Figure 5 plots stay-at-home behavior against COVID-19-related advertising intensity along with a line of best fit and the 95% confidence interval. As we see in the figure, there is a positive correlation between ΔSDct and COVID-19-related ad GRP, offering suggestive evidence of the primary relationship. Of course, this does not imply a causal relationship, which is the purpose of the estimation that follows.
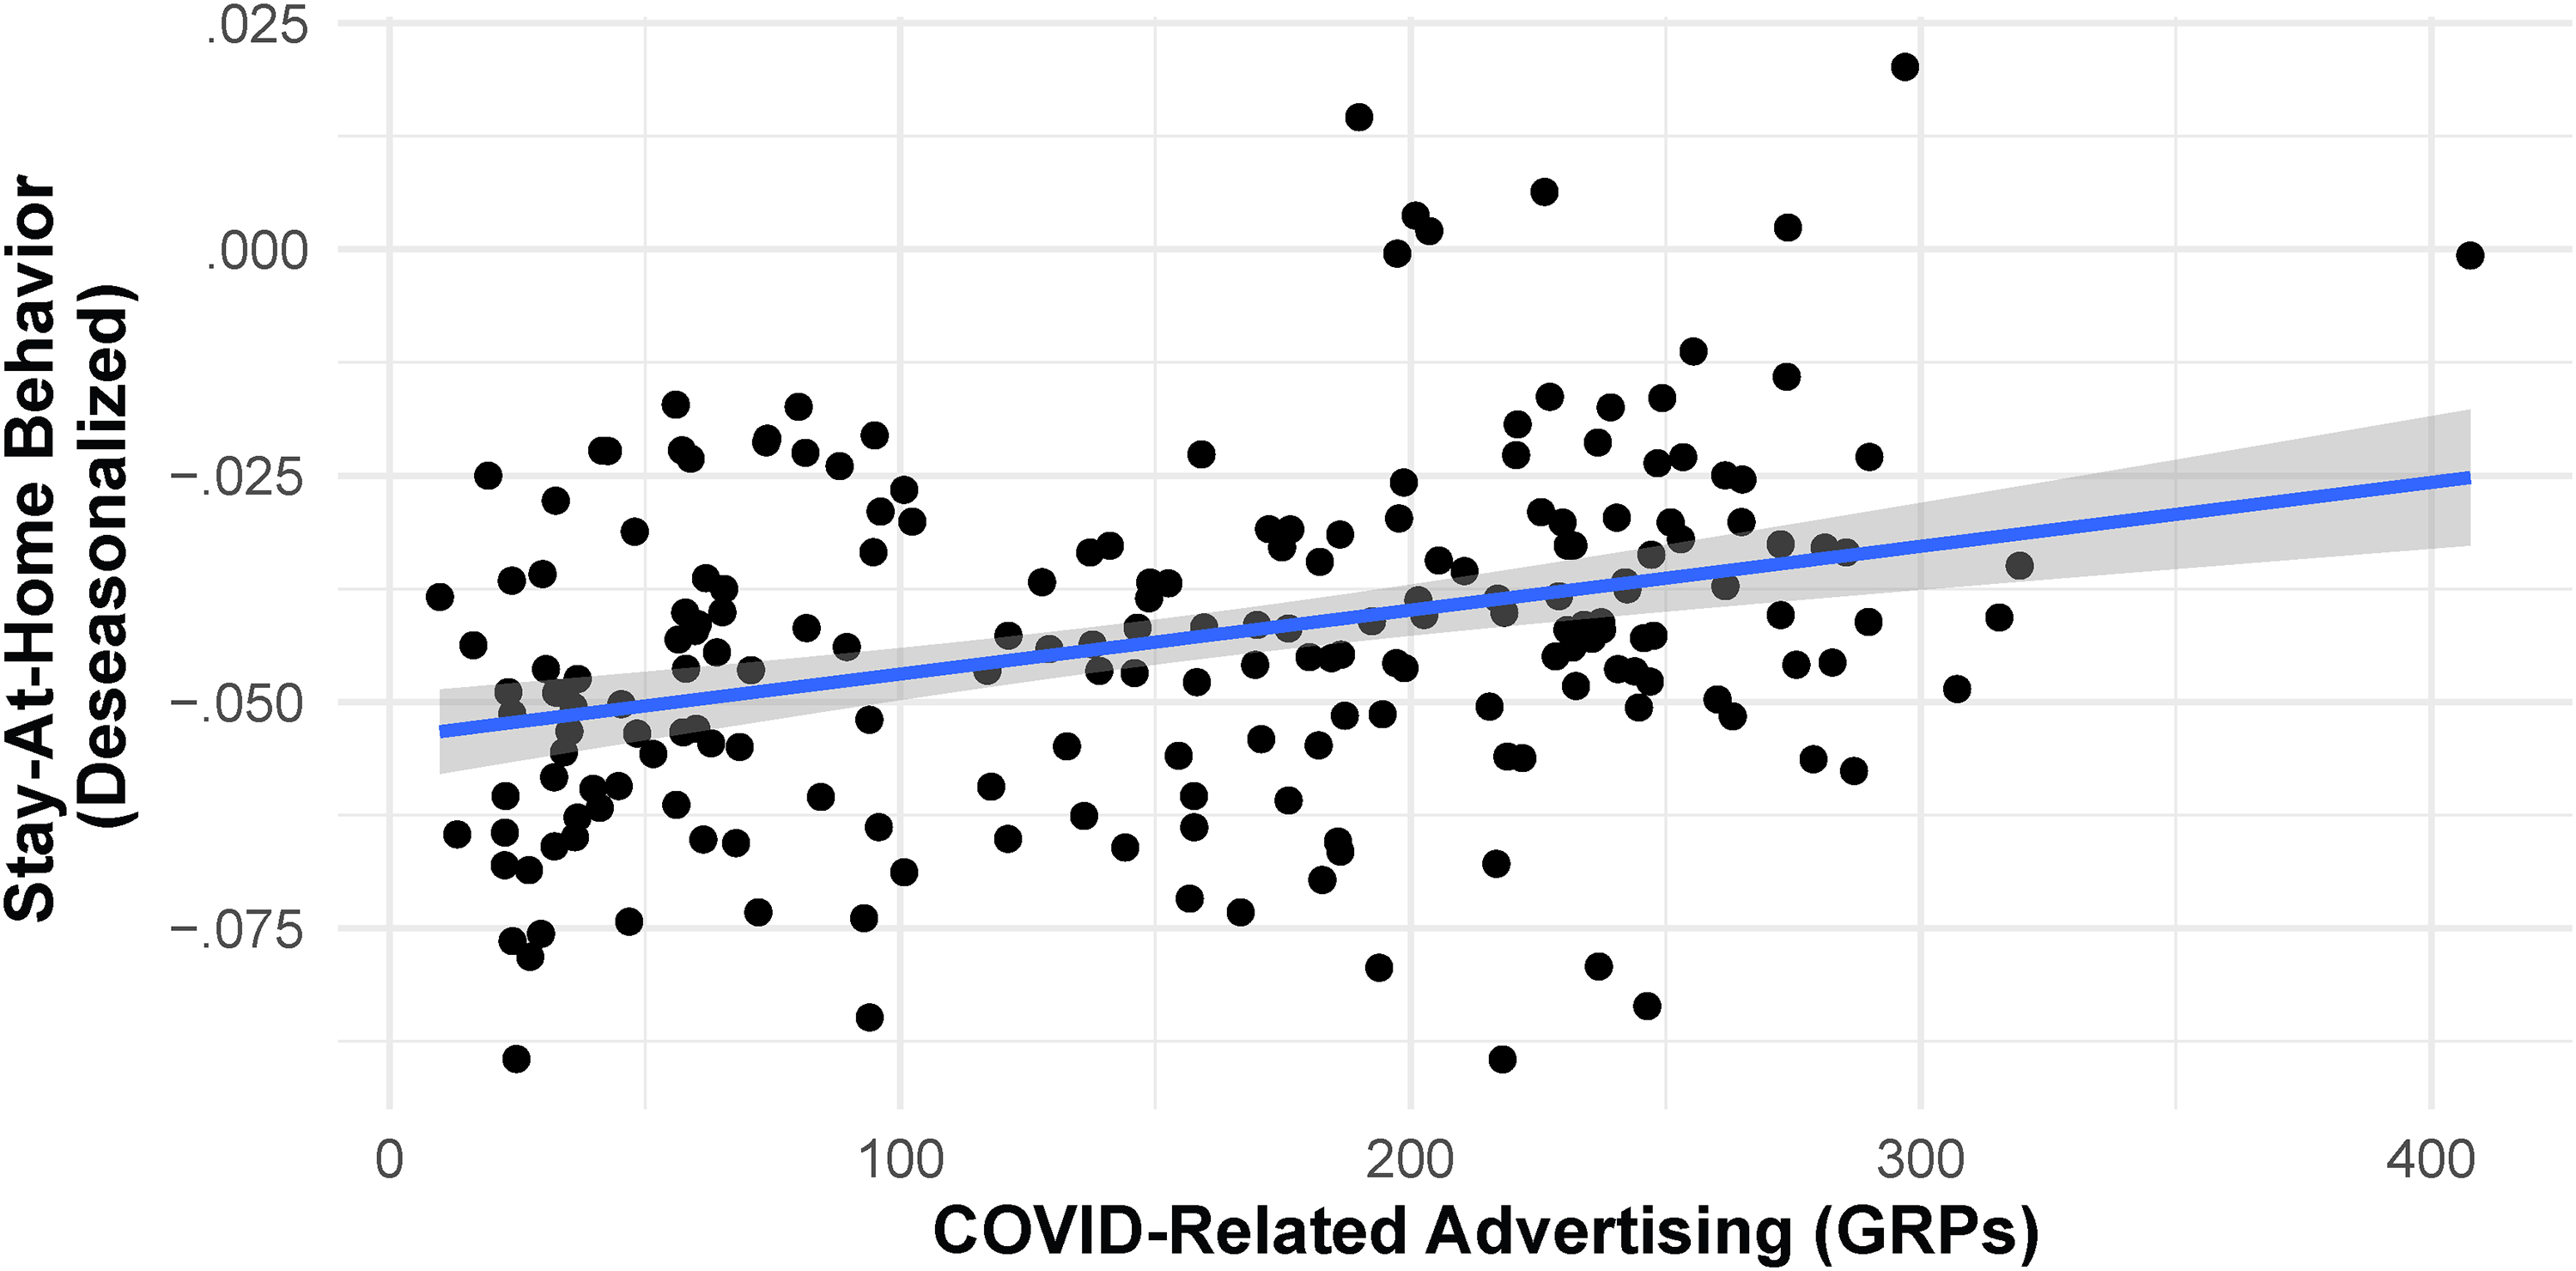
Correlation Between ΔSDct and COVID-19-Related Ad GRP.
Table 4 reports the main estimation results as well as multiple robustness checks. Model 1 describes the main results in which the dependent variable (social distancing) is measured as the percentage of devices that stayed at the home location completely. The main independent variable in Model 1, COVID-19-related advertising, is measured as the percentage of ads aired in a day that were classified as related to COVID-19. The estimation points to an interesting pattern in the effects of brand- and government-sponsored COVID-19 advertising. We see a significant positive effect (β = .031, p < .001) of COVID-19-related ads from brands on people's completely stay-at-home behavior. Since the covariate and the dependent variable are percentages, we can interpret the effect sizes as percentage point (pp) increase; that is, a 1 pp increase in COVID-19-related advertising in a day leads to a .03 pp increase in social distancing behavior. The results point to an interesting phenomenon in the spillover effects of advertising on social distancing. 6 Brands that included COVID-19 narratives in their messaging positively impact socially beneficial behaviors. Interestingly, government advertisements do not significantly influence social distancing behaviors overall, even though this may have been the explicit intent of the government ads. 7 In a separate analysis presented in Web Appendix W4, we also estimate the overall effect of COVID-19-related ads ignoring the source of the ad (government vs. brands) and find the effect to be positive and significant. Finally, we reestimate Equation 2 by including an interaction between brand and government ads and find a significant negative effect pointing toward a potential compensatory effect between the two (see Model 3 in Table W4.1 under Web Appendix W4).
Potential Mechanism Underlying the Effect of Brand Ads on Social Distancing Behavior.

***p < .001.
aValues scaled by 10−2.
bValues scaled by 10−1.
Notes: FE = fixed effects; BIC = Bayesian information criterion.
Robustness Analyses
Alternative dependent variable operationalizations
Our primary dependent variable, which captures the percentage of devices completely at home (ΔSDct), is a strict measure of social distancing behavior that may not account for other less stringent but important social distancing behaviors, such as the amount of time spent inside versus outdoors. To verify that the results remain robust to alternative measures of the dependent variable, we conduct two sets of analyses. First, given that reduction in time spent outside the home even when someone is not staying completely indoors (e.g., for procuring essential items) could be beneficial in stemming the spread of infections, we reestimate Equation 2 using median dwell time at home (ΔSDTimect) as an alternate operationalization of the stay-at-home behavior in Model 2 in Table 4. The results are consistent with our main findings; that is, COVID-19-related ads from brands lead to an increase in the time spent at home, while the effect is nonsignificant for COVID-19-related government ads.
Stay-at-home behavior, although widely accepted as a valid measure of COVID-19-induced social distancing (e.g., Brzezinski et al. 2021; Yan et al. 2021), may potentially subsume other influences such as those from school closures, unemployment, and so on. Therefore, our second alternative measure of social distancing describes an individual's visit patterns to various POIs within a county, such as grocery stores, gas stations, and restaurants. We obtain the daily number of visits to individual POIs aggregated at the county level from SafeGraph's Patterns data set. As before, we deseasonalize the daily number of visits to a POI (ΔSD_POI_Visitct) and present the estimation results in Model 3 of Table 4. Here too, we see that COVID-19-related ads from brands significantly increase social distancing behavior; that is, for a 1 pp increase in COVID-19-related ads from brands, there are 86.74 (p = .025) fewer visits on a day to a POI in 2020 as compared with 2019 on average. The effect of COVID-19-related government ads remains nonsignificant.
Alternative independent variable operationalizations
We reestimate the main model (i.e., Equation 2) with two alternative specifications of the independent variable. First, we use actual GRPs (instead of percentages) of the COVID-19- and non-COVID-19-related ads. Consistent with the main results, we find a positive and significant effect of COVID-19-related ads from brands on people's completely stay-at-home behavior (Model 4 in Table 4). To evaluate the potential dynamic impact of advertising, we estimated an advertising stock model where the advertising stock is a geometrically distributed lag of advertising. We replace the variable 

Impact of 1 pp Increase in COVID-19-Related Ads from Brands on Social Distancing over Time.
Concerns with border identification strategy
A concern with the border strategy employed in this research is that the estimated effects are localized at the DMA borders, which may be more rural in general, given that urban counties tend to cluster near the center of DMAs. As such, the generalizability of the findings to urban counties may be limited. We follow the robustness analysis outlined in Shapiro (2018) to address this plausible concern. Specifically, we identify borders that are closer to the centroid of DMAs as “more urban” and borders that are further away from DMA centers as “more rural” using a median split of distances of border counties from the DMA centers. We then estimate the ad effects separately for each subsample (“more rural” and “more urban” counties). For both subsamples, the effect of COVID-19-related ads from brands is positive and significant (Models 6 and 7 in Table 4). However, the effect is stronger in urban counties than in the full border sample (Model 1 in Table 4) as well as the “more rural” sample. Thus, we can conclude that the results continue to be robust and provide at least partial evidence that the findings generalize across different types of counties. We also find a negative and significant effect of government ads in the “more rural” sample. We discuss plausible explanations for this effect in the “Heterogeneity in Advertising Effects” subsection.
Simultaneity
A potential bias in our estimates may arise from simultaneity or the co-occurrence of COVID-19-related ads with social distancing behavior. For example, advertisers may strategically target markets with higher levels of social distancing so that more people would see their ads. Usually, media buying of television advertisement slots for different DMA markets occurs as up-front purchases (several months/weeks in advance) or as nonpreemptible buys (purchased one quarter before airing). Ad inventory that remains unsold can be bought by advertisers in the remnant market and up to the day before the airing if available. Thus, advertisers may have strategically included COVID-19 narratives in their ads in response to the prevailing social distancing behavior in a market. To evaluate the extent to which advertisers may have acted strategically, we estimate three models: a 14-day, 7-day, and 1-day lagged completely stay-at-home behavior (ΔSDbct) as the independent variable and the %COVID-19-related brand ad GRP as the dependent variable. We assume that with the rapidly changing situation related to the pandemic in the initial phases, any information related to social distancing behavior older than two weeks would be outdated and would not provide accurate information to advertisers. We do not find significant effects for any of the 14-day (−.064, p = .53), 7-day (−.147, p = .14), or 1-day (.07, p = .47) lagged versions of the social distancing variable on COVID-19-related advertising (see Models 1, 2, and 3 of Table W7.1 in Web Appendix W7). This suggests that advertisers did not change their strategies in response to more people staying at home, thus alleviating concerns about reverse causality.
Alternatively, advertising GRPs in general (including COVID-19-related ads) could naturally increase in markets with higher levels of social distancing as more individuals may stay at home and watch more TV. To address this concern, we regress stay-at-home behavior on an alternative (non-viewership-based) measure of advertising: the percentage of COVID-19-related ad exposures (or the number of ads). The results (Model 4 of Table W7.1 in Web Appendix W7) demonstrate the robustness of our main findings: the effect of COVID-19-related ads from brands on social distancing behavior is positive and significant. To rule out the possibility of temporal ordering issues in Equation 2, we also ran the regression with a one-day lag of % COVID-19-related ad GRP (as opposed to the contemporaneous effect in Equation 2). The results remain virtually unchanged (Model 5 of Table W7.1 in Web Appendix W7). Collectively, these analyses offer strong evidence that the main findings are robust to concerns related to simultaneity.
Alternative model specifications
We also test whether the focal relationship between %COVID-19-related brand ad GRP and social distancing behavior is robust to alternative functional forms. Consequently, we treat the results from our previous linear model (i.e., Model 1 in Table 4) as our benchmark model (i.e., Model 1 of Table W8.1 in Web Appendix W8) and reestimate this model by applying a linear-log (Model 2), log-linear (Model 3), and log-log (Model 4), and logit transformation (Model 5), respectively, along with the same set of controls. We find that the relationship between COVID-19-related brand ads and social distancing behavior is significantly positive across all alternative functional forms of the model.
State-level policy mandates
We also address concerns that state-level mandates may render the border identification strategy less effective. State-level policy mandates affect all counties within a state. So, if all counties at the DMA border belong to the same state, then the effect of the mandate is common across the counties on both sides of the border. In such cases, advertising intensity would be the only point of difference in counties across the border. However, for DMA borders that include counties from two different states, counties on one side of the border may not have any mandates, which may lead to differential effects of the policy mandates in the counties across the border. We account for this by including the county-level policy dummy variable as a control in all of the models presented in Table 4. Further, the fixed effects in our model account for any unobservable common factors. As an additional robustness check, we run separate regressions for border counties with and without a policy in place (see Web Appendix W9 for details). The results reinforce our primary findings; that is, in the absence (presence) of policy interventions, the effect of COVID-19-related brand advertising is positive and significant (nonsignificant) and allude to the salience of the pandemic being the potential mechanism underlying the effect of ads on social distancing behavior.
Additional Analyses
Potential Mechanism Driving the Effects
We posit that salience may be one of the primary underlying psychological mechanisms driving the effects described previously. Frequent or recent exposure to a brand (through ads) increases its salience, which is defined as the prominence or “level of activation” of the brand in memory (Alba and Chattopadhyay 1986). This increased prominence or level of brand activation in memory influences attention to and recall of product attributes included in the ad narratives (Alba, Hutchinson, and Lynch 1991). In the context of COVID-19, people may be aware of the pandemic given its pervasiveness. However, this awareness may not always translate into the desired behaviors (e.g., social distancing) since the seriousness and consequences of the pandemic may not be prominent or salient in people's minds. Therefore, ads making references to the pandemic in their narratives are likely to increase its prominence in people's minds and draw attention to various attributes and consequences of the pandemic.
Empirically, we exploit the variation in salience of the pandemic across counties to understand how COVID-19-related advertising affects social distancing behaviors. Literature on priming and salience (specifically in health communications) provides us with some direction. That is, if individuals already understand the (health) risks of specific behaviors, then repeated messaging will yield diminishing returns even when the advocated behavior is efficacious (Pechmann 2001; Pechmann and Ratneshwar 1994). Applying this logic to our context, we would expect that if salience were a driving mechanism, then COVID-19-related advertising effects would be attenuated for counties where the salience levels of the pandemic are already high. In other words, COVID-19-related ads would have a limited role in increasing salience when salience is already high. We conduct analyses that allude to the potential mechanism by exploring heterogeneous advertising effects through moderation analyses (Goldfarb, Tucker, and Wang 2022). We use two measures of salience at the county level: county-level policy interventions and pandemic-related keyword search interest (Google Trends).
We leverage county-level policy interventions (e.g., mask mandates or stay-at-home advisories or orders) to assess the heterogeneity in COVID-19 salience. Specifically, we expect that, in the presence of government policy interventions, the salience of the pandemic is likely to have been higher among residents of a focal county (compared with its border counterparts with no government policy). As such, if the salience mechanism is at play, the effectiveness of ads in influencing social distancing behavior would be lower in counties under a policy mandate because pandemic salience would already be high in those counties. Conversely, in the absence of any policy interventions, the salience of the pandemic is likely to be lower, leading to stronger ad effects on people's social distancing behavior. To test this, we include
Furthermore, the interaction effects also highlight the critical role brand advertising could play in influencing socially beneficial behaviors among consumers in the absence of government policy interventions. In Web Appendix W10, we show that the effect of COVID-19-related brand ads weakens progressively with increasing severity of policies, providing further support for the proposed mechanism. Interestingly, we see from Model 1 (Table 5) that the total effect (main effect + interaction effect) of government ads becomes negative in the presence of public policy mandates. Government advertising on top of existing pandemic-related government policies may cause annoyance (Li et al. 2021; Todri, Ghose, and Singh 2020) among consumers and lead to lower adoption of social distancing practices (see Web Appendix W9 for details).
We also consider Google Trends search interest as an alternative measure of salience. One way in which the salience of a topic may manifest itself is through people's search for information related to the topic. This aligns with Alba and Chattopadhyay's (1986) “prominence” definition of brand salience. Extant research has shown the efficacy of Google search trends as a reasonably good proxy for capturing the salience of specific issues that concern a wide range of people (Kearney and Levine 2015; Mellon 2014). We obtain daily search interest data (indexed from 0 to 100) at the DMA level for search terms containing the following keywords: “COVID-19,” “coronavirus,” and “social distancing.” Google normalizes search results to the time range and location of a query (i.e., the query used to collect the data). In our context, the search interest data are normalized to the day and DMA of the search queries; that is, the search volume of a specific query is divided by the total searches in a given DMA and day, which is then converted to a 0–100 scale, with 100 representing the peak popularity of the search terms across DMAs on a given day. Given that the search interest score is for the entire DMA and not at the county level, we use county population as a weight to approximate search interest for the border counties in our data set. If the salience mechanism is at play, then we would expect the effect of COVID-19-related advertising to be attenuated for counties where the pandemic-related search interests are high. As before, we reestimate Equation 2 by including a
COVID-19 Cases as Outcome Variable
We perform two sets of analyses (see Web Appendix W11 for more details) to explore the role (if at all) that COVID-19-related advertising may have played in influencing case counts. First, we regress COVID-19-related brand advertising (lagged by 14, 21, and 28 days to allow for variability in virus incubation periods) on county-level COVID-19 case counts to assess if there was a direct effect of ads. We do not find any significant effect of COVID-19-related brand ads (for any lagged period) on the daily number of COVID-19 cases. Furthermore, we perform a mediation analysis to test whether social distancing mediates the relationship between COVID-19-related ads (lagged by 14, 21, and 28 days) and COVID-19 case counts. Across our analyses, we do not find a consistent pattern that suggests that COVID-19-related advertising may have directly or indirectly influenced COVID-19 case counts. We note that any estimates (using our data) linking advertising to case counts are not likely to be causal, especially given the well-documented measurement problems in COVID-19 case counts as well as potential (unobserved) confounders in the incubation periods. There were significant delays in the reporting of actual numbers (Banco 2021), scarcity in test kits that may have led to inaccuracies (Parshley 2020), delays in the processing of test results (Barone 2020), and significant issues with testing accuracy in the initial stages of the pandemic.
Furthermore, given the significant variability in incubation periods for COVID-19 (3–14 days after exposure), it becomes much more difficult to estimate a causal effect of advertising on infection rates, especially with individuals being tested only after the onset of symptoms and contact tracing initiatives being ineffective early on. Finally, the volatility in the infection rates may also lead to imprecise estimates of the ad effects. This is similar to what prior studies have found while studying the effects of advertising on sales (Lewis and Rao 2015).
Heterogeneity in Advertising Effects
We assess the heterogeneity in the advertising effects without having a priori hypotheses regarding the effects. Our purpose here is to highlight descriptive differences in ad effects (if any) across brand, category, and demographic variables. We discuss these results next.
Brand category
To explore heterogeneity at the brand category level, we estimate the model with the %COVID-19-related ad GRPs within each major brand category (e.g., Entertainment, Politics) observed in the data. We find significant and heterogeneous effects for 8 of the 15 brand categories (Figure 7). Specifically, we find that COVID-19 brand ads related to Entertainment, Alcohol & Tobacco, and Politics have a negative effect on social distancing. The ad effects are significantly positive across five other categories: Food & Beverages, Household Products, Insurance & Real Estate, Automobiles & Automotive Products, and Services.
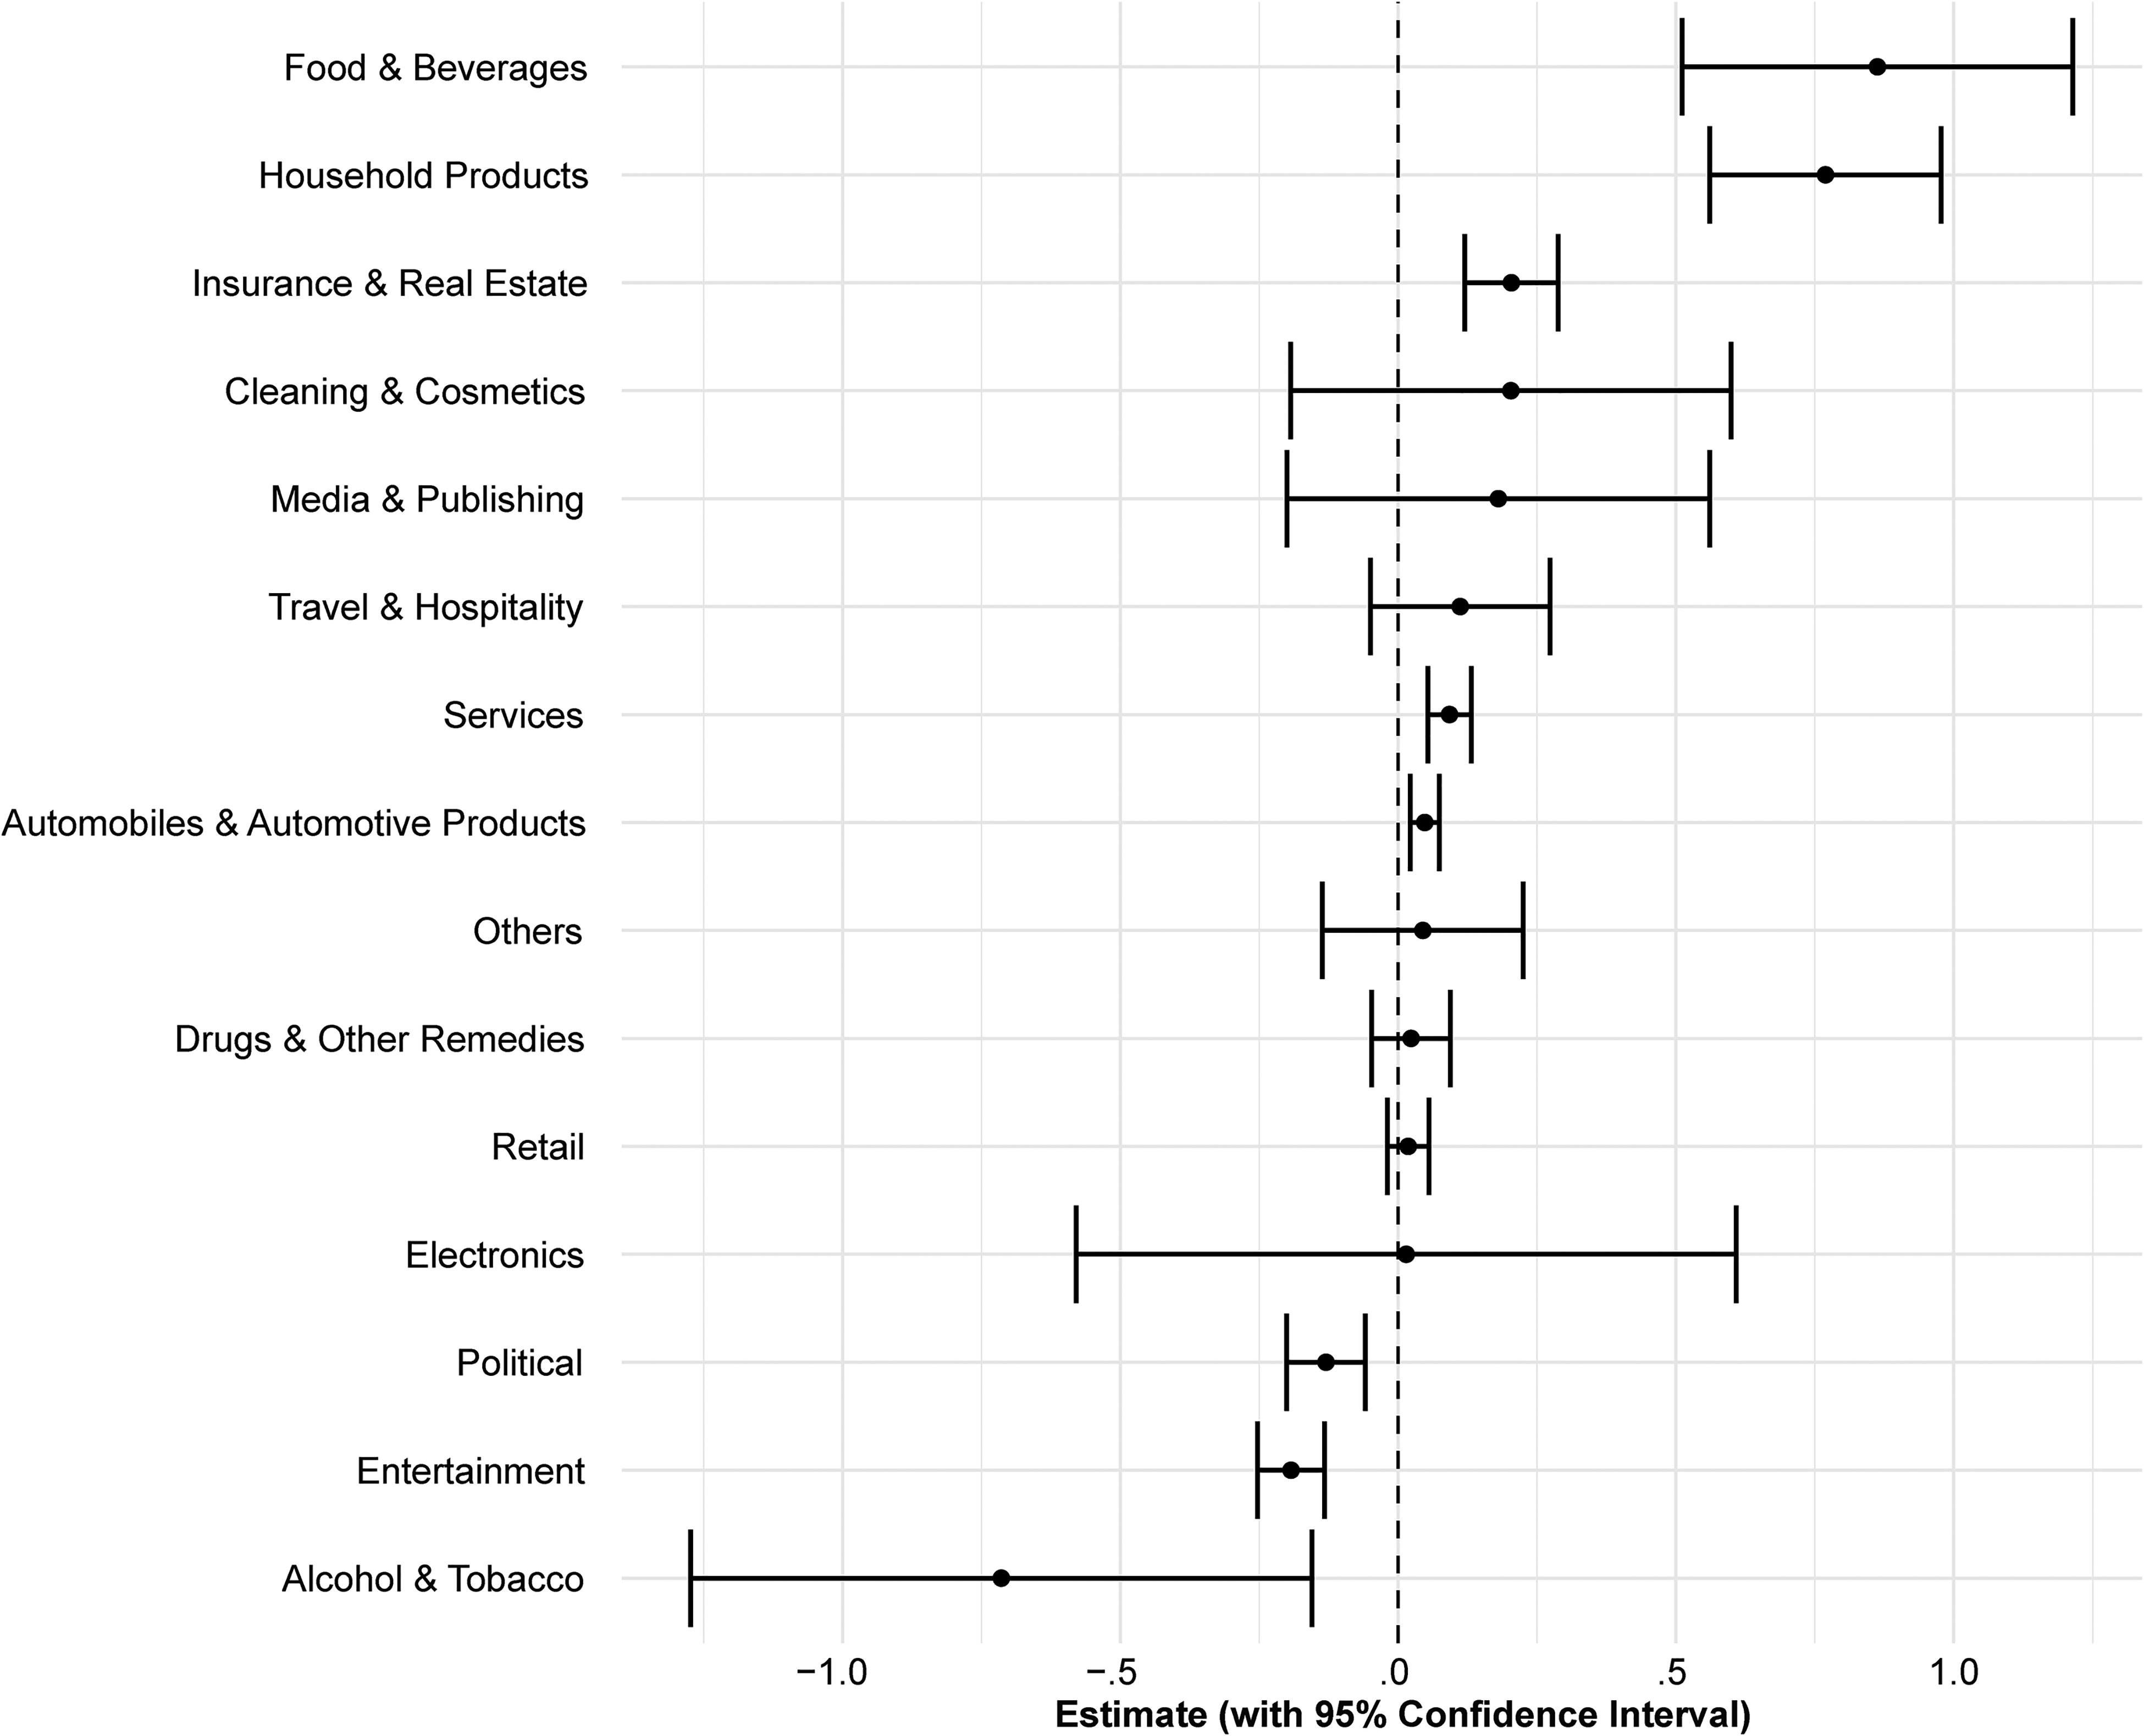
Heterogenous COVID-19 Ad Effects (Brand Category).
The negative effect of political COVID-19-related ads is not surprising, given the heavy politicization of the pandemic. Several political entities, mainly from the conservative end of the political spectrum, put forth misleading claims about the pandemic and its severity that may have led people to reduce their social distancing (Paz 2020; Summers 2020). This may be especially pertinent in our border samples, which tend to be more rural and politically conservative and, therefore, more susceptible to such political messaging. Similarly, we find a negative effect for ads related to Entertainment and Alcohol & Tobacco products, which often focus on social/group activities (e.g., watching a movie, visiting a bar) and therefore may have downplayed the severity of the pandemic on average, leading to reduced social distancing. In contrast, the product categories that have a positive effect on social distancing behavior have a relatively less prominent social aspect to their consumption. Food, beverages, and household products are purchased mostly for personal and family consumption. Similarly, the use of services, automobiles, real estate, and insurance products is predominantly centered on personal consumption. In addition, brand trust may have played a part with many of the brand categories, with positive effects enjoying higher consumer trust compared with those with negative effects in our sample (Morning Consult 2022). For example, more than half of the top 25 brands on the most trusted brands report by Morning Consult are consumer packaged goods brands. Furthermore, brand categories having a positive effect tend to have a higher advertising frequency in our data sample, thereby possibly contributing to their increased effectiveness.
Brand value/equity
To explore heterogeneity related to brand equity, we use Kantar BrandZ's Most Valuable Global Brands 8 report to identify 100 brands with the highest brand equity. These brands are ranked based on a combination of financial value and brand equity. We identify these 100 brands in our sample and reestimate Equation 2 with two independent variables: COVID-19-related ad GRP from the top 100 brands (high brand equity) and COVID-19-related ad GRP from other brands (low brand equity). We find that COVID-19-related brand ads with high brand equity have a significant and positive effect (.01231, p < .001) on social distancing behavior, while COVID-19-related brand ads with low brand equity have a nonsignificant effect (.00001, p = .876). These findings are congruent with the conventional wisdom that brand equity is considered a relational market–based asset reflecting the relationship between consumers and the brand and is often preceded by brand trust (Srivastava, Fahey, and Christensen 2001).
Demographic variables
We also explored heterogeneity in brand and government ad effects across four major county-level demographic variables: population, education, percentage of people who are white, and conservativeness (measured as the percentage of Republican 9 votes in the 2020 U.S. presidential election). For ease of comparison, we plot the standardized coefficient estimates (see Figure 8). We find that brand ad effects are more pronounced for counties that are more densely populated and have higher levels of education. However, the brand ad effects are attenuated in counties with a high percentage of people who are white and conservative. Several factors could be underlying these effects. For example, population density is generally higher in more urban areas, which tend to be more educated (Parker et al. 2018) and thus likely to have lower science skepticism (e.g., beliefs about human-made causes of global warming) and higher compliance with social distancing measures (Brzezinski et al. 2021). Urban areas also tend to have higher per capita income, which increases the likelihood of people owning TVs and being exposed to and influenced by COVID-19-related TV ads.

Heterogenous COVID-19 Ad Effects (Demographic Characteristics).
Prior research has found conservative ideology to be correlated with psychological reactance (Irmak, Murdock, and Kanuri 2020; Taylor and Asmundson 2021), which is defined as a motivational state aimed at preserving and restoring threatened autonomy and freedom of choice (Brehm and Brehm 2013; Melnyk, Carrillat, and Melnyk 2021). Psychological reactance can motivate individuals to resist attempts at persuasion, especially when it is perceived as curbing freedom of choice and can lead to denials of the existence of threats. In the United States, people who are white identify as conservatives more than do those of other races (e.g., Saad 2020). This may elicit reactance in areas with a higher percentage of whites, leading to attenuation of COVID-19-related band ad effects. We find similar trends in the government ad effects for population and conservativeness; that is, the ad effects become weaker (stronger) with higher levels of conservativeness (population). This attenuation of ad effects with increasing conservatism can help explain the negative government ad effects observed in the “more rural” (Model 6 in Table 4) sample. Rural areas tend to be more conservative and may exhibit higher reactance to COVID-19-related government ads. Finally, no significant variation from the median was observed for any levels of education and percentage of whites for government ad effects.
Discussion and Conclusion
Could non-brand-related elements in the narratives of brand advertisements unexpectedly influence societal outcomes? Using the COVID-19 pandemic as an empirical setting and without making any assumptions about the intent of brands, we set out to investigate the spillover effects of COVID-19-related advertising on social distancing behaviors. Leveraging natural experiments resulting from advertising discontinuities along DMA borders, we show that brand ads that include COVID-19 narratives positively affect people's social distancing behavior. Although we do not find an overall significant effect of government ads in our sample, we find that government ads have a significant negative effect in (1) more rural counties and (2) counties under policy mandates, suggesting that there may be a certain level of psychological reactance and/or annoyance to such messaging. Collectively, this study not only highlights the social impact of advertising but also takes the first step toward a new model of designing advertising strategy—one that considers both brand-related outcomes and societal spillovers.
Implications
This research has important implications germane to firms and policy makers with the explicit intention of using marketing to further social good. Next, we outline some of these implications.
Advertising for social good
Our findings reveal that marketing-mix variables (e.g., TV advertising) can be an important lever in advancing social good. We find that in the context of public health emergencies, brand advertising has a significant positive impact (β = .031) on social distancing behavior, with the effect being stronger (β = .11) in the absence of a cogent public policy response. Our results bear two critical implications for the advertising strategies of firms. First, the results offer empirical evidence that the spillover effects of TV advertising may lead to significant positive influences on societal outcomes. The magnitude of the spillover effects is quite substantial when considering the size of the DMAs. For example, a 1 pp increase in COVID-19-related advertising leads to an average of 466 additional people (compared with 2019) staying completely at home per day. This effect is much more pronounced for larger DMA markets such as New York and Los Angeles, where the predicted effect leads to 6,527 and 5,612 additional people staying home completely per day, respectively. Accounting for the cost of advertising, we can compute the (unintended) social returns on investment for a 1 pp increase in COVID-19-related ad GRPs. The average return on investment across DMAs was found to be .33 (with a range of .06–1.27); that is, for every dollar spent on COVID-19-related ads, social distancing increased by .33 pp. Second, we find that the advertising effects are heterogeneous across brands and demographics, suggesting that brands have an opportunity to be strategic about the societal spillovers of their advertising and design targeted ad campaigns to maximize the impact on societal outcomes. For example, we find that the effect of brand ads is weaker in more conservative areas, suggesting the need for brands to consider the political leanings of their audience before designing ad campaigns. In addition, ads from brands in certain product categories (e.g., Food & Beverages, Automobiles) have stronger effects on social distancing behavior. In summary, firms have tremendous opportunities to disseminate socially relevant messages embedded in the narratives of their TV ads to impact socially beneficial outcomes, especially given the growing importance among firms to move from being predominantly profit-centered to addressing issues of consumer and social welfare (Chandy et al. 2021; Porter and Kramer 2011).
Rethinking communication strategies from government agencies
Research examining reactance suggests that public sector campaign messages directed at restricting an undesirable choice or behavior may end up achieving the opposite effect (Wright and Palmer 2008). Our findings reveal that government ads have a negative effect on social distancing behavior in more rural and conservative areas. Furthermore, we find evidence that the co-occurrence of government advertising with policy interventions negatively impacts social distancing behavior, perhaps due to annoyance arising from the perception of excessive government interference. Consequently, government agencies may need to rethink their communication strategies in terms of their implementation, especially when they are engaged in mitigating major public health crises requiring the compliance of the public to critical safety guidelines. In such scenarios, government agencies may benefit from adopting alternative means of communication to minimize reactance or annoyance. This may involve initiatives such as collaborating with well-known, trusted public figures and/or social media influencers or offering incentives to firms in certain categories, such as food and beverage or household products (given their increased ad effectiveness), to incorporate relevant social welfare narratives in communications and advertisements directed at their followers and consumers, respectively. Further, our results speak to the potential compensatory effects of advertising and public policy response. Government responses to public health crises often face headwinds due to factors such as unfavorable public opinion and lack of political will. This research suggests that advertising may a viable tool to nudge the public toward socially beneficial and responsible behavior in the absence of a clear and cogent governmental response. Last, our findings point to areas where policy makers may be able to spend marketing dollars more efficiently during public health crises. For example, policy makers can refrain from advertising in areas where policy interventions (such as mask mandates) are already in place.
Thinking beyond COVID-19
While our observations relate to social distancing in the context of the COVID-19 pandemic, the substantive nature of the findings and the underlying mechanisms (e.g., salience) make them generalizable to other contexts. First, major epidemics and pandemics are becoming increasingly likely (Marani et al. 2021). The primary mitigation steps to such outbreaks are typically quarantining and social distancing. Our research is a first step in understanding how (if at all) marketing in the form of advertising can play a role in encouraging these behaviors during such crises. Brand managers and policy makers could use the findings from this study to devise more efficient, targeted, and timely communication strategies to deal with such future health crises. Second, our findings are generalizable to other public health crises as well, such as the steadily worsening climate crisis. People often engage in behaviors considered harmful to the environment due to the lack of salience of the adverse consequences of their actions. Studies have found that people with heightened concerns about climate change are more likely to adopt pro-environmental behaviors (Semenza et al. 2008). Brand ads with relevant narratives may help increase the salience of the crisis and influence critical mitigative behaviors (such as recycling or switching to clean energy).
Limitations and Opportunities for Future Research
This study is not without limitations. From a methodological standpoint, the border strategy identification approach estimates a local treatment (advertising) effect and may not generalize to all contexts and regions. Although we show that the effects are robust in more urban counties, our analysis is restricted to urban/rural border counties. Similarly, the implications of this study are most pertinent to public health crises, especially epidemics and pandemics, which tend to be longer-term events. Given the lag in TV advertising strategies to adjust narratives, the results may not directly apply to sudden short-term crises (e.g., natural disasters). However, we note that brands seem to be becoming increasingly agile with respect to changing their TV ad narratives. Within 2 weeks of the pandemic declaration, more than 60 brands nationally aired COVID-19-related TV ads (Bain & Company 2020).
From a theory standpoint, we shed light on some potential mechanisms driving the effect. Of course, there may be other competing mechanisms at play that we are unable to test due to data limitations. A formal investigation into the theoretical underpinnings of the effects (perhaps through experiments) may be an exciting avenue for future work in this domain. Finally, although we can reliably estimate the effect of COVID-19-related ads on social distancing, due to data constraints we do not explore the various content-related aspects of ads (including advertising intent) that may or may not influence such behaviors. We hope future research can study ad content and narrative effects such as tone and visuals related to the messaging. We believe there are many more promising avenues for research in this domain, such as investigating individual-level ad viewing behavior, sentiment, and activism.
Supplemental Material
sj-pdf-1-jmx-10.1177_00222429221130011 - Supplemental material for Societal Spillovers of TV Advertising: Social Distancing During a Public Health Crisis
Supplemental material, sj-pdf-1-jmx-10.1177_00222429221130011 for Societal Spillovers of TV Advertising: Social Distancing During a Public Health Crisis by Ayan Ghosh Dastidar, Sarang Sunder and Denish Shah in Journal of Marketing
Footnotes
Acknowledgments
The authors thank the JM review team for their thoughtful comments and guidance throughout the review process. They are also grateful to the faculty from the Neeley School of Business, Texas Christian University and the School of Management, Clark University, who attended the presentation of this research and provided valuable feedback. This article is based on the first author's doctoral dissertation.
Associate Editor
Neeraj Arora
Declaration of Conflicting Interests
The author(s) declared no potential conflicts of interest with respect to the research, authorship, and/or publication of this article.
Funding
The author(s) received no financial support for the research, authorship, and/or publication of this article.
Notes
References
Supplementary Material
Please find the following supplemental material available below.
For Open Access articles published under a Creative Commons License, all supplemental material carries the same license as the article it is associated with.
For non-Open Access articles published, all supplemental material carries a non-exclusive license, and permission requests for re-use of supplemental material or any part of supplemental material shall be sent directly to the copyright owner as specified in the copyright notice associated with the article.