
Abstract
Myopic marketing spending—curtailing marketing and research and development expenses to boost earnings—damages firms’ long-term value. Despite this, top management teams are often myopic, and by the time investors or boards detect such short-termism, it is too late to react or intervene. This research introduces a novel prediction method by analyzing the language top management teams use in earnings calls, specifically focusing on marketing and earnings emphasis, to predict future instances of myopic marketing spending. Through linguistic dependency parsing of almost 11 million sentences extracted from nearly 25,000 quarterly earnings call transcripts of 1,197 firms between 2008 and 2019, the authors demonstrate that the proposed approach can predict myopic marketing spending at a quarterly frequency for up to one year in advance. They find that an increase of one standard deviation in earnings emphasis is associated with a 23.68% increase in the likelihood of future myopic marketing spending. Investments based on the proposed approach produce 1.61% additional annual abnormal returns compared with models that exclusively use known predictors of myopic marketing spending, while offering earlier foresight and more frequent opportunities for intervention. This reduces information asymmetry for investors and boards of directors.
Keywords
Top management teams (TMTs) have a fiduciary responsibility to maximize shareholder wealth; hence, actions that impede this goal are solely their responsibility. However, TMTs may encounter incentives and pressures causing them to take actions that deviate from normal business practices to meet earnings thresholds (Roychowdhury 2006). One such example is marketing myopia, which emphasizes current-term results at the expense of long-term performance by exercising strategic marketing options (Mizik and Jacobson 2007). Examples include prioritizing sales over customer satisfaction (Hauser, Simester, and Wernerfelt 1994), offloading inventory at fiscal closing (Chapman and Steenburgh 2011), withholding new product launches (Moorman et al. 2012; Wies and Moorman 2015), and decreasing marketing and research and development (R&D) expenses (Bendig et al. 2018; Chakravarty and Grewal 2011; Mizik 2010; Saboo, Chakravarty, and Grewal 2016; Srinivasan and Ramani 2019).
We focus on myopic marketing spending, which TMTs enact by reducing marketing and R&D expenses to boost short-term earnings. Such a practice is detrimental to stakeholders (e.g., investors, customers, and boards of directors) and has been associated with inferior stock-market performance in the long run (Mizik 2010). Despite this, firms are often myopic. For example, when taking Dell Inc. private, Michael Dell (2014) opined on the pervasiveness of the problem by describing it as “an affliction of short-term thinking that drove a wedge between our customer and investor priorities,” noting that “shareholders increasingly demanded short-term results to drive returns; innovation and investment too often suffered as a result” and that “every company in every industry is facing the same pressures and opportunities.”
Unfortunately, investors can only observe myopic marketing spending after such actions have been undertaken and reported in publicly available financial statements. Predicting myopic marketing spending before such actions are taken remains a challenge, which leaves investors and boards of directors facing detrimental consequences with little recourse.
In the present article, we develop a text-analysis-based approach to predict a TMT's likelihood of myopic marketing spending in the future. We propose that analysis of TMT communications can capture intentions to engage in a trade-off between boosting short-term earnings (i.e., increasing earnings emphasis) at the expense of investing in marketing and R&D (i.e., increasing marketing emphasis). This approach is rooted in the attention-based view of the firm (Ocasio 1997), which advances that because managerial attention (i.e., time and effort) is scarce, the relative allocation of the TMT’s attention can indicate its priorities. Specifically, a TMT’s relative attention to one priority can enable us to detect whether the TMT is emphasizing marketing or prioritizing earnings.
Leveraging text analysis methods, we capture linguistic dependency between myopic action and marketing object word pairs in the transcripts of quarterly earnings calls. We find that the resultant word pair categories, which align with the theory of marketing myopia, successfully predict future myopic marketing spending. Specifically, we find that an increase of one standard deviation in earnings emphasis translates to a 23.68% increase in the likelihood of future myopic marketing spending. However, when the TMT’s language has enhanced marketing emphasis, firms are less likely to engage in future myopic marketing spending.
The proposed approach has three benefits, each contextualized with respect to prior work in marketing and each offering actionable insights for a stakeholder (Sridhar et al. 2023). First, it can predict myopic marketing spending up to a year in advance, much before any of the known approaches in the extant literature. Seasoned equity offerings (SEOs) (Mizik and Jacobson 2007), initial public offerings (IPOs) (Saboo, Chakravarty, and Grewal 2016), and share repurchases (Bendig et al. 2018) occur concurrently with myopic marketing spending, whereas analysts’ earnings per share (EPS) forecasts and stock recommendations (Chakravarty and Grewal 2016) provide only a few weeks’ advance notice. Early prediction gives investors access to private information, which can be used to create an arbitrage opportunity (Dow and Gorton 1994). Investors can use our approach to divest from firms predicted to be myopic, thereby divesting their portfolios of these stocks before they suffer the detrimental, long-term consequences.
Second, the proposed approach generates high-frequency forecasts, for example, at the quarterly level, which are more useful than existing approaches that use infrequent events such as SEOs, IPOs, and TMT retirements. This gives investors up to four opportunities a year to predict myopic marketing spending and thereby rebalance their investment portfolios. This has the potential to generate higher returns than approaches that rely on time-invariant predictions or infrequent portfolio balancing (Liu 2009). Frequent forecasts also lower the monitoring cost incurred by the board of directors to govern TMT behavior and safeguard stakeholder interests.
Third, adding information on TMT language characteristics improves the forecasting accuracy over current approaches for predicting myopic marketing spending. Specifically, we find that our approach improves the forecasting accuracy by .43% in the holdout sample. Calendar-time portfolio analysis shows that this improvement translates to 1.61% additional annual abnormal returns (6.44% over four years), compared with investment approaches based on existing correlates of myopic marketing spending. This effect size is comparable to annual abnormal returns reported in the literature: .55% for ratchet strategy over consistent strategy (Moorman et al. 2012), .41% for recall initiation (Liu, Shankar, and Yun 2017), and 2.14% for marketing excellence over market orientation (Homburg, Theel, and Hohenberg 2020). Thus, an investor stands to make significant monetary gains by tailoring investments based on the proposed approach.
Literature Review
Marketing myopia is an overemphasis on strategic options that generate immediate results at the expense of long-term profits (Mizik and Jacobson 2007). In Table 1 we highlight prior work that has focused specifically on myopic marketing spending, that is, the deliberate reduction of marketing and R&D expenses to boost short-term earnings. 1 Such short-termism decreases firm value in the long run (e.g., Mizik and Jacobson 2007), as well as firm profits (Cohen and Zarowin 2010). Contrary to this literature, which has examined the financial consequences of investing in firms observed to be myopic, we document the financial gains investors can garner by divesting from firms that our approach predicts will be myopic in the future. Thus, our approach is not about documenting the negative consequences of myopia, but rather about how to avoid them altogether.
A Review of Myopic Marketing Spending Literature.

Typically every four to five years.
Typically once or twice in a company's life span.
Typically once or twice a year.
Notes: N.A. = not applicable.
Research finds that firms engage in myopic marketing spending when they are going through major events in financial markets. These include floating SEO (Cohen and Zarowin 2010; Kothari, Mizik, and Roychowdhury 2015; Mizik and Jacobson 2007), launching an IPO (Saboo, Chakravarty, and Grewal 2016), and repurchasing shares (Bendig et al. 2018). Myopic marketing spending helps them boost the share price in the short run and thereby raise more capital from the stock market. Other research finds that internal firm events or strategic choices tend to co-occur with myopic marketing spending, including chief executive officer (CEO) retirement (Dechow and Sloan 1991) and the presence of a chief marketing officer (CMO) and marketing department power (Srinivasan and Ramani 2019). While both types of co-occurring events help explain the motivation for myopic marketing spending, their limited temporal variation makes them less helpful in predicting the event.
Firm financials such as poor historical stock price (Chakravarty and Grewal 2011) and profit-linked incentives for the TMT (Currim, Lim, and Kim 2012) can increase the likelihood of myopic marketing spending. Although these are high-frequency events, their focus on near-term financial rewards makes them less suited as a reliable longer-term predictor of myopic marketing spending. Our proposed approach supplements the literature by allowing investors to predict myopic marketing spending at the quarterly level.
Our study is also distinct from previous studies as we offer insights into the black box of TMT decision making, which is otherwise unobservable to investors. Upper echelons theory suggests that when investors have limited options for deciphering TMT intentions, managerial backgrounds and characteristics can partially predict organizational outcomes (Hambrick 2007). TMT characteristics, such as CMO presence and marketing department power (Srinivasan and Ramani 2019), are relatively time-invariant, thereby offering less assistance in predicting myopic spending. We build on upper echelons theory and argue that examining TMT communications provides an opportunity to peek into TMTs' intentions and priorities. This should provide more insights than merely looking at TMTs' demographics or their experiences.
Finally, our study offers empirical evidence about the possible role of analysts in detecting myopic marketing spending. Analysts offer frequent EPS forecasts and stock recommendations (e.g., buy, hold, sell) to investors, which pressurizes TMTs to boost earnings by curtailing marketing and R&D expenditures (Chakravarty and Grewal 2016; Currim, Lim, and Zhang 2018; Graham, Harvey, and Rajgopal 2005). The most up-to-date analysts’ forecasts and recommendations are available only a few weeks in advance of the quarterly results announcements. Our proposed approach provides two benefits. First, it can predict myopic spending up to one year in advance, thereby providing investors with a longer lead time to divest from myopic firms. Second, it is not clear if analysts act in the best interest of the shareholders and can detect marketing myopic spending. Analysts’ recommendations suffer from positive client bias (Hayward and Boeker 1998) and optimism bias (Cowen, Groysberg, and Healy 2006). Analysts are self-interest-seeking as they curry favors from TMTs to access private information (Ke and Yu 2006) and are sensitive to the TMTs’ impression manipulation (Westphal and Graebner 2010). Thus, when considering analysts’ input regarding myopic marketing spending predictions, it becomes an empirical question of whether their expertise outweighs their biases and self-interests.
Conceptual Development
Attention-Based View of the Firm
We leverage the attention-based view of the firm to explain how TMT communication can be used to infer a TMT’s intentions and priorities. Simon's (1947) bounded rationality theory viewed firms as structurally distributed attention, where individuals’ cognition and actions are derived from organizational context and decision-maker-specific situations. In this view, a firm's decisions and performance outcomes are the result of how the TMT chooses to attend to various competing priorities. Attention refers to managerial time and effort, which, because such resources are scarce, force decision makers to selectively attend to issues. Ocasio (1997, p. 189) succinctly summarized this prioritization of strategic direction as the process of “noticing, encoding, interpreting, and focusing of time and effort by organizational decision-makers.”
Consistent with the attention-based view, prior research has suggested that decision makers struggle to pursue strategically opposed foci, such as lobbying and customer satisfaction (Vadakkepatt et al. 2021), revenue and cost emphasis (Rust, Moorman, and Dickson 2002), exploration and exploitation (Kyriakopoulos and Moorman 2004), and meeting stock market expectations and innovating (Wies and Moorman 2015). Similarly, TMTs' myopic decision making suffers from a bifocal dilemma: whether to prioritize customers, brands, and innovation by investing in marketing and R&D (i.e., enhanced marketing emphasis) or to prioritize earnings by curtailing marketing and R&D expenses (i.e., enhanced earnings emphasis).
The attention-based view of the firm posits that such trade-offs in managerial decision making can be detected from procedural and communication channels (Ocasio 1997). These are formal and informal activities, interactions, and communications the firm establishes to induce organizational decision makers to act on a select set of issues. These communications include meetings (e.g., earnings calls), reports (e.g., annual reports), and administrative protocols (e.g., requests for proposals). Following this view, TMT communication has been used to examine executives’ attention and, by extension, insights into their strategic priorities (Umashankar, Bahadir, and Bharadwaj 2021; Vadakkepatt et al. 2021; Yadav, Prabhu, and Chandy 2007). Consistent with this approach, we examine TMTs' relative attention to marketing emphasis and earnings emphasis, which we now formally define.
Marketing Emphasis
Marketing emphasis is the strategic focus or priority that an organization places on marketing activities or market-driven philosophies. Market-driven organizations have superior market sensing, customer linking, and channel bonding capabilities (Day 1994). As noted by Day (1994, p. 45), the objective of market-driven organizations is to demonstrate a pervasive commitment to a set of processes, beliefs, and values, reflecting the philosophy that all decisions start with the customer and are guided by a deep and shared understanding of the customer's needs and behavior and competitors’ capabilities and intentions, for the purpose of realizing superior performance by satisfying customers better than competitors.
Given this focus, we argue that TMTs' marketing emphasis can be captured using TMT language reflecting three well-established marketing-relevant constructs in the literature: market orientation, marketing capabilities, and marketing excellence. Each is briefly discussed next.
Market orientation is a firm's beliefs and behaviors focused on creating superior customer value (Kohli and Jaworski 1990; Narver and Slater 1990). The three dimensions of market orientation are geared toward understanding customer needs (i.e., interfunctional sharing of market information and coordination), providing superior value (i.e., customer orientation), and protecting that value against competitors’ onslaught (i.e., competitor orientation). However, achieving market orientation requires the TMT's commitment to process improvements, a market-based reward system, employee training, and market research investments (Kirca, Jayachandran, and Bearden 2005). Delivering customer value requires improvements in customer satisfaction and investments in programs that aim to improve product and service quality, which may cause costs to rise (Rust, Moorman, and Dickson 2002). Other marketing investments that improve customer value include customer relationship management, customization, personalization, and digital media campaigns, all of which require significant marketing resources. Market-oriented firms are also more innovative and enjoy superior new product performance. Hence, they are also likely to prioritize R&D investments (Kirca, Jayachandran, and Bearden 2005).
Marketing capabilities are the abilities of firms to garner resources and then deploy them to create sustainable competitive advantage (Vorhies and Morgan 2005). Firms with superior marketing capabilities are stronger at product development (Wies, Moorman, and Chandy 2023), channel management, marketing communications, selling, market information management (Du et al. 2021), marketing planning, and implementation (Kalaignanam et al. 2021). To respond to the rapidly changing marketplace, firms need to develop the capabilities to learn, adapt, and experiment—all of which can be fostered by allocating resources to marketing and R&D.
Finally, marketing excellence is the “firm's superior ability to perform essential customer-facing activities,” and this execution “occur[s] during the marketing strategy process” (Moorman and Day 2016, p. 6). Its three pillars are ecosystem priority (i.e., mutually beneficial systems of networks to grow), end-user priority (i.e., final customer engagement), and marketing agility priority (i.e., fast decision making) (Homburg, Theel, and Hohenberg 2020; Kalaignanam et al. 2021). Achieving marketing excellence requires resource commitment and complementarity (Fang and Zou 2009) and resource alignment with firm's growth strategies (Du et al. 2021).
These literatures suggest that enhanced marketing emphasis requires TMT commitment, resource allocation, resource alignment, and strategic foresight focused on marketing activities that can create customer value. The priority is on the long-term performance of these beliefs and behaviors.
Earnings Emphasis
Turning to an earnings emphasis, accounting research has found that TMTs strategically choose to emphasize metrics that portray the firm more favorably in earnings releases (Bowen, Davis, and Matsumoto 2005). Earnings emphasis is the priority and focus that an organization places on achieving and reporting financial results. Specifically, financial management and cost control are considered “inside-out” capabilities of more internally oriented firms (Day 1994). These firms are “poorly guided by market considerations, which confines them to a narrow band toward the internal end of the orientation dimension” (Day 1994, p. 41). They may emphasize cost management (stringent control of expenses to maximize net income), efficiency improvements (streamlining operations to reduce waste and improve productivity), internal process focus (prioritizing activities that exploit current capabilities rather than exploring options that build future capabilities), and earnings management (focusing on explaining past earnings or managing investor expectations). This earnings emphasis can influence the corporate culture and behaviors, driving the organization toward activities that are expected to yield financial returns (Rust, Moorman, and Bhalla 2010), often with a strong focus on short-term performance indicators.
We expect that the TMT that has an enhanced earnings emphasis will place greater attention on discussing activities and outcomes, such as earnings, income, revenue, dividends, debts, taxes, interests, cash flows, costing, proceeds, returns, amortization, payoff, yields, and pricing. Consistent with the attention-based view of the firm, the more attention the TMT members pay to these accounting and finance features, the less attention they have for marketing processes, initiatives, and plans—qualities that lead to superior performance in the long run. Consequently, when the TMT emphasizes earnings (vis-à-vis marketing), it prioritizes immediate financial gains over long-term performance and, hence, is more likely to engage in myopic marketing spending. Therefore, we hypothesize that as the earnings emphasis of a firm increases, its propensity to be a myopic marketing spender in the future will be higher. On the contrary, as the marketing emphasis of a firm increases, its propensity to be a myopic marketing spender in the future will be lower.
Empirical Setup and Sample Construction
Source of TMT Communication
Widely available textual data and advances in analytical techniques make it feasible to examine a TMT's intentions by analyzing its communications. For example, researchers have measured TMT optimism (Brockman and Cicon 2013; Rogers, Van Buskirk, and Zechman 2011), self-serving attribution (Bettman and Weitz 1983), market orientation (Bhattacharya, Misra, and Sardashti 2019; Noble, Sinha, and Kumar 2002), future focus (Yadav, Prabhu, and Chandy 2007), frontline employees' solving and relational work (Marinova, Singh, and Singh 2018), and narcissism (Buyl, Boone, and Wade 2019) from such communications.
Sources of TMT communication include annual reports to the shareholders, 10-K and 10-Q filings, letters from CEOs, press releases, and earnings calls. Earnings calls also provide several advantages. First, they are bidirectional, that is, invited analysts can ask questions of the TMT members, which may offer more insight and predictive value (Tasker 1998). Second, over the years, scripted communications (e.g., annual reports) have increased in “length, boilerplate, stickiness, and redundancy, and decrease[d] in specificity, readability, and the relative amount of hard information” (Dyer, Lang, and Stice-Lawrence 2017, p. 223) and thereby may be less useful to our objectives. Third, earnings calls are incrementally informative and generate market reactions (Price et al. 2012).
Finally, earnings calls are conducted after earnings releases and follow a standard format: 10 to 15 minutes for an opening statement/presentation, then 20 to 40 minutes for a moderated question and answer (Q&A) session (Tasker 1998), which controls other factors. 2 Calls are live streamed and archived on firms’ websites, and select analysts are invited to ask questions unknown to the TMT ahead of time.
Proposed Empirical Approach
Figure 1 portrays a typical timeline surrounding the major events in the myopic marketing spending literature. TMTs’ myopic behavior in quarter t is observable to an investor when the quarterly earnings report (10-Q) for quarter t is released at the beginning of quarter t + 1. Analysts’ buy–sell recommendations for quarter t are updated after the earnings release from quarter t − 1. We account for the average analyst recommendation in our analysis. If analysts are capturing the essence of the earnings call, we should find no effect of TMT language on predicting myopia. Analysts’ EPS forecasts, intended to influence investors’ expectations and TMT behavior, are updated during the ongoing quarter t. Existing predictors of marketing myopia (SEO and share repurchases) are observable to investors in quarter t. Other financial controls (firm size, asset growth, and abnormal accruals) are observed when earnings reports are released in quarter t + 1.
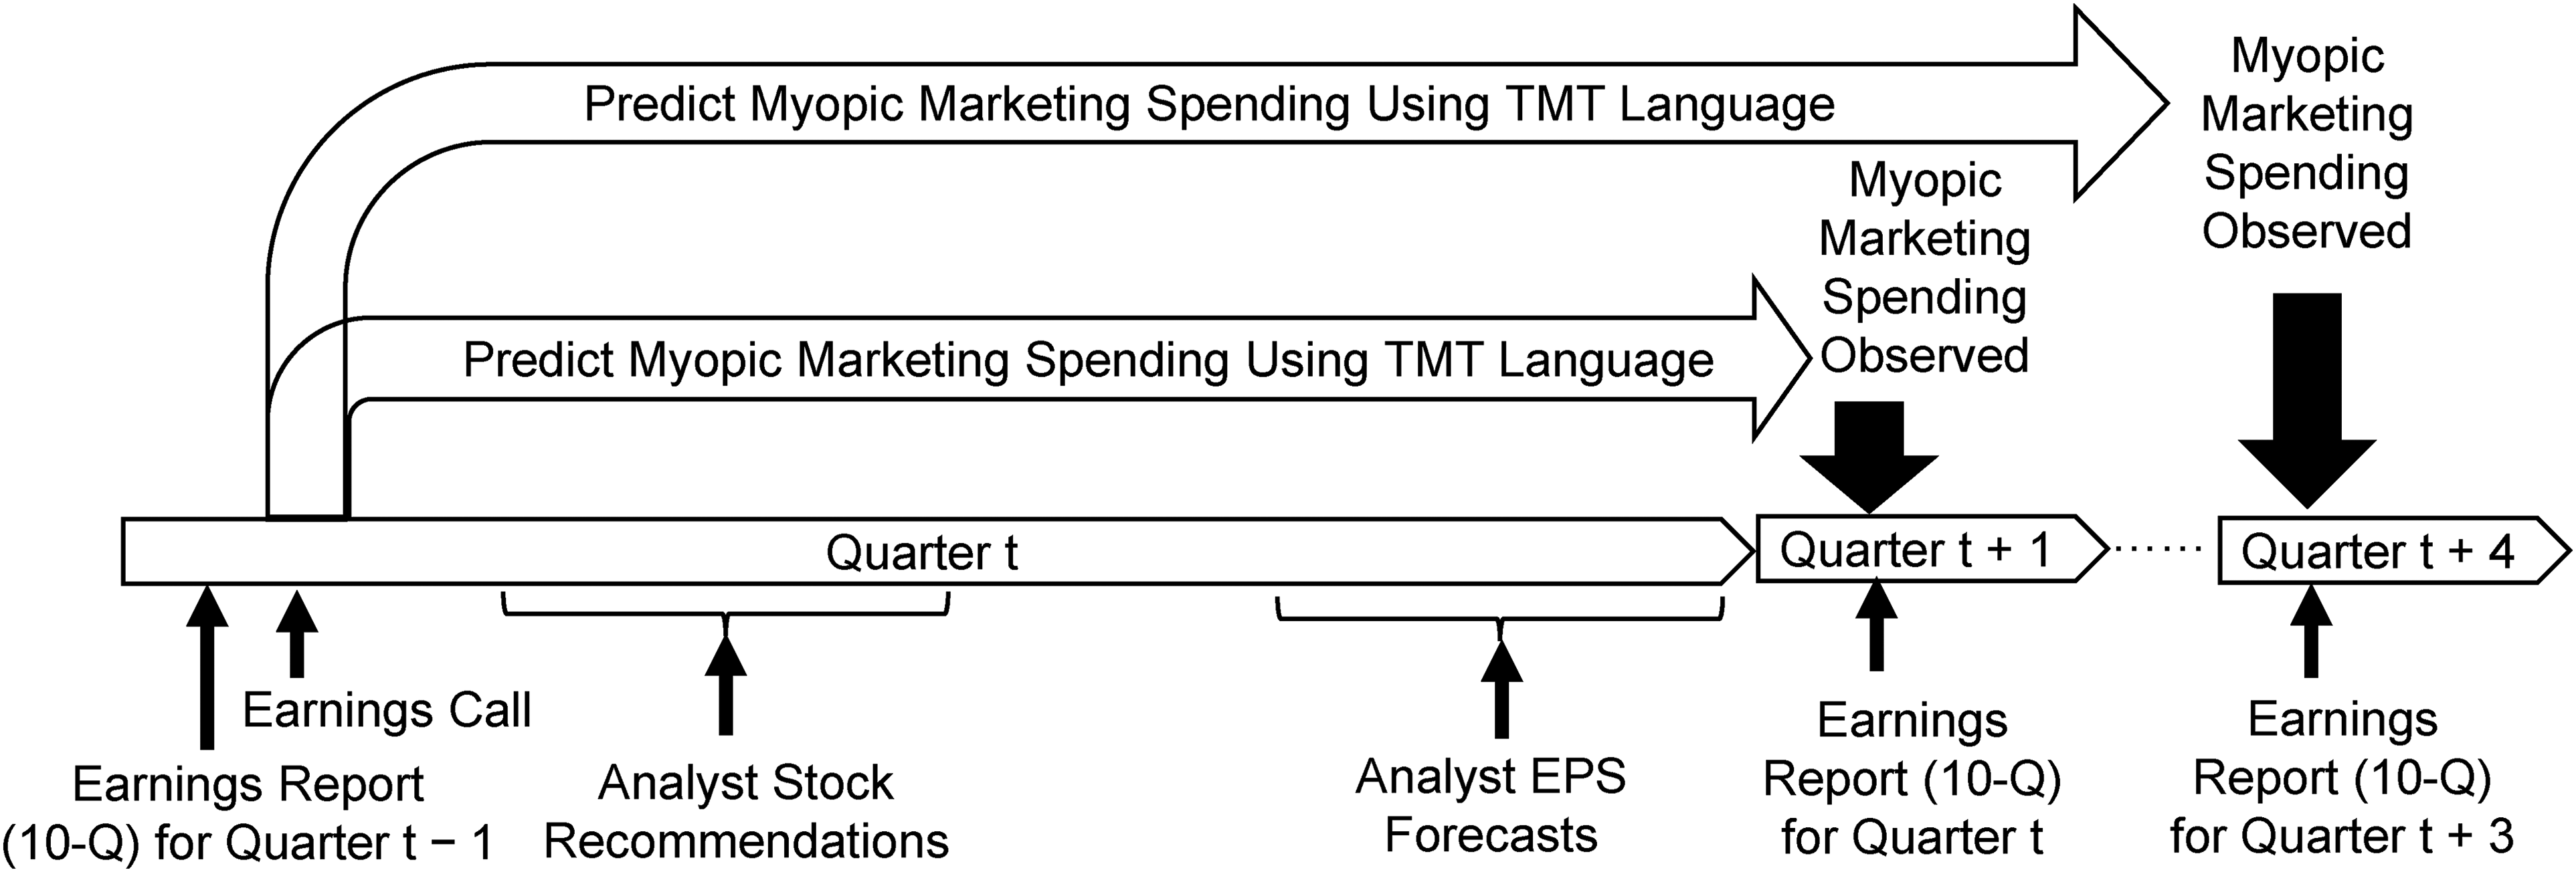
Timeline of Events Around Quarterly Earnings Releases and Conference Calls.
We expect TMT language from the earnings call at the beginning of quarter t to predict the likelihood of myopic marketing spending between quarter t + 1 and quarter t + 4, and this is the earliest prediction opportunity examined in the literature. Additionally, we expect a firm's likelihood of engaging in myopic marketing spending to rise as its TMT language focus on earnings intensifies in the calls. Conversely, we expect a firm's probability of engaging in myopic marketing spending to diminish as its TMT language emphasis on marketing increases.
Sample Construction
We combined data from four sources for the present study: (1) Seeking Alpha, a financial information website that transcribes earnings calls; (2) Compustat, for firms’ financial reporting; (3) SDC Platinum, for SEO dates; and (4) Institutional Brokers’ Estimate System (I/B/E/S), for analyst data. We obtained quarterly earnings call transcripts from 2008 through 2019 from Seeking Alpha, extracting 33,475 transcripts from 1,347 firms. From this same period, we acquired 68,850 quarterly observations for 1,369 firms from Compustat, 58,519 quarterly observations from I/B/E/S, and 1,252 SEO events for 548 firms from SDC Platinum.
Estimating myopic marketing spending at the quarterly level required us to use at least five consecutive quarters of Compustat data, resulting in an initial sample size of 51,036 observations from 1,324 firms. Then, we removed all observations with missing analyst information from I/B/E/S, resulting in a sample size of 41,367 quarterly observations from 1,274 firms. Finally, we excluded all observations without a corresponding transcript from Seeking Alpha. This resulted in a final sample of 24,754 quarterly observations from 1,197 firms (see Web Appendix A for a visual depiction). Our final sample covers more than 50 two-digit Standard Industrial Classification (SIC) codes, including manufacturing, retail, and technology. 3
Measures
Dependent Variable: Myopic Marketing Spending
Consistent with prior literature (see Bendig et al. 2018; Chakravarty and Grewal 2011; Currim, Lim, and Kim 2012; Kothari, Mizik, and Roychowdhury 2015; Mizik 2010; Srinivasan and Ramani 2019), we operationalize myopic marketing spending as an unanticipated decrease in marketing spending
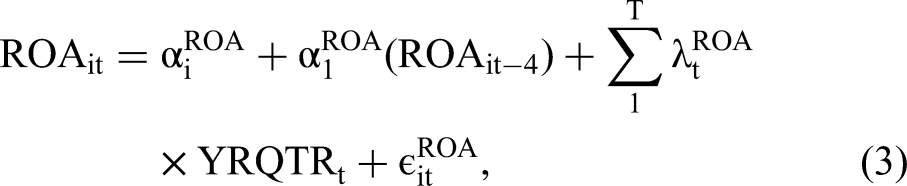
Following prior research (Mizik 2010; Srinivasan and Ramani 2019), we estimate panel data models to calculate normal levels of marketing spending, R&D spending, and earnings intensity:

When the 
Independent Variable: TMT Language
Text analysis techniques have become increasingly popular due to their ability to measure constructs from unstructured textual data. The field of computer science has provided several text analysis techniques—from bag-of-words to artificial neural networks—which vary in their ability, complexity, and usefulness. Entity extraction techniques such as bag-of-words use the frequency of the occurrence of words from a dictionary (Berger et al. 2020). The issue with this approach is illustrated by the following two sentences taken from actual earnings calls.
Relation extraction captures the semantic relationship between two or more entities from text. One approach is to capture word co-occurrence at the sentence level or via bigrams (co-occurrence of two consecutive words) (Ordenes et al. 2019; Toubia and Netzer 2017). Two issues arise with using co-occurrence. First, for frequently occurring words, their co-occurrence with nearly any other term will be greater than that of an infrequent term. Second, co-occurrence may not imply a relationship. Word relationships require identifying the linguistic relationship between entities (Netzer et al. 2012). This approach categorizes the entities of interest into their grammatical parts using part of speech (POS) encoding, then identifies the subject, verb, and object (SVO) words in a sentence. With POS and SVO, the relationships between the entities of interest can be inferred. We leverage this two-stage relation extraction process, which we outline in four parts: scope definition, simplification, proximity measurement, and measure validity (see Figure 2).
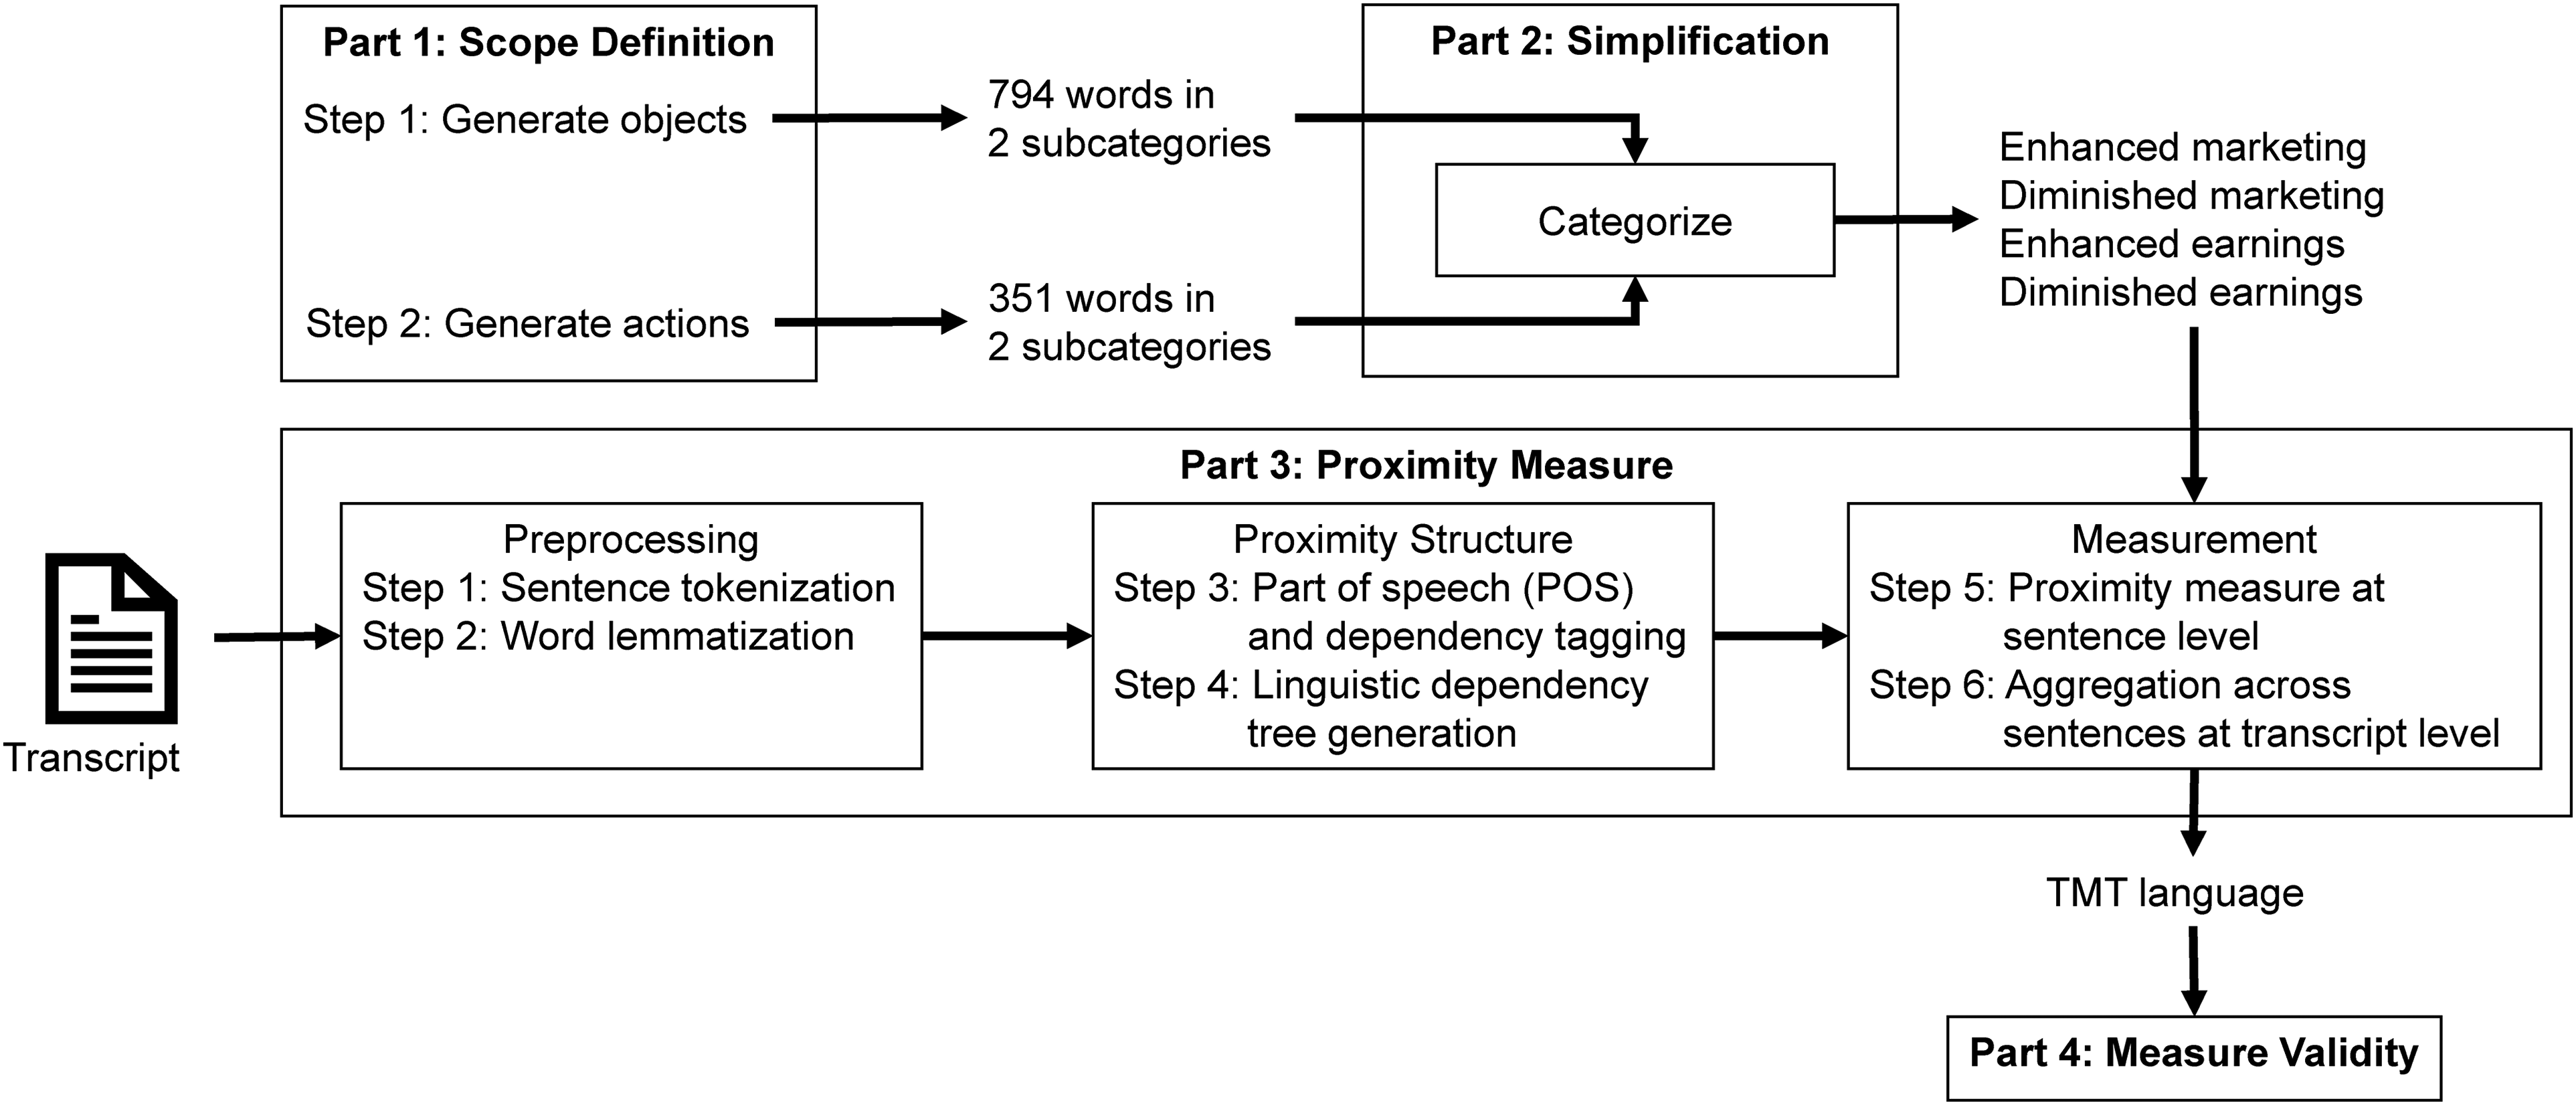
Empirical Framework for Measuring TMT Language.
Part 1: Scope definition
A collection of word pairs is needed for relation extraction to capture the myopic marketing content in TMT language. An approach that focuses on action (e.g., a verb) and object (e.g., a noun) word pairs is used to capture the TMT's intent to act.
In Step 1, we generate marketing “object” words by turning to three extant marketing constructs. We leverage these three existing dictionaries (see Web Appendix B) from peer-reviewed publications, because they capture a more holistic range of marketing and earnings language. We use word and phrase dictionaries for market orientation (377 words) developed by Zachary et al. (2011) and subsequently tested by Saboo and Grewal (2013). We use the dictionaries for marketing excellence (215 words) as well as eight dimensions of marketing capabilities (113 words) developed by Homburg, Theel, and Hohenberg (2020). This gives us 705 terms for the marketing emphasis construct. In addition, a dictionary with 76 terms focusing on earnings performance was adopted from Zachary et al., and 11 terms related to pricing performance were adopted from Homburg, Theel, and Hohenberg, resulting in 87 terms for the earnings emphasis construct.
In Step 2, we generate myopia “action” words. We searched myopia-related literature in marketing, management, operations, accounting, and finance. We collected 50 action words used in the definitions, operationalizations, and survey questions. These words were categorized by valence into 39 positive and 11 negative words. With synonyms, the resulting corpus included 908 positive and 386 negative valence words (Rodale 1986). The words were lemmatized using Python's spaCy package, and duplicates were removed, resulting in 214 positive and 137 negative valence words (total 351), reported in Web Appendix B.
Part 2: Simplification
We use a formative measure of marketing emphasis, drawing on language used by the TMT that reflects the subdimensions of market orientation, marketing capabilities, and marketing excellence. Likewise, we use a formative measure of earnings emphasis that reflects accounting and finance-related language, such as cost management, efficiency improvements, exploiting current capabilities, and earnings management (e.g., earnings, income, revenue, dividends, debts, taxes, interests, cash flows, costing, proceeds, returns, amortization, payoff, yields, and pricing).
To distinguish between an increasing or decreasing emphasis on earnings and marketing, we classify action words to reflect an enhanced emphasis or a diminished emphasis for both. The combination of two action categories with two object categories yields four focal measures of TMT language: (1) enhanced marketing emphasis, (2) diminished marketing emphasis, (3) enhanced earnings emphasis, and (4) diminished earnings emphasis. For each sentence, the algorithm calculates all four proximity measures, enabling identification of potentially asymmetric effects (Ordenes et al. 2017). Note that a small magnitude of enhanced (diminished) marketing emphasis conveys less emphasis by the TMT on positive (negative) valence on marketing, and a large magnitude on those measures conveys more emphasis, respectively. The same stands for two valence measures on earnings emphasis.
Part 3: Proximity measurement
Dependency parsing, or relation extraction, refers to a specific way to describe the syntactic structure of a sentence. We capture a sentence's syntactic structure by the directed binary grammatical relations between its words rather than grammar phrasal constituents, dependency formalisms, and phrase-structure rules (Jurafsky and Martin 2000). This makes analyzing languages that are morphologically rich and free of word order possible, because dependency parsing abstracts away from word order and represents only the information necessary for parsing. The five-step relation extraction process is explained in Web Appendix C. We measure proximity as the inverse of Dijkstra's distance (Dijkstra 1959) between action and object words. Each sentence of every transcript in our data set is processed using the five-step algorithm. Given that we have 794 “object” words and 351 “action” words, we search for the existence of all 278,694 combinations of word pairs in each of the 10.7 million sentences.
The benefit of measuring word pair proximity over co-occurrence or bigrams is that because the tree is based on linguistic dependency, the physical spacing of words in the sentence is irrelevant. For example, compare the linguistic and physical distance between the words “reducing” and “costs” in the following sentences:
Part 4: Measure validity
When generating a new measure, it is important to establish external and internal validity. Internal validity accounts for potential variations in interpreting words across various contexts (Berger et al. 2020). We account for two types of internal validity: construct validity (i.e., does the operationalization represent the theoretical construct?) and concurrent validity (i.e., does the measure relate to prior operationalizations?).
We establish construct validity via three dictionary validation studies. The first two studies were conducted with 194 and 196 undergraduate student participants enrolled in a marketing core course at a nationally ranked East Coast university, who participated for grade credit. They were presented with TMT language word pairs and their use in a sentence from a transcript. They were then asked to validate (1) whether the object word was a marketing or earnings emphasis word, (2) whether the action word had enhanced or diminished focus on an object word, and (3) their belief about how strongly the action word referred to the object word on a five-point scale. In total, participants were presented with 463 sentences, with balance across the four action–object combinations. On average, eight participants evaluated each sentence. Because marketing emphasis is a complex, multidimensional construct, we ran a third study with four marketing PhD students at a nationally ranked East Coast university, to further validate dictionary measures. We presented the four PhD students with 30 marketing emphasis words and 30 earnings emphasis words, which were randomly selected along with four example sentences from the transcripts that used the words in question. The students were then asked to classify each word as marketing emphasis or earnings emphasis. Results from the validation studies are shown in Table 2 and suggest that not only are humans correctly classifying the words, but the proximity measure is also closely approximating human interpretation of linguistic relationships.
Measure Validity.

Concurrent validity substantiates how the operationalization of the construct relates to prior operationalizations (Berger et al. 2020). We establish concurrent validity by constructing the marketing emphasis and earnings emphasis dictionaries from three published dictionaries: marketing orientation (Saboo and Grewal 2013; Zachary et al. 2011), marketing capabilities (Homburg, Theel, and Hohenberg 2020), and marketing excellence (Homburg, Theel, and Hohenberg 2020). The same four marketing PhD students were presented with definitions of marketing emphasis and earnings emphasis and then were asked to rate their similarity compared with the definitions of marketing orientation, marketing capabilities, and marketing excellence. The results (shown in Table 2) suggest that the operationalization of marketing emphasis correlates with the operationalizations of subsumed marketing constructs.
External validity ensures whether the effects found in the text apply outside of the research framework (Berger et al. 2020). We establish external validity by using TMT language to predict myopic marketing spending (generalizability) and establish its predictability via a holdout sample. Details about the measurement validation are presented in Web Appendix E.
Independent Variables: Existing Predictors and Contemporaneous Controls
Consistent with the extant literature, we include events and firm characteristics known to correlate with myopic spending. In Table 3, we report the measurement details of these variables.
Measurement of Existing Predictors and Controls.

Model Specification
Our dependent variable, myopic marketing spending, that is, MMSit+1, is a binary variable that takes a value of 1 if a firm i engages in myopic marketing spending (unexpected declines in R&D and SGA expenses when firms reported an earnings surprise) in quarter t + 1; therefore, we use a Probit regression model for panel data. We use the following model specification with normally distributed errors (ε):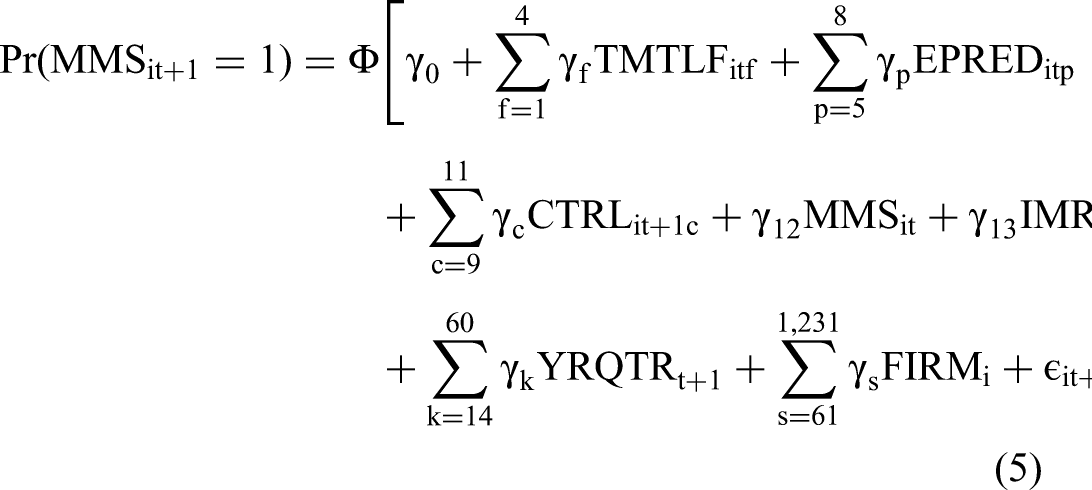
We consider the possibility of sample selection bias because a firm's decision to report R&D or SGA expenses, especially at the quarterly level, or Seeking Alpha's decision to transcribe earnings calls may not be random. We use Heckman's sample selection model, where the first stage is identified by the number of financial analysts covering a firm (see Web Appendix G for first-stage results). We include the inverse Mills ratio (IMRit) for selection control.
Finally, we account for heterogeneity over time and across firms. We include time fixed effects (YRQTRt) to control for unobserved factors that vary over time but are common to all firms (e.g., macroeconomic factors). We also include firm fixed effects (FIRMi) to control for unobserved factors specific to a firm but that are time-invariant (e.g., firm culture). Because our model includes both a lagged dependent variable and fixed effects, it is possible that our results may contain Nickell bias; however, because we have a “reasonably large” time horizon (T = up to 43, average 20.73), we determine that Nickell bias is not a concern (Nickell 1981).
Descriptive statistics on and correlations between key variables are reported in Table 4. These correlations are based on both cross-sectional and time-series variations. We find that myopic marketing spending is observed for 21.0% of firm-quarter observations using all the Compustat data (47,462 firm-quarter observations), which is in line with Mizik (2010) at 20.7% at the firm-year level. After observations are dropped due to transcript availability, marketing myopia is observed for 23.9% firm-quarter observations, which is comparable to Bendig et al.’s (2018) finding of 24.5% at the firm-year level, but higher than Srinivasan and Ramani's (2019) 15% at the firm-year level. A potential explanation for this higher rate could be myopic marketing spending being calculated at the quarterly level versus the yearly level. This allows three additional opportunities within a year to detect myopic marketing spending. Another potential cause is the difference in firms and date ranges used across prior literature. In general, language pertaining to enhanced focus is more common than language pertaining to diminished focus. We find that SEO is a rare event and affects only 1% of observations. The average EPS forecast is 44 cents, and the average analyst has an optimistic recommendation, at 2.24 (between hold and buy).
Summary Statistics of and Correlation Between Key Variables.
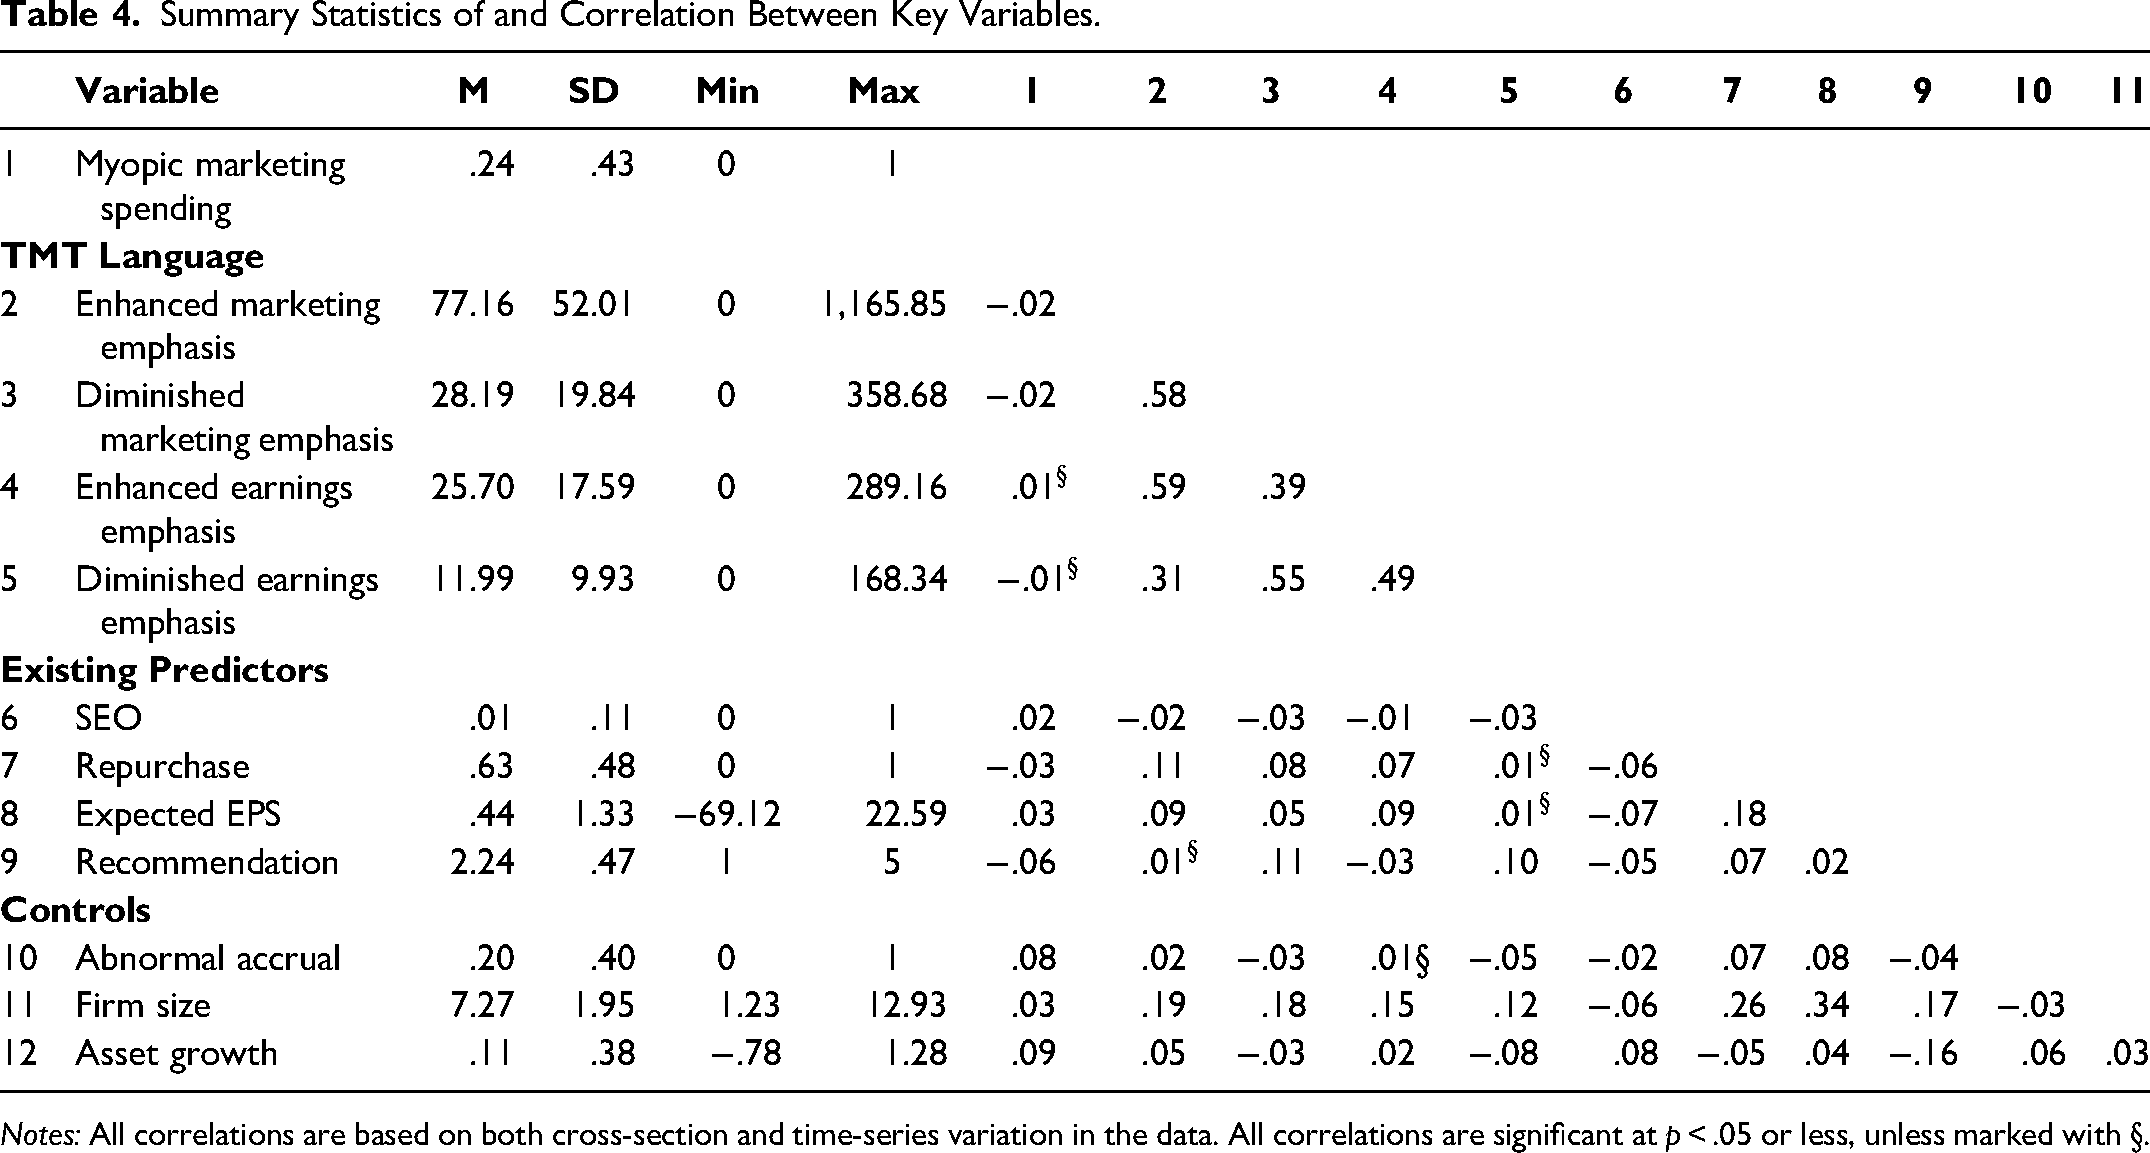
Notes: All correlations are based on both cross-section and time-series variation in the data. All correlations are significant at p < .05 or less, unless marked with §.
Results
Model Evolution and Fit
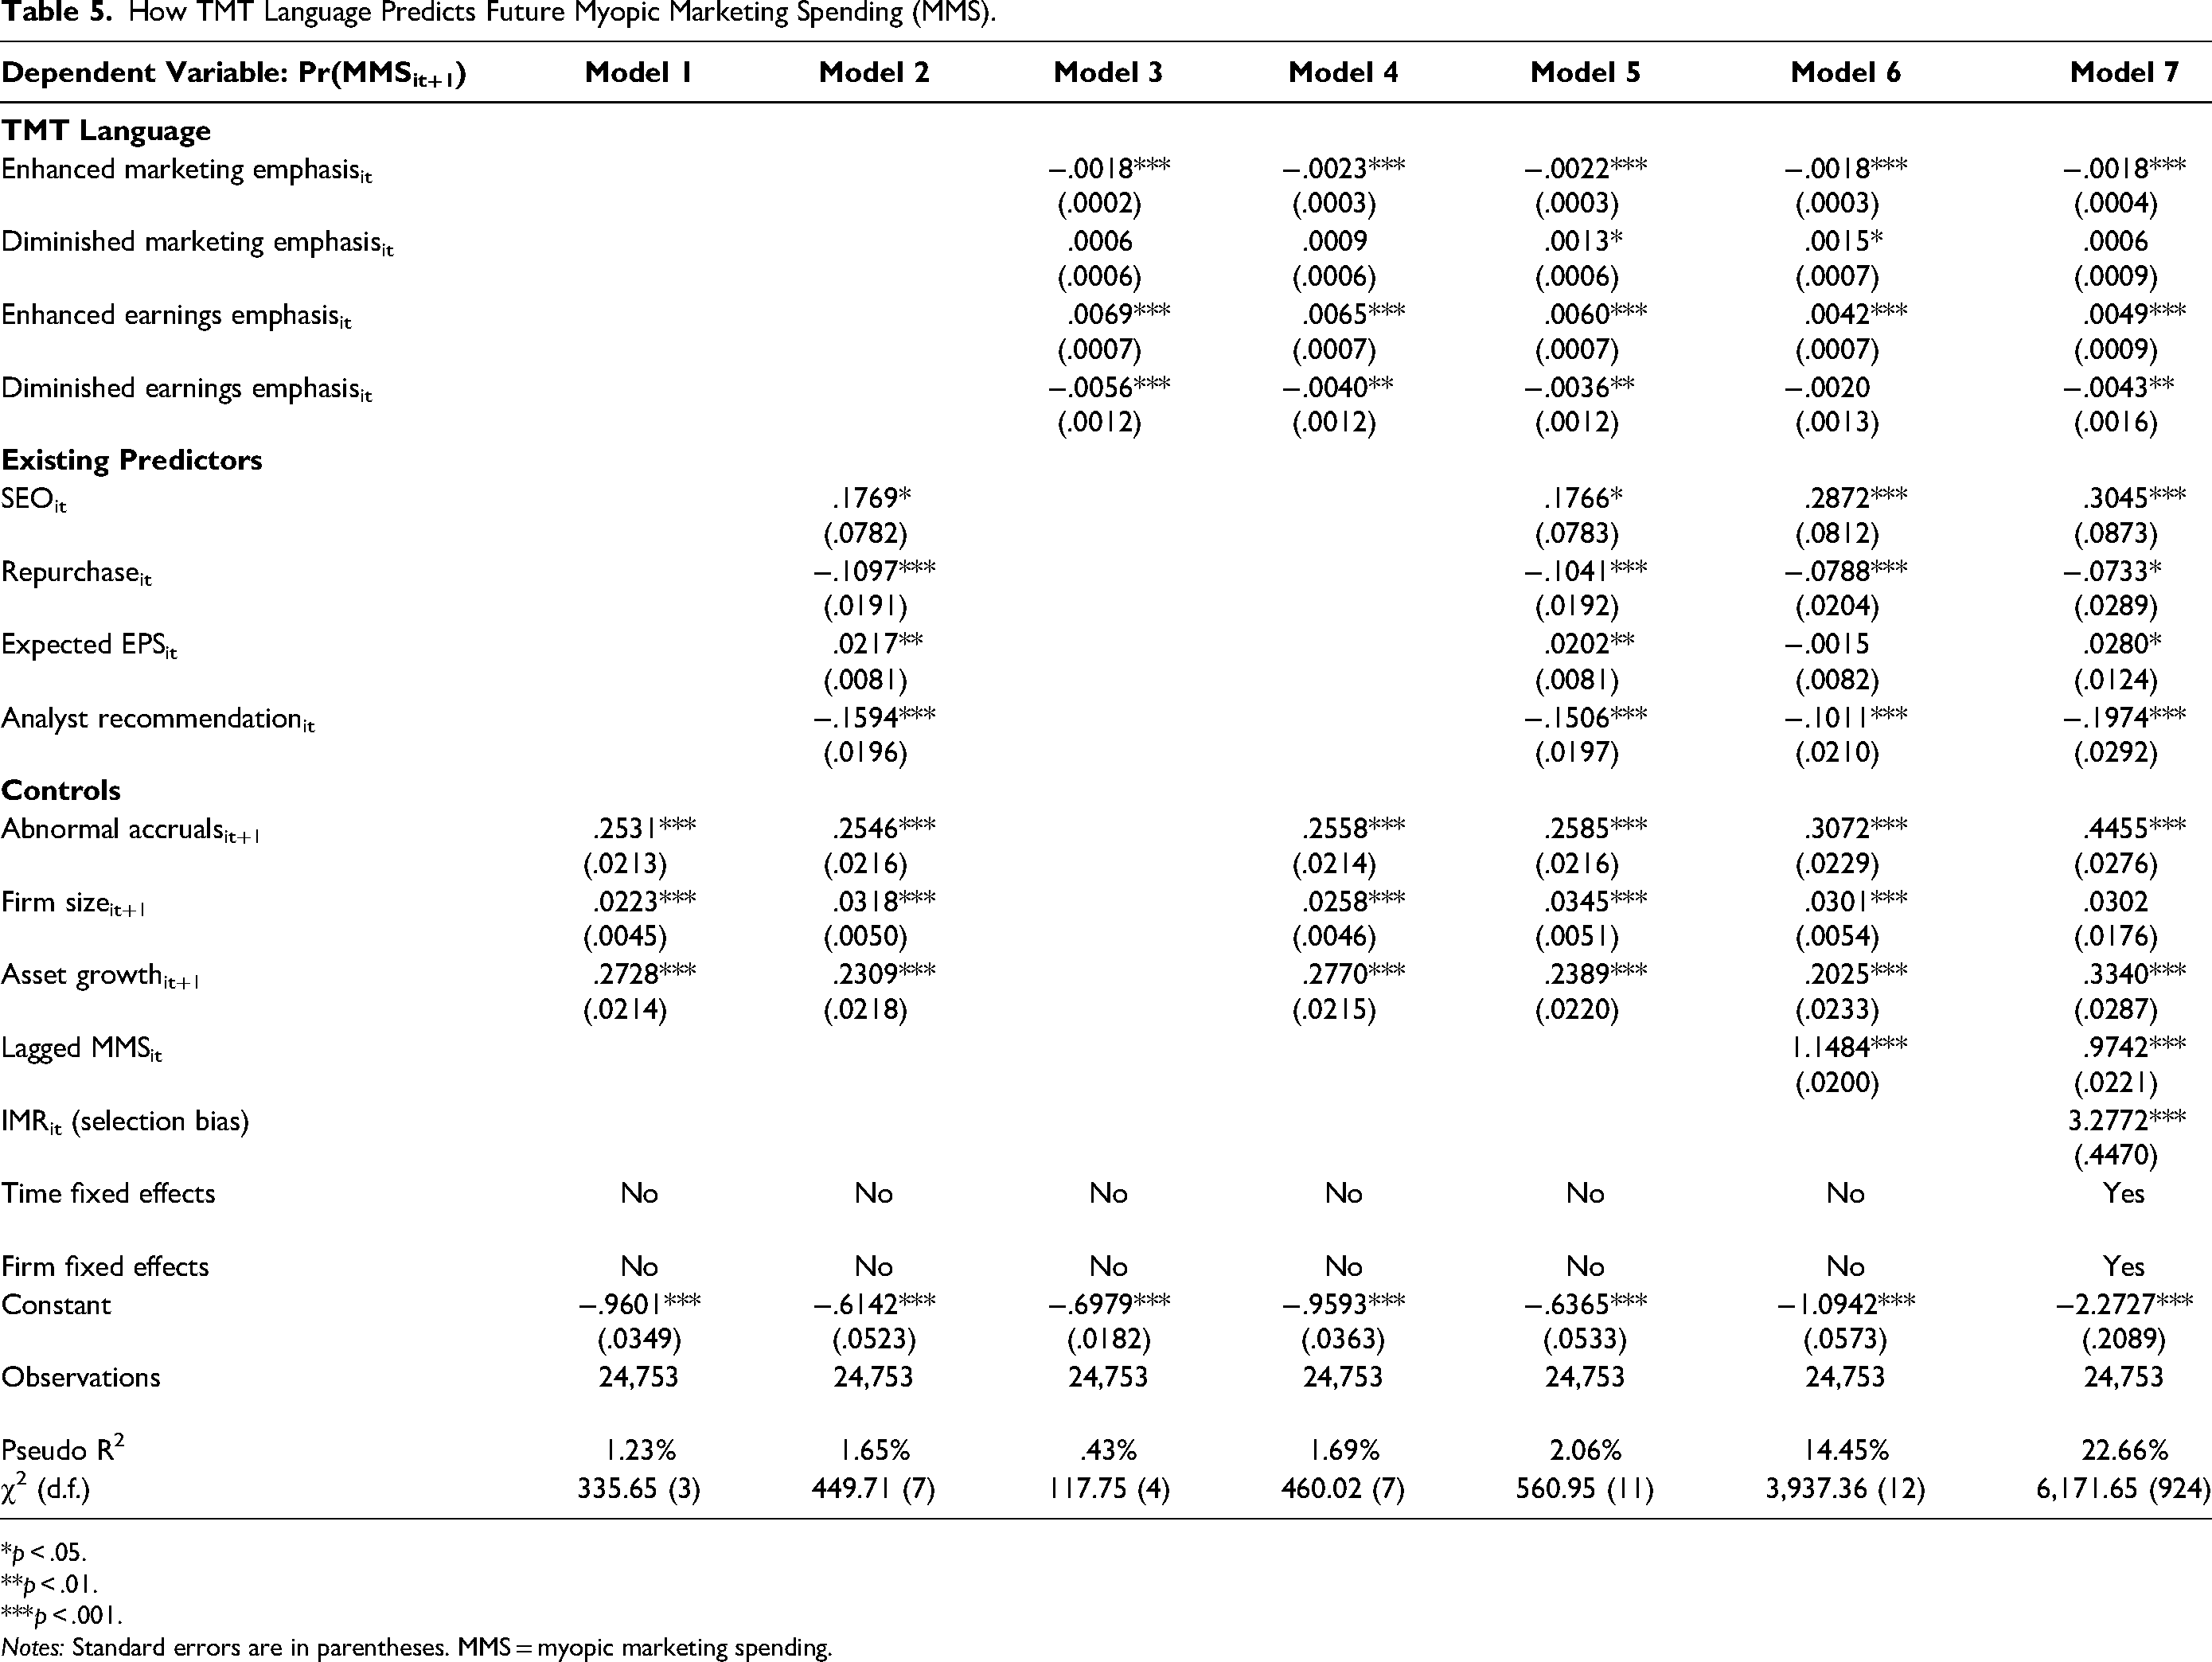
Table 5 presents the main results in a nested fashion (Model 1–Model 7). Model 1 captures the impact of contemporaneous controls on the likelihood of myopic marketing spending, whereas Model 2 evaluates the impact of existing predictors and these controls. Models 3 and 4 evaluate the impact of TMT language by itself and in the presence of contemporaneous controls. Comparing Model 2 (existing + controls) to Model 4 (TMT language + controls) shows an increase in model fit captured by both psuedo R2 (1.65% to 1.69%) and χ2 (449.71 to 460.02). The pseudo R2 measures improvement in the log-likelihood fit of a model with predictors over the intercept-only model. 5 Model 5, which combines TMT language, existing predictors, and controls, improves the model fit compared with Models 2 and 4, implying that adding TMT language to existing predictors increases explanation power in the prediction of myopic marketing spending. When we add the lagged myopic marketing spending to Model 6 to capture state dependence of the prior quarter, the pseudo R2 jumps to 14.45%. Model 7 controls for unobserved heterogeneity over time and across firms via fixed effects and adds the IMR for sample selection control. 6 This model has the highest pseudo R2, 22.66%, and we use it for interpreting our results. Finally, the included IMR is positive and significant (3.2772; p < .001). This means that selection control was necessary; otherwise, the coefficients would be biased.
How TMT Language Predicts Future Myopic Marketing Spending (MMS).
*p < .05.
**p < .01.
***p < .001.
Notes: Standard errors are in parentheses. MMS = myopic marketing spending.
Predicting Myopic Marketing Spending
The results suggest that myopic marketing spending is correlated with an increase in abnormal accruals (.4455; p < .001), which mirrors Mizik (2010). Firms that exhibit asset growth (.3340; p < .001) are more likely to engage in myopic marketing spending. With respect to existing predictors, the announcement of an SEO increases the likelihood of myopic marketing spending (.3045; p < .001), which is consistent with Mizik and Jacobson (2007). However, the rate of firms engaging in SEO is very low (M = .12, SD = .11), precluding it from being a useful tool for predicting myopic marketing spending. Contrary to Bendig et al. (2018), we find that firms that repurchase shares are less likely to engage in myopic marketing spending (−.0733; p < .05). 7 Analyst input can also detect myopic marketing spending. We observe that optimistic stock recommendations (i.e., a lower number) are associated with a greater likelihood of subsequent myopic marketing spending (−.1974; p < .001). Firms that engage in earnings accruals receive more optimistic recommendations from analysts (Bradshaw, Richardson, and Sloan 2001). We find that higher expected EPS, that is, analysts’ earnings forecasts, are associated with a higher likelihood of myopic marketing spending (.0280; p < .05), which is consistent with Chakravarty and Grewal (2016) and Currim, Lim, and Zhang (2018). Although analyst announcements happen quarterly, they still suffer from positive client and optimism bias (Cowen, Groysberg, and Healy 2006; Hayward and Boeker 1998), self-interests to gain firm favor (Ke and Yu 2006), and firm impression manipulation (Westphal and Graebner 2010). In addition, they offer only a few weeks for investors to react, and because they are widely available, they are not a source of usable private information (i.e., this information is already priced in the stock as soon as it becomes publicly available).
Myopic marketing spending from the prior quarter increases the likelihood of myopic marketing spending in the current quarter (.9742; p < .001). These results are driven primarily by the fact that more than three-fourths of firm-quarter observations are nonmyopic; thus, two consecutive quarters of nonmyopic observations are common. On the contrary, there are only 12.5% instances when a firm is myopic in two consecutive quarters. 8 This suggests that TMTs are strategic in their choice of when to be myopic in marketing spending.
“Marketing emphasis” refers to the strategic focus or priority that an organization places on marketing activities or market-driven philosophies. We have argued that when the TMT exhibits enhanced marketing emphasis, it signals its intentions to prioritize marketing and its long-term benefits to the firm, and hence is less likely to be myopic in marketing spending. “Earnings emphasis” in a business context typically refers to the priority and focus that an organization places on achieving and reporting financial results. We find that when the TMT uses language with focus on enhancing marketing emphasis (−.0018; p < .001) or diminishing earnings emphasis (−.0043; p < .01), the firm is less likely to engage in myopic marketing spending in the subsequent quarter. Pragmatically, we caution the reader that not observing the TMT using language focused on enhancing marketing emphasis or diminishing earnings emphasis does not increase the likelihood of myopic marketing spending. The absence of these characteristics in the TMT language does not prove the counterfactual that a particular outcome will not occur.
Instead, we turn to other characteristics of TMT language to predict myopic marketing spending. We find that when the TMT language has an enhanced earnings emphasis, firms are more likely to engage in myopic marketing spending (.0049; p < .001). A one standard deviation change from the mean translates to a 23.68% increase in the likelihood of myopic marketing spending. These are significant findings for several reasons. First, they highlight the importance of TMT language to understand the TMT's intentions. Second, the relative emphasis between marketing and earnings signals the TMT's strategic focus and how increase in one comes at the expense of the other, thereby indicating the TMT's intentions to be myopic in the future. Finally, the significant effect of TMT language after controlling for existing predictors, controls, unobserved time, and firm heterogeneity speaks to the power of such analysis.
The results support our proposition that how much attention the TMT places on earnings-related information (vis-à-vis marketing) signals its strategic priorities to investors. The more attention the TMT members pay to accounting and finance features, the less attention they have for marketing processes, initiatives, and plans that lead to superior performance in the long run. Thus, the TMT that emphasizes earnings (vis-à-vis marketing) is prioritizing immediate financial gains over long-term performance and hence is engaging in myopic marketing spending.
Holdout Sample Analysis
In this section, we (1) examine whether TMT language can be used to predict myopic marketing spending more than one quarter in advance and (2) benchmark the predictive accuracy, in a holdout sample, of our approach against models that solely rely on existing predictors (Humphreys and Wang 2018). We retain a random 30% of quarterly observations for each firm in a holdout sample. We use the calibration sample to estimate a model with existing predictors only and a model with existing predictors plus TMT language, where the outcome variable is incidence of myopic marketing spending up to four quarters in the future.
We forecast the probability of myopic marketing spending in the holdout sample and leverage the area under the curve (AUC) to evaluate the fit of each model (He, Hollenbeck, and Proserpio 2022). AUC is equivalent to the probability that a randomly chosen instance of myopia will be ranked higher by a classifier than a randomly chosen nonmyopic instance (Fawcett 2006). AUC is based on a trade-off between true positives and false positives over an entire range of probability cutoffs; hence, it is more suited for evaluating skewed outcomes. AUC is a continuous measure from zero (no accuracy) to 100% (perfect accuracy).
The results (reported in Web Appendix H) echo the main findings that TMT language containing enhanced earnings emphasis can predict myopic marketing spending for up to four quarters in the future (one quarter: .0047; p < .001; two quarters: .0034; p < .001; three quarters: .0035; p < .001; four quarters: .0018; p < .05). For each prediction window, the out-of-sample AUC of the model that incorporates TMT language is larger than the one that uses existing predictors only (see Table 6). For example, four quarters out, the out-of-sample AUC for the model with existing predictors only is 60.77%, compared with 61.03% for the model incorporating TMT language. The greatest difference in AUC is observed for the prediction two quarters ahead.
Predictive Validity Performance.

Monetary Impact
Our findings can be leveraged to identify their monetary impact. We compare the financial returns of firms that engage in myopic marketing spending with the financial returns of those that do not. Using calendar-time portfolio analyses, with Carhart's (1997) four-factor model as a benchmark, we compare abnormal returns of three competing investment approaches on two different types of portfolios (Sorescu, Shankar, and Kushwaha 2007).
We create six portfolios of stocks: three investment strategies for firms that engage in myopic marketing spending and the same three investment strategies for those that do not engage in myopic marketing spending. The first investment approach is a “perfect foresight” strategy. A firm is flagged as myopic if it is observed to be a myopic marketing spender during the following year; else it is flagged as nonmyopic. This strategy mimics the theoretical optimum, that is, finding the maximum possible returns to be captured if one had the ability to foresee the future perfectly. In the second approach, we leverage the predictive model with existing predictors only and flag firms that are predicted to be myopic (and nonmyopic) in the next year. Thus, this strategy mimics the current state of knowledge in our ability to predict myopic marketing spending. The third approach captures the essence of this article, that is, it flags a firm as myopic if the model with existing predictors plus TMT language predicts that a firm will be myopic the following year.
We estimate the abnormal returns for each portfolio using Carhart's four-factor model, which includes controls for momentum (Carhart 1997) as follows: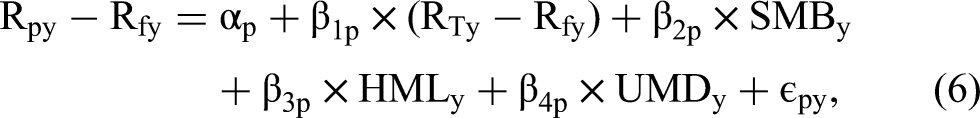
To examine the short- and long-term effects of myopic marketing spending, we calculate the abnormal returns for investing an initial $100 in each of the six portfolios and analyze their performance after one quarter (short term) and up to four years (long term). Figure 3 shows the difference in returns of nonmyopic minus myopic portfolios from the three investment approaches. We find that, regardless of investment strategy, myopic portfolios, on average, produce 3.68% higher abnormal returns than nonmyopic portfolios in the short run, that is, when the firm has behaved myopically. However, at the end of the fourth year, the average abnormal return of the nonmyopic portfolio is 35.33% greater than that of the myopic portfolio. This result is consistent with Mizik (2010) and Saboo, Chakravarty, and Grewal (2016), who also find that myopic firms perform better (worse) in the short (long) run.

Abnormal Returns from Calendar-Time Portfolio Analysis.
Importantly, we also find that investment based on the model that uses existing predictors plus TMT language extracts a greater portion of optimal returns than the model that uses existing predictors only. A “perfect foresight” strategy would have 61.41% greater returns for the nonmyopic (vs. myopic) portfolio at the end of year four. In comparison, the strategy that also incorporates TMT language would produce a 25.51% greater abnormal return for the nonmyopic portfolio versus a myopic portfolio, compared with 19.07% for the model that uses existing predictors only. The improvement of 6.44% in returns is attributable to the additional predictive power of TMT language. This translates to 1.61% difference in average annual returns, which is comparable to similar effect sizes reported in the literature: .55% for ratchet strategy over consistent strategy (Moorman et al. 2012), .41% for recall initiation (Liu, Shankar, and Yun 2017), and 2.14% between marketing excellence and market orientation (Homburg, Theel, and Hohenberg 2020).
Additional Analysis
Temporal referencing
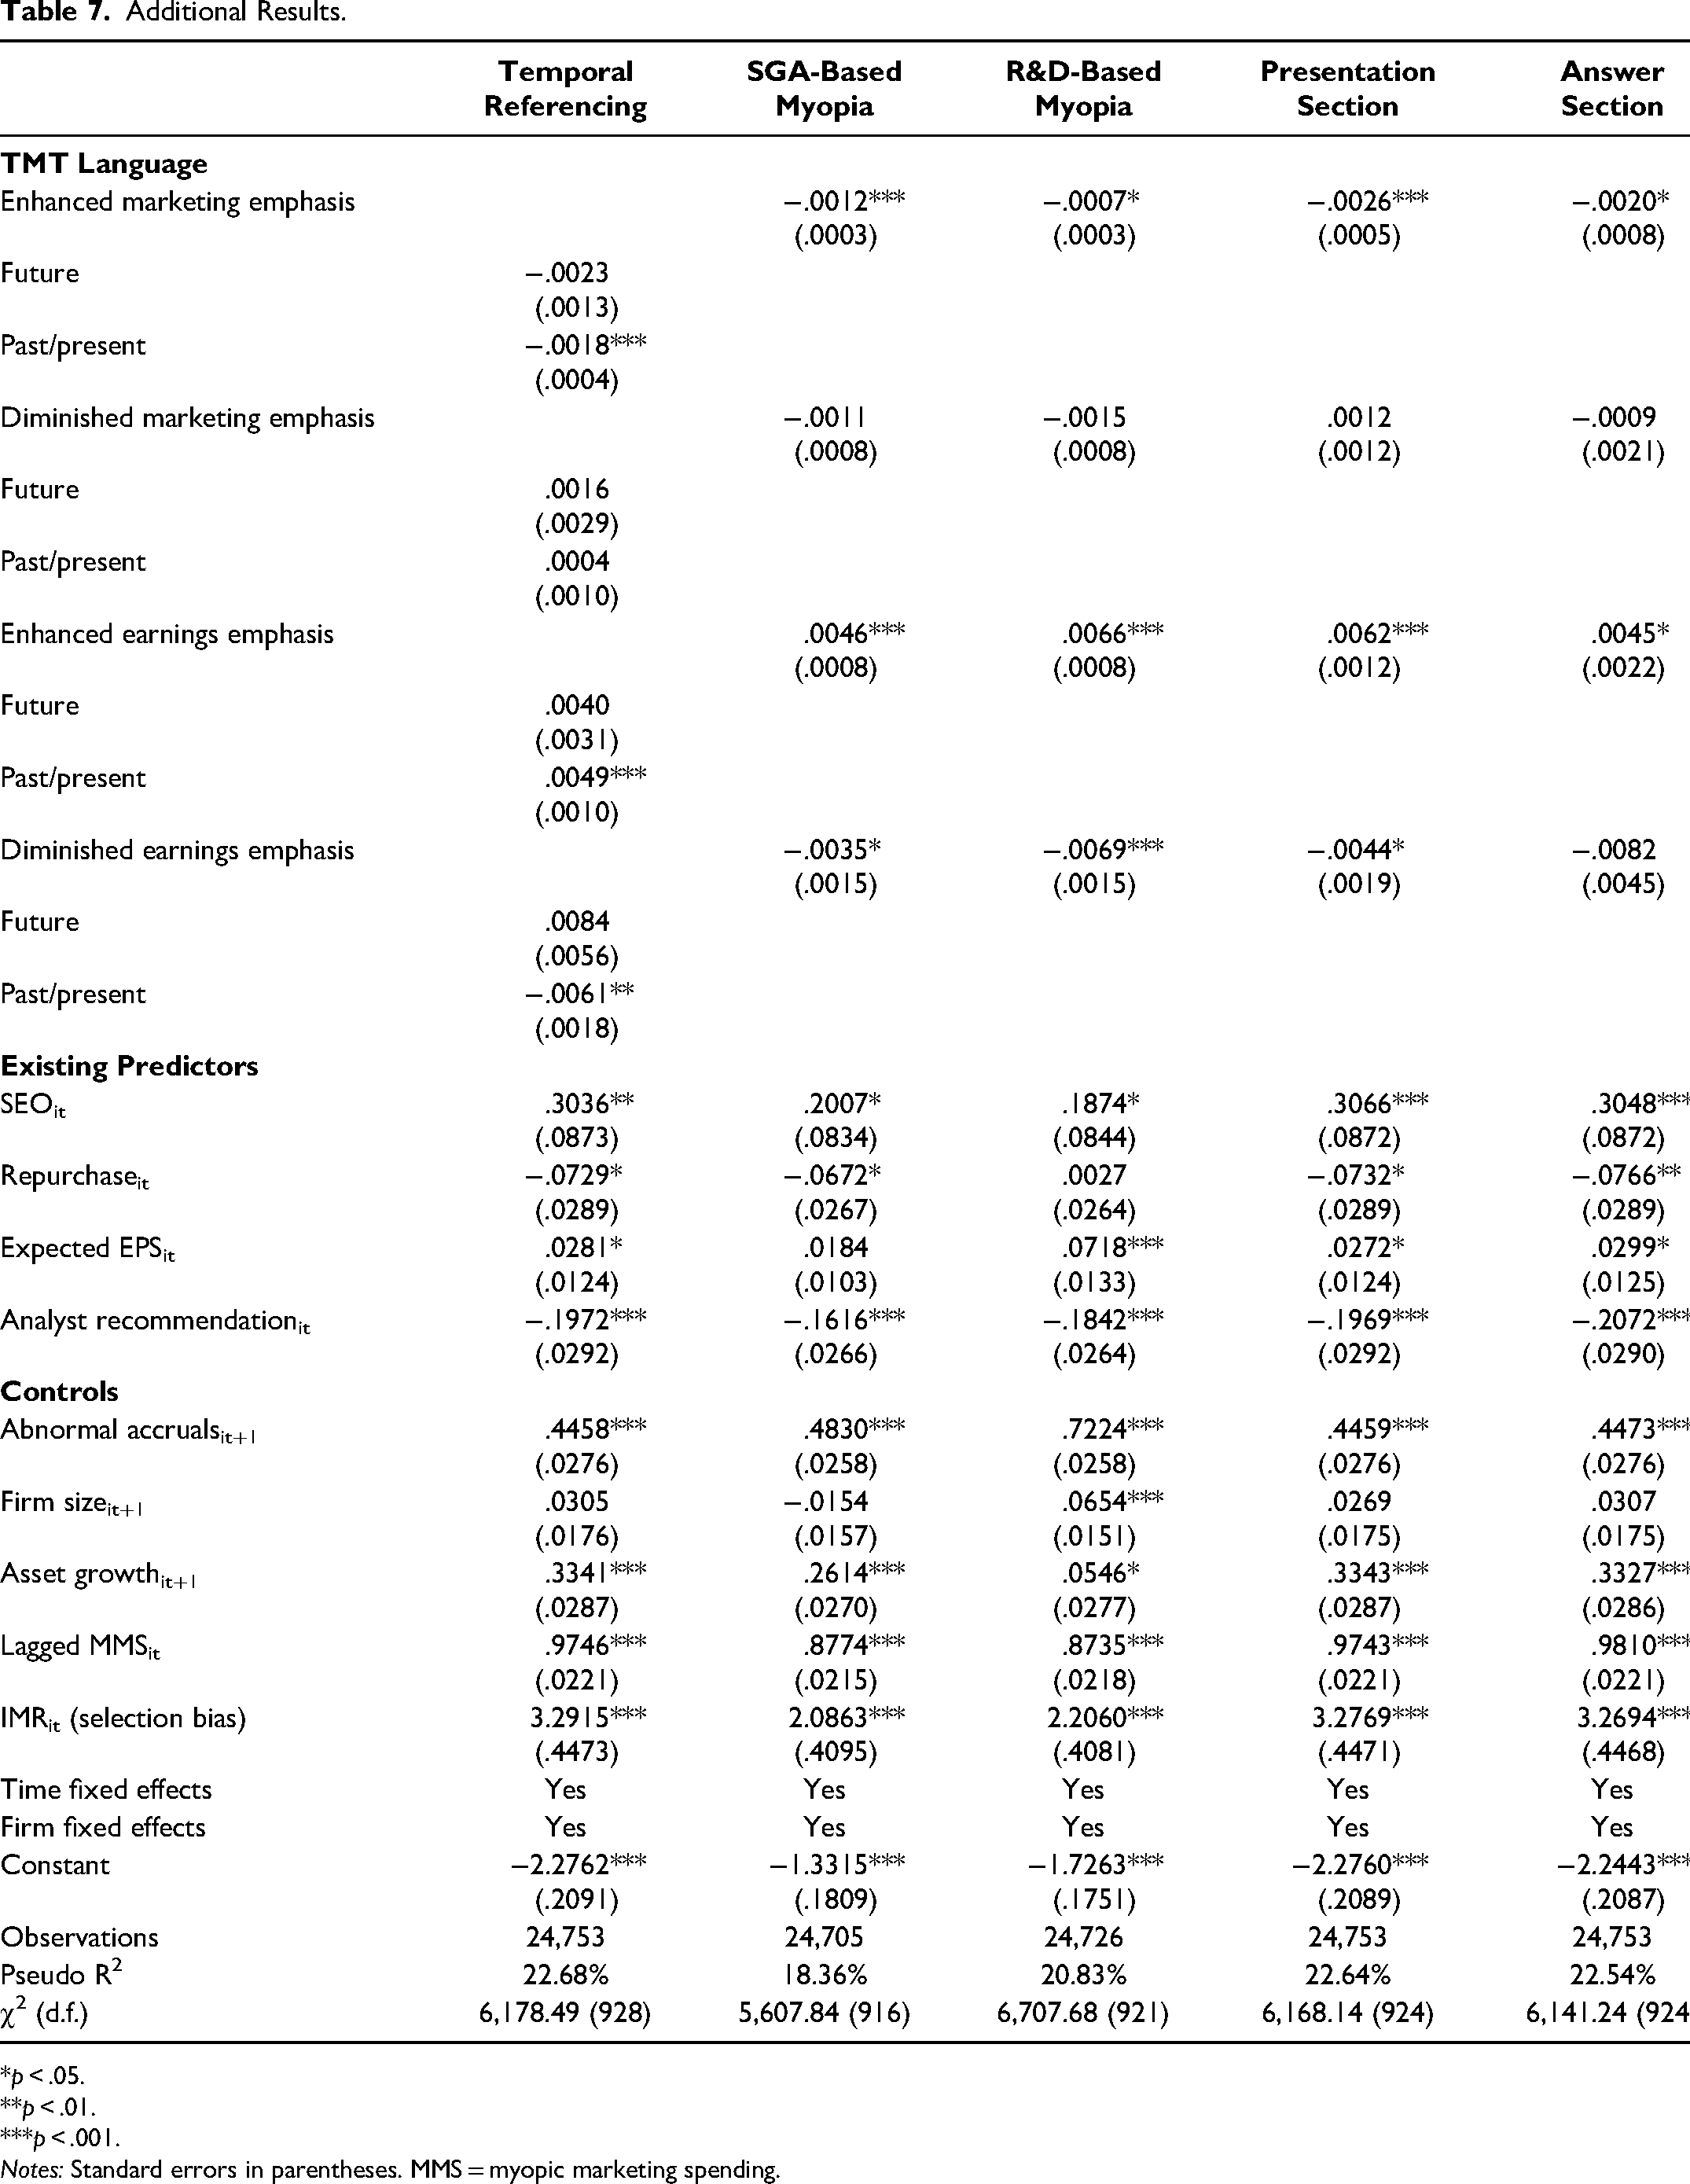
It is plausible that the TMT language may describe a past occurrence or allude to the future. To capture this future focus, consistent with Hong and Hoban (2022), we leverage the Linguistic Inquiry and Word Count (LIWC) future tense dictionary by looking for words and phrases that indicate future tense (e.g., “going to,” “will,” “shall”). We only flag TMT language word pairs as future tense if the verbs and their support words (e.g., auxiliary verbs) contain one or more of the LIWC future tense words/phrases. Otherwise, the word pair is flagged as present or past tense. This new measure doubles the four existing TMT language variables to account for future tense and present/past tense. The results, reported in the first column of Table 7, show that the myopic marketing spending prediction power of enhanced earnings emphasis comes from sentences with a past/present focus (.0049; p < .001). This result reflects the intertemporal trade-offs that the TMT makes when engaging in myopic marketing spending, that is, enhanced earnings now at the expense of diminished marketing now or in future.
Additional Results.
*p < .05.
**p < .01.
***p < .001.
Notes: Standard errors in parentheses. MMS = myopic marketing spending.
Different types of myopia
Firms may decide to make a trade-off between which type of expenses to curtail, that is, either SGA or R&D. To gain insight, we create two new operationalizations of myopic marketing spending:

Different parts of transcripts
An earnings call is divided into two sections: a presentation, during which TMT members speak, and a Q&A section, during which TMT members respond to analysts’ questions. To understand the informative content of the different sections of the transcripts, we remeasure the four TMT language variables from the “presentation only” and “answers only” sections of the transcripts and reestimate the model. The results (see Table 7) and model fit between the two sections are comparable, suggesting that both sections of the transcripts have informative content.
Robustness Checks
We conduct several robustness tests, the results of which are reported in Web Appendix J.
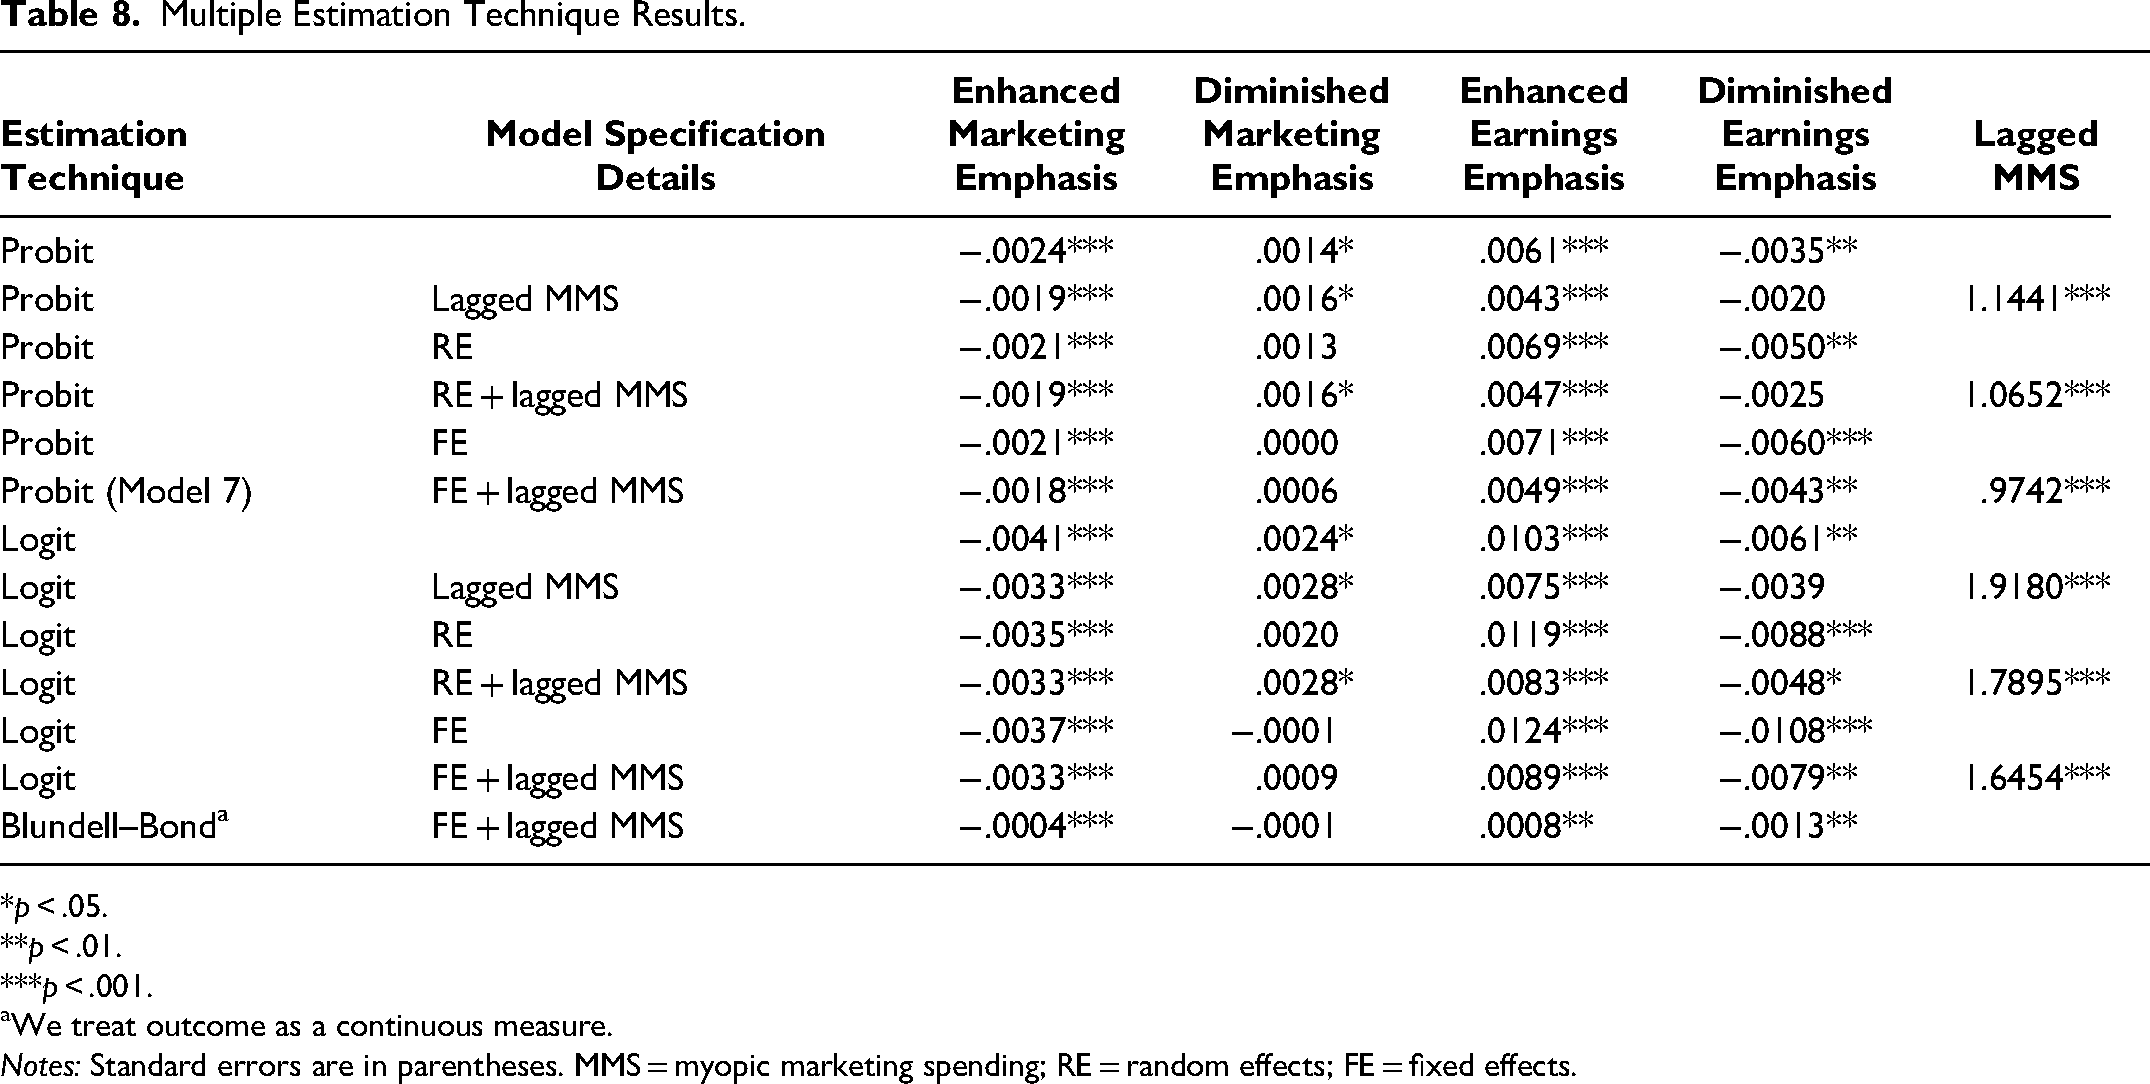
Multiple estimation techniques
We report the sensitivity of our results to different model specifications and estimation. We estimate the full model using two discrete dependent variable estimators (logit and probit) and one dynamic estimator (Blundell and Bond 1998). We also changed the model specification to include random effects, fixed effects, and lagged myopic marketing spending. Table 8 shows the results from 13 specifications and estimation combinations. We find that the coefficients of TMT language are consistent across specifications. Importantly, they show that enhanced earnings emphasis predicts myopic marketing spending.
Multiple Estimation Technique Results.
*p < .05.
**p < .01.
***p < .001.
We treat outcome as a continuous measure.
Notes: Standard errors are in parentheses. MMS = myopic marketing spending; RE = random effects; FE = fixed effects.
Controlling for language in question
It is plausible that TMT language in the Q&A section is determined by the type of questions the analysts asked; that is, the content of answers is, in turn, determined by the content of questions. Hence, we need to account for the content of the analysts’ language to truly evaluate the impact of the “answers only” portion. To account for such dependence, we measure the TMT language variables from the analysts’ questions and include them as regressors in the main model. The results are consistent with the main findings. Interestingly, however, the analysts’ questions with an enhanced earnings emphasis reduce the likelihood of firms engaging in myopic marketing spending. This external focus on enhanced earnings may cause the TMT to refrain from myopic behavior due to increased analyst attention.
Sensitivity to outliers
Accounting variables can have extreme outliers. To test the robustness of our results, we estimate our models on multiple outlier-trimmed samples. Prior studies have handled outliers by setting 1% (Bendig et al. 2018; Mizik and Jacobson 2007) and 2.5% (Mizik 2010) of extreme observations as missing. We estimate our model on multiple samples by removing .5%, 1%, 1.25%, and 2.5% of values in the tails of all accounting variables. This also trims the dependent variable as it is measured using accounting variables. The results are consistent with the main analyses in the article.
Speaker trait
It is plausible that TMT language is an individual trait and not one of a firm. For example, CFOs’ narcissism increases their likelihood of engaging in earnings management (Ham et al. 2017). To examine the robustness of our results against this explanation, we control for TMT's time-invariant traits. We include speaker fixed effects, along with firm and time fixed effects, in the model. 9 The results are substantively similar.
TMT compensation
The design of managerial incentives can mitigate or aggravate the myopia problem (Chakravarty and Grewal 2016). We estimate a model that includes firm × year fixed effects. Because compensation design is a firm-specific characteristic that only varies annually (i.e., does not vary across quarters within a year), the firm × year interaction effects should account for any annual variation in firm characteristics, including compensation design. Our substantive findings remain the same.
Reflective factors
In the main analysis, we use formative measurement, and all 13 subdimensions of the three marketing constructs were classified under one marketing emphasis factor. We use exploratory factor analysis to identify unique marketing factors (see Web Appendix H for details). We identify seven unique marketing factors, which, when combined with two action categories, gives us 14 action–object categories. We also find that TMT language focused on diminished marketing planning, diminished strategy, and enhanced earnings is associated with an increase in the likelihood of future myopic marketing spending.
Discussion
Jensen and Meckling (1976) argue that firm principals, that is, stockholders, can limit divergences from their interest by either establishing appropriate incentives or by incurring monitoring costs to mitigate the myopic behavior of an agent, that is, the TMT. Due to expensive monitoring and a lack of perfectly aligned incentives, the TMT is provided with several opportunities to make myopic decisions. Myopic marketing spending is observable post hoc, making it too late for an investor to divest or a stakeholder to intervene. The ability to predict myopic marketing spending has been limited to infrequent events, such as SEOs and share repurchases, or noisy indicators from analysts, such as EPS forecasts and stock recommendations. In the present article, we investigate whether the TMT itself can provide insight into the likelihood of engaging in future myopic marketing spending through the language it uses during earnings calls. We find that TMT language centered around enhanced earnings emphasis is associated with a decrease in the likelihood of future myopic marketing spending.
Theoretical Contribution
This study contributes to three theoretical domains. First, we extend the understanding of the literature on myopic marketing spending, where myopia is observed after the fact and the focus remains on explaining its correlates and consequences, rather than predicting it to potentially safeguard investors’ interests. Existing predictors of myopic marketing spending, such as SEOs (Cohen and Zarowin 2010; Kothari, Mizik, and Roychowdhury 2015; Mizik and Jacobson 2007), IPOs (Saboo, Chakravarty, and Grewal 2016), and share repurchases (Bendig et al. 2018), fail to provide advance warning of myopic marketing spending. Here, we extend the ability to predict myopic marketing spending from a few weeks using analyst forecasts (Chakravarty and Grewal 2016) to up to four quarters using our TMT language measure. This allows investors to divest from myopic firms long before the detrimental consequences are realized.
Myopic marketing spending is correlated with firm characteristics and events, including SEOs (Cohen and Zarowin 2010; Kothari, Mizik, and Roychowdhury 2015; Mizik and Jacobson 2007), share repurchases (Bendig et al. 2018), CEO retirement (Dechow and Sloan 1991), CMO and marketing department power (Srinivasan and Ramani 2019), and the structure of executive compensation (Currim, Lim, and Kim 2012). Unfortunately, these occur infrequently or have limited temporal variation, making them unreliable tools for prediction purposes. Earnings calls occur quarterly, however, giving stakeholders multiple opportunities to evaluate TMTs' intentions. This allows investors to rebalance their portfolios quarterly.
The financial implications of myopic marketing spending are that these firms perform well in the short term but tend to decline in performance in the long term (Mizik 2010; Saboo, Chakravarty, and Grewal 2016). We show that adding TMT language improves the ability to predict myopic marketing spending, which translates into significant financial gains. We find that an investment strategy that allows investors to divest from myopic firms by using predictions based on TMT language can produce 1.61% additional annual abnormal returns.
Second, this study helps extend the literature on TMTs in marketing by moving the needle from focusing on the mere presence or time-invariant characteristics of the TMT (Hambrick 2007) to the TMT's intentions and decision making. We address the gap present in the literature that focuses on the CMO presence (Boyd, Chandy, and Cunha 2010; Germann, Ebbes, and Grewal 2015; Nath and Mahajan 2008) and marketing experience and power (Feng, Morgan, and Rego 2015; Srinivasan and Ramani 2019; Whitler, Krause, and Lehmann 2018) by investigating the role of TMT intent. Because intent is difficult to observe, TMT language—inferring TMT attention to competing priorities from communications—provides insight into TMTs’ intent.
Finally, our study contributes to the literature on the attention-based view (Ocasio 1997) and its recent applications in marketing. The attention-based view has been used to explain CEOs’ attention to competing priorities (Umashankar, Bahadir, and Bharadwaj 2021; Vadakkepatt et al. 2021; Yadav, Prabhu, and Chandy 2007). The proposed mechanism shifts executive attention away from the focal issue in each instance. Because we can compare the relative impact of the TMT language factors, we provide further evidence on TMT initiatives within a firm.
Managerial Implications
Individual investors
The TMT is likely to respond to the needs of large institutional holders, that is, block holders who are more powerful and influence the TMT's decisions (Abarbanell and Bushee 1998). This disadvantages individual shareholders, as they are unorganized, and their voice is not equitably represented in board meetings, shareholder meetings, or earnings calls. Our proposed approach has two implications for individual, long-term investors. First, because they hold investments over the long term, they can generate more returns by identifying myopic marketing spending behavior a priori. Second, our approach is an easy and inexpensive way to provide individual shareholders with the same information as larger block holders. Thus, the low-cost monitoring approach we develop levels the playing field for individual shareholders. Such a reduction in information asymmetry promotes efficiency, discourages TMT short-termism, and possibly increases accountability by informing investors of the value of marketing actions and assets (Guenther et al. 2024). Third, the text analysis method outlined to measure TMT language can be implemented at a minimal cost to individual investors. Developed using no-cost software packages, our solution is equitable and freely accessible. This not only reduces the information asymmetry gap but also allows for future updates of the TMT language measure at a low cost.
Boards of directors
Our findings have implications for corporate governance. Previous research in accounting has shown that internal governance implemented through incentivization and information provision to subordinates of C-suite executives can reduce C-suite earnings management (Cheng, Lee, and Shevlin 2016). The present study provides options for subordinates of the C-suite and other boards of directors to monitor TMT behavior. We posit that these internal and external governance entities should pay attention to what the TMT says during earnings calls to reduce the information asymmetry problem.
Competitors
The early prediction ability we uncover could also be leveraged by firms’ competition. Zhang and Gimeno (2016) find that in the airline industry, firms determine the intensity of their competitive action depending not only on the earnings pressure they face but also the earnings pressure their competitors face. In their study, Zhang and Gimeno find that a firm waits for a competitor to act myopically before it adjusts its own competitive actions. Leveraging insight into the competition's intentions to engage in myopic marketing spending could translate into significant advance notice for formulating competitive strategies that can result in superior performance (e.g., product-market entry, R&D commitments).
Top management teams
Finally, we anticipate that, in equilibrium, the reduced cost of monitoring the TMT's myopic marketing spending behavior can have two potential outcomes. First, reduced monitoring cost would lead to greater oversight over TMT actions, which can lead to a decrease in myopic marketing spending, a problem so pervasive that some firms have gone as far as not reporting quarterly results (e.g., Unilever in 2009 in the European market stopped reporting quarterly results). 10 Second, while TMTs may adapt their language to prevent detection, our approach can be refined to adapt to the changing TMT language.
Limitations and Future Research
Although our findings are robust, this study is not without some limitations. First, although rich, text analysis fails to pick up tonal or physical cues. Future work could leverage audio and video analysis of the earnings calls to assess nonverbal predictors (Marinova, Singh, and Singh 2018). Second, per the Lucas critique, TMTs may adapt their language to obscure detection. Future research could update our prediction approach. Third, complementing our work, future research could investigate the role of speakers with marketing experience on TMT language and its myopic marketing spending prediction ability (Srinivasan and Ramani 2019). Fourth, future analysis could focus on creating a continuous measure of myopic marketing spending to capture more variation.
Finally, consistent with the literature, we use SGA expenditure as a proxy for marketing expenses. Recent research (Ptok, Jindal, and Reinartz 2018) has suggested that SGA expenses may not be an appropriate proxy for some marketing constructs. The SGA expenses provide TMTs with discretionary decision-making options, which are unobservable to an investor. Thus, our operationalization is consistent with the conceptualization of the marketing myopia construct. SGA expenses may include other discretionary expenses, not just marketing expenses. Therefore, future research can examine the impact of using SGA versus only marketing expenses on the measurement of myopic marketing spending.
Supplemental Material
sj-pdf-1-jmx-10.1177_00222429241244804 - Supplemental material for Can Words Speak Louder Than Actions? Using Top Management Teams’ Language to Predict Myopic Marketing Spending
Supplemental material, sj-pdf-1-jmx-10.1177_00222429241244804 for Can Words Speak Louder Than Actions? Using Top Management Teams’ Language to Predict Myopic Marketing Spending by Andre Martin and Tarun Kushwaha in Journal of Marketing
Footnotes
Acknowledgments
The authors would like to thank Seeking Alpha for providing quarterly call transcripts. They would also like to thank participants of seminars at the University of North Carolina, the University of California Irvine, the University of California Riverside, George Mason University, the University of Notre Dame, Texas Christian University, the University of Wisconsin, the Marketing Strategy Meets Wall Street Conference, the Marketing Strategy Doctoral Consortium, and the PhD Project for useful feedback. The authors would also like to thank accounting professor Robert Bushman; management professor Atul Nerkar; and marketing professors Katrijn Gielens, Rajdeep Grewal, Dominique Hanssens, Kristopher Keller, Donald Lehmann, Bruce Norris, Koushyar Rajavi, Breagin Riley, Daniel Ringel, J.B.E.M. Steenkamp, and Broderick Turner for providing valuable feedback. The authors thank Erin Mitchell and Leslie Wilhelm for copy editing assistance. Finally, the authors thank the JM review team for their constructive feedback. All remaining errors are the authors’ responsibility.
Coeditor
Christine Moorman
Associate Editor
Detelina Marinova
Declaration of Conflicting Interests
The authors declared no potential conflicts of interest with respect to the research, authorship, and/or publication of this article.
Funding
The authors received no financial support for the research, authorship, and/or publication of this article.
Notes
References
Supplementary Material
Please find the following supplemental material available below.
For Open Access articles published under a Creative Commons License, all supplemental material carries the same license as the article it is associated with.
For non-Open Access articles published, all supplemental material carries a non-exclusive license, and permission requests for re-use of supplemental material or any part of supplemental material shall be sent directly to the copyright owner as specified in the copyright notice associated with the article.