
Abstract
Instead of offering products or services alone, increasingly, firms and their partners are offering consumption systems. Consumption systems are offerings characterized by a significant product and service subsystem, as well as a pattern of consumption in which consumption occurs in multiple episodes over time. The authors develop a theoretical model for conceptualizing satisfaction with consumption systems and empirically test it using longitudinal data from 5206 automobile owners. Results show that an intertemporal examination of attribute-level performance, satisfaction, and behavioral intentions can improve an understanding of their relationships because these relationships change as the consumption of the product unfolds. For example, on the basis of their salience, attribute weights in determining satisfaction shift over time. Furthermore, the crossover effect of product and service satisfaction in determining intentions toward the manufacturer and the service provider is asymmetric, and this asymmetry reverses over time. Service satisfaction initially has a much larger impact in determining intentions toward the manufacturer, but later, product satisfaction is more influential in generating intentions toward the service provider and manufacturer. The results show that there is no direct link between satisfaction and behavioral intentions. Rather, satisfaction affects behavioral intentions in the future through a dual-mediation route.
The two most successful automotive launches in recent history have been the Lexus and Saturn cars (Reichheld 1996). Executives in the industry attribute their success to the high quality of the products and dealership service. However, the relative contribution of vehicle and service satisfaction in reciprocally generating loyalty to the manufacturer and dealership is not known. Executives wonder how the relative magnitude of satisfaction with the product and service and consequent behavioral intentions toward the dealer or manufacturer change over time. Also, it is not known how the magnitude of the impact of attribute performance on satisfaction changes over time.
In this article, we investigate the relationships among attribute-level performance, satisfaction, and behavioral intentions to shed light on the preceding issues. In the following sections, we develop the consumption system idea and empirically test it using longitudinal data from 5206 automobile owners. We conclude by discussing implications for marketing research and practice.
Consumption System
As we show in Figure 1, a consumption system consists of a bundle of goods and services that are consumed over time in multiple consumption episodes. 1 The conceptual foundation of this approach can be traced to General Living Systems Theory (for a review, see Reidenbach and Oliva 1981). Complex phenomena are conceptualized as a system that consists of various subsystems that work in tandem and evolve over time. Conceptually, there are three constitutive elements of a consumption system: 2 attribute-level evaluations, satisfaction, and behavioral intentions. Furthermore, a consumption system can be composed of several subsystems, of which the product and service systems are key sub-systems from both the consumer's (Rust and Oliver 1994) and the firm's (Fites 1996) perspectives.

Satisfaction with Consumption Systems: Conceptual Model
It must be emphasized that whether an offering can be deemed as a consumption system is a matter of degree.
A consumption system should be differentiated from other seemingly similar concepts. For example, it is different than a “durable good” because the term “durable good” refers only to the product element (e.g., a sofa or a table) with no regard to the service element. Thus, the term “durable good” narrows down a concept to its physical attributes only (by ignoring the systemic view). Similarly, labels such as “service-enhanced” or “augmented” products (used for one-shot items such as a meal in an expensive restaurant) may not capture the dynamic aspect in such a system adequately. Nonetheless, it seems beneficial to think of “durable goods” or “service-enhanced products” as special cases of a consumption system, the broader concept.
A consumption system can be examined cross-sectionally to gain a structural view of consumption experiences. Thus, we may examine attribute weights or compare the product and service subsystem and understand how these elements are linked together and affect consumption. A consumption system also can be examined longitudinally to gain a process view of the system. For example, we may examine how the link between attribute-level evaluations and satisfaction changes over time or how satisfaction translates to intentions over time. Each type of examination affords a different perspective on a consumer's experience. More important, both types of examination lend different insights into the relationship between attribute performance, satisfaction, and behavioral intentions. These are discussed next.
The Product and Service Subsystems in a Consumption System
As per the model shown in Figure 1, 3 the product and service elements constitute key subsystems of a consumption system. For example, the automobile and dealership service are the key subsystems of the automotive consumption system, and a mutual fund and the consultant's services are key components of the mutual fund investment system. Because of the changing nature of the economy, many firms that traditionally focused only on their product offering increasingly rely on associated services to differentiate and add value to their product offering. As the chief executive officer of Caterpillar, a company known for its product offerings, says,
Although the model is shown for two time periods, it can be extended to multiple periods. Furthermore, the model is applicable to situations in which the service and product are provided by the same entity, as well as those in which the service and product are provided by different entities.
The biggest reason for Caterpillar's success has been our system of distribution and product support. Don't get me wrong. We think we are better engineers and manufacturers than our competitors. But we are convinced that our single greatest advantage over our competition was and still is our system of distribution and product support (Files 1996, p. 85).
Simultaneously managing the product and service subsystem also helps firms manage profitability by allocating resources more optimally between the product and service subsystems (Anderson, Fornell, and Rust 1997). This is true not only when the product or service component is managed by the same firm (cf. Crosby and Stephens 1987), but also when they are managed by different firms (cf. Anderson and Narus 1995). Especially in the latter case, the consumption-system approach provides guidance for understanding the complex dynamics of the power balance between manufacturers and distributors (e.g., Fites 1996). Moreover, it enables a melding of academic research on product satisfaction and service quality. Despite the acknowledged need to determine how the product and service elements “jointly affect satisfaction, how they interact, and how their relative influence changes” (Rust and Oliver 1994, p. 15, italics in original), research in these areas has proceeded with little or no overlap. Yet, if academic research is to find welcome applications in firms, such a blending is necessary, because firms want to manage the product and service aspects of their offerings simultaneously.
A consumption-systems perspective specifically argues that both the product and service subsystems influence each other. We call such effects “crossover effects,” and they are shown as paths b and c in Figure 1. A crossover effect implies that product satisfaction affects behavioral intentions toward the service provider, and satisfaction with the service influences behavioral intentions toward the product manufacturer. In the case of typical nondurable and convenience goods, for which the service provider and product manufacturer are distinctly different entities (e.g., a convenience store that sells branded goods), consumers should form behavioral intentions about the product manufacturer and service provider separately. This should happen because satisfaction with service should be attributed to the service provider alone, whereas satisfaction with the product should be attributed to the product manufacturer alone. However, for complex systems, this distinction generally is blurred. High-quality service at a dealership may be attributed, in part, to efforts made by the product manufacturer. Conversely, high-quality service from the dealer may engender positive intentions toward the manufacturer.
Prior literature has made some attempt to examine this crossover effect. Oliver and Swan (1989) find that satisfaction with the dealer was related significantly to satisfaction with the car, and Westbrook (1981) finds a significant correlation between satisfaction with the retailer and satisfaction with the products purchased from the retailer. However, neither study (1) related satisfaction to behavioral intentions, (2) investigated the crossover effect between satisfaction and intentions, or (3) studied how this effect varies over time. Consequently, of interest is not only the significance of paths b and c, but also their relative magnitude and how the magnitudes vary over time.
The Dynamic Link between Attribute Evaluations and Satisfaction
Managers historically have been most interested in linking attribute performance to overall satisfaction for making resource allocation decisions (Griffin and Hauser 1993). Among academics, however, an attribute-level conceptualization of the antecedents of satisfaction is a recent phenomenon (e.g., Oliver 1993), and most early work focused on global evaluations (cf. Oliver 1980). In an attribute-level approach, overall satisfaction is a function of attribute-level evaluations (LaTour and Peat 1979). These evaluations may be based on performance and/or disconfirmation at the attribute level and typically capture a significant amount of variation in overall satisfaction (cf. Bolton and Drew 1991; Oliver 1993). Relative to the “global” evaluation approach, the multiattribute model has two key advantages. First, it is consonant with consumers’ representations of consumption experiences in memory. For example, Gardial and colleagues (1994) find that, when making postpurchase evaluations and describing consumption outcomes, consumers are almost twice as likely to use attributes than the overall product. Second, an attribute-level analysis provides higher specificity and diagnostic usefulness by enabling us to ask specific questions about antecedents of satisfaction. For example, is disconfirmation on certain attributes more critical in determining overall satisfaction than other attributes are? Thus, previous models of antecedents of customer satisfaction can be extended to the attribute level to increase their specificity and actionability.
However, virtually all the work relating attribute evaluations to overall satisfaction has been performed on a cross-sectional basis (for a review, see Oliver 1997). Research has not examined if attribute weights in determining overall satisfaction are temporally labile. Consequently, even less is known about the direction and magnitude of these shifts. These weights typically are derived from regression analysis using cross-sectional data. The underlying assumption in such analyses is that attribute weights are temporally invariant or that such temporal variability is theoretically or managerially unimportant. We are interested specifically in changes in attribute weights over time. Thus, we examine links a1 … an in Figure 1.
We argue that attribute weights in determining overall satisfaction shift over time. One approach to understanding these shifts is to examine the extent to which attribute performance relates to consumption goals. As these goals change during the consumption experience, so might attribute weights. That is, an attribute's relationship to consumption goals may drive its salience. For example, color and styling—two important attributes in the purchase decision for a car—contribute a lot to the satisfaction judgment during the initial consumption period, but their weights decline over time. During later periods, reliability and engine performance are found to contribute more to satisfaction (Mittal et al. 1993). An attribute's weight also may be driven by the frequency with which a consumer is exposed to the attribute and the extremeness of the perceived performance during each exposure (Oliver 1997). Moreover, the perceived variability in performance on an attribute may change over time, leading to changes in its weight. Higher variability ensures more occasions for disconfirmation and, therefore, may increase the attribute's salience and weight in the satisfaction judgment. For example, if the miles per gallon (mpg) on a person's car are highly variable from trip to trip, 4 then, for that customer, mpg may have more weight in the satisfaction judgment than for another customer whose car provides consistent mpg. Thus, over time, an attribute's weight may be determined in part by the perceived variability in attribute performance. Over time, consumers using a consumption system are likely to have different levels of exposure to and perceive different levels of variability of different attributes. Thus, we expect the coefficients for paths a1 … an to change over time.
This variability may stem from a variety of sources, including changes in driving condition, quality of the engine, and so forth. The issue here is that variation occurs and influences attribute weights over time, though further research could examine theoretically why this variation occurs.
In summary, we argue for a temporally situated perspective to examine the relationship between attribute performance and satisfaction. Such an approach is likely to yield interesting insights about the patterns in attribute weight shifts. Consequently, as a first step, we are interested in understanding the direction and magnitude of such attribute weight shifts over time.
The Dynamics of the Satisfaction–Intention Link
Acknowledging that consumption occurs as a series of encounters between a consumption system and the consumer, researchers distinguish between transaction-specific and cumulative satisfaction (Oliver 1997). However, most research has examined the satisfaction–intention link on a cumulative basis (cf. Anderson and Sullivan 1993). Research relating encounter-specific satisfaction to behavioral intentions over time is sparse. It is not clear whether and how satisfaction judgments and behavioral intentions formed during one consumption occasion carry over to behavioral intentions at subsequent consumption occasions. In a longitudinal study, Mazursky and Geva (1989) asked respondents to indicate satisfaction and intention ratings toward an antitheft alarm. Two weeks later, these same respondents were asked about their behavioral intentions toward the antitheft alarm. Results showed that satisfaction ratings obtained in the first time period were predictive of intentions in the first period, but not in the second period. Using this result as a basis, the authors concluded that the satisfaction–intention link decays rapidly. More important, this result implies that, over time, satisfaction does not affect intentions directly and casts doubt on the result presumed to be true in most cross-sectional studies: that satisfaction directly affects intentions in the long run. However, this study did not consider that, over time, satisfaction's impact on intentions might be mediated. Two studies (LaBarbera and Mazursky 1983; Oliver 1980) shed light on possible mediating mechanisms. These studies find that the impact of intentions in the first time period (T1) on intentions in the second (T2) was mediated by satisfaction in the intervening time period. However, in neither study was the impact of satisfaction in T1 on satisfaction in T2 studied in conjunction with intentions in T1. They also were limited to products or services whose consumption did not unfold over time.
The dynamic aspect of the model that relates satisfaction to behavioral intentions is termed the “carryover effect.” We propose that both satisfaction and behavioral intentions in the intervening periods act as mediating variables. Thus, with regard to the model in Figure 1, we are interested in links d, e, f, and g as mediating routes. Regarding links f and g, most research has been performed on a cross-sectional basis with the assumption that satisfaction in T1 directly affects satisfaction in T2. However, the only study (Mazursky and Geva 1989) to examine such a direct link on a longitudinal basis finds no support for such a link. Regarding the temporal impact of intentions (links d and e), though some evidence exists to show that prepurchase intentions affect postpurchase intentions (LaBarbera and Mazursky 1983; Oliver 1980), no study has examined the dynamics of postpurchase intentions. Lack of work in this area may be due to the difficulty in obtaining longitudinal data. Or, it could be that most research to date has focused on elaborating detailed and alternative models of the antecedents of satisfaction with virtually no effort devoted to understanding satisfaction and its consequences over time.
Conceptually, at least three theoretical perspectives support these intertemporal links, that is, why people may “update” satisfaction judgments and behavioral intentions rather than construct them anew for each consumption episode. The first is found in adaptation-level theory (Helson 1964), on which the expectation–disconfirmation paradigm is based (Oliver 1980). According to adaptation-level theory, prior judgments and intentions act as anchors for future judgments and intentions. In other words, intentions and judgments in T2 are not absolute but are made relative to intentions and judgments in T1. The second perspective is found in variants of consistency theory, which suggests that people are predisposed to maintain cognitive and attitudinal consistency (cf. Festinger 1957; Heider 1958). To reduce dissonance (Festinger 1957) or maintain balance in mental representations of ideas (Heider 1958), people selectively process information that enhances consistency. Thus, if at time T1, a person is satisfied with his or her car, he or she is motivated to perceive subsequent consumption episodes such that they are consistent with the initial judgment. The third perspective is based on learning theory (Bagozzi 1981). Thus, repeated encounters with the product or service reinforce the satisfaction judgment and behavioral intentions. 5
Whereas the consistency theory argument may be interested in motivational issues (when are consumers more or less motivated to achieve consistency), learning theory arguments would be more interested in repetition, time lag between consumption episodes, and so forth. Untangling these sorts of issues is beyond the scope of this research.
More generally, the three perspectives are consistent with the belief-updating paradigm (Hogarth and Einhorn 1992), whereby consumers form judgments and intentions at a given time by updating prior judgments and intentions. Thus, satisfaction in T2 should not only be a function of attribute-level evaluations in T2, but also of the level of overall satisfaction experienced in T1. Similarly, intentions in T2 are not only a function of satisfaction in T2, but also intentions in T1. If we combine these arguments with the well-established result that satisfaction in a given period influences intentions in the same period, we can establish a dual-mediation mechanism for linking satisfaction in T1 to intentions in T2. In the proposed dual-mediation model, both satisfaction in T2 and intentions in T1 mediate the link between satisfaction in T1 and intentions in T2. That is, satisfaction in T1 affects intentions in T1 and satisfaction in T2. In turn, satisfaction in T2 and intentions in T1 affect intentions in T2.
To evaluate the proposed dual-mediation model, we compare it with two conceptually “rival” models. The first is a direct model that does not consider the possibility of mediation mechanisms. The second is an alternative mediation model, tested in prior research (LaBarbera and Mazursky 1983; Oliver 1980), in which intentions in T1 affect intentions in T2 directly, as well as through the satisfaction experienced during the consumption. However, this model does not consider the mediating role of intentions.
The current study clarifies the nature of the satisfaction–intention link by empirically comparing the three models using longitudinal data. More generally, it extends satisfaction research by positing rival models about the process by which satisfaction translates into its consequences.
Study
This study sought to test empirically three key conceptual ideas embedded in the consumption system perspective: (1) dynamic attribute weights, (2) crossover effects, and (3) the mediation mechanism in the satisfaction–intention link. Our major interest is in understanding whether and how the key linkages in the system change over time. Longitudinal data from the automotive industry related to two specific consumption periods were used in empirical testing. The automotive industry was considered a good setting for testing the model because automobiles are an important consumption system for consumers and entail multiattribute products and services whose consumption occurs over time.
Survey Description
The data for the study come from a commercial satisfaction tracking study that was in place before this research began. This satisfaction tracking study measures satisfaction throughout the ownership period among automotive customers by surveying customers right after sales, after a service encounter during the initial consumption period (3 to 4 months after the sale), and finally during the later consumption period (another 21 months after completing the second survey). Response rates for each wave range from 35% to 45%. The automotive firm also has conducted several pilots over the years and found the respondents were representative of its customer base. In the current study, 57% of the subjects were men and 43% women. Furthermore, 30% had finished high school, 56% had an undergraduate degree, and 14% held a graduate degree. The age distribution was as follows: 9% were less than 24 years of age, 11% were 25 to 29 years, 37% were 30 to 44 years, 33% were 45 to 64 years, and 10% were 65 years of age or older.
The firm provided data on 5206 customers who had responded to the initial consumption period service survey (T1) and the 21-month follow-up survey for the later consumption period (T2). The initial evaluation survey was mailed to owners who visited the dealership for a repair associated with the manufacturer warranty. Excluded were customers who incurred repairs associated with emissions, corrosion, recalls, and after-warranty adjustments. This survey measures satisfaction with the vehicle, satisfaction with the service process, and likelihood of recommending the dealer and manufacturer. The survey also asks respondents to rate their satisfaction with key attributes of the product and the service.
The second survey is mailed to all owners 21 months after their initial dealership visit. Because practically every owner goes to the dealership for the initial visit, this survey is essentially a resampling from the original sampling frame. Thus, this survey provides satisfaction and intention data in T2 for the same respondents who completed the survey in T1, but with a 21-month lag. In other words, these surveys were conducted almost two years apart: the first wave in the fall of 1993 and the second in the fall of 1995. Therefore, these data provide a conservative test of the temporal aspects of the model.
Checks for Respondent Bias
A key concern with using panel-type data is that customers who filled out both surveys may be systematically different than other respondents. From a theory-testing perspective, this is not a key concern. Although the absolute level of variables might differ for panel members and nonmembers (e.g., more satisfied people may be more responsive), there is no reason to suspect that the hypothesized relationships would be different. Nevertheless, we are interested in knowing if any potential biases exist in the sample. For example, West-brook (1981) finds that panel members were more critical in evaluating their satisfaction with restaurants than nonmembers were. Therefore, to check for respondent bias, we took the following steps.
We obtained two additional random samples, of 1000 respondents each, for the two waves of the survey. These samples are representative of the larger database of more than 300,000 completed surveys obtained every year by the firm. Then we compared the panel sample of 5206 respondents with the first and second wave samples. These comparisons were made on the basis of demographics and the overall satisfaction and intentions scales used in the study. There were two comparisons: the first between the panel and the initial consumption survey sample (5206 versus 1000) and the second between the panel and the later consumption survey sample (5206 versus 1000). Both comparisons showed that the demographic profiles of the members were similar (all ps > .20) and that the ratings on the overall satisfaction and intention scales were statistically the same (all ps > .20). Thus, we can be reasonably assured that the data set used in our study is not biased.
Measures
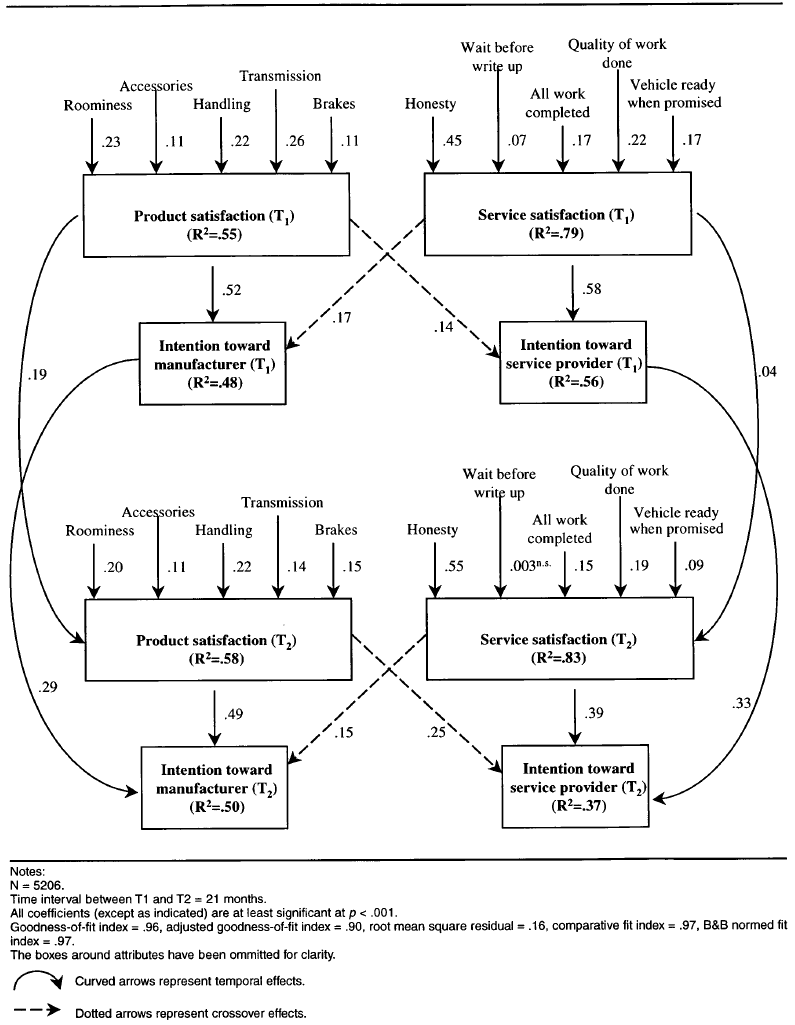
The key constructs—attribute-level evaluations, product and service satisfaction, and behavioral intentions—were measured on a ten-point scale. For each attribute, respondents were asked “how satisfied are you with the performance on…,” and they indicated their response on a ten-point scale for which 10 = completely satisfied and 1 = very dissatisfied. As we show in Figure 2, five attributes for the product and five for the service were included. Overall satisfaction was measured on a similar ten-point scale, in response to the question, “Overall, how satisfied are you with the product (service)?” Finally, using a ten-point scale (10 = definitely would, 1 = definitely would not), respondents indicated how likely they would be to recommend the company's product and the dealership to others in the future.
Model Estimation Results for Automotive Industry
All of the constructs are measured as single-item scales. Although the use of single-item measures may attenuate the estimated relationships, such measures have been employed successfully in large-scale commercial surveys (cf. Bolton and Drew 1991; Mittal, Ross, and Baldasare 1998). LaBarbera and Mazursky (1983) point out that, in longitudinal surveys, the use of multi-item scales can affect the response rate adversely, due to longer survey length, and may decrease, rather than increase, overall reliability. Therefore, single-item measures were considered adequate for this study.
Also note that this survey used “likelihood to recommend” to measure behavioral intentions. This is different than the typical intentions variable (repurchase intentions) used in most satisfaction studies. However, there is empirical support for using the likelihood to recommend as a dependent variable. Zeithaml, Berry, and Parasuraman (1996) test a 13-item battery of behavioral intentions in the context of five industries. Across all industries, they find that intentions to recommend and repurchase were highly correlated. In particular, for the automotive industry, intentions to recommend and repurchase had loadings of .94 and .87 on the same factor. Moreover, intention to recommend is an important dependent variable because, in most product and service categories, word of mouth is one of the most important factors in acquiring new customers. Thus, the current measure of behavioral intentions is considered appropriate.
Analysis and Results
The analytical model can be specified through the system of equations shown in Table 1. Equations 1,2,3, and 4 pertain to T1. In Equations 1 and 2, satisfaction with the product and service are multiattribute judgments. Equations 3 and 4 specify that the level of satisfaction experienced with the product and the service, respectively, influences behavioral intentions toward the manufacturer and the service provider. The crossover effect is incorporated by showing that service satisfaction influences intentions toward the manufacturer and that vehicle satisfaction influences intentions toward the service provider.
Analytical Model
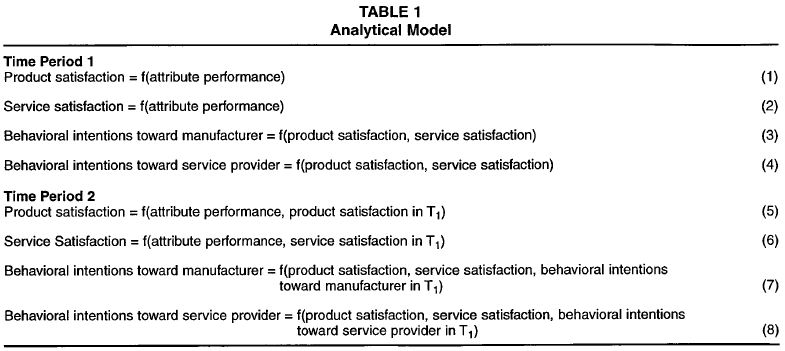
Equations 5, 6, 7, and 8 pertain to T2. In Equation 5, vehicle satisfaction in T2 is a function of attribute-level performance and overall vehicle satisfaction evaluation in T1. In Equation 6, satisfaction with the service experience is a function of attribute-level performance in T2 and the overall satisfaction with the sales experience in T1. Equations 7 and 8 model the formation of intentions toward the manufacturer and dealer. In Equation 7, intention toward the manufacturer is not only a function of vehicle satisfaction in T2, but also of service satisfaction during T2 and intentions toward the manufacturer in T1. Finally, in Equation 8, intention toward the dealership is a function of satisfaction with the service in T2, satisfaction with the vehicle in T2, and intention toward the dealership in T1. Thus, Equations 7 and 8 capture the carryover and crossover effects. The system of equations is estimated as a path model. Estimation results are summarized in Figure 2, in which it can be seen that all coefficients are in the expected direction and support the conceptual model. Moreover, all but one of the coefficients are statistically significant.
Model Fit
The Overall χ2(degrees of freedom [df] = 156) = 3287.57 (p < .0001) is highly significant. However, because of the large sample size, this may not be a useful diagnostic for evaluating model fit. All the other fit indices indicate that the model fits the data well. The goodness-of-fit index is .96, with a root mean square residual (RMSR.) of .15. Furthermore, Bentler and Bonett's normed fit index is .97, and Bentler's comparative fit index is .97. These diagnostics indicate excellent model fit.
Attribute Weights Cross-Sectionally and over Time
The examination of attribute weights pertains to paths a1 … an in Figure 1. Our main interest is understanding the dynamic nature (i.e., intertemporal variability) of attribute weights. However, we first briefly consider cross-sectional variability in attribute weights.
Cross-sectional results
Consistent with previous studies (Bolton and Drew 1991), these results show that, for both periods, satisfaction with the product and service is a multi-attribute function. However, for both T1 and T2, attribute-level evaluations explain much less of the variation in vehicle satisfaction (55% and 58%) than of the variation in service satisfaction (79% and 83%). This may imply that the survey used here has a more complete attribute list for the service than for the product subsystem. Furthermore, and as was expected, for both the product and service element, different attributes have different weights within each time period. 6 Firms can use these differential weights for allocating resources among various attributes.
Most of these differences were statistically significant, using the incremental χ2 test described subsequently. In the interest of space, a detailed discussion of the significance testing is excluded. Detailed results can be obtained from the lead author.
Attribute weight shifts over time
Our main interest, however, is to compare the weight of each attribute in T1 with its weight in T2 (21 months later). To do this, first a constrained model in which the weight of an attribute is set to be equal in both time periods is estimated. Then, the overall fit of the constrained model is compared with the fit of an unconstrained model, in which the weights are allowed to be different for both time periods. If the fit of the constrained model is significantly worse than that of the unconstrained model, it is concluded that the attribute's weight changed over time. The statistical significance of the decrement in fit is evaluated by comparing the χ2 statistic (df = 1) for the constrained and unconstrained model. If the χ2 for the constrained model is significantly larger than that for the unconstrained model, the constrained model can be rejected, and it can be concluded that the weight of an attribute shifted over time. Results based on this testing strategy are summarized in Table 2.
Shifts in Attribute Weights over Time: Model Estimates

Note: The alpha for significance is set at .005 rather than .05 because of the Bonferroni adjustment. The logic is as follows: Because we have five attributes for the product and five for the service (a total of ten attributes), ten alternative models with the equality constraint are estimated. The Bonferroni correction is applied to the customary alpha level of .05 to control the overall Type 1 error rate to .05. Specifically, the alpha is lowered by a factor of 10 (.05/10 = .005), such that each test is considered significant (i.e., the constrained model is rejected in favor of the base model) only if it exceeds this threshold. With degrees of freedom = 1 and α = .005, the χ2 should increase by at least 7.88 to reject the constrained model.
For the product component, the attribute weights remain unchanged for three attributes: “roominess,” “accessories,” and “handling.” For “transmission,” however, the weight drops almost half, whereas for “brakes,” the weight increases from .11 to .15. This could be due to the changed salience of these two attributes. Initially, consumers may be more interested in the “transmission” of a new car, but not the “brakes.” After two years of ownership, their preoccupation with “brakes” may increase, whereas the preoccupation with “transmission” may decline. The salience of the other three product attributes may have stayed constant over time. Another interpretation of these results is that the shift in weight occurred for “functional/mechanical” attributes, whereas the weights for “experiential” attributes did not change as much. This explanation, however, is only partially borne out for the service subsystem, in which the weight for “wait before write up” decreased from .07 to .003 and the weight for “vehicle ready when promised” decreased from .17 to .09. For arguably the most “experiential” of all attributes, “honesty and sincerity,” the weight increased from .45 to .55. In the case of services, attribute-level salience may help explain the results. “Wait before write up” and “vehicle ready when promised” are procedural attributes whose already low salience decreases with time (perhaps because the dealership performs well on them on every successive encounter). However, on the other three attributes, the salience increases with time due to performance variability, especially because these three attributes entail a significant amount of human interaction. Thus, over time, their salience and their weight increased or remained the same.
Finally, these results should be interpreted in light of the large sample size and consequent increase in statistical power that made it possible to detect small fluctuations in attribute weights. Even so, the magnitude of several shifts is substantial. For example, the weight for “transmission” and “vehicle ready when promised” decreased by almost half. These are substantive shifts for a manager interested in allocating resources among attributes to improve overall satisfaction. Thus, the conclusion is that attribute weights determined over a cross-section of time may not generalize to the entire consumption period. However, additional research is needed to understand the causes underlying shifts in attribute weights.
Crossover Effects of Product and Service Satisfaction in Determining Behavioral Intentions
Our interest is to understand links b and c in Figure 1. Conceptually, there are two issues: (1) How does satisfaction with the product affect intentions toward the service provider and vice versa? and (2) How does the relative magnitude of these effects change over time?
The impact of product satisfaction on intention toward manufacturer is virtually identical in T1 (.52) and T2 (.49). However, it shows a sharp decline for service; the impact of service satisfaction on intention toward the dealership declines from .58 in T1 to .39 in T2 (p < .01). This may have occurred because, in addition to satisfaction, other aspects of a consumer's experience affect intention toward the dealership. Those aspects were not addressed in this survey. Thus, these results caution against generalizing results on the basis of only a cross-section of the entire consumption experience. More important, they indicate additional research should explain why, over time, the relative importance of product and service satisfaction varies for the same set of consumers.
We now examine the crossover effects. The effect of vehicle satisfaction on intentions toward the service provider is significant in T1 (.14, p < .0001) and T2 (.25, p < .0001). Similarly, service satisfaction has a significant effect on intentions toward the manufacturer in T1 (.17, p < .0001) and T2 (.14, p < .0001). We also investigate whether these crossover effects are asymmetric and if they vary over time. That is, (1) is the impact of product satisfaction on intentions toward the service provider greater than the corresponding impact of service satisfaction on intentions toward the manufacturer? and (2) does the ratio of these impacts change over time? To answer these questions, two additional tests were performed.
In the first test, the relative magnitude of the crossover effects in T1 was assessed. Specifically, the impact of product satisfaction on intentions toward the service provider (.14) was constrained to be equal to the corresponding impact of service satisfaction on intentions toward the manufacturer (.17). The constrained model provided a worse fit to the data than the unconstrained model (Δχ2 = 5.8, df = 1, p .05) and was rejected. Therefore, it can be concluded that, during the initial consumption period, service satisfaction has a larger crossover effect than product satisfaction.
In the second test, the same constraint was imposed, but for T2. Specifically, the impact of product satisfaction on intentions toward the service provider (.25) was constrained to be equal to the impact of service satisfaction on intentions toward the manufacturer (.15). The model with the equality constraint was rejected in favor of the model in which these paths were allowed to vary freely (Δχ2 = 40.8, df = 1, p < .0001). Therefore, it is concluded that, during the later consumption period, product satisfaction has a larger crossover effect than service satisfaction.
To put these results in perspective, we note that, in a similar analysis conducted to compare satisfaction within one week of ownership, 7 it was found that the link between satisfaction with the dealership sales experience and intention to recommend manufacturer was much stronger (.44, p < .0001) than the link between satisfaction with the car and intention to recommend the dealership (.04, p < .01). In other words, the crossover effect of service satisfaction was much larger than that of vehicle satisfaction. Collectively, these results show that, in the automotive industry, the crossover effect of product and service satisfaction on intentions toward the dealer and manufacturer is highly asymmetric. During the initial consumption period, service satisfaction has a larger crossover effect than product satisfaction. Over time, however, this asymmetry reverses; after 21 months, product satisfaction has a larger effect than service satisfaction. This pattern of results is consistent with the success of brands such as Lexus and Saturn, which invested heavily in dealership service and generated high levels of positive word of mouth toward the manufacturer during the initial stages of ownership. This also implies that, during the early stages of building a relationship, manufacturers should focus on the service, and then during the later stages, they may focus on the core product of the consumption system.
Detailed results can be obtained from the lead author.
It is also instructive to compare these results with those found by Crosby and Stephens (1987). In the context of the insurance industry, they test two alternative models: “rational evaluation model or REM,” in which satisfaction with the core product drives satisfaction with peripheral services, and “relationship generalization model or RGM,” in which peripheral services drive satisfaction with the core product. They find that satisfaction with the core product (i.e., the policy) affected satisfaction with peripheral services (e.g., contact person) and conclude in support of the REM model. However, this support may have occurred because respondents in their study had owned the policy for extended periods of time (13 months or more). Had these respondents been surveyed at a shorter time interval after purchasing a policy, the results may have been different and supported the alternative RGM. To a large extent, the automotive data initially support RGM and later REM. That is, the time interval may moderate the extent to which RGM or REM is supported. Again, the importance of considering temporal variability in understanding the relationship among attribute evaluation, satisfaction, and intentions is highlighted.
Satisfaction and Intentions over Time: Carryover Effects
We are interested in the mediating role of links d, e, f, and g in Figure 1. Specifically, we want to understand how satisfaction influences intentions over time. Is there a direct link between satisfaction and intentions, or is their relationship explained through a mediation model?
Three alternative models were estimated to investigate these issues (see Table 3 for results). However, because the three models are nonnested, we cannot statistically reject one model in favor of another using the incremental change in χ2 (Bollen 1989). Therefore, we estimated a full model, also shown in Table 3, in which all three models are nested and evaluated each of the three rival models in comparison with the full model (e.g., Cliff 1983; Cudeck and Browne 1983). Compared with the full model, we expect the fit of each of the models to deteriorate, but an examination of the relative deterioration enables an evaluation of the competing models. Furthermore, we cannot draw statistical inferences about the relative deterioration in fit for the three competing models. For example, though we can say that, compared with the full model, Model A fits much worse than Model B, we cannot statistically test this hypothesis (i.e., we cannot associate a p value to the differential fit between Models A and B). With this limitation in mind, the results for the models are shown in Table 3 and described next.
Test of Alternative Models: Estimation Results
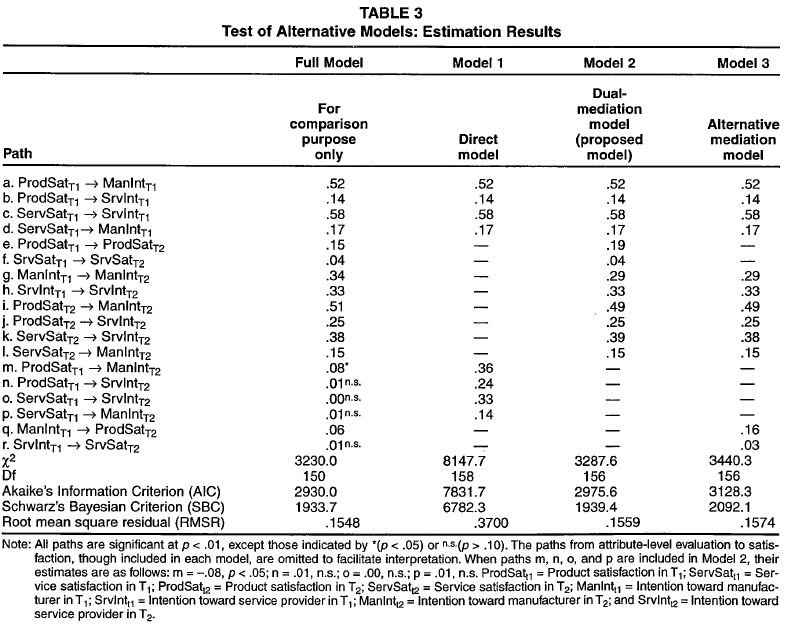
Note: All paths are significant at p < .01, except those indicated by *(p < .05) or n.s.(p > .10). The paths from attribute-level evaluation to satisfaction, though included in each model, are omitted to facilitate interpretation. When paths m, n, o, and p are included in Model 2, their estimates are as follows: m = -.08, p < .05; n = .01, n.s.; o = .00, n.s.; p = .01, n.s. ProdSatt1 = Product satisfaction in T1; ServSatt1 = Service satisfaction in T1; ProdSatt2 = Product satisfaction in T2; ServSatt2 = Service satisfaction in T2; Manlntt1 = Intention toward manufacturer in T1; Srvlntt1 = Intention toward service provider in T,; Manlntt2 = Intention toward manufacturer in T2; and Srvlntt2 = Intention toward service provider in T2.
Direct model (Model 1)
To establish whether satisfaction in T1 has a direct influence on intentions in T2, a model in which behavioral intentions in T2 are a function only of satisfaction in T1 was estimated. Thus, intentions in T2 are set to be a function only of satisfaction with product and service in T1. Results are shown in the second column of Table 3. Compared with the full model, this model fits the data significantly worse (Δχ2 = 4917.7, df = 8, p < .0001). Note also that, of the three candidate models, this model has the worst fit.
Dual-mediation model (Model 2)
As we show in column 3 of Table 3, this model posits a dual-mediation path. All the paths are significant and in the expected direction, in support of the dual-mediation model. Although the fit of this model is significantly worse than the full model (Δχ2 = 57.6, df = 6, p < .0001), the Akaike's Information Criterion (AIC), Schwartz's Bayesian Criterion (SBC), and the RMSRs show that the relative deterioration in fit is not as large as in the direct model. This suggests that the temporal link between satisfaction and intentions is best understood as a mediated relationship.
However, to establish mediation conclusively, we also must include the direct paths (paths m, n, o, and p in Table 3) in Model 2 and compare them with the coefficients obtained in Model 1 (Baron and Kenny 1986). Note that in this model, paths m, n, o, and p are not included because we do not hypothesize a direct link between satisfaction in T1 and behavioral intentions in T2. If mediation exists, then in Model 2, these direct paths should become 0 or nearly 0. Therefore, Model 2 was reestimated after including paths m, n, o, and p. Their coefficients were near 0, as follows: m = -.08, p < .05; n = .01, n.s.; o = .00, n.s.; and p = .01, n.s. This also can be determined from the coefficients of these paths in the full model, in which they become almost 0 (see Table 3). We conclude that the effect of satisfaction in T1 on intentions in T2 is mediated and not direct.
Alternative mediation model (Model 3)
Model 2, the dual-mediation model, also was compared with an alternative mediation model, shown in the last column of Table 3. The alternative mediation model postulates that intentions in T1 have a direct impact on intentions in T2, as well as through satisfaction in T2. This model does not consider the role of satisfaction in T1 at all. To estimate this model, the paths linking satisfaction in T1 to satisfaction in T2 were dropped, and instead, paths linking intentions in T1 to satisfaction in T2 were introduced. Estimates based on this model are shown in the fourth column of Table 3. Again, as we expected, the fit of this model was worse than the full model (Δχ2 = 210.3, df = 6, p < .0001). Also, this model is clearly better than the direct model, Model 1.
The usual strategy of comparing incremental changes in the χ2 value cannot be used to compare Models 2 and 3 because they are not nested models. However, other statistics, such as the AIC and SBC, can be used to compare nonnested models (Bollen 1989; Cudeck and Browne 1983). For both the AIC and SBC, smaller values indicate better fit. On the basis of the AIC and SBC, we can conclude that the dual-mediation model (Model 2) is better than the alternative mediation model (Model 3). However, it is not possible to assess the statistical significance of these differences because the distribution of these measures is unknown (Bollen 1989). It is also worth noting that, for the automobile industry, the mediation occurs largely through the product (paths e and q) rather than the service (paths f and r) subsystem. One explanation for this finding is that automotive owners have more structured and frequent exposures to the product than to the service. This may lead more opportunities to evaluate the product, which facilitates higher levels of elaboration and recall at T2 and, therefore, more mediation. However, more research is needed to clarify such issues.
Summary, Discussion, and Implications of Results
Using longitudinal data, this article examined the temporal lability in the relationship among attribute-level evaluations, overall satisfaction with product and service subsystems, and behavioral intentions. Results show the following:
The relationship between attribute-level evaluations and overall satisfaction, which only has been investigated on a cross-sectional basis in prior studies, is dynamic and changes over time. For five of the ten attributes investigated, there was a shift in weights from one time period to the other.
Both product and service satisfaction have an asymmetric crossover effect in determining behavioral intentions toward the manufacturer and dealer. In addition, the relative magnitude of the crossover effect changes over time. Initially, satisfaction with the service is more important, but satisfaction with the product becomes more important during later consumption periods.
The results clarify the process by which satisfaction in T1 influences intentions in T2. Both satisfaction at T2 and intentions at T1 act as mediators for this link. The model positing only a direct link between satisfaction in T1 and behavioral intentions in T2 performs poorly. Thus, over time, the satisfaction–intention relationship is best conceptualized as a mediated rather than a direct relationship.
Collectively, these results indicate the need to examine the temporal lability in the magnitude of relationships among attribute-level evaluations, satisfaction, and behavioral intentions. Moreover, they indicate that consumer experiences should be examined as a system involving a product and service subsystem. Both notions have implications for academic research and marketing practice.
The Product and Service Subsystems of the Consumption System
Many firms are realizing the complementary role of product and service subsystems in structuring consumer experiences. Rucci, Kirn, and Quinn (1998) document the efforts of Sears, whose managers, after decades of reliance on product offerings alone, started emphasizing service during the late 1990s. The marketing research system was redesigned to measure product and service subsystems specifically and link each of them to consumer behaviors and profits. However, these efforts do not account for the shifting emphasis on the product and service subsystems as consumers’ experience with the consumption systems evolves. Moreover, it is not known how evaluation of one influences the other. For example, it remains to be investigated whether consumers make comparisons between the product and service subsystem and how such comparisons affect consumer judgments of overall satisfaction and behavioral intentions. Similarly, exceptionally good service may cause a customer to have a negative or positive view of the product, depending on whether there is an assimilation or contrast effect (Oliver 1997). Examining such issues and uncovering factors that moderate the outcomes of such comparisons over time are key research areas.
The consumption system approach also enables a reconciliation of disparate notions of utility engendered by many researchers. Researchers distinguish between (1) utility derived from the transaction versus utility derived from the product (Frenzen and Davis 1990) or (2) decision utility versus product utility (Fitzsimons, Greenleaf, and Lehmann 1997). These distinctions may denote satisfaction with various subsystems of a consumption system. However, the consumption system approach goes one step further by highlighting that satisfaction with the different subsystems is time-dependent. Further research should focus on charting and explaining the temporal lability of satisfaction with different subsystems. More generally, research should determine factors that explain the shifting importance of each subsystem. One such factor may be the frequency of exposure and extremeness of performance during each exposure to a subsystem (Oliver 1997).
The Attribute Evaluation and Satisfaction Relationship: Dynamic View
We demonstrated the temporal lability of attribute weights in determining overall satisfaction. However, the reasons for such shifts were not ascertained fully. Thus, overlaying a theoretically motivated explanation for the observed attribute weight shifts is a key research opportunity. Consider the following pattern of results observed among investors of a mutual fund investment firm: When measured within one year of joining the firm, investors accorded a high weight to attributes such as “feel comfortable talking to advisor” and “advisor is courteous.” However, after being with the firm for more than five years, they accorded high weight to attributes such as “advisor provides just the right amount of information” or “advisor can solve problems or answer questions in a single visit.” Follow-up qualitative research showed that, early on, investors were looking to build trust and confidence, but at later stages of the relationship, efficiency became a key factor. Data also showed that the product component (performance of the mutual fund) was more important during the early stages compared with the later stage, though it was always more important than the service elements. 8
Note that these results are different than the automotive results. The importance of the automobile was lower during the initial consumption period and increased over time. However, for the mutual fund, the exact opposite happened; the product was more important than the service in the initial period.
By understanding that trust and efficiency requirements change over time, the firm was able to manage its investors much better than a static view would have allowed. The point is that firms must rethink their satisfaction programs to accommodate such temporal shifts. At the least, satisfaction tracking studies should be designed to measure satisfaction across the entire consumption experience rather than a single cross-section of it. Operationally, this may entail using longitudinal research designs to supplement currently existing cross-sectional studies. For research, attribute weight variability over time should be investigated using experimental studies in which various dimensions of attributes (e.g., the variation in attribute performance, the salience of an attribute) are controlled carefully. The goal should be to identify unique antecedents that can predict the magnitude and direction of intertemporal change in an attribute's weight. Investigations along these lines could enable us a priori to predict temporal changes in an attribute's weight.
It also remains to be examined how attribute-level evaluations affect retrospective evaluations of consumption experiences. Mitchell and colleagues (1997) find that retrospective evaluations of consumption experiences tend to be biased positively. However, this may have occurred because they examined experiences such as vacations, for which people are motivated to impose a more “rosy view” to reduce dissonance or minimize regret. By taking an attribute-level approach, a more diagnostic model of such evaluations can be formulated. An attribute's contribution to the overall evaluation may depend not only on its salience, but also on its temporal distance from the final overall evaluation. Thus, attributes that are experienced closer to the final evaluation may contribute more than those with a larger temporal distance. Conversely, attributes that are experienced early in a consumption experience may act as key reference points against which subsequent performances are judged. These ideas can be explored systematically to better understand why retrospective evaluations of consumption experiences do not always correspond with “in process” evaluations.
At a fundamental level, these results raise a key issue: acknowledging and investigating the temporally situated nature of the relationships involved. In an early study, Calantone and Sawyer (1981, p. 322) observe large temporal shifts in attribute importance weights among consumers and suggest that “the evidence of individual change might signal an opportunity to gain useful insight into the dynamic behavior of consumer markets.” Yet within satisfaction literature, progress in this regard has been modest. Perhaps this happened because of the dominance of an “effects” paradigm, in which the sole concern is to show the existence or absence thereof of an effect. Only recently (cf. Fornell 1992) has literature begun to address variation in the magnitude of key relationships empirically. Even so, much of the focus is on cross-sectional comparisons, though theory indicates the importance of considering temporal variability in these relationships (Johnson and Fornell 1991). However, doing so entails an explicit attempt to demonstrate empirically the temporal lability in key relationships and then examine the antecedents of such variability. We hope that additional research will move in that direction, that is, acknowledging, investigating, and understanding the temporally labile nature of the relationship among attribute performance, overall satisfaction, and behavioral intentions.
Finally, adopting a temporally situated view enables us to investigate the role of consumer learning in influencing these relationships. For example, over time, as consumers learn more about certain attributes, the attributes’ weight in determining overall satisfaction may change. Such learning is even more important for information-intensive and skill-based products, such as software and Web sites. As consumers learn more about a particular attribute, they may become more efficient users of it, and that efficiency directly may affect the level of satisfaction they experience. Moreover, with increased efficiency, these consumers may be reluctant to switch to other brands. Thus, consumer learning (e.g., efficiency gains) may mediate the effect of attribute-level performance on satisfaction and behavioral intentions. Such issues can be examined effectively in a consumption systems context.
Channels Management
The temporally dynamic and asymmetric crossover effects suggest a need to examine how several firms, acting jointly, try to influence satisfaction with the subsystem that each contributes to the consumption experience and behavioral intentions toward themselves and other firms involved. The inherent asymmetry of crossover effects provides a behavioral foundation for exploring interorganizational conflict and cooperation (Smith, Carroll, and Ashford 1995), whereas the evolutionary nature of these crossover effects provides a basis for researching resource allocation issues related to satisfaction management (Chu and Desai 1995). Although there is anecdotal evidence on how manufacturers and their service partners cocreate customer value (Anderson and Narus 1995), satisfaction research could benefit from a general framework to model conflict and cooperation explicitly within a consumption system setting. For example, is overall satisfaction experienced by the consumer higher when the manufacturer exerts greater control over the dealership? What are the normatively desirable incentive structures that simultaneously maximize satisfaction with the dealer and the manufacturer?
The Satisfaction–Intention Relationship
Our results show that the process underlying the translation of satisfaction into intention over time is rather complex. Both satisfaction and intentions were found to be mediating routes in the automotive industry, and in general, the product subsystem showed stronger results for the satisfaction–intention linkage. A dynamic model of satisfaction and consequent intentions should explain the relative weight given to each subsystem. For example, one explanation is that a subsystem's contribution to goal-attainment may moderate its role as a mediator. Thus, the service subsystem may be a stronger mediator for service-driven consumers (e.g., a mother) than for product-driven customers (e.g., buyers of sports cars). More generally, researchers should investigate the processes by which satisfaction translates into its consequences over a series of consumption episodes. Experimental research may be used to test whether this occurs due to learning, need for consistency, or adaptation of reference points. There is also a need to outline boundary conditions in which each of the three competing explanations is more likely to hold.
Model Extensions
Finally, the model developed here can be extended in many ways. First, the asymmetry and nonlinearity found in the attribute performance and overall satisfaction link should be incorporated in the model. For example, it has been shown that negative performance on a utility-preserving attribute has a larger deleterious impact on overall satisfaction than the beneficial impact of positive performance on that same attribute (Mittal, Ross, and Baldasare 1998). However, research has yet to examine whether and how these asymmetries vary systematically over time. For example, during the initial consumption period, an attribute may be utility enhancing, such that positive performance is more consequential than negative performance. Over time, as consumers’ reference points adapt, the same attribute may become utility preserving, such that negative performance is more consequential than positive performance. Thus, for the same consumer, we may find a reversal of the asymmetry. Moreover, the magnitude of the asymmetry may change over time. If so, why? These issues should be investigated in further research.
Second, building on the belief updating perspective (Hogarth and Einhorn 1992), the model should be refined to explicate the cognitive processes that link attribute-level evaluations to satisfaction judgments. For example, how are reference points about attribute-level performance set and updated during a series of consumption episodes, and what is the influence of such updating on the satisfaction judgment? Although many variants of reference points, such as desires, norms, and standards of comparison (Oliver 1997) have been suggested, it is not known when or why one type of reference point is more important than others. Clarifying the relative importance of various reference points over time would be an important extension of the consumption systems model. Such extensions should be bundled with a replication of the current study in different industries and settings and using different measures to increase their generalizability.