
Abstract
This article investigates how people’s political identity is associated with their financial risk taking. The authors argue that conservatives’ financial risk taking increases as their self-efficacy increases because of their greater social dominance orientation, whereas liberals’ financial risk taking is invariant to their self-efficacy. This central hypothesis is verified in six studies using different measures of political identity, self-efficacy, and financial risk taking. The studies also use different samples of U.S. consumers, including online panels, a large-scale data set spanning five election cycles, and a secondary data set of political donations made by managers at companies. Finally, the authors articulate and demonstrate the mediating effect of individuals’ focus on the upside potential of a decision among conservatives but not liberals.
Keywords
According to the Federal Reserve (2015), 94.5% of U.S. households hold financial assets such as cash, certificates of deposit, bonds, stocks, or mutual funds (Bricker et al. 2014). In 2014, U.S. consumers invested more than $1.3 trillion in financial products. Recognizing the importance of consumers’ financial decisions (Duclos, Wan, and Jiang 2013), marketing scholars have examined how various consumer identities—gender, moral, and social—shape their financial decisions, such as risk taking (Mandel 2003), investing (He, Inman, and Mittal 2008), and in-store spending (Kurt, Inman, and Argo 2011).
In this context, we examine how consumers’ political identity affects their financial decisions, specifically with respect to financial risk taking. Surveys by the Pew Research Center, Gallup, and the American National Election Studies show that most respondents (92% or higher) identify themselves politically on a liberal–conservative continuum. As our studies show, political identity is easy to measure using consumers’ zip code, media habits, voting behavior, and other observable factors. Not surprisingly, firms have sought to position their financial offerings on the basis of consumers’ political identity.
A review of prior empirical research suggests that conservatives are less risk seeking than liberals. As we describe in Web Appendix A, studies show that conservatives are (1) more sensitive to ambiguity and threats/losses (Jost et al. 2003), (2) less prone to seek novelty (Shook and Fazio 2009), (3) less likely to engage in sensation seeking (Kish 1973), (4) less willing to try new products (Khan, Misra, and Singh 2013), and (5) less likely to look for new experiences (Carney et al. 2008).
However, the link between political identity and financial risk taking among individuals is less clear and beset with contradictory findings. Some studies have shown that conservatives are more risk seeking than liberals with respect to investing in mutual funds and new business ventures (Choma et al. 2014; Moore, Felton, and Wright 2010), while another study found no differences between Republicans and Democrats in their choice of risky financial options (Morris, Carranza, and Fox 2008). These mixed findings suggest the need to understand the moderated nature of the association between political identity and financial risk taking. We posit a person’s self-efficacy as one factor that moderates the association between political identity and financial risk taking. Self-efficacy is defined as a person’s belief in his or her capability to perform actions that prospective situations demand (Gist 1987; Whyte, Saks, and Hook 1997).
We locate the theoretical basis of this moderation in conservatives’ high social dominance orientation (SDO; Sidanius and Pratto 1999), or the extent to which people classify groups on a superiority–inferiority dimension and accept inequality across groups. Those with a high SDO are motivated to gain or maintain superiority and dominance over others. Prior research has shown that conservatives are more likely to have a higher SDO than liberals (Duckitt 2006; Pratto et al. 1994). Because of their relatively higher SDO, conservatives are more sensitive to opportunities that help them gain or maintain dominance. In contrast, liberals are less sensitive to these opportunities because of their relatively lower SDO. To the extent that financial gains are viewed as helping secure social dominance, conservatives are more likely than liberals to focus on gains in the financial domain. That is, conservatives’ greater focus on the upside potential and achievement associated with financial gains may promote greater financial risk taking among this group. In summary, because of their higher SDO, conservatives’ (not liberals’) financial risk taking will be higher when they have higher self-efficacy.
Six studies examine the joint effect of political identity and self-efficacy on financial risk taking. These studies achieve internal and external validity and show convergent results across different measures of political identity, self-efficacy, and financial risk taking as well as different data sources (experiments, survey data, and secondary data). Two studies also show a link between political identity and SDO. By theoretically articulating and empirically demonstrating the effect of a consumer’s identity on decision making as a contingent relationship, we argue that the appropriate research question is not whether but rather when conservatives are different from liberals in terms of risk seeking. Finally, we show that issue-relevant self-efficacy (e.g., financial self-efficacy) as well as generalized self-efficacy can moderate financial risk taking. Theoretically, our results help reconcile contradictory findings in the literature on political identity and financial risk taking among individuals.
Literature Review and Hypothesis Development
Political Identity and Financial Risk Taking
Political identity refers to a person’s beliefs about the primary goals and principles of a political system (Grove, Remy, and Zeigler 1974; Jost et al. 2003). The most dominant conceptualization of political identity in Western culture distinguishes conservative and liberal political identities (Skitka and Tetlock 1993) along two core dimensions: (1) preference for tradition versus social change and (2) acceptance versus rejection of inequality (Jost et al. 2003).
As summarized in Web Appendix A, previous literature has suggested that, in general, conservatives are less open to new experiences, less curious (Carney et al. 2008; Hirsh et al. 2010; Lee et al. 2010), and less likely to seek novelty and new sensations (Kish 1973; Shook and Fazio 2009). In Jost et al.’s (2003) meta-analytic review, conservatives were higher on ambiguity intolerance, uncertainty avoidance, and fear of loss. A careful reading of these studies suggests a more nuanced relationship: conservatives and liberals seek risk differently in different domains (Choma et al. 2013). For example, liberals are less risk seeking when it comes to domains such as climate change (Jones 2010) or handguns, focusing instead on mechanisms that will lower these risks. Choma et al. (2014) examine five domains (financial, recreational, ethical, social, and health) and find that risk seeking is higher among conservatives than among liberals in the financial domain; specifically, conservatives are more likely to choose the riskier option with a higher expected return than liberals. Moore, Felton, and Wright (2010) also find that conservatives are more risk seeking in the financial domain. However, other studies show no difference in financial risk taking between liberals and conservatives (Morris, Carranza, and Fox 2008).
To quantitatively examine this issue, we conducted a meta-analysis of the five empirical studies examining the relationship between political identity and financial risk taking. 1 As Figure 1 shows, the effect size is statistically nonsignificant (r = .07, 95% confidence interval [CI] = [–.001, .145]), indicating a null main effect of political identity on financial risk taking. The I2 value is estimated at 85.93% (95% CI = [69.98%, 95.40%]), suggesting a high degree of heterogeneity among studies. We conclude that the association between political identity and financial risk taking is best specified as a moderated relationship, as we explain in detail next.
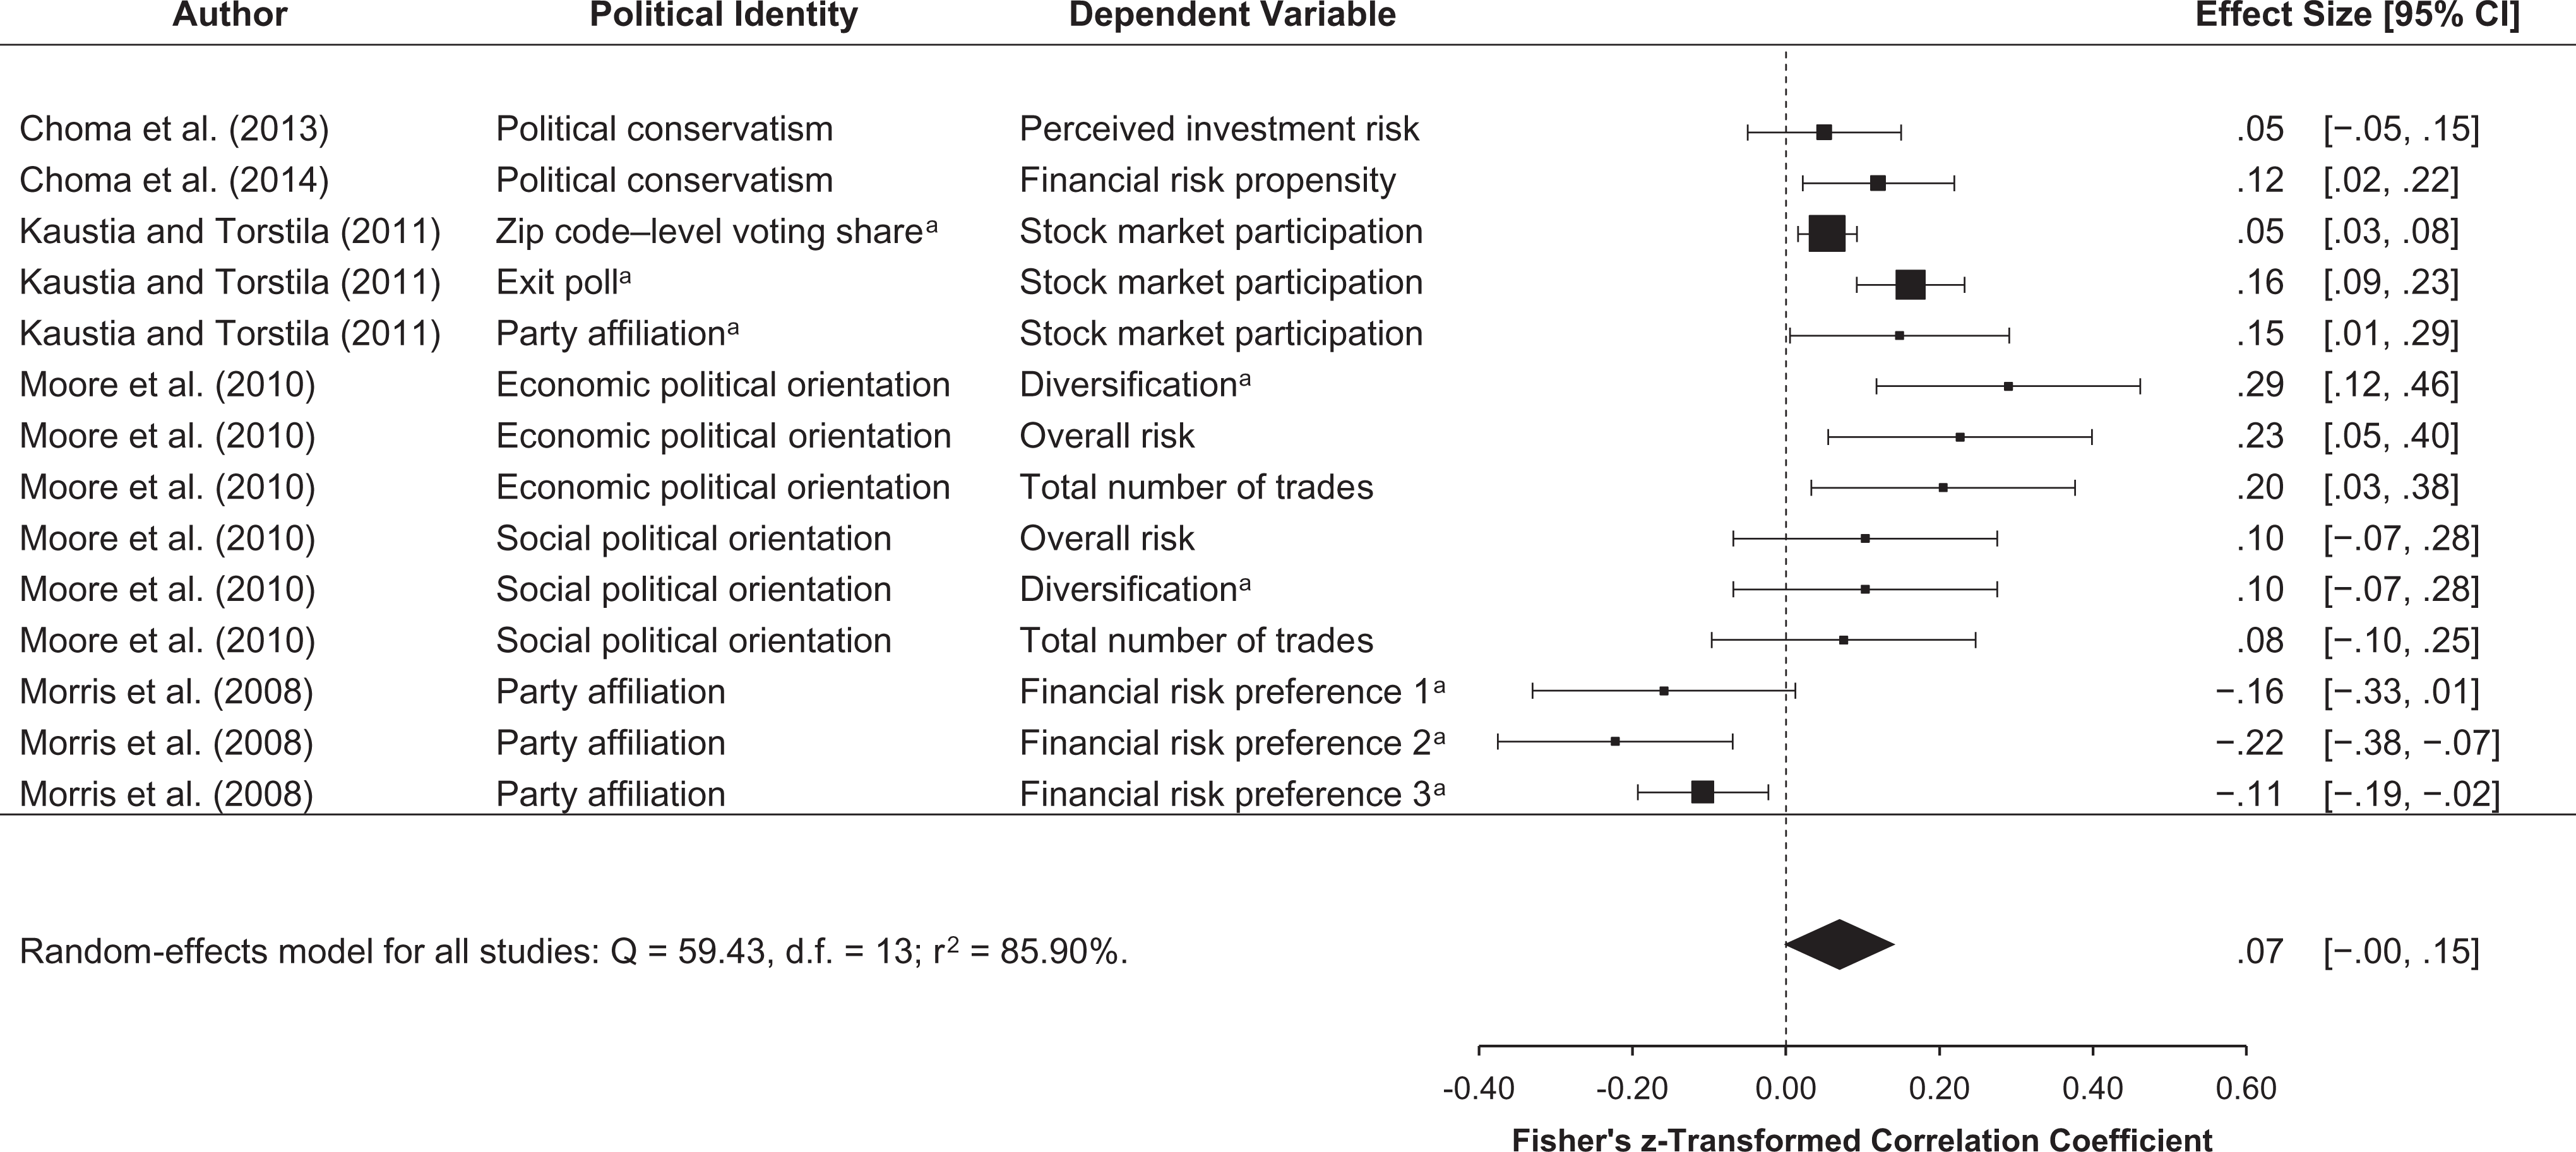
A systematic review of the literature on individual political identity and financial risk taking.
Political Identity and SDO
Social dominance orientation refers to the motivational tendency to preserve the dominance and high status of the in-group (Sidanius and Pratto 1999). According to Cozzolino and Snyder (2008), SDO is associated with conservative values, such that conservatives’ higher SDO is reflected in a desire to maintain the relatively higher status of their in-group through social hierarchy and inequality. In support of this notion, a recent survey by the Pew Research Center (2017) reveals that only 26% of Republicans consider economic inequality a major issue, compared with 66% of Democrats. In addition to accepting inequality, the survey also shows that conservatives (61%) more strongly believe that they can move up the economic ladder than liberals (36%). Thus, for conservatives, the world is a “competitive jungle” (Duckitt 2006; McFarland 2005) in which a person’s primary goal should be to preserve social dominance in a hierarchical system (Altemeyer 1998; Duckitt 2006; Sidanius and Pratto 1999). Within marketing, Ordabayeva and Fernandes (2018) show that conservatives prefer vertically differentiated products (e.g., the best in a given category, luxury items) because of their higher SDO, whereas liberals prefer horizontally differentiated products (e.g., uniqueness) because of their lower SDO. Cozzolino and Snyder (2008) show that high-SDO individuals exhibit a stronger desire to achieve and are more competitive. Choma et al. (2013) show that high-SDO individuals view competitive hazards such as sports, war, and high-risk investments as less risky.
Our core argument is that conservatives are likely to view financial gains as playing a key role in enhancing social dominance. Therefore, financial investment decisions involving an upside potential are more attractive to conservatives because they may increase social dominance. Furthermore, the upside is likely to be greater for financial decisions that involve higher risk than for those that involve lower risk. In contrast, liberals are more likely to focus on social equality; as such, a financial investment decision is less likely to evoke a strong motivation for gains among liberals. This difference between conservatives and liberals may make them differentially sensitive to self-efficacy, which is related to a focus on upside potential.
The Moderating Role of Self-Efficacy
Self-efficacy is defined as a person’s perception of his or her capability to achieve a certain level or type of performance (Gist 1987). Prior research has differentiated general self-efficacy and domain-specific self-efficacy, showing that both affect outcomes in domains such as financial decisions (Romero and Craig 2017) and academic performance (Bandura 1993). In general, studies have shown that domain-specific self-efficacy (e.g., financial self-efficacy) has similar effects as generalized self-efficacy (Bandura 1993). For example, labeling this concept “issue capability,” Mittal, Ross, and Tsiros (2002) and He, Inman, and Mittal (2008) find that general self-efficacy and financial self-efficacy yield similar results. Therefore, we examine both generalized and financial self-efficacy as a moderator.
People with higher self-efficacy are more optimistic, undertake more challenging tasks, and are more likely to explore new environments than those with lower self-efficacy (Bandura 1997; Scholz et al. 2002). These tendencies may enhance risk taking for a variety of reasons. High-self-efficacy individuals believe that they are able to avoid and cope with negative consequences (March and Shapira 1992) and that negative events are less likely to happen to them (Weinstein 1980). Self-efficacy also directs a person’s attention toward positive outcomes (Locke et al. 1981) and positive attributes of the decision task (Karademas 2006). Self-efficacy also affects decisions through higher aspiration levels, higher expectations of positive outcomes (Bandura 1997), and higher perceived opportunities relative to threats (Krueger and Dickson 1993, 1994). Consequently, there is a strong positive association between self-efficacy and financial risk taking (e.g., Krueger and Dickson 1993, 1994; March and Shapira 1987).
Mittal, Ross, and Tsiros (2002) show that people with higher self-efficacy have an increased focus on the upside potential of a decision; this upside focus leads to a higher level of financial risk taking for positively framed options. Krueger and Dickson (1994) find that people with higher self-efficacy focus more on opportunities than on threats and believe that these opportunities are more achievable. This differential focus on the upside potential leads to the moderating role of self-efficacy in risk-seeking behavior.
As we theorized previously, conservatives may be more sensitive to the influence of self-efficacy on financial risk taking because self-efficacy increases a person’s focus on the upside potential or positive outcomes related to the financial decision (Mittal, Ross, and Tsiros 2002). Thus, due to conservatives’ higher SDO, those with a higher level of self-efficacy (relative to those with a lower self-efficacy) will have an increased focus on the upside potential of financial risk seeking. In contrast, liberals, who generally have a lower SDO, should be invariant to differences in self-efficacy because they are relatively less sensitive to the upside of a financial decision that involves gain maximization. To be clear, we do not argue that liberals focus on the downside or that the effect of self-efficacy on financial risk taking is reversed among liberals. Instead, we expect the interaction of political identity and self-efficacy to manifest only among conservatives because self-efficacy will drive financial risk taking among conservatives but not among liberals. He, Inman, and Mittal (2008) make a similar argument when they show that men, but not women, are more focused on the upside of a financial decision due to their agentic orientation and exhibit distinct behaviors in response to self-efficacy. Thus, we hypothesize the following:
Next, we describe a series of six studies. Study 1 tests H1 using a large-scale secondary data set of consumers. Studies 2a–3 test H1 using several different measures of political identity (Study 2a), a real investment decision (Study 2b), and manipulated political identity (Study 3). Study 4 examines the underlying mechanism by measuring SDO and testing the mediation of a focus on the upside potential of a decision, as posited in H2. Finally, Study 5 replicates the results by examining firm-level investment decisions by managers.
Study 1
Data
The first data source is the Consumer Expenditure Survey (CEX), with five waves of interviews conducted annually by the Bureau of Labor Statistics (http://www.bls.gov/cex/). 2 The CEX provides data on consumers’ expenditures, income, and demographics. It spans 19 years (1996–2014) and includes 5,000–7,500 households annually. The second data source is the American Presidency Project at the University of California, Santa Barbara (http://www.presidency.ucsb.edu/), which provides U.S. presidential elections data for each election year at the state level.
Measures
Financial risk taking
Morin and Suarez (1983) show that a household’s asset portfolio provides two measures of its risk-taking behavior: (1) whether a household holds risky assets and (2) the value of risky assets (Vissing-Jørgensen and Attanasio 2003). Measuring a household’s holdings of risky assets as the value of stocks, bonds, mutual funds, and other such securities, we created two dependent variables: (1) the value of these assets (in millions of dollars) and (2) a dummy variable taking a value of 1 if the household had positive holdings of risky assets and 0 otherwise (Vissing-Jørgensen and Attanasio 2003). To be conservative, when a household had a missing value for risky assets but not for riskless assets (e.g., savings accounts, checking accounts, U.S. savings bonds), we coded the household as holding zero risky assets.
Political identity
The CEX database does not measure a household’s political identity. We measured political identity at the state level, using presidential elections data in accordance with Khan, Misra, and Singh’s (2013) approach. Other studies have also used geographic location to measure political identity (e.g., Jung et al. 2017; Ordabayeva and Fernandes 2018).
The American Presidency Project provides the number of votes each presidential candidate received from each state in an election year. For each election year, we obtained the proportion of votes the Democratic and Republican presidential candidates received in a state. The difference between the two proportions measures state-level political identity. A value closer to 1 (–1) indicates that the household is residing in a state in which, on average, consumers are more politically liberal (conservative).
Political identity, SDO, and household location (pretest)
We collected data from 2,150 participants across 50 states using Amazon Mechanical Turk (MTurk) (male = 50.3%; Mage = 36.33 years). Participants completed the eight-item SDO scale adapted from Pratto et al. (1994) (1 = “strongly disagree,” and 7 = “strongly agree”; α = .73), reported their political identity (1 = “strongly conservative,” and 7 = “strongly liberal”), and provided their five-digit zip code, which we used to identify their state of residence. We excluded 11 states with fewer than ten participants. The remaining 39 states yielded 2,085 participants for the final analysis (for details, see Table 1). For each state, we computed the average SDO, individual-level political identity, and state-level political identity using the average voting records from the three most recent presidential elections (2008, 2012, and 2016).
State-Level Descriptive Statistics and Correlation Matrix (Study 1 Pretest).

Notes: n = 39 states. Correlations significant at p < .05 are in boldface. The number of respondents for each state is as follows: California (284), Florida (148), Texas (146), New York (139), Pennsylvania (113), North Carolina (85), Illinois (78), Ohio (76), Michigan (73), Georgia (62), Virginia (60), New Jersey (56), Arizona (51), Washington (51), Missouri (50), Oregon (50), Tennessee (48), Indiana (43), Massachusetts (40), Colorado (36), Wisconsin (36), Maryland (35), Alabama (31), Minnesota (31), Kentucky(30), Connecticut (26), Louisiana (26), South Carolina (23), Oklahoma (20), New Mexico (19), Nevada (18), Kansas (17), Arkansas (14), Mississippi (14), Utah (13), Delaware (11), Hawaii (11), Maine (11), and Idaho (10).
As Table 1 and Figure 2 show, political identity, as measured by state-level voting record, was (1) positively correlated with individuals’ self-reported political identity (r = .41) and (2) negatively correlated with individuals’ self-reported SDO (r = −.53). Thus, state-level voting behavior is a valid and reliable indicator of individuals’ political identity and SDO.

SDO by states.
Self-efficacy
He, Inman, and Mittal (2008) measure self-efficacy using the past winnings of participants in a game show, while Mittal, Ross, and Tsiros (2002) measure it as past firm performance. Following these studies, we measured each household’s self-efficacy using the change in assets the household experienced compared with the previous year—that is, the sum of changes in asset values (e.g., checking and savings accounts, investment funds, saving bonds) the household possesses. More specifically: for household h,

where ΔAssethi indicates the change in household h’s asset value of asset i in millions of dollars (e.g., savings account; Table B1 in Web Appendix B lists the specific assets).
To assess the validity of this secondary measure, we ran a pretest with 99 participants who were randomly assigned to (1) an increased-asset condition or (2) an unchanged-asset condition. In the increased-asset condition, participants’ overall asset value increased compared with the previous year. In the unchanged-asset condition, the asset value remained unchanged. After we controlled for their baseline self-efficacy, which we measured before the scenario, participants in the increased-asset condition reported greater self-efficacy (M = 5.34) than those in the unchanged-asset condition (M = 4.66; F(1, 98) = 9.46, p < .01) (for measures of self-efficacy, see Web Appendix C). Thus, an increase in asset value was positively associated with increased self-efficacy.
Control variables
We controlled for household-specific demographics to remove the potential effect of systematic spending patterns. Specifically, we controlled for age, gender, race, area of residency, education level, income level, marital status of the head of the household, and a household’s level of liabilities and total expenditures (both in millions of dollars) to account for the household’s potential size of total assets. 3
The final sample covers five years (1996, 2000, 2004, 2008, and 2012) and 42 states, with 196 year-state combinations. The years and states covered in our data set correspond to those included in both the CEX database and the presidential election database. Table 2 shows the descriptive statistics and correlations for the variables.
Descriptive Statistics and Correlation Matrix (Study 1).

aThe base case for race is African American.
bThe base case for residential area is the western region.
cLow income = 0–33.33rd percentile; middle income = 33.34–66.67th percentile. The base case for income is high income (66.68–100th percentile).
dLow education = high school graduate or lower; middle education = attended some college. The base case for education is high education (college or advanced degree).
eThe base case for marital status is “other than married” (i.e., divorced, never married, separated, or widowed).
Notes: Correlations significant at p < .05 are in bold.
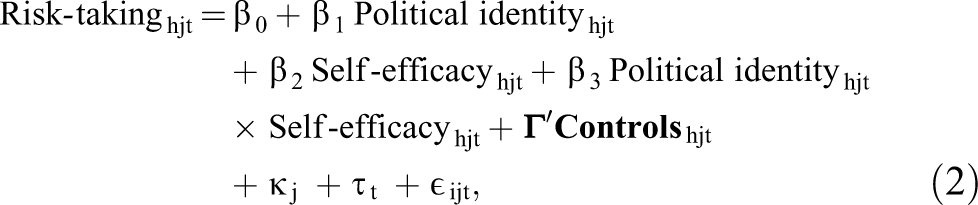
Model Explanation
The data set is cross-sectional, such that each household is only observed in a unique year and within a single state. Therefore, a large proportion of the variance may be attributed to unobserved factors across years and across states. To control for heterogeneity between households due to year- and state-specific factors, we used a random-effects approach and specified our model as follows:
for household h in state j at time t, where
We use two dependent measures: (1) value of risky assets (continuous) and (2) whether a household holds risky assets or not (binary). For the first dependent measure, we assume that the error term follows a normal distribution (i.e.,
Results
Table 3 shows that the two-way interaction between political identity and self-efficacy is statistically significant for both dependent measures: (1) value of risky assets (β = −1.01, p < .01) and (2) holds risky assets (β = −4.47, p < .05). As Figure 3 shows, households (1) have higher values of risky assets (β = .38, p < .01) and (2) are more likely to hold stocks (β = 1.17, p < .05) when they are in conservative states and have higher self-efficacy. The results for households in liberal states are not significant (ps > .10). These results support H1.
The Impact of Political Identity and Self-Efficacy on Households’ Financial Risk Taking (Study 1).

*p < .10.
**p < .05.
***p < .01.
Notes: All continuous variables are centered at the mean. LL = log-likelihood; AIC = Akaike information criterion; BIC = Bayesian information criterion.
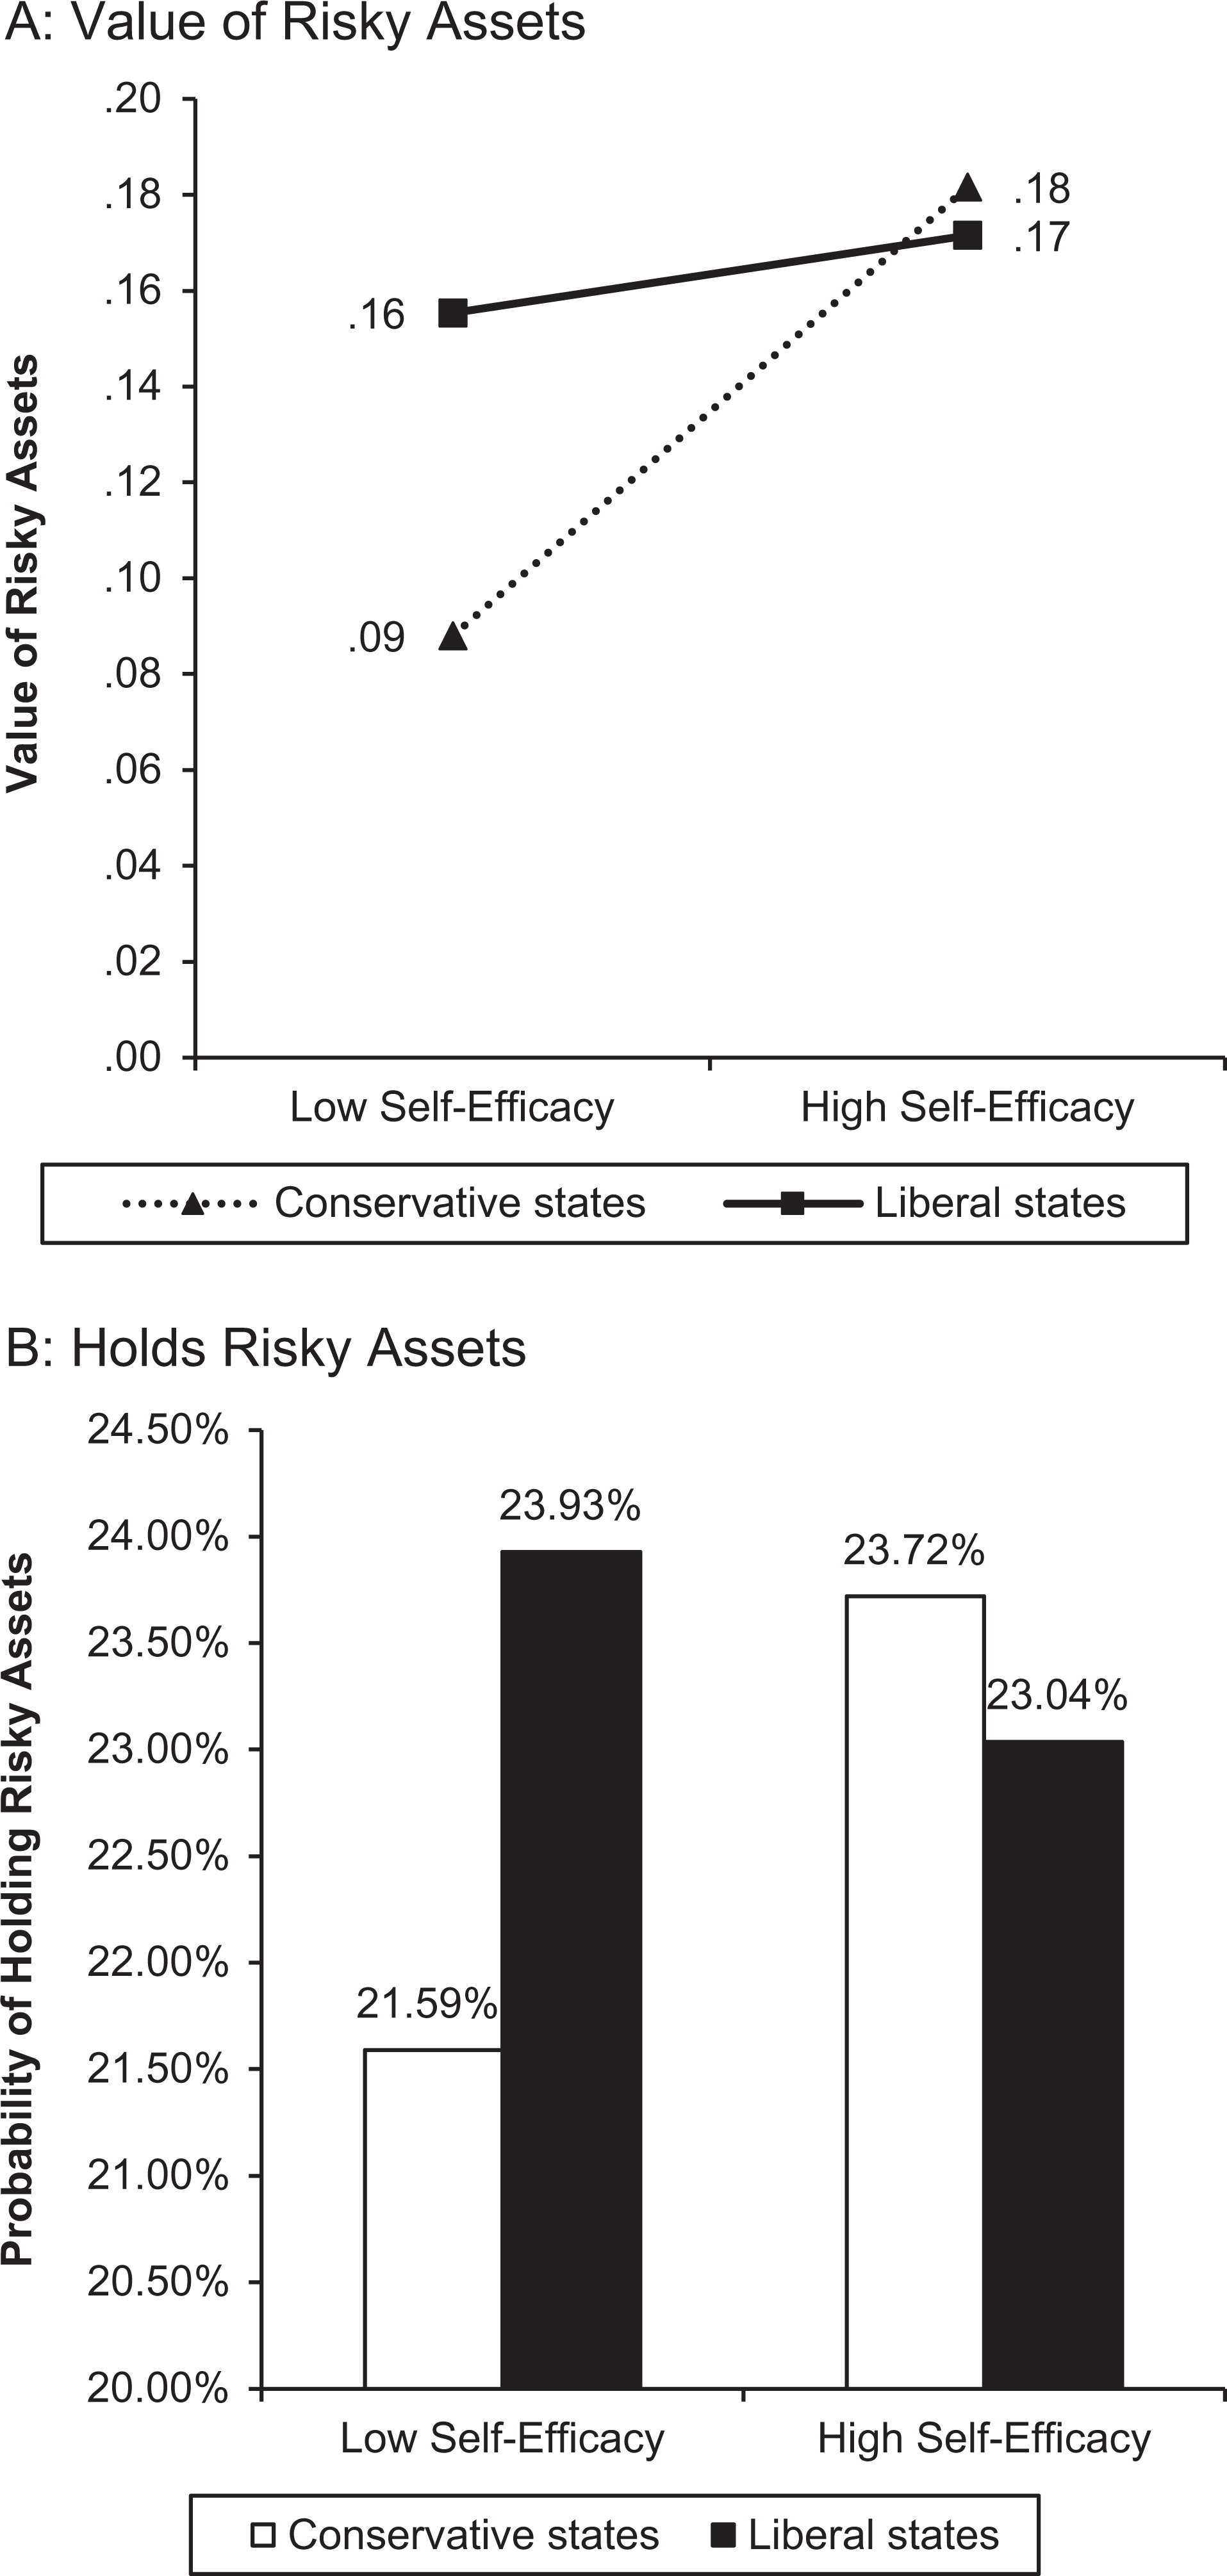
The interactive effect of political identity and self-efficacy on households’ financial risk taking (Study 1).
Discussion
Study 1 supports H1 using a nationwide data set of consumers over several years. Although it uses a behavioral measure of political identity (i.e., actual voting behavior), the measure is at the state level while self-efficacy and financial risk taking are measured at the household level. In Studies 2a and 2b, we test H1 using individual-level measures of political identity, self-efficacy, and financial risk taking.
Study 2a
Method
Participants and design
We recruited 199 participants (60% female; Mage = 36.39 years) from MTurk. We used a single factor (self-efficacy: high vs. low) between-subjects design and measured political identity on different scales. After the self-efficacy manipulation, participants completed the financial risk-taking measure followed by items measuring political identity, a self-efficacy manipulation check, and demographics.
Manipulation of self-efficacy
Participants were randomly assigned to the high (n = 101) and low (n = 98) financial self-efficacy conditions, and all of them completed a writing task. In the high (low) financial self-efficacy condition, participants listed three reasons they have high (low) confidence in their ability to make financial decisions.
Financial risk taking
Following He, Inman, and Mittal (2008), participants saw two investments in which they could allocate $5,000 of savings. Both options had equivalent expected payoffs (4%) but differed in terms of their risk. The less risky option, a bank account, offered a guaranteed return of 4%. The riskier option, a stock fund, offered the following prospects: (1) a 45% chance of generating a return of 16%, (2) a 10% chance of generating a return of 4%, and (3) a 45% chance of incurring a loss of 8%. 5 Participants indicated the percentage of money they would invest in the stock fund. A higher percentage of money allocated to the stock fund indicates a higher level of financial risk taking.
Political identity
We collected five measures of political identity. First, participants indicated their preferred broadcasting stations to watch news (0 = Fox, 1 = CNN/MSNBC). Empirical studies (Stroud 2008) have shown conservatives’ (liberals’) preference for Fox (CNN/MSNBC). Second, participants indicated the party with which they most closely identify (0 = Republican, 1 = Democrat). Third, participants self-reported their political identity on a seven-point scale (1 = “strongly conservative,” and 7 = “strongly liberal”; Winterich, Zhang, and Mittal 2012). Fourth, participants completed Mehrabian’s (1996) seven-item scale of political identity (1 = “strongly disagree,” and 7 = “strongly agree”; α = .89). Fifth, participants indicated their likelihoods of voting for the Democratic (Hillary Clinton) or the Republican (Donald Trump) candidate in the 2016 presidential election (0 = “definitely would not,” and 100 = “definitely would”). We subtracted the likelihood of voting for Donald Trump from that of voting for Hillary Clinton to measure participants’ political identity. On all scales, higher scores indicate a more liberal political identity.
Self-efficacy (manipulation check)
We adapted Schwarzer and Jerusalem’s (1995) self-efficacy scale (α = .93) for a financial context (for items, see Web Appendix C).
Results
Manipulation check for self-efficacy
A full-factorial analysis of variance (ANOVA) on the self-efficacy score revealed that the manipulation was successful. Participants in the high-self-efficacy condition rated their financial self-efficacy higher than those in the low-self-efficacy condition (Mhigh = 5.05 vs. Mlow = 4.20; F(1, 198) = 28.88, p < .01).
Main results (H1)
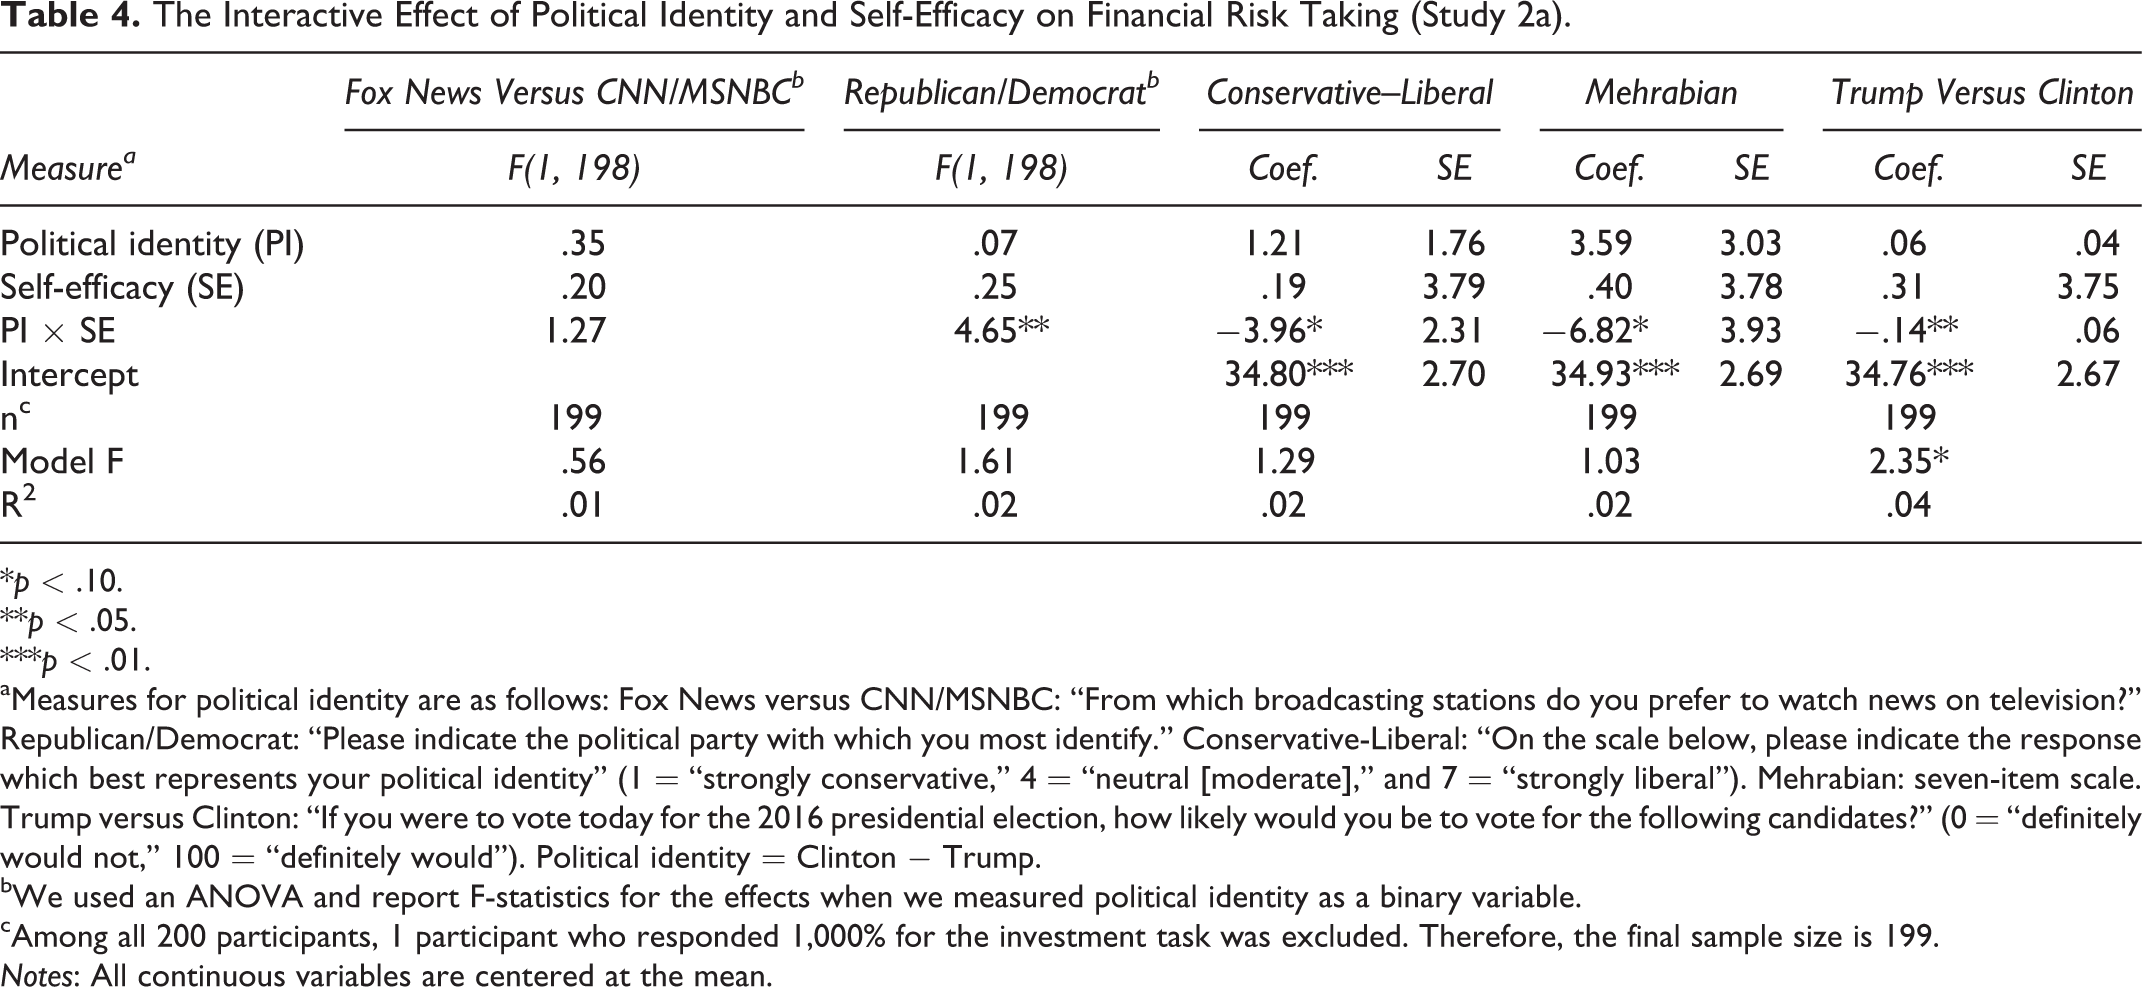
We ran five analyses, one with each measure of political identity, manipulated self-efficacy, and participants’ investment decisions. The results appear in Table 4.
The Interactive Effect of Political Identity and Self-Efficacy on Financial Risk Taking (Study 2a).
*p < .10.
**p < .05.
***p < .01.
aMeasures for political identity are as follows: Fox News versus CNN/MSNBC: “From which broadcasting stations do you prefer to watch news on television?” Republican/Democrat: “Please indicate the political party with which you most identify.” Conservative-Liberal: “On the scale below, please indicate the response which best represents your political identity” (1 = “strongly conservative,” 4 = “neutral [moderate],” and 7 = “strongly liberal”). Mehrabian: seven-item scale. Trump versus Clinton: “If you were to vote today for the 2016 presidential election, how likely would you be to vote for the following candidates?” (0 = “definitely would not,” 100 = “definitely would”). Political identity = Clinton − Trump.
bWe used an ANOVA and report F-statistics for the effects when we measured political identity as a binary variable.
cAmong all 200 participants, 1 participant who responded 1,000% for the investment task was excluded. Therefore, the final sample size is 199.
Notes: All continuous variables are centered at the mean.
When we measured political identity with binary variables (i.e., preferred broadcasting station, political party identification), we conducted a 2 (political identity) × 2 (self-efficacy) ANOVA. For continuous measures of political identity (i.e., conservative–liberal self-placement, the Mehrabian seven-item scale, and likelihood of voting for the Democratic or the Republican candidate), we ran a regression analysis.
The correlations among the variables appear in Web Appendix D. As Table 4 shows, four of the five measures support the hypothesized interaction in H1. 6 More importantly, when we estimate the combined interactive effect using the meta-analytic technique that McShane and Böckenholt (2017) recommend, the results are statistically significant (95% CI = [−.19, −.07]; see Figure 4). Thus, the results support H1.

Combined interactive effects of political identity and self-efficacy (Study 2a).
Discussion
In support of H1, conservatives allocated a higher proportion of their assets to the riskier stock fund, relative to the safer bank account, as their self-efficacy increased. In contrast, liberals’ financial risk taking was invariant to their level of self-efficacy.
Study 2b
Study 2b enhances the generalizability of Study 2a by using a real, incentive-compatible task. Participants chose between two existing financial products provided by the Vanguard Group (rather than fictitious products) in a context in which they received their chosen option through a lottery.
Method
Participants and design
Participants (N = 300; 39% female; Mage = 33.81 years) were recruited through MTurk. In addition to their regular compensation, each participant also took part in an incentive-compatible lottery, which served as the dependent variable. Participants were told that each of them would be automatically enrolled in a lottery, and one randomly selected person would win $100 in the form of the financial product (i.e., the Vanguard fund) they chose. Then, they chose between the two funds described next and completed measures of self-efficacy, political identity, and demographics.
Financial risk taking
The two funds were the Vanguard Short-Term Inflation-Protected Securities Fund and the Vanguard Emerging Markets Select Stock Fund (for details, see Web Appendix C; see also https://investor.vanguard.com/).
Financial risk taking (pretest)
A new set of 40 participants rated the perceived riskiness of the two funds on a seven-point Likert scale (1 = “not at all risky,” and 7 = “very risky”). As we expected, participants perceived the Vanguard Emerging Markets Select Stock Fund (M = 6.05) as riskier than the Vanguard Short-Term Inflation-Protected Securities Fund (M = 2.20, t = −16.00, p < .01). We coded choice of the Vanguard Emerging Markets Select Stock Fund as 1 and the other as 0.
Political identity
We measured political identity using a participant’s preferred news station (0 = Fox [conservative], 1 = CNN/MSNBC [liberal]).
Self-efficacy
We used Schwarzer and Jerusalem’s (1995) self-efficacy scale (α = .94).
Results
We used a logistic regression model for fund choice (1 = risky, 0 = not risky). The two-way interaction between self-efficacy and political identity was statistically significant (β = −.62, p < .05). In line with Aiken and West (1991), the interaction in Figure 5 shows that financial risk taking increases with self-efficacy for conservatives (β = .48, p < .10) but is invariant to self-efficacy among liberals (β = −.14, p > .10). Thus, the results fully support H1.
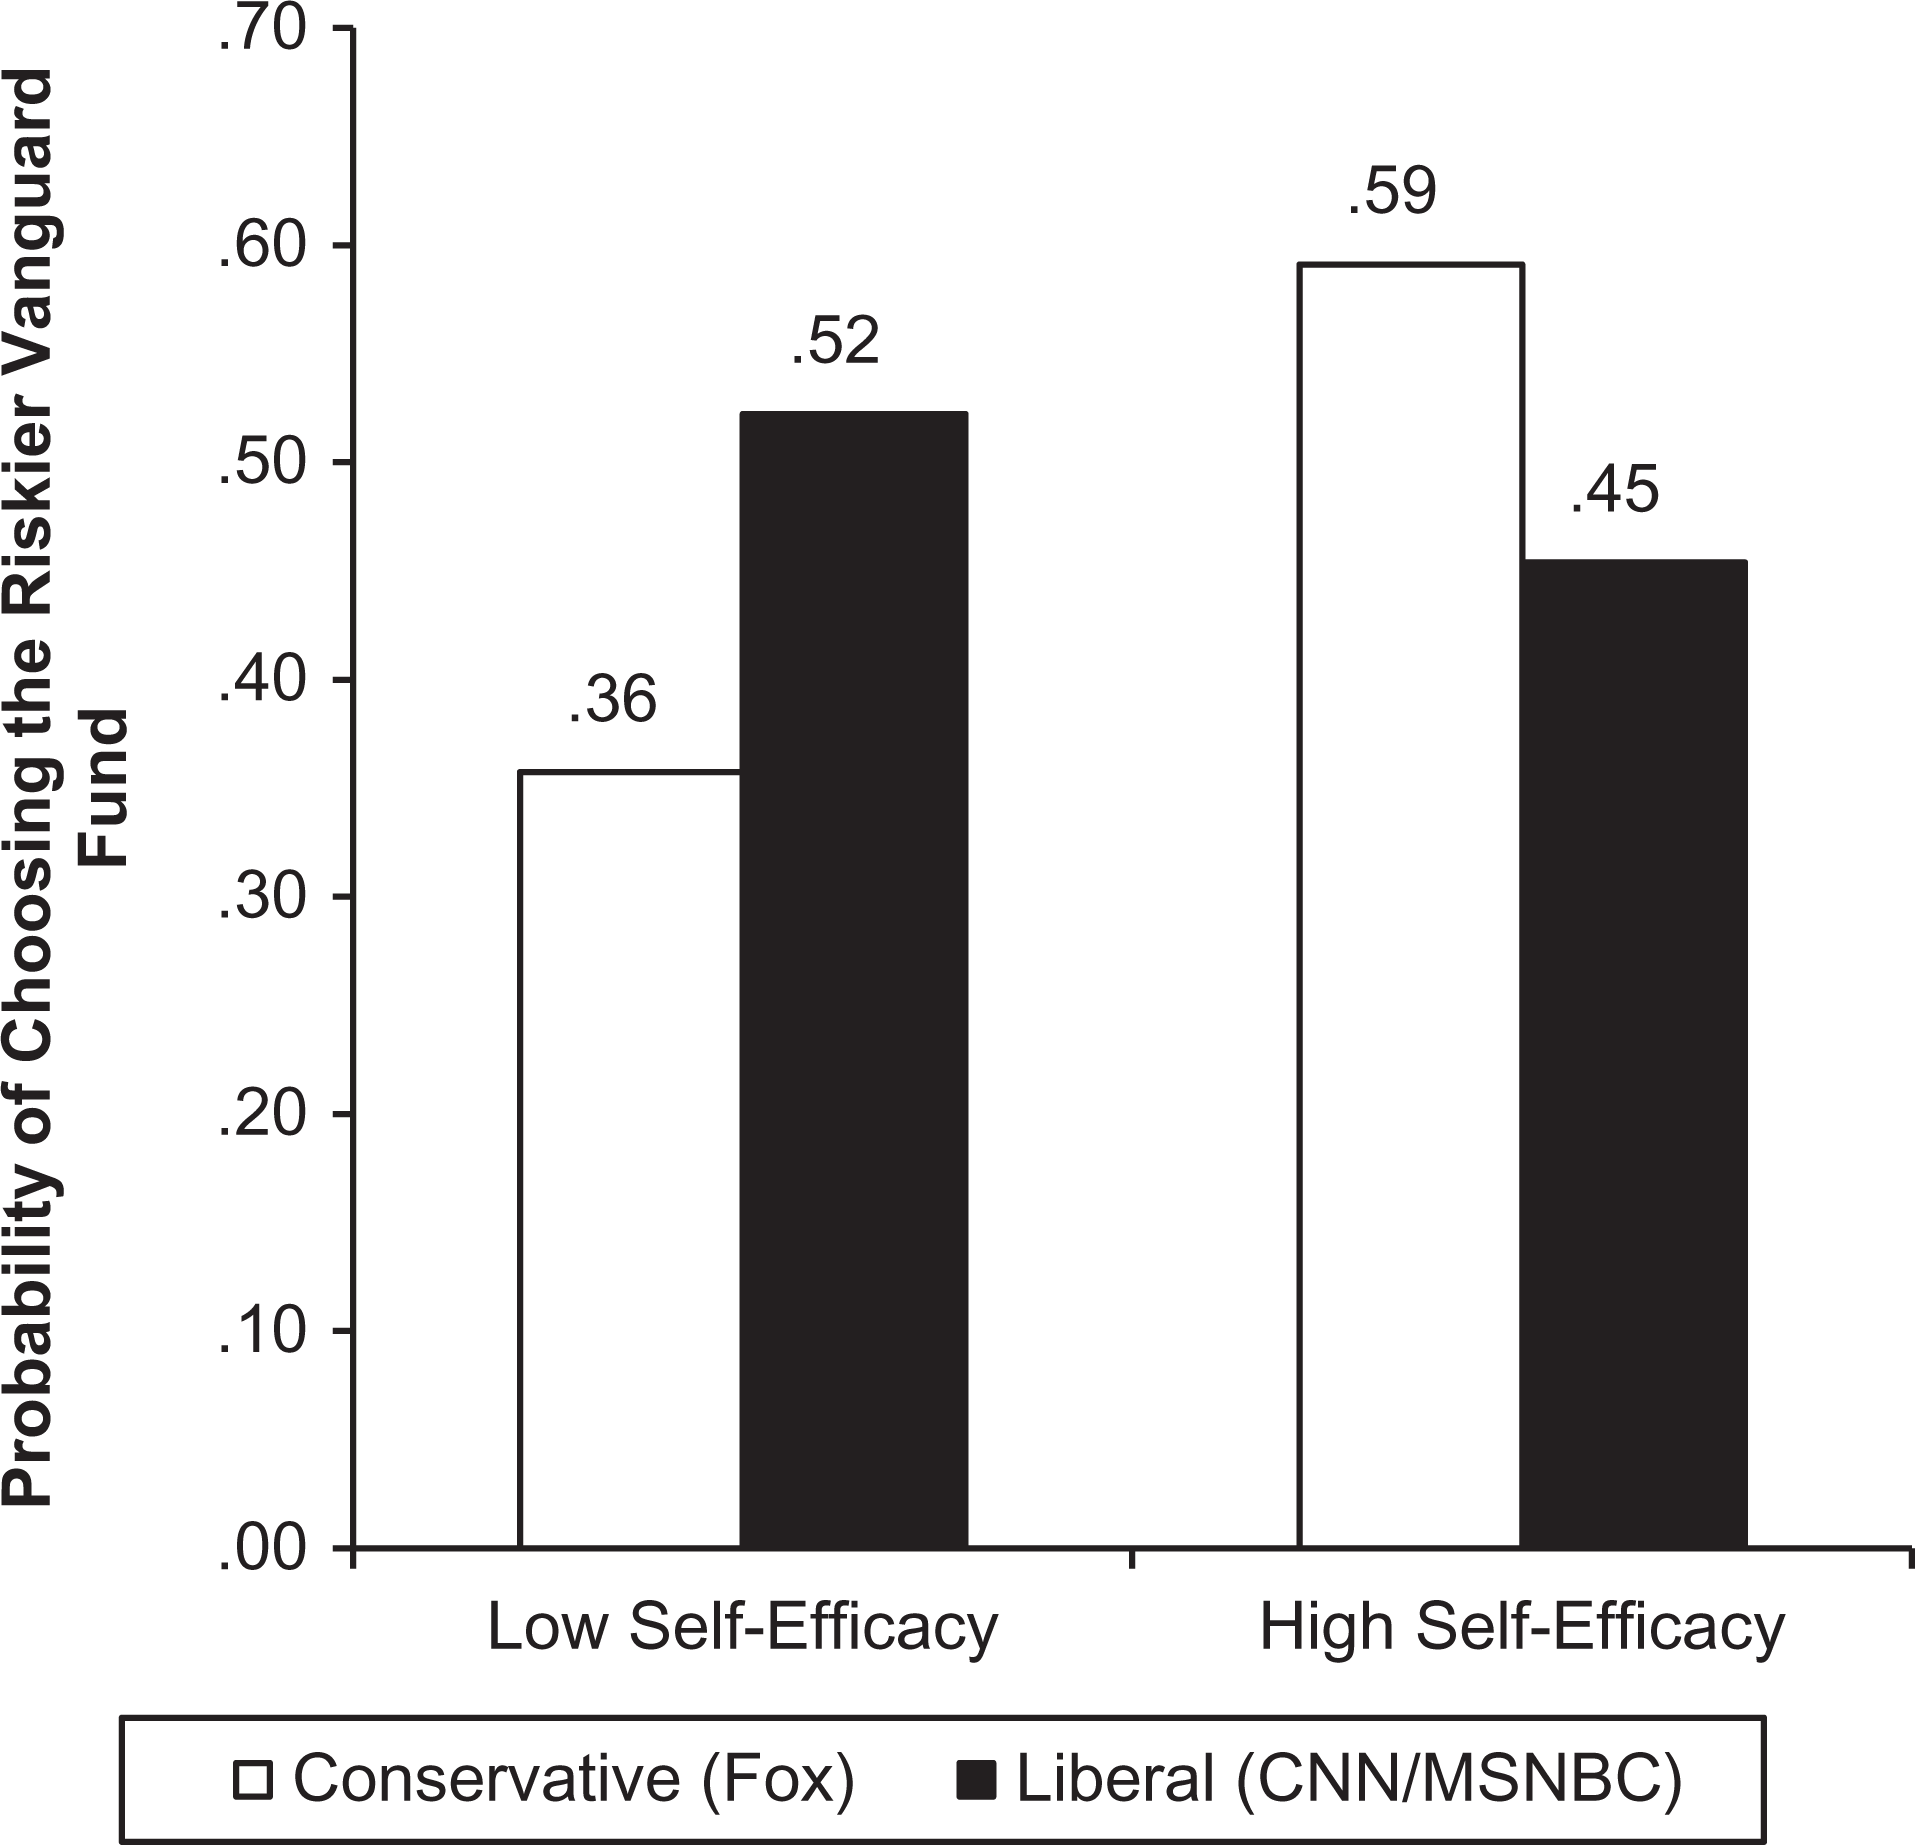
The interactive effect of measured political identity and self-efficacy on choice of riskier stock fund (Study 2b).
Discussion
Study 2b uses an incentive-compatible choice task with real funds offered by the Vanguard Group. Thus, it enhances the generalizability of the previous results.
Study 3
This study manipulates both political identity and self-efficacy, enabling us to rule out alternative factors such as gender, age, and education level, which may be associated with a person’s measured political identity and/or self-efficacy. As such, Study 3 establishes the causal effect of political identity and self-efficacy on financial risk taking (H1).
Method
Participants and design
This study uses a 2 (political identity: conservative vs. liberal) × 2 (self-efficacy: high vs. low) between-subjects design with 392 participants from MTurk (52% female; Mage = 36.88 years). Because MTurk participants have been shown to be relatively more liberal (Huff and Tingley 2015), we used a quota-sampling method to recruit respondents, with political identity measured through news media preference (Fox News vs. CNN/MSNBC) as the quota control. We used news media preference instead of more direct measures to avoid explicitly revealing the intent of the study. We assessed news media preference along with other demographics (e.g., gender, age) before the main survey. Then, within each stratum—Fox News and CNN/MSNBC—we randomly assigned participants to the liberal and conservative manipulation conditions. Thus, half of each of the Fox News and CNN/MSNBC viewers received the liberal manipulation, and the other half received the conservative manipulation. We found no differences in age and gender across conditions. After completing the political-identity manipulation, participants randomly received either the high-self-efficacy or the low-self-efficacy manipulation along with the financial decision task.
Manipulation of political identity
To manipulate political identity, we followed Ordabayeva and Fernandes (2018). In the conservative (liberal) condition, participants recalled and wrote about a situation in which they were interacting with someone who was more liberal (conservative) than them such that they felt they had a conservative (liberal) position. Although manipulating political identity away from a person’s original identity is very difficult, it is possible to influence perceptions of one’s relative ideological position using this approach.
Manipulation of self-efficacy
Participants saw the investment options used in Study 2a, but with the investment amount increased to $20,000. In the high-self-efficacy condition, participants were asked to imagine that they have successfully managed and increased their assets to $20,000 over the past few years. In the low-self-efficacy condition, they were asked to imagine that they have not been very successful, retaining only the $20,000 principal amount. A pretest with 215 adults on MTurk (female 46%; Mage = 36.10 years) verified that participants in the high-self-efficacy condition perceived their financial capability (1 = “very low,” and 7 = “very high”) to be higher than those in the low-self-efficacy condition (Mhigh = 5.14 vs. Mlow = 4.67; F(1, 213) = 6.22, p < .05).
Financial risk taking
Participants indicated if they would invest the money in the stock fund or the bank account on an 11-point scale (1 = “definitely will not invest in the stock fund,” and 11 = “definitely will invest in the stock fund”; a higher value indicates higher financial risk taking).
Political identity (manipulation check)
As a manipulation check, participants reported their political identity on a single-item measure (1 = “very conservative,” and 7 = “very liberal”).
Results
Manipulation check (political identity)
Participants in the conservative condition reported that they were more conservative than those in the liberal condition (Mconservative = 4.01 vs. Mliberal = 4.55; F(1, 390) = 8.36, p < .01), indicating a successful manipulation.
Effect of political identity on financial risk taking
A two-way ANOVA on financial risk taking with political identity and self-efficacy revealed a significant interaction (F(1, 388) = 4.39, p < .05). Results appear in Figure 6. Among conservatives, the preference for the riskier investment option was marginally higher when self-efficacy was high (M = 5.49) than when it was low (M = 4.61; F(1, 388) = 3.62, p = .058). Among liberals, there was no difference between the high- (M = 4.31) and the low- (M = 4.80) self-efficacy conditions (F(1, 388), p > .10).
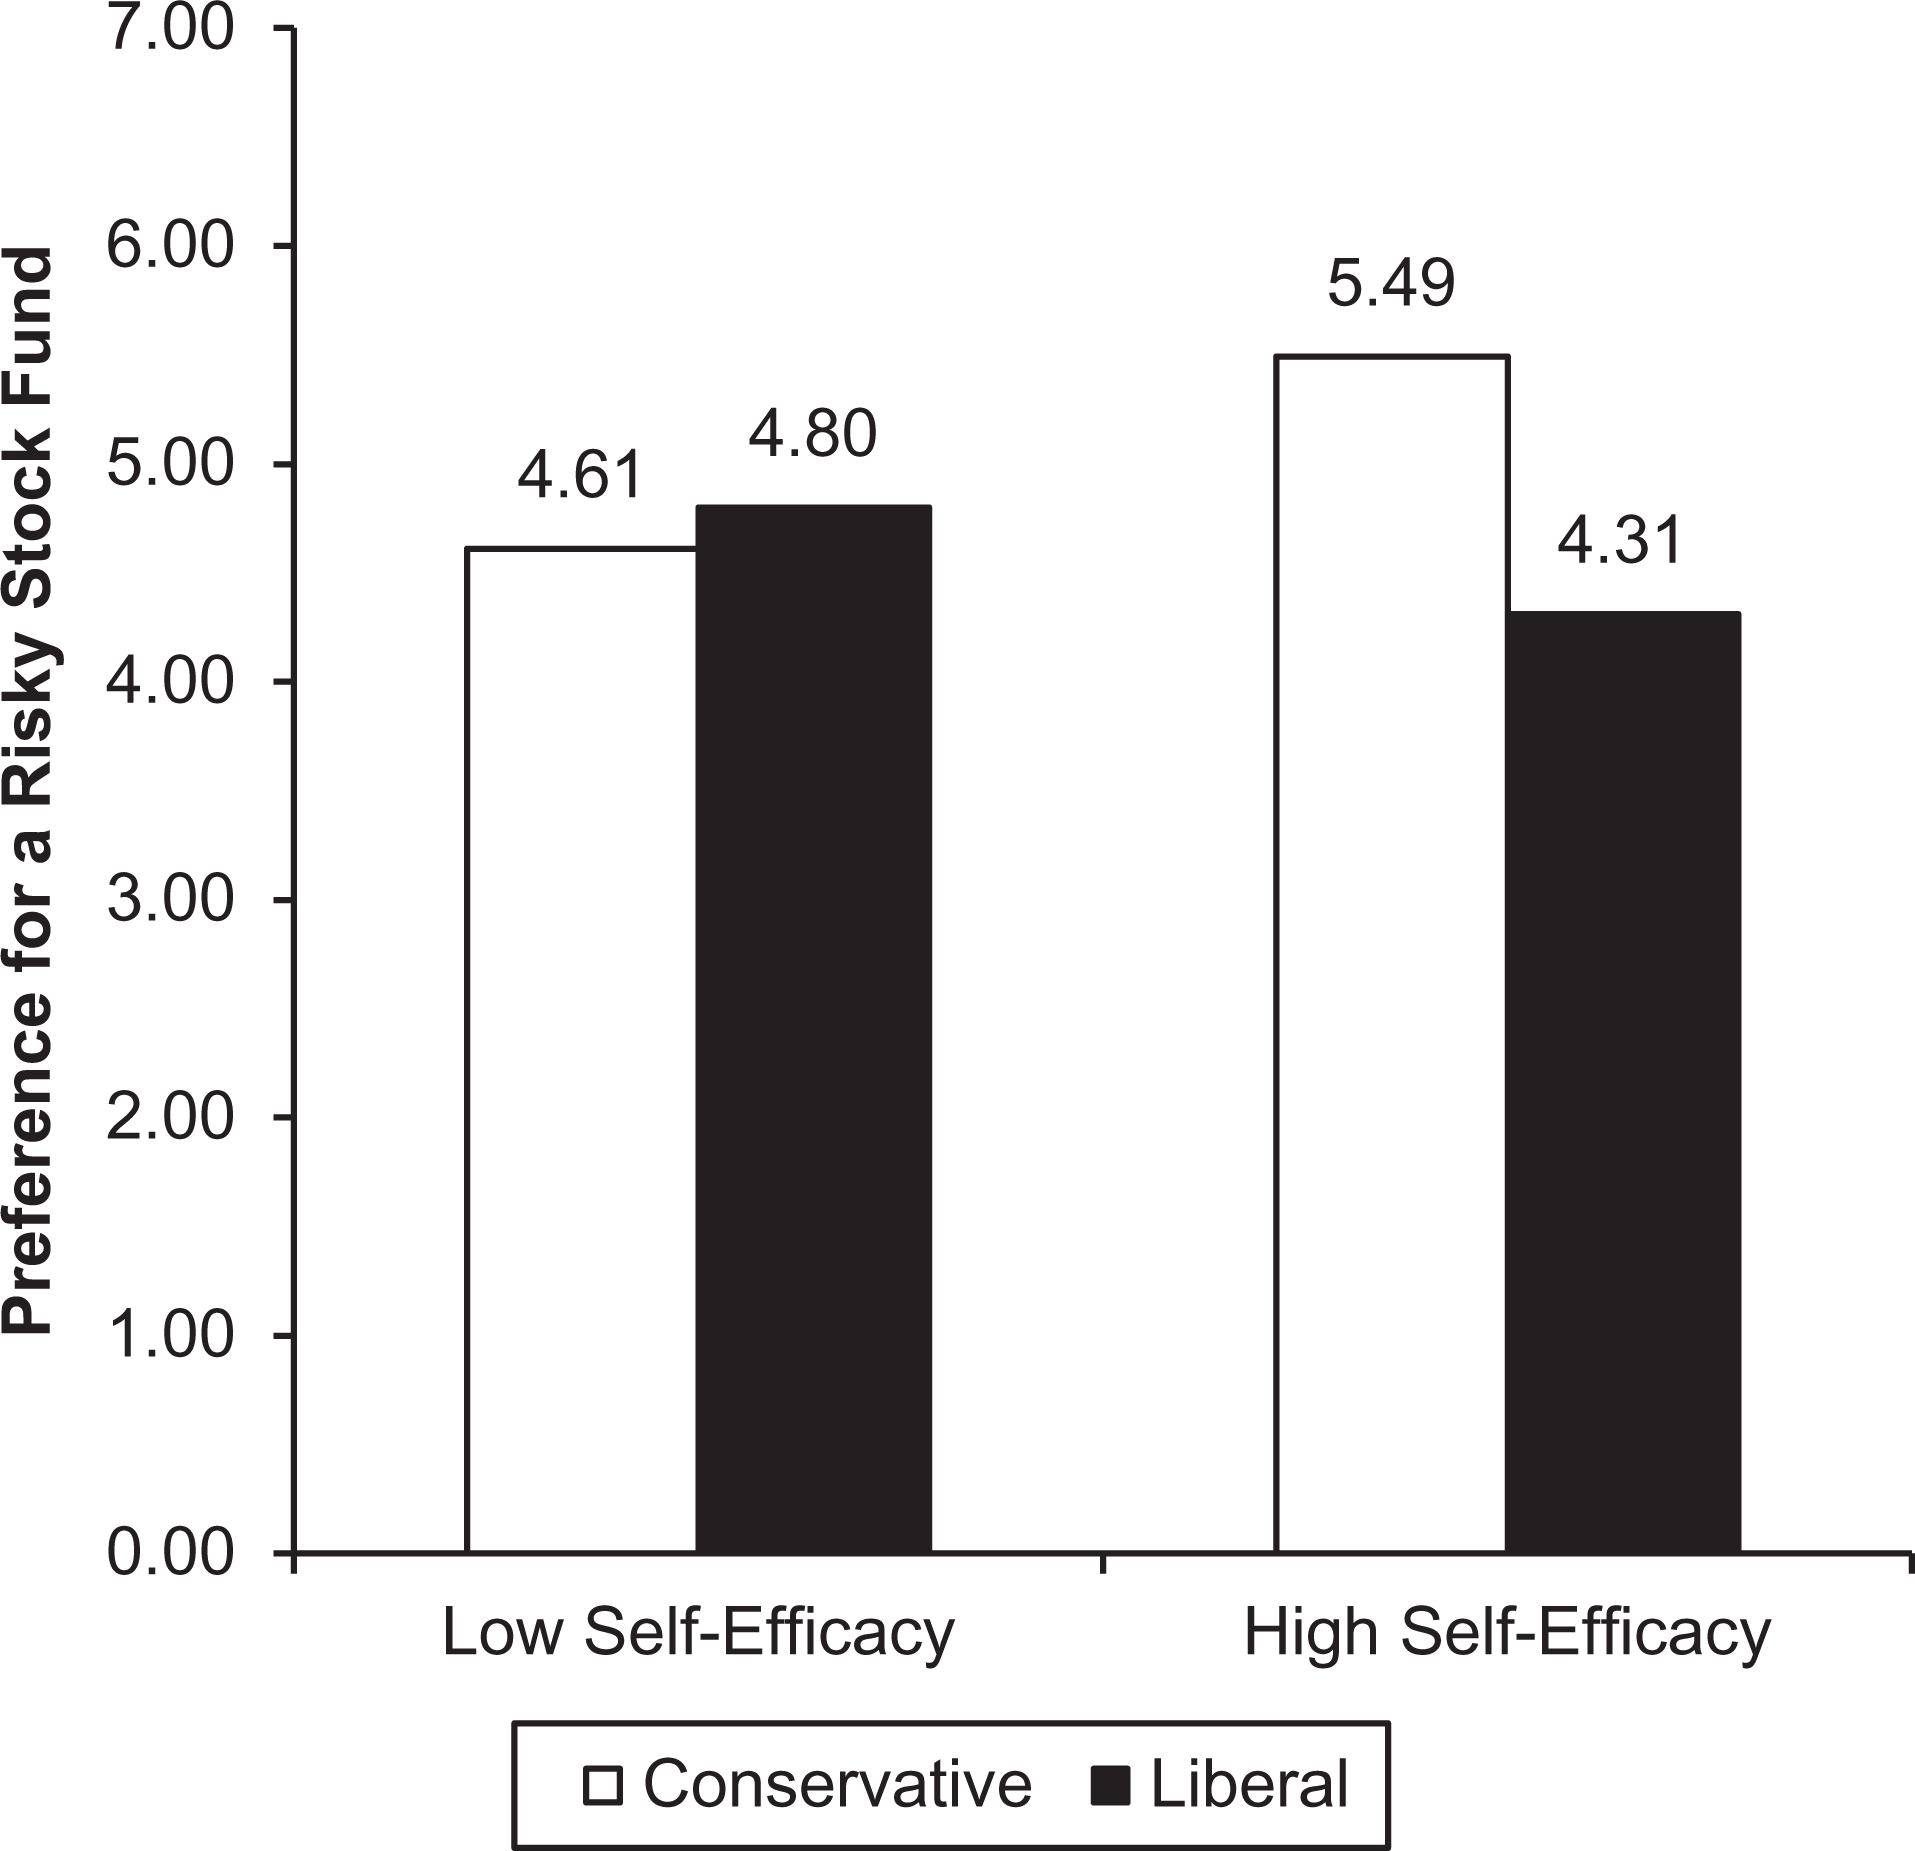
The interactive effect of manipulated political identity and self-efficacy on financial risk taking (Study 3).
Discussion
By manipulating political identity and self-efficacy, Study 3 provides causal evidence for our focal hypothesis. The findings rule out alternative explanations based on factors such as customer demographics that may be associated with political identity (and self-efficacy). In the next study, we also measure SDO to examine its role more directly.
Study 4
Study 4 aims (1) to directly test the role of SDO and (2) to demonstrate the underlying mediating process through a focus on the upside potential (H2). To accomplish this, we measure both political identity and SDO along with self-efficacy.
Method
Participants and design
MTurk participants (N = 450; 52% female; Mage = 37.91 years) completed the same tasks as Study 2a. After the investment task scenario, participants completed measures of their focus on the upside potential (i.e., the proposed mediator), SDO, political identity, self-efficacy, and demographics.
Financial risk taking
As in Studies 2a and 3, participants rated their preference for investing in the stock fund (vs. the bank account) using an 11-point scale (1 = “definitely will not invest in the stock fund,” and 11 = “definitely will invest in the stock fund”).
Focus on upside versus downside potential
Participants rated the importance of six items in their financial decision task (1 = “not at all important,” and 7 = “extremely important”). Three items included (1) increasing possible gains, (2) maximizing potential gains, and (3) achieving potential gains. We averaged these items to compute a measure of participants’ focus on the upside potential (α = .95). The final three items included (4) decreasing possible losses, (5) minimizing potential losses, and (6) avoiding the downside. We averaged these to compute participants’ focus on the downside potential (α = .96).
SDO
We measured SDO using a 16-item scale (1 = “strongly disagree,” and 7 = “strongly agree”; see Ho et al. 2015), where higher scores indicate higher SDO (see Web Appendix C; α = .95).
Political identity
We used two measures to asses political identity: (1) news media preference (0 = Fox News, 1 = CNN/MSNBC), as in Studies 2a and 2b, and (2) self-reported political identity (1 = “strongly conservative,” and 7 = “strongly liberal”). The results we report are for media preference, but they are also replicated using self-reported political identity (see Web Appendix F).
Self-efficacy
We used two items to asses self-efficacy: (1) “I generally have the ability to handle whatever comes my way in life,” and (2) “I feel confident in my ability to cope with important changes in my life” (r = .88).
Results
Main analysis
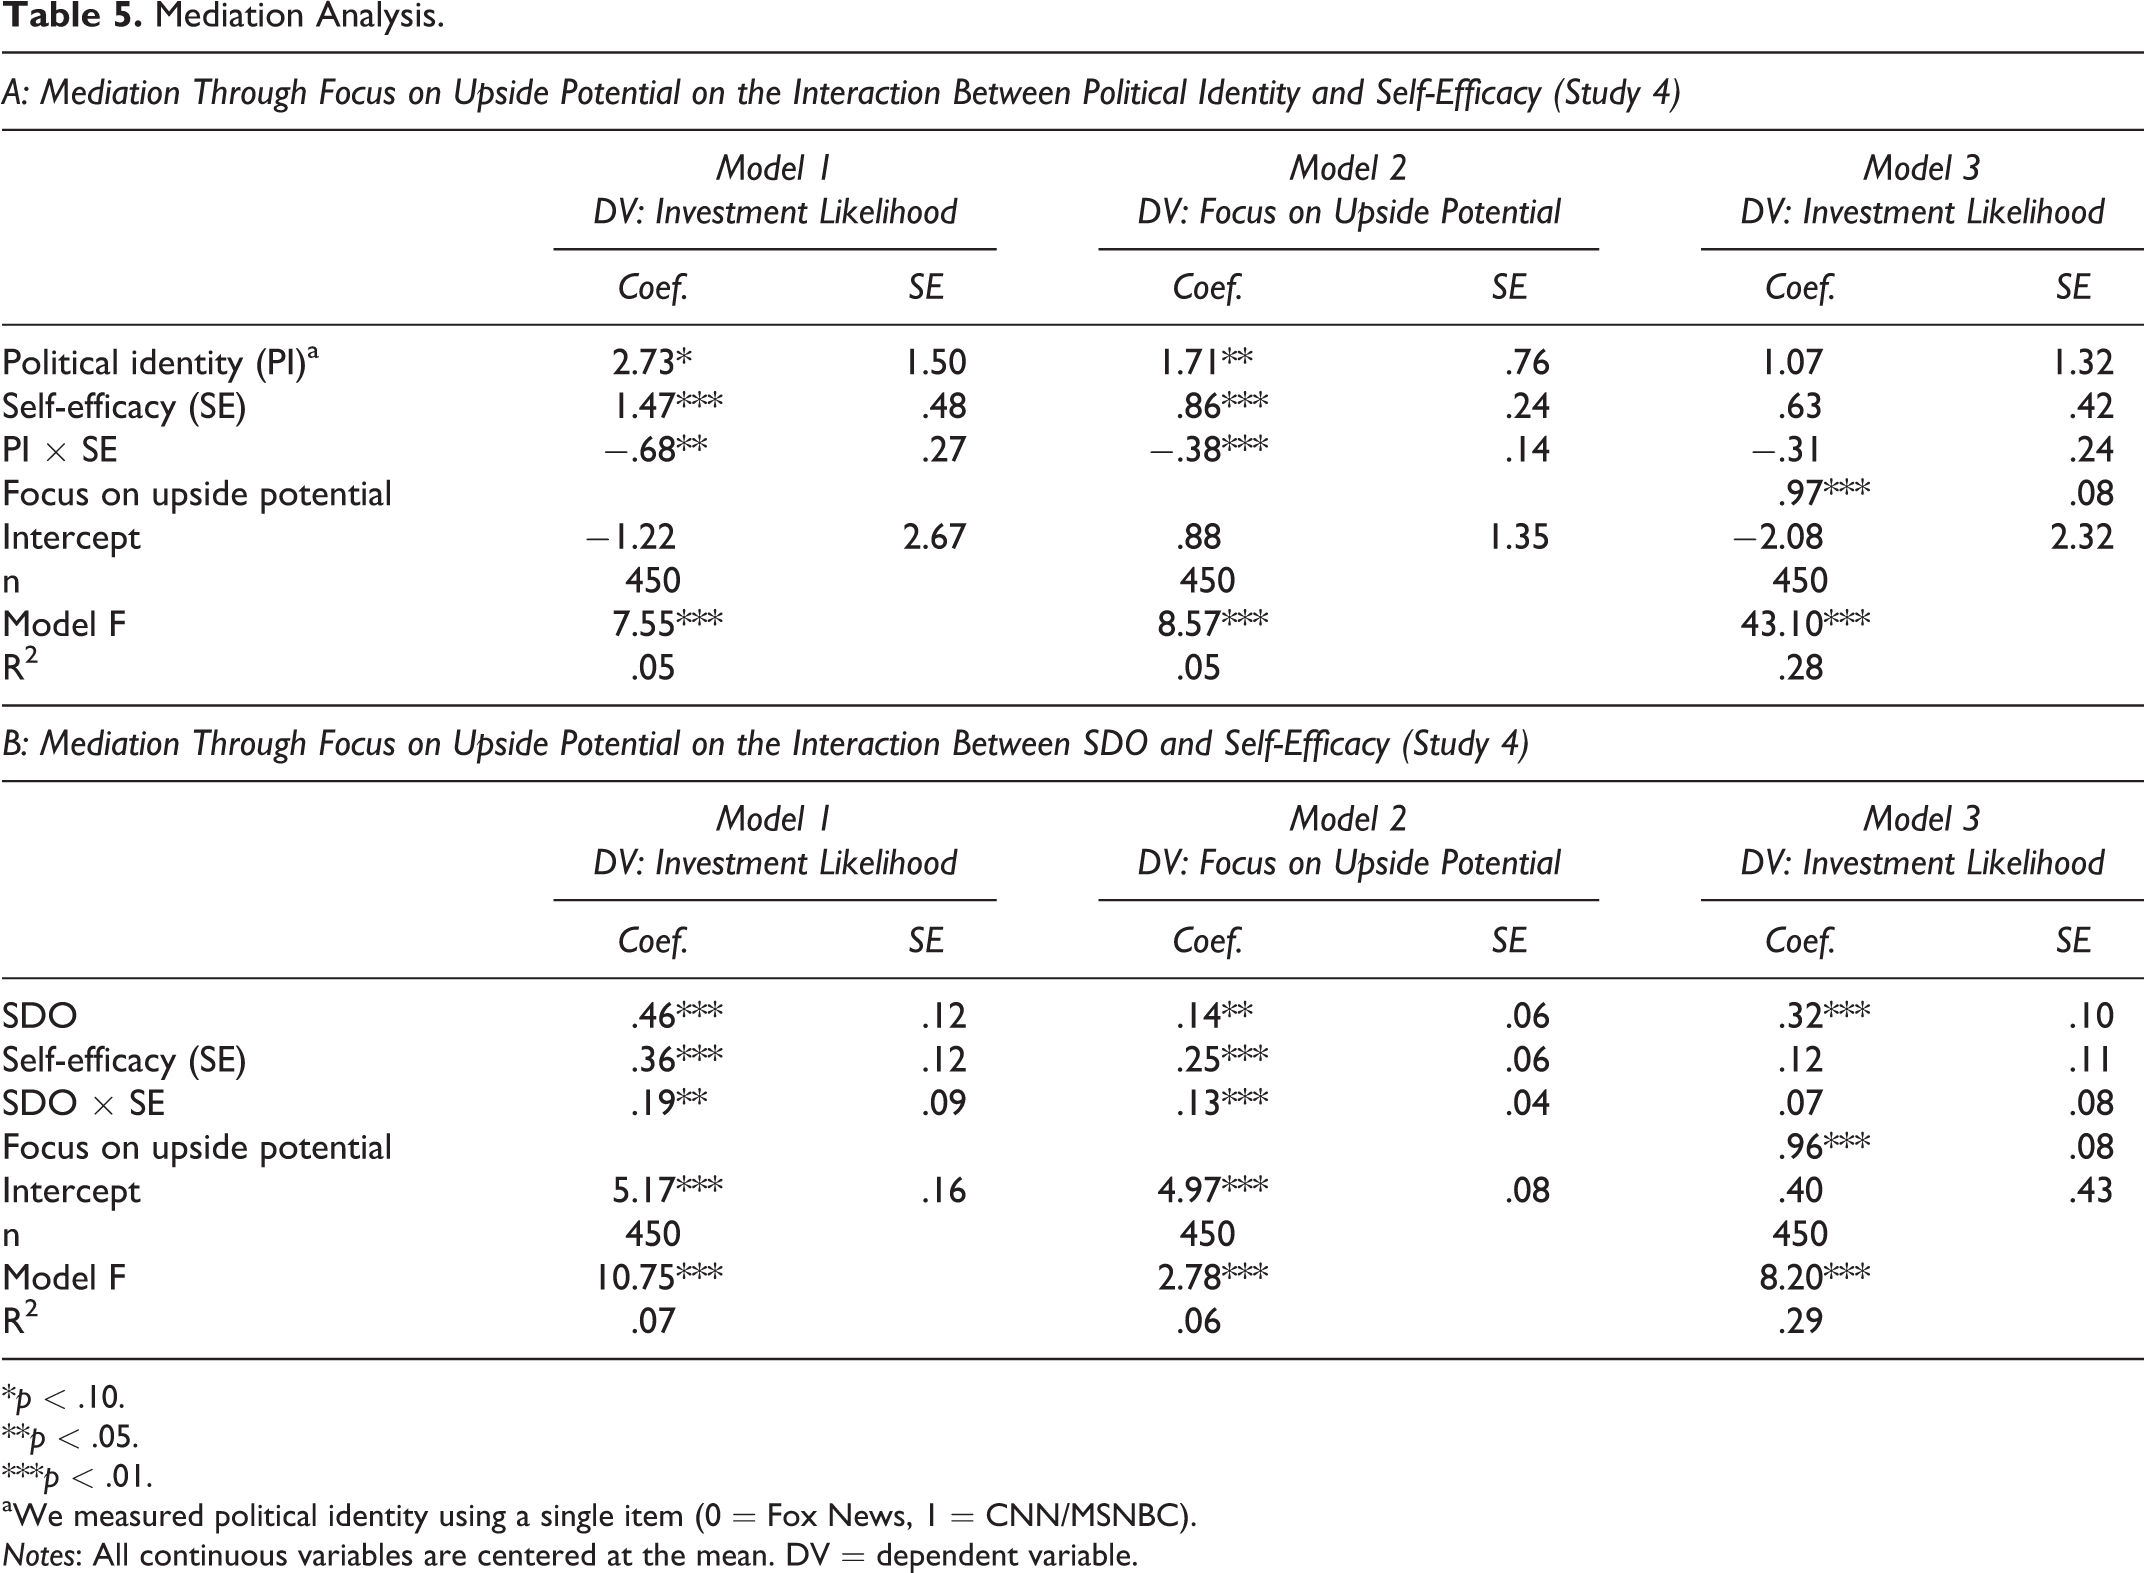
We ran two separate models: one with political identity as a predictor and one with SDO as a predictor. We report the results in Model 1 of Table 5, Panels A and B, and in Figure 7. In the first model, the two-way interaction between political identity and self-efficacy was statistically significant (β = −.68, p < .05). A simple-slopes test shows that financial risk taking increased with self-efficacy among conservatives (β = .79, p < .01) but not among liberals (β = .12, p > .10). The second model used SDO instead of political identity. The interaction of SDO and self-efficacy was significant (β = .19, p < .05). A simple-slopes test shows that the financial risk taking of high-SDO participants (+1 SD) increased with self-efficacy (β = .62, p < .01), while the financial risk taking of low-SDO participants (–1 SD) was invariant to self-efficacy (β = .11, p > .10).
Mediation Analysis.
*p < .10.
**p < .05.
***p < .01.
aWe measured political identity using a single item (0 = Fox News, 1 = CNN/MSNBC).
Notes: All continuous variables are centered at the mean. DV = dependent variable.

The interactive effect of political identity/SDO and self-efficacy on financial risk taking (Study 4).
The mediating role of a focus on the upside potential (H2)
H2 posits that the interactive effect of political identity and self-efficacy on financial risk taking is mediated by a focus on the upside potential among conservatives but not among liberals. We conducted a moderated mediation analysis using the PROCESS macro (Hayes 2013, Model 8). The results from 5,000 bootstrapped samples indicate that the interaction had a significant indirect effect on financial risk taking through participants’ focus on the upside potential (ab = −.37, 95% CI = [−.64, −.10]). We examined the indirect effects separately. Among conservatives, mediation through a focus on the upside potential was statistically significant (ab = .47, 95% CI = [.25, .70]), but mediation was not significant among liberals (ab = .10, 95% CI = [−.05, .25]). Figure 8 summarizes these results.
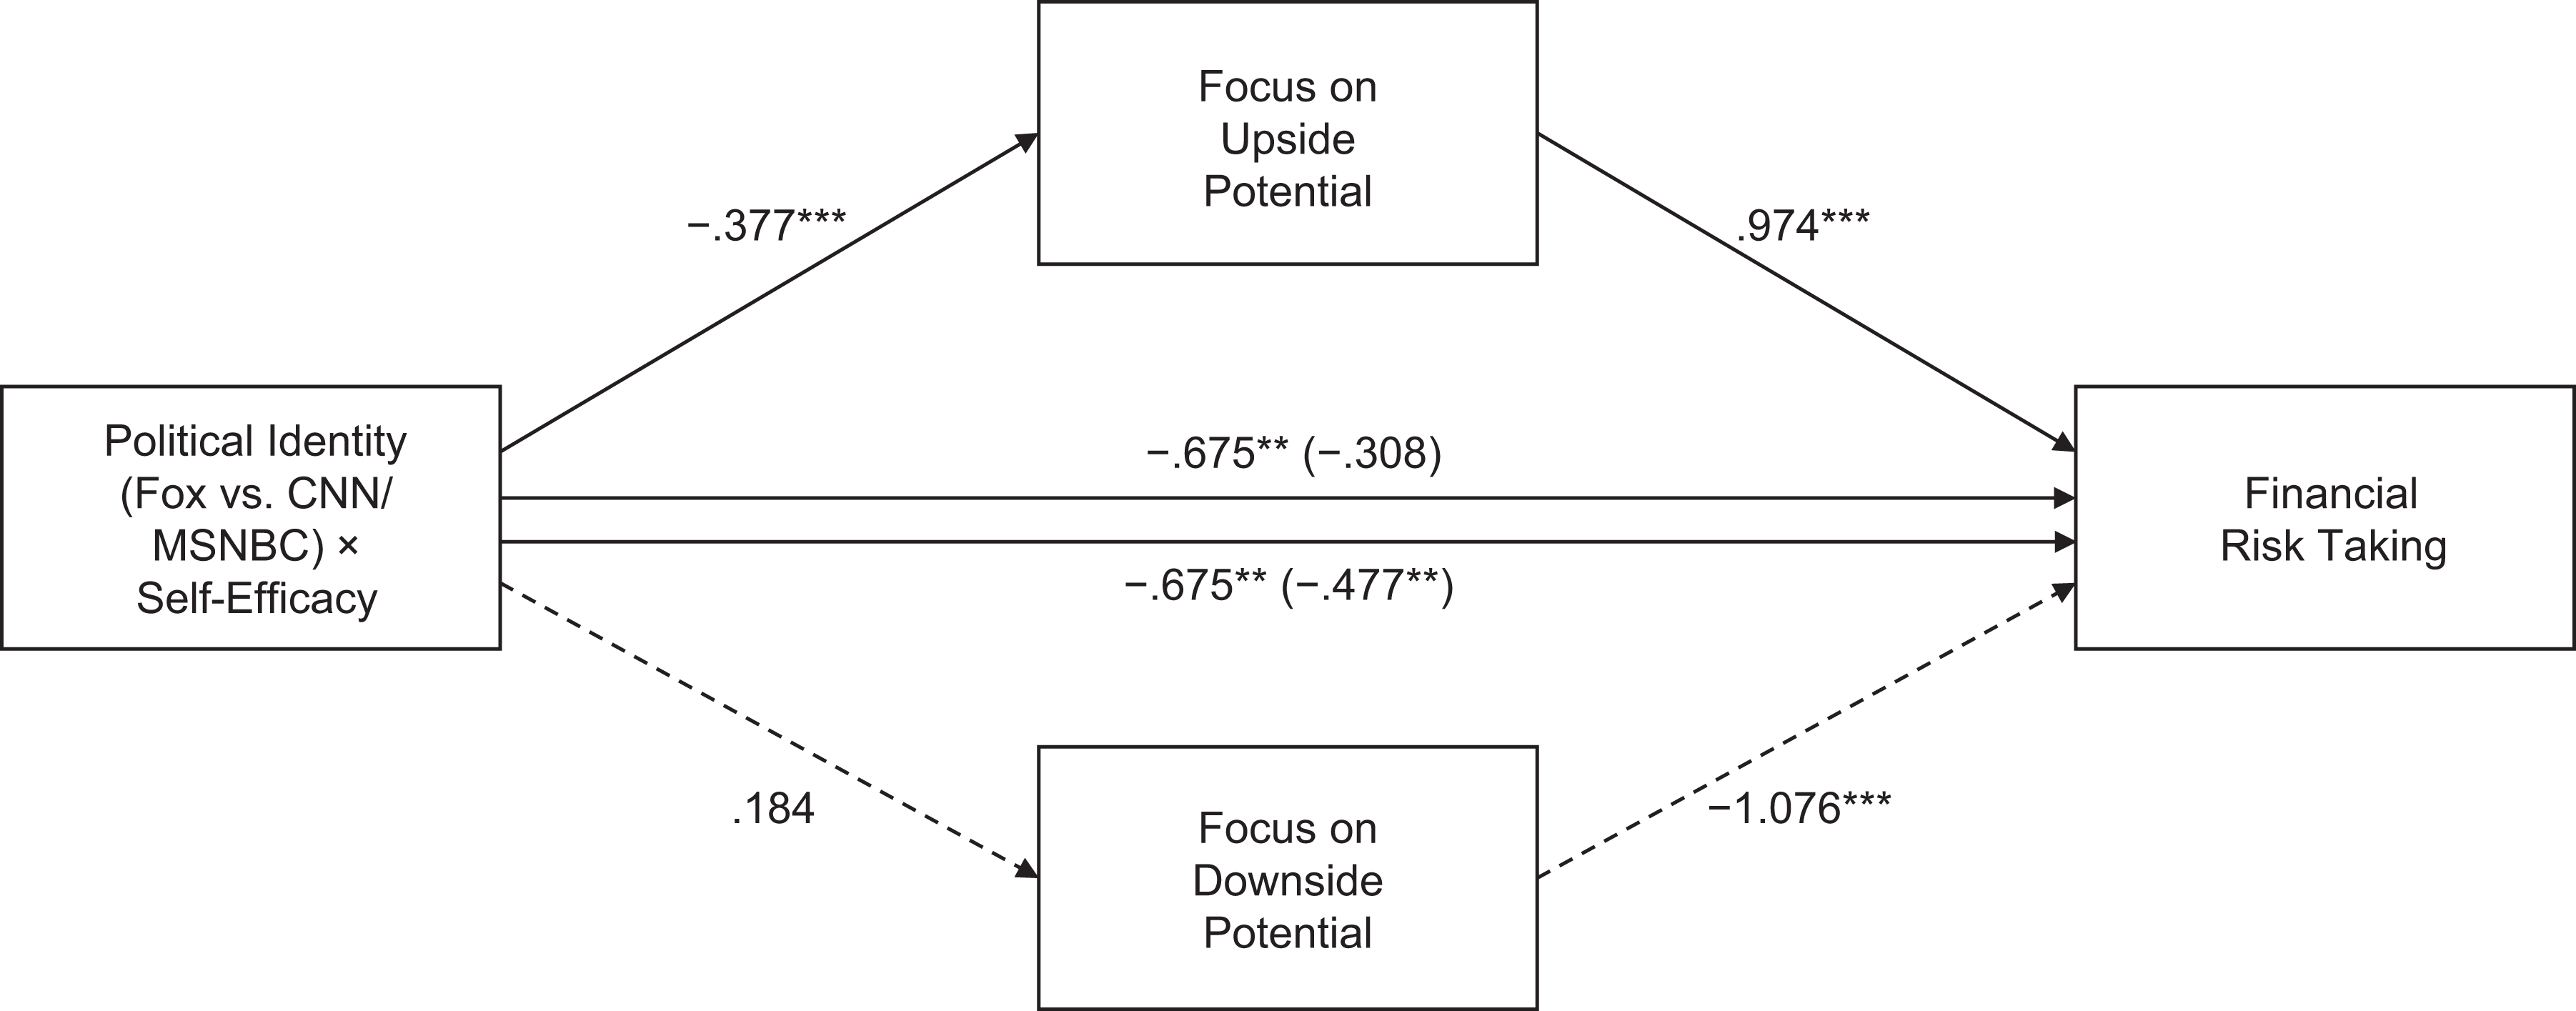
Mediation analysis: Fox News versus CNN/MSNBC × self-efficacy (Study 4).
Next, we replicated this analysis with SDO as the predictor. The interactive effect between SDO and self-efficacy on financial risk taking was mediated by a focus on the upside potential (ab = .12, 95% CI = [.05, .21]). Furthermore, mediation through a focus on the upside potential was significant among high-SDO participants (ab = .41, 95% CI = [.25, .56]) but not among low-SDO participants (ab = .07, 95% CI = [−.09, .24]).
Both moderated-mediation analyses provide consistent results. Self-efficacy increased financial risk taking among conservatives and high-SDO individuals through a focus on the upside potential. Among liberals and low-SDO individuals, there was no mediation through a focus on the upside potential. 7
Focus on the downside potential
Consistent with our theory, a focus on the downside potential did not mediate the joint effect of (1) political identity and self-efficacy (abpol identity = −.02, 95% CI = [−.10, .06]) or (2) SDO and self-efficacy (abSDO = .04, 95% CI = [−.06, .12]) on financial risk taking.
Discussion
In addition to confirming H1 using SDO and political identity, Study 4 also tests the underlying mediation process. Specifically, the joint effect of political identity and self-efficacy on financial risk taking is mediated through an increased focus on the upside potential of a financial decision.
Study 5
Prior research has shown that conservative managers take fewer risks than liberal managers (Christensen et al. 2015; Hutton, Jiang, and Kumar 2014; Kashmiri and Mahajan 2017). Yet these studies do not test the moderating role of self-efficacy. The goal of Study 5, therefore, is to ascertain whether the moderating role of self-efficacy can be replicated at the managerial level.
Data
Our firm-level data set had three sources. First, for each firm, the Center for Responsive Politics (http://www.opensecrets.org/) provided political contributions data. These data are based on Federal Election Commission records; since 1979 individuals have been required to report contributions of more than $200 to election campaigns. Second, we used Compustat to obtain firm-level information. Third, we obtained information on each firm’s executives from the Compustat ExecuComp database. We matched the contributors’ first name, last name, and employer (i.e., firm name) in the Federal Election Commission data set to those in the ExecuComp data set to measure political donations by firms’ executives.
Measure of Variables
Financial risk taking
At the firm level, we used three measures of risk taking: Research and development (R&D), a key marketing-relevant activity (Hauser, Tellis, and Griffin 2006), can measure a firm’s financial risk taking. We measured a firm’s R&D intensity as the ratio of R&D expenditures to sales. We computed variability in return on assets (ROA), a widely used measure of financial risk taking (Miller and Bromiley 1990), as the variance in ROA for the previous five years. Financial leverage reflects managers’ tendency to take risks (Singh 1986). We measured financial leverage as the ratio of long-term debt and debt in current liabilities to total assets.
Political identity
Following Christensen et al. (2015), we measured the political identities of a firm’s management as the difference between executives’ contributions to the Democratic Party and contributions to the Republican Party and then dividing this value by the total contributions to both parties. 8 This measure ranged between –1 and 1, such that a value closer to 1 (–1) indicates that the firm’s management is characterized as more politically liberal (conservative).
Self-efficacy
Prior research has measured managers’ self-efficacy as the level of past performance relative to a reference point (Cervone and Peake 1986; Hayward and Hambrick 1997). He, Inman, and Mittal (2008) measure self-efficacy of competitors in a game show using the number of their past correct answers.
We use the firm’s financial performance relative to its peers (i.e., competitors operating in the same industry based on four-digit Standard Industrial Classification codes) to measure the level of self-efficacy of a firm’s management. 9 Following prior research (Miller and Chen 2004), we used ROA to measure firm performance in the current period (ROAt) and industry-median performance in the previous period (industry median ROAt − 1) to measure the firm’s reference point. Their difference (ROAt − industry median ROAt − 1) reflects firm-level self-efficacy.
Control variables
Firm-specific and industry-specific controls include the firm’s ROA, liquidity, financial leverage, operating leverage, and size, as well as industry concentration (for details, see Table B2 in Web Appendix B). 10
Method
We ran a series of diagnostic tests for each dependent variable because of the time-series cross-sectional data set. First, the Breusch–Pagan test rejected the null hypothesis of homoskedastic errors for all dependent measures (ps < .01). Second, the Wooldridge test confirmed the presence of serial correlation for all dependent measures (ps < .01). Third, to test whether there were any unobserved effects at the firm and industry level, we conducted a likelihood ratio test comparing a model with firm and industry random effects and a model with no random effects. For all dependent variables, the test rejected the null hypothesis of no unobserved effects (ps < .01). Accounting for these issues, we specified our model as follows. For firm i in industry j at time t,

where
We lagged all independent variables by one period relative to the dependent variable. Among all models, the maximum variance inflation factor was 5.673, and the highest condition number was 10.506, indicating that multicollinearity is not an issue.
Results
The results are based on a final sample of 13,655–23,847 firm-year observations, depending on the dependent measure, for 22 years (i.e., 1994–2015). Table 6 shows the descriptive statistics and correlation matrix of the variables.
Descriptive Statistics and Correlation Matrix (Study 5).

Notes: Correlations significant at p < .05 are in bold.
Table 7 shows that the two-way interaction between political identity and self-efficacy is statistically significant for all three measures: R&D intensity (β = −.51, p < .01), ROA variability (β = −.02, p < .01), and financial leverage (β = −.01, p < .01). We plot these results in Figure 9.
The Impact of Political Identity and Self-Efficacy on Firm Financial Risk Taking (Study 5).

*p < .10.
**p < .05.
***p < .01.
Notes: All continuous variables are centered at the mean.
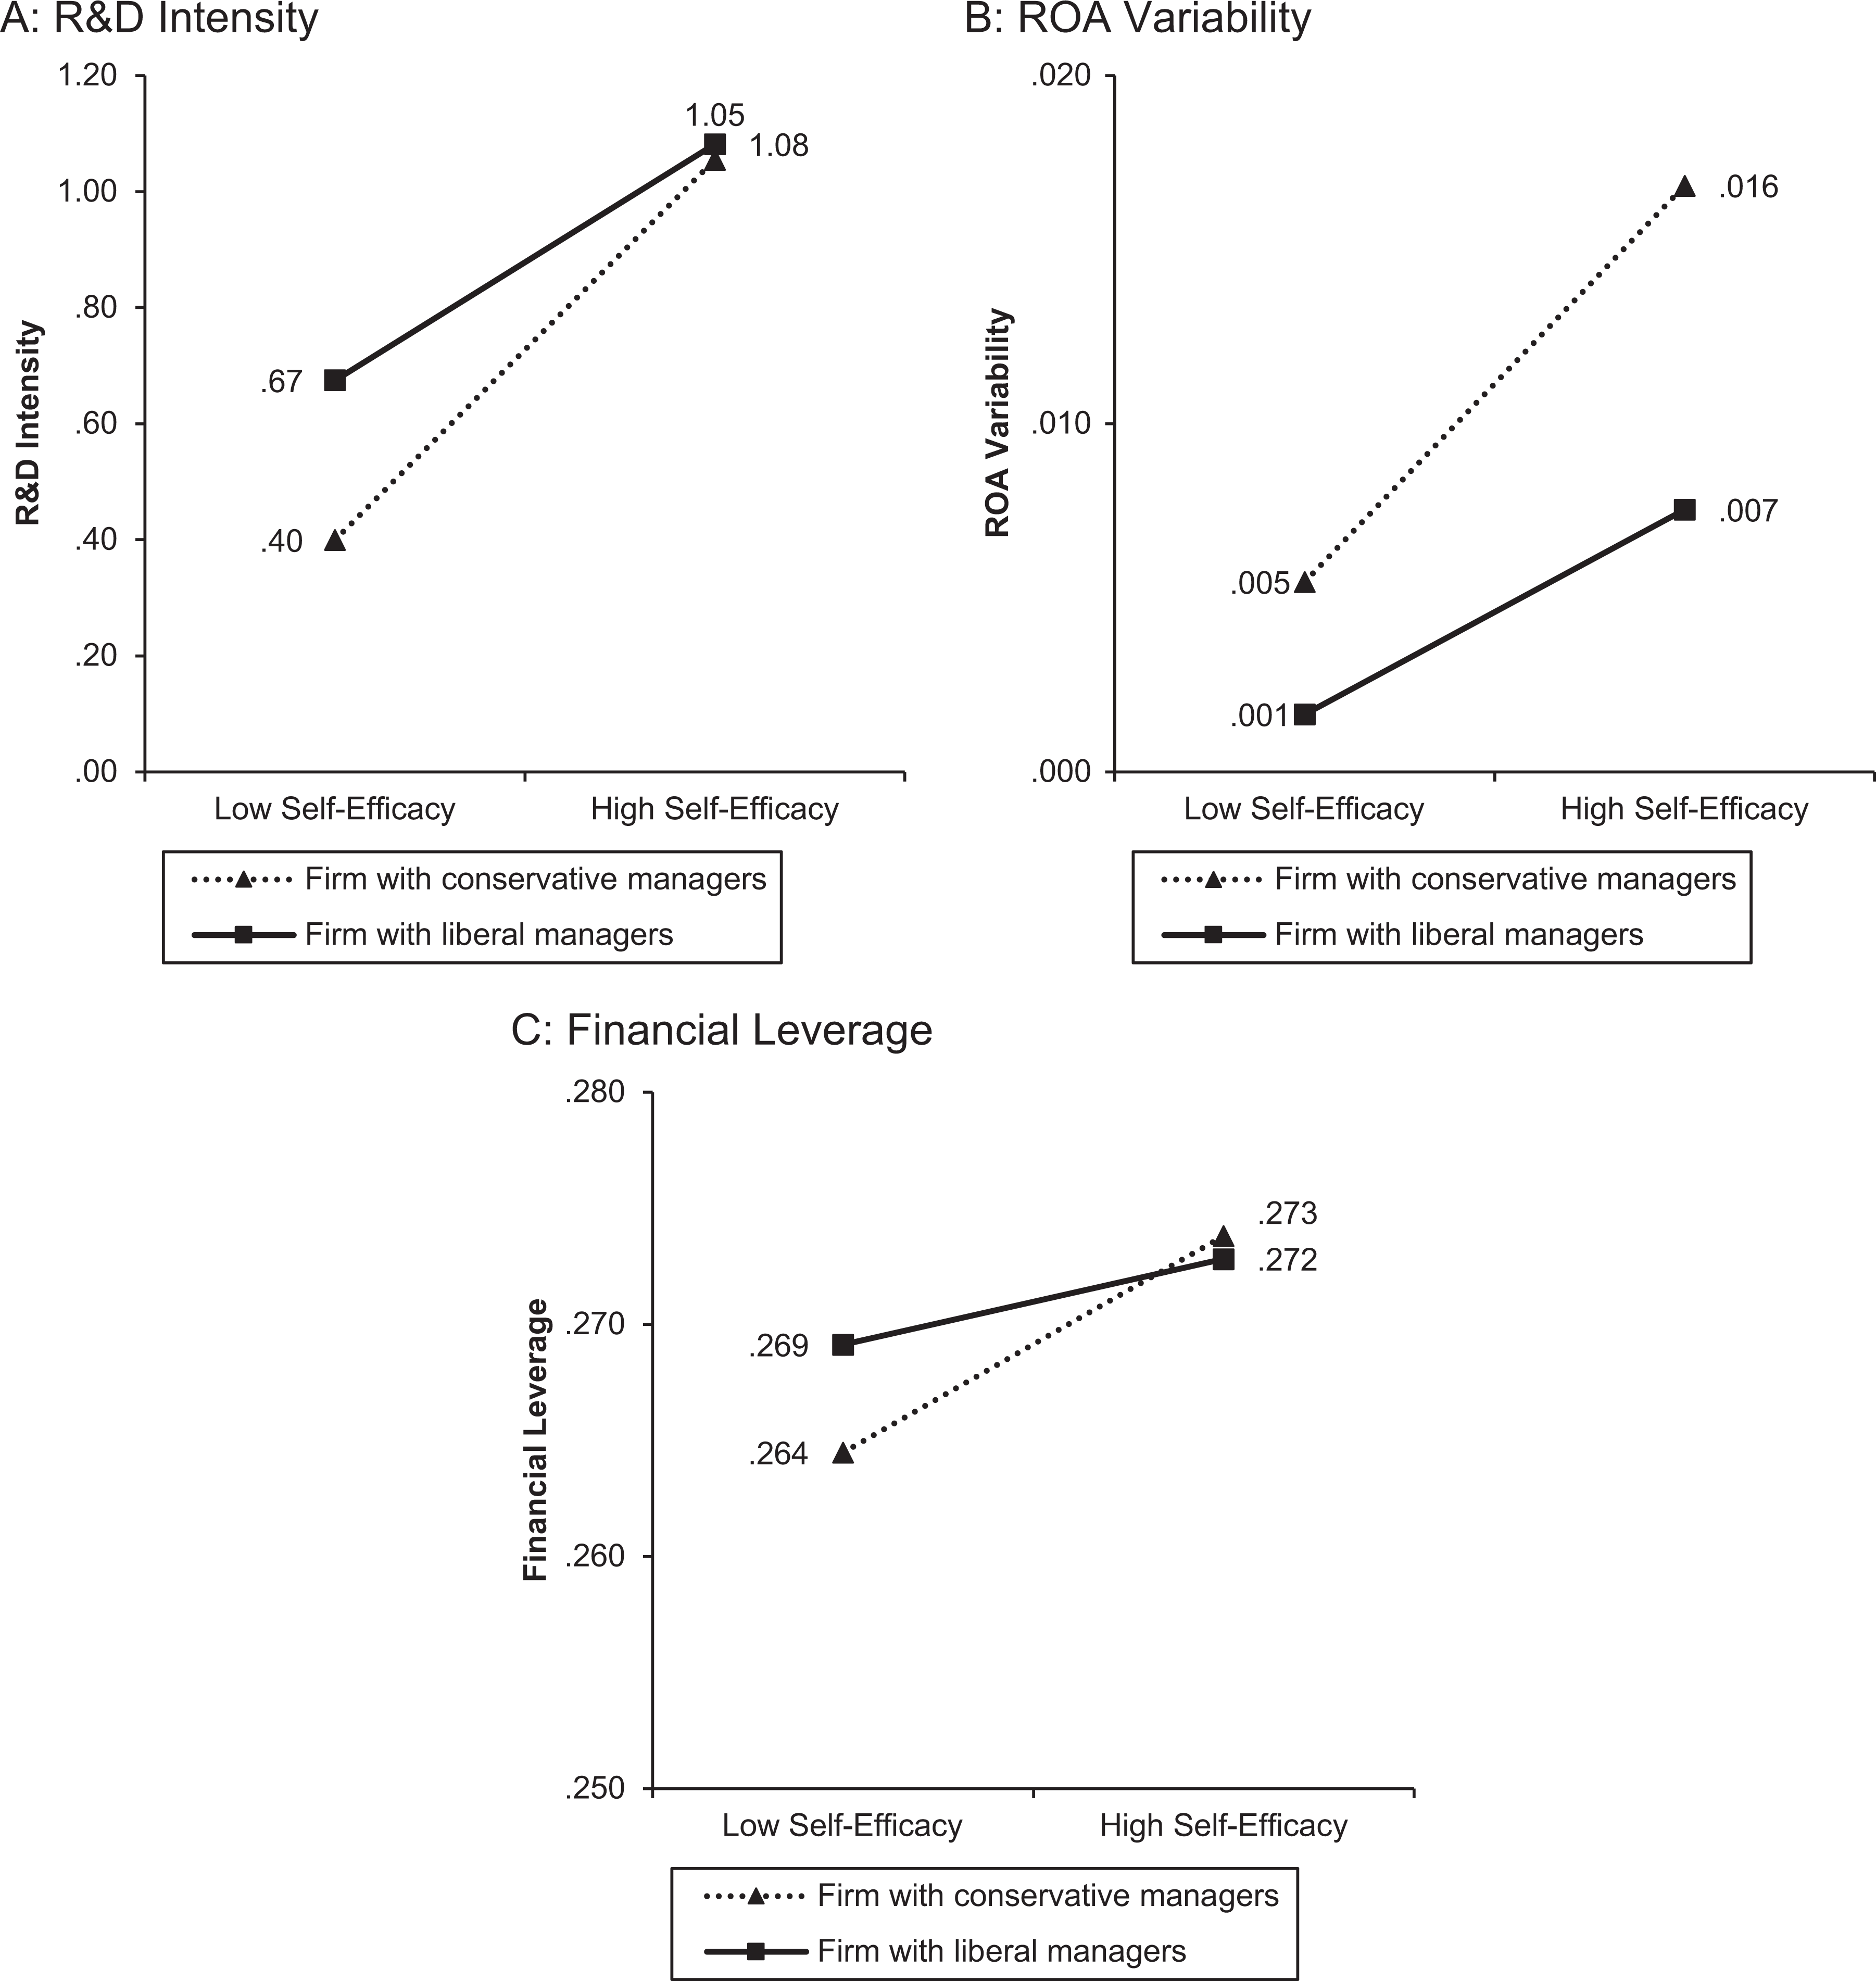
The interactive effect of political identity and self-efficacy on financial risk taking by firm managers (Study 5).
R&D intensity
R&D intensity increased when management had higher self-efficacy for firms run by conservative managers (β = 1.92, p < .01) but not for firms run by liberal managers (β = 1.19, p > .05).
ROA variability
ROA variability increased when management had higher self-efficacy for firms run by conservative managers (β = .04, p < .01) but not for firms run by liberal managers (β = .02, p > .05).
Financial leverage
Financial leverage increased when management had higher self-efficacy for firms run by conservative managers (β = .03, p < .05) but not for firms run by liberal managers (β = .01, p > .10).
Discussion
In a managerial context, the results of Study 5 fully support H1 for the three dependent measures of firm financial risk taking (i.e., R&D intensity, ROA variability, and financial leverage). These results provide additional insights into managerially oriented studies that only show a main effect of political identity, whereby conservative managers are less risk taking than liberal managers. Similar to the results at the individual level, the moderating role of self-efficacy at the firm level suggests that a contingent approach should be used to examine the role of political identity in firm-level risk taking and other financial decisions.
General Discussion
Building on the notion that conservatives are generally higher in SDO, we theoretically articulate the moderating role of self-efficacy in financial risk taking and the mediating role of conservatives’ focus on the upside potential. Six studies consistently show that the association between political identity and financial risk taking grows stronger with higher self-efficacy for conservatives but is invariant among liberals. Furthermore, conservatives’ focus on the upside potential of a decision mediates this interaction.
Table 8 summarizes the studies. We measure political identity as people’s self-reported political identity (Studies 2a and 4), preferred cable news station (Studies 2a, 2b, and 4), contributions to political parties (Study 5), voting behavior (Studies 1 and 2a), and party affiliation (Study 2a), as well as through a multi-item scale (Study 2a). Study 3 manipulates political identity. We measure SDO in Study 4 and replicate the results for political identity using SDO. We measure self-efficacy using a general self-efficacy scale (Studies 2b and 4) and a behavioral measure specific to relative financial performance (i.e., Studies 1 and 5); we also manipulate self-efficacy using a feedback task (Study 2a) and past performance (Study 3). We assess financial risk taking in different ways: investments in different financial products (Studies 2a, 3, and 4) and choice among existing financial products (Study 2b); households’ holdings of risky assets (Study 1); and firms’ R&D intensity, ROA variability, and financial leverage (Study 5). We use individual-level data (Studies 2a–4), household-level data (Study 1), and firm-level data (Study 5) to test our hypotheses. Reassuringly, as Table 8 shows, all these studies show convergent results.
Summary of Effects (Studies 1–5).

aStocks, bonds, mutual funds, and other securities.
bThese studies are described in Web Appendices G and H.
Notes: Numbers in each cell represent mean values. Except for Studies 2a and 3, we calculated all means based on ±1 standard deviation of political identity and self-efficacy. Studies G and H are not reported in the text of the current article. DV = dependent variable.
The data also reveal some noteworthy patterns that should be examined in future research. Specifically, high-self-efficacy conservatives showed higher financial risk taking than liberals and low-self-efficacy conservatives in Studies 2b, 3, and 4; at the same time, Studies 1 and 5 show that high-self-efficacy conservatives were equal to liberals in their risk taking. A possible explanation may be that Studies 1 and 5 measure self-efficacy on the basis of past performance, whereas the other studies use self-reported scales. More generally, these results suggest a more nuanced approach to understanding self-efficacy in the context of financial decision making. These results also suggest that conclusions based on direct comparisons between liberals and conservatives should be tempered in light of potential moderators.
Theoretical Contributions
To the rich and emerging body of research examining the implications of consumers’ political identity (Fernandes and Mandel 2014; Khan, Misra, and Singh 2013; Kidwell, Farmer, and Hardesty 2013; Ordabayeva and Fernandes 2018; Winterich, Zhang, and Mittal 2012), our primary contributions are in situating SDO as a theoretical lens for explaining the effect of political identity, specifying self-efficacy as a moderator of the observed effect, identifying the upside potential of a decision as a mediator of the observed effect, and resolving previously inconsistent findings in the literature on political identity and financial risk taking.
By examining the effect of political identity as a contingent effect, our research sheds light on contradictory results found in previous studies. Most firm-level studies (Christensen et al. 2015; Hutton, Jiang, and Kumar 2014) that find lower financial risk seeking among conservative managers have examined only main effects. However, after we consider the moderating role of self-efficacy, Study 5 uses firm-level data to replicate the results from studies using individual-level data. In terms of the main effect of political identity, the three financial risk-taking measures in Study 5 exhibit different patterns of main effects. For ROA variability, firms operated by conservative (vs. liberal) managers are more risk taking, whereas for R&D intensity and financial leverage, firms operated by conservatives and liberals exhibited similar levels of risk taking. However, the theoretically interesting and managerially relevant finding—consistent across all three measures—is the moderating role of self-efficacy: with an increase in self-efficacy, financial risk taking increases at a faster rate among conservative managers than among liberal managers. If the moderating role of self-efficacy was ignored, the association between political identity and risk taking would have been interpreted as mixed. Although we obtain consistent results among individuals and firms, more research examining differences in risk taking among individual- and managerial-level decision makers is needed.
The SDO construct deserves further research. We believe that SDO can explain conservatives’ focus on the upside potential of a decision, especially when they hold a relatively high sense of self-efficacy. While we do not fully understand liberals’ motivation in the financial risk-taking process, this gap provides an important area for future research. Specifically, the asymmetric finding—that is, conservatives’ high SDO increases financial risk taking through their focus on the upside potential, while liberals’ low SDO is irrelevant with respect to their focus on the downside potential—needs to be unpacked further. More generally, there is a need to theoretically and empirically understand the role of SDO in relation to other identities in general (e.g., gender, social status) and other hierarchy-enhancing legitimizing identities in particular (e.g., power distance). From a research perspective, it would be useful to understand the common and unique aspects of SDO relative to other constructs such as agentic/communal orientation (He, Inman, and Mittal 2008), which may provide underlying explanations for observed differences based on political, gender and other identities.
Recently, Jost, Langer, and Singh (2017) have suggested psychological correlates of political identity that may be correlated with consumer complaining, boycotting, and disputing. They argue that liberals are more likely to engage in such behaviors because they are more tolerant of uncertainty, insecurity, and social discord. Yet the specific role played by a person’s SDO in such behaviors remains unexamined. It could be that conservatives with higher self-efficacy are also more likely to complain because of a higher belief of having complaints resolved in their favor. Thus, a more nuanced approach based on SDO and political identity could be possible.
Another potential research avenue is to explore whether and how SDO operates in other domains, such as health risk and social risk, and with respect to other consumer behaviors such as donations, food consumption, and branding. Even within the narrow domain of financial risk taking, we concur with Choma et al.’s (2013) suggestion that financial risk taking is likely a function of several underlying motives related to particular types of goals embedded in a person’s SDO. While we have shown that a focus on the upside potential of decisions is one such mechanism, there are likely additional mechanisms that can be uncovered and examined in further research.
Practical Implications
At the most basic level, marketing managers can segment customers on the basis of their political identity and SDO through observable factors such as media consumption and geographic location. As Table 1 shows, consumers’ state of residence provides a reliable measure of SDO and political identity; however, SDO may be more useful than political identity for understanding consumers’ motivations and behaviors, as SDO is likely to be related to a variety of other identities as well. Managers can also measure consumers’ self-efficacy directly, using a simple scale, or indirectly, drawing on their past portfolio performance. From the results of such an assessment, consumer training, products, and services can be designed to help consumers optimize their financial goals. However, we do not provide any guidance about an optimal risk-taking level, which is likely to vary on the basis of each person’s unique situation.
Our measures of political identity—party affiliation, preferred cable news station, and state of residence—may be used to better identify customers with a specific political identity and SDO and then tailor products and services accordingly. Companies can use our simple manipulation task (Study 3) to prime political identity and influence consumers’ risk-taking tendencies.
Limitations
Our study was subject to several limitations. First, we had to use state-level voting behaviors as a proxy of individuals’ political orientation (Study 1). Although this aggregate-level measure has been used in previous research, and although we validated it through a pretest, it is not without its limitations. In a similar vein, Study 5 measured all the constructs at the firm level. As such, methodologies to simultaneously measure political identity and SDO at the individual and firm levels are needed.
Second, there is a need to test different measures of political identity to improve the validity of their predictive and statistical conclusions. Although we have shown a consistent pattern of results by adopting various and actionable indicators of political identity, our results with different measures are not uniformly strong. Some observed effects in Study 2a were only marginal or directional. For example, the measure of political identity based on media preference for Fox News versus CNN/MSNBC (in Studies 2a, 2b, and 4) may be improved by including additional broadcasting outlets. Despite being highly correlated, each measure of political identity may have advantages and disadvantages in specific situations. Thus, a comparative study measuring their relative costs and benefits would be useful. Research is also needed to explore the dimensionality of political identity. Thus, there may be separate dimensions—for example, fiscal and social—to political identity that require further exploration.
Supplemental Material
Supplemental Material, 813331_web_appendix - Political Identity and Financial Risk Taking: Insights from Social Dominance Orientation
Supplemental Material, 813331_web_appendix for Political Identity and Financial Risk Taking: Insights from Social Dominance Orientation by Kyuhong Han, Jihye Jung, Vikas Mittal, Jinyong Daniel Zyung and Hajo Adam in Journal of Marketing Research
Footnotes
Associate Editor
Susan Broniarczyk served as associate editor for this article.
Declaration of Conflicting Interests
The author(s) declared no potential conflicts of interest with respect to the research, authorship, and/or publication of this article.
Funding
The author(s) received no financial support for the research, authorship, and/or publication of this article.
Notes
References
Supplementary Material
Please find the following supplemental material available below.
For Open Access articles published under a Creative Commons License, all supplemental material carries the same license as the article it is associated with.
For non-Open Access articles published, all supplemental material carries a non-exclusive license, and permission requests for re-use of supplemental material or any part of supplemental material shall be sent directly to the copyright owner as specified in the copyright notice associated with the article.