
Abstract
In emerging markets, the effective implementation of distribution strategies is challenged by underdeveloped road infrastructure and a low penetration of retail stores that are insufficient in meeting customer needs. In addition, products are typically distributed in multiple forms through multiple retail channels. Given the competitive landscape, manufacturers’ distribution strategies should be based on anticipation of competitor reactions. Accordingly, the authors develop a manufacturer-level competition model to study the distribution and price decisions of insecticide manufacturers competing across multiple product forms and retail channels. Their study shows that both consumer preferences and estimated production and distribution costs vary across brands, product forms, and retail channels; that ignoring distribution and solely focusing on price competition results in up to a 55% overestimation of manufacturer profit margins; and that observed pricing and distribution patterns support competition rather than collusion among manufacturers. Through counterfactual studies, the authors find that manufacturers respond to decreases in distribution costs and to the exclusive distribution of more preferred manufacturers by asymmetrically changing their price and distribution decisions across different retail channels.
Keywords
In most product markets, manufacturers rely heavily on independently owned retail distribution channels to reach their customers. For example, in the United States in 2016, there were about 3.8 million retailers whose total retail sales were approximately $2.6 trillion (SelectUSA 2019). In India, there are currently over 14 million retail stores, whose total retail sales are expected to reach $.95 trillion in 2018 (compared with $.5 trillion in 2013; KPMG 2014). Due to the size and growth of retail sales, product manufacturers consistently make significant monetary efforts to manage their retail distribution channels to make their products accessible and, ultimately, to achieve profitability (Warehousing and Fulfillment 2017). For example, in India, manufacturers’ cost of retail distribution can be as high as 18%–25% of their total sales (Mukherjee et al. 2013). Given the importance of retail distribution for sales, the development of appropriate retail distribution strategies has attained significant importance in the marketing literature (Cao and Li 2015; Kumar, Sunder, and Sharma 2015; Padmanabhan and Png 1997; Sharma and Mehrotra 2007; Trivedi 1998).
Even though retail distribution is important for product manufacturers to satisfy their customers’ needs and ultimately achieve profitability, it is challenging for manufacturers to effectively manage the distribution of their products for a number of reasons. First of all, manufacturers typically manage multiple retail channels that differ in terms of their sizes, target markets, and effectiveness in selling products (Dawar and Frost 1999; Venkatesan et al. 2015). In addition, customers differ in preference with respect to distribution channels depending on the availability of their preferred products in those channels and on their proximity to those channels. Second, manufacturers typically distribute their products in multiple forms (e.g., liquid, solid, frozen) to meet various customer needs (Bloch 1995; Porter and Heppelmann 2015). Thus, manufacturers 1 need to decide which product forms to distribute through how many stores in each utilized retail channel. This decision is complicated by the fact that multiple competing manufacturers distribute similar products through common retail channels. To be effective, a manufacturer’s retail distribution decisions need to incorporate its competitors’ reactions.
Manufacturers’ retail distribution decisions can be more complicated in emerging markets for multiple reasons. First, emerging markets typically feature larger underdeveloped infrastructure (e.g., a lack of highways and roads to reach different regions) and extended geographies with vastly different retail stores that are limited in number (i.e., an insufficient retail landscape) (Atsmon, Kuentz, and Seong 2012). As a result, it can be difficult for manufacturers to effectively access each of these regions and sales territories through retail distribution (Roberts, Kayande, and Srivastava 2015; Sheth 2011). Second, customers’ price sensitivities and preferences toward products have changed widely due to economic liberalization, which has increased the buying power of households in these markets. As a result, even households at the lowest income levels have begun to be able to afford a large variety of products (Gingrich 1999). As such, manufacturers have introduced several product forms to serve various customer needs. However, because of the aforementioned challenges (underdeveloped infrastructure and insufficient retail landscape), manufacturers have difficulties meeting customers’ needs. Third, the penetration of retail distribution is quite low in emerging markets (Mulky 2013). For example, India has the highest number of retail outlets (with an average size of 50–100 square feet) worldwide, even though the per capita retail space is the lowest in the world (Pick and Müller 2011). As such, the demand for retail distribution space in India is expected to increase at the rate of 81% in 2018 (India Brand Equity Foundation 2018). Similarly, China’s trade through retail distribution increased by 9.7% in 2018 over the previous year (Research and Markets 2018). Such growth trends in emerging markets create opportunities for firms to increase profitability through appropriate penetration of retail channels. Fourth, manufacturers typically consider retail distribution as a utilitarian task (Gingrich 1999). This commonly results in a retail distribution mechanism that is poorly aligned with customer and market needs (Mulky 2013; Sheth 2011). To overcome all of these challenges specific to emerging markets, emerging-market manufacturers need to develop effective retail distribution strategies. In addition, due to the significant growth of emerging economies, multiple firms have ventured into these markets, and therefore the competitive intensity across product forms and retail channels has changed (Gingrich 1999). This requires understanding retail distribution from a competition perspective to maximize profits.
Although analysis of firm competition, in terms of price, has received considerable attention in the marketing literature, especially in the developed-market context (Karray and Martín-Herrán 2009; Sudhir 2001a; Vilcassim, Kadiyali, and Chintagunta 1999), to the best of our knowledge, no study has modeled emerging-market firms’ competition in retail distribution. As discussed previously, because firms typically sell products in multiple forms (e.g., liquid vs. solid soap) through various retail channels (e.g., mom-and-pop stores vs. big-box stores such as Big Bazaar), firms’ retail distribution strategies should be studied at the brand, product form, and retail channel levels. Thus, in this study, we investigate firm competition in retail distribution along with price in an emerging-market setting by developing a multiproduct form and multichannel competition model.
To model emerging-market firms’ competition in distribution and price, we use data from competing insecticide manufacturers in India. In the data, we observe (1) prices at the firm and product form levels (in our setting, liquid and solid product forms); (2) retail distribution levels—or the total number of retail stores through which each firm sells their products—at the product form and retail channel levels (in our setting, paan-plus [similar to mom-and-pop stores] and general stores [small retail outlets] 2 ); and (3) unit quantity sales (at the manufacturer shipment level) at the brand, product form, and retail channel levels 3 for a period of 48 months. To estimate our supply-side competition model, we use a two-step approach. In our first step, we model the aggregate brand demand (i.e., sales) across different product forms and retail channels using a nested logit (NL) specification 4 by incorporating unobserved heterogeneity across households in the market and accounting for endogeneity (Petrin and Train 2010). In our second step, we use the estimated aggregate sales model as an input and estimate our supply-side multiproduct-form multichannel manufacturer competition model.
Our study highlights the following results. On the demand side, in terms of the intrinsic preferences, we find that the first manufacturer (Firm 1) in the study, the solid product form, and paan-plus stores are, on average, preferred to the second manufacturer (Firm 2), the liquid product form, and general stores, respectively. On the supply side, we find that the estimated costs of production (distribution) significantly differ not only across firms and product forms (and retail channels) but also over time (to a lesser extent). From our robustness checks, we first find that ignoring the effect of distribution on demand estimation significantly biases the household preference parameters (intrinsic preferences, price disutility, etc.). Furthermore, the use of the price-only demand model as an input in the supply-side equilibrium calculations leads to significantly larger profit margin inferences (up to 55%) compared with equilibrium calculations using the proposed demand model with retail distribution. Second, we find that the observed price and distribution patterns in the data support competition rather than tacit collusion among the studied emerging-market manufacturers.
Drawing on the estimation results, we use a counterfactual study to understand the effect of decreasing distribution costs (e.g., due to government construction of new highways and roads) on manufacturers’ distribution and price decisions. We find that, in equilibrium, even though firms keep their prices roughly the same, they change their distribution levels significantly as the distribution costs decrease. Specifically, we find that, as distribution costs decrease, (1) both firms increase their distribution levels in the paan-plus channel and (2) Firm 1 (Firm 2) increases (decreases) its presence in the general stores channel. Furthermore, we find that the aggregate welfares of all three parties—consumers, Firm 1, and Firm 2—increase as the distribution costs decrease.
In a second counterfactual study, we test the role of exclusive distribution on manufacturers’ price and distribution decisions. In a series of simulation studies, we allow 0% (current setting) to 20% of the market to be exclusively covered by the more preferred Firm 1 while allowing the remaining market to be served by both firms together. We find that, in equilibrium, exclusive distribution enables Firm 1 to charge higher prices, whereas Firm 2 charges roughly the same prices for both solid and liquid product forms. Regarding the distribution decisions, we find that both firms decrease (increase) their presence in the paan-plus (general) store channel. Regarding the welfares, we find that the exclusive distribution of Firm 1 benefits Firm 1 but hurts Firm 2 and the consumers. Our counterfactual studies illustrate that asymmetric brand, product form, and channel preferences, along with asymmetries in the estimated distribution costs across channels, can lead to significant differences among firms in terms of their resource allocation decisions as characteristics of the marketplace change.
The rest of the article is organized as follows. In the next section, we review the pertinent literature. We then discuss our empirical context and data, present our modeling framework and the associated estimation procedure, and provide our estimation results. We follow this with a discussion of our managerial implications through our counterfactual studies. Finally, we summarize our findings and contributions and conclude with caveats and directions for future research.
Literature Review
This study falls in the intersection of two major streams of marketing literature: distribution strategy and marketing in emerging markets. We proceed by discussing recent developments in these two streams of literature along with the research gaps that are filled by this study.
Distribution Strategy
The extant marketing literature has investigated distribution strategies from two perspectives. In the first stream of literature, studies focus on the interactions among different channel members (e.g., manufacturers, retailers, distributors). Specifically, these studies have explored conflicts among channel members (Rangan and Jaikumar 1991; Samaha, Palmatier, and Dant 2011), coordination and vertical integration of the distribution channel to align the incentives of different channel members (Anderson and Weitz 1992; Desiraju and Moorthy 1997; Frazier 1999; Gerstner and Hess 1995; Krafft et al. 2015; McGuire and Staelin 1983; Tsay and Agrawal 2004), manufacturers’ delegation of power to other channel members and its impact on channel performance (Coughlan and Wernerfelt 1989), negotiations among channel members (in terms of sharing the channel profit) and their impact on channel players’ long-term relationships (Srivastava, Chakravarti, and Rapoport 2000), and the effect of relational history on channel members’ performance (Geyskens, Steenkamp, and Kumar 1999). We note that our study does not fall into this stream of literature because we do not model manufacturers’ relationships with the other channel members (i.e., paan-plus and general stores). This is because (1) the retailers in our setting are small and have limited power relative to manufacturers and (2) data regarding the interactions among manufacturers and retail stores, as well as sales at the retail store level, are not available in our context.
The second stream of the distribution strategy literature has explored how manufacturers distribute their products across multiple retail channels and the effectiveness of these channels for manufacturer profitability (e.g., Balasubramanian 1998; Cai, Zhang, and Zhang 2009; Chiang, Chhajed, and Hess 2003; Neslin et al. 2006; Sharma and Mehrotra 2007; Wallace, Giese, and Johnson 2004; Yan 2011). Specifically, studies have investigated the effectiveness of different retail distribution channels (Gonzalez-Benito, Munoz-Gallego, and Kopalle 2005; Trivedi 1998), their profitability impact for the manufacturer (Padmanabhan and Png 1997), and the effect of product alignment (i.e., which products to sell through) across retail channels (Kumar, Sunder, and Sharma 2015) and markets (Brynjolfsson, Hu, and Rahman 2009) on firm performance.
In this second stream, there are also a few studies that link multichannel distribution intensity to demand and manufacturer profitability. Yan (2011) investigates the strategic roles of a manufacturer and its retailers in differentiated branding and profit sharing in a multichannel supply chain context and identifies optimal marketing strategies. Cai, Zhang, and Zhang (2009) evaluate the impact of a manufacturer’s different pricing schemes (selling through dual channels) on its profitability. They find that consistent (i.e., not varying much over time) pricing schemes can reduce the channel conflict by increasing retailer profits. Sharma and Mehrotra (2007), in the context of a multichannel environment, show how to choose the optimal channel mix and examine its impact on profitability for a software firm. Pauwels and Neslin (2015) assess the revenue impact of adding brick-and-mortar stores to a firm’s existing repertoire of catalog and internet channels. They show that by adding the physical store channel, the firm in their study could increase its revenue by 20%. Cao and Li (2015) find that cross-channel integration stimulates retailers’ sales growth. Avery et al. (2012) investigate whether there is cannibalization and synergy among multiple channels operated by a given firm and, if so, whether such presence affects the demand. They find that the presence of a retail store channel decreases sales only in the catalog channel in the short run but increases sales in both the catalog and internet channels in the long run. Our research falls into this second stream of the distribution strategy literature, as we investigate the effectiveness of multichannel retail distribution strategies for manufacturers; however, we differ from the existing studies because we consider the competition among manufacturers and its impact on their distribution decisions and profitability.
Marketing in Emerging Markets
As emerging markets rapidly grow, multinational companies are becoming more visible in these markets. These companies face many challenges (e.g., unorganized retail landscape, insufficient number of stores) to being competitive in such markets (Dawar and Frost 1999). Although the marketing literature has provided abundant guidance on competitive marketing strategies, empirical understanding of competitive strategies (especially in distribution and pricing) in emerging markets is rare.
In terms of distribution, most emerging-market firms operate through multiple retail channels, each of which has a different target audience, spread, size, and ownership. The literature documents that retail distribution over multiple channels plays an important role in affecting firm performance in emerging markets (Homburg, Vollmayr, and Hahn 2014). For example, Kumar, Sunder, and Sharma (2015) discuss how an emerging-market firm can improve its performance by leveraging its distribution across multiple retail channels. However, there is little research modeling emerging-market firms’ competition in distribution, even at the firm level. Because firms sell their products (in multiple product forms) through different retail channels (with distinct characteristics; e.g., cost structure, attractiveness to customers), implementing competitive distribution strategies at the brand, product form, and retail channel levels can be quite beneficial for increasing firm profitability in emerging markets.
Regarding pricing, limited studies have considered the impact of price on sales and firm performance in emerging markets. Because in most emerging markets, multiple manufacturers sell products within a product category, the effectiveness of their pricing (in terms of profitability) depends on their competitors’ reactions. However, rather than considering such competitive pricing, researchers typically rely on conceptual and anecdotal evidence to understand the impact of pricing on firm performance (Arnold and Quelch 1998). Furthermore, as emerging economies continue to grow, customers start to develop the need for a variety of product forms (with similar functionalities). Thus, we extend the existing literature by modeling the emerging-market firms’ oligopolistic competition in pricing at both the brand and product form levels.
To understand emerging-market firms’ retail distribution competition along with price, and to guide firms in developing optimal distribution and price levels as the market characteristics change, we build on the existing literature on distribution strategies related to manufacturers’ multichannel distribution and marketing in emerging markets and also model manufacturers’ competition (at the brand, product form, and retail channel levels). For a snapshot of the prior literature and our unique contributions to the marketing literature, see Table 1.
Related Literature and Positioning of the Current Study.
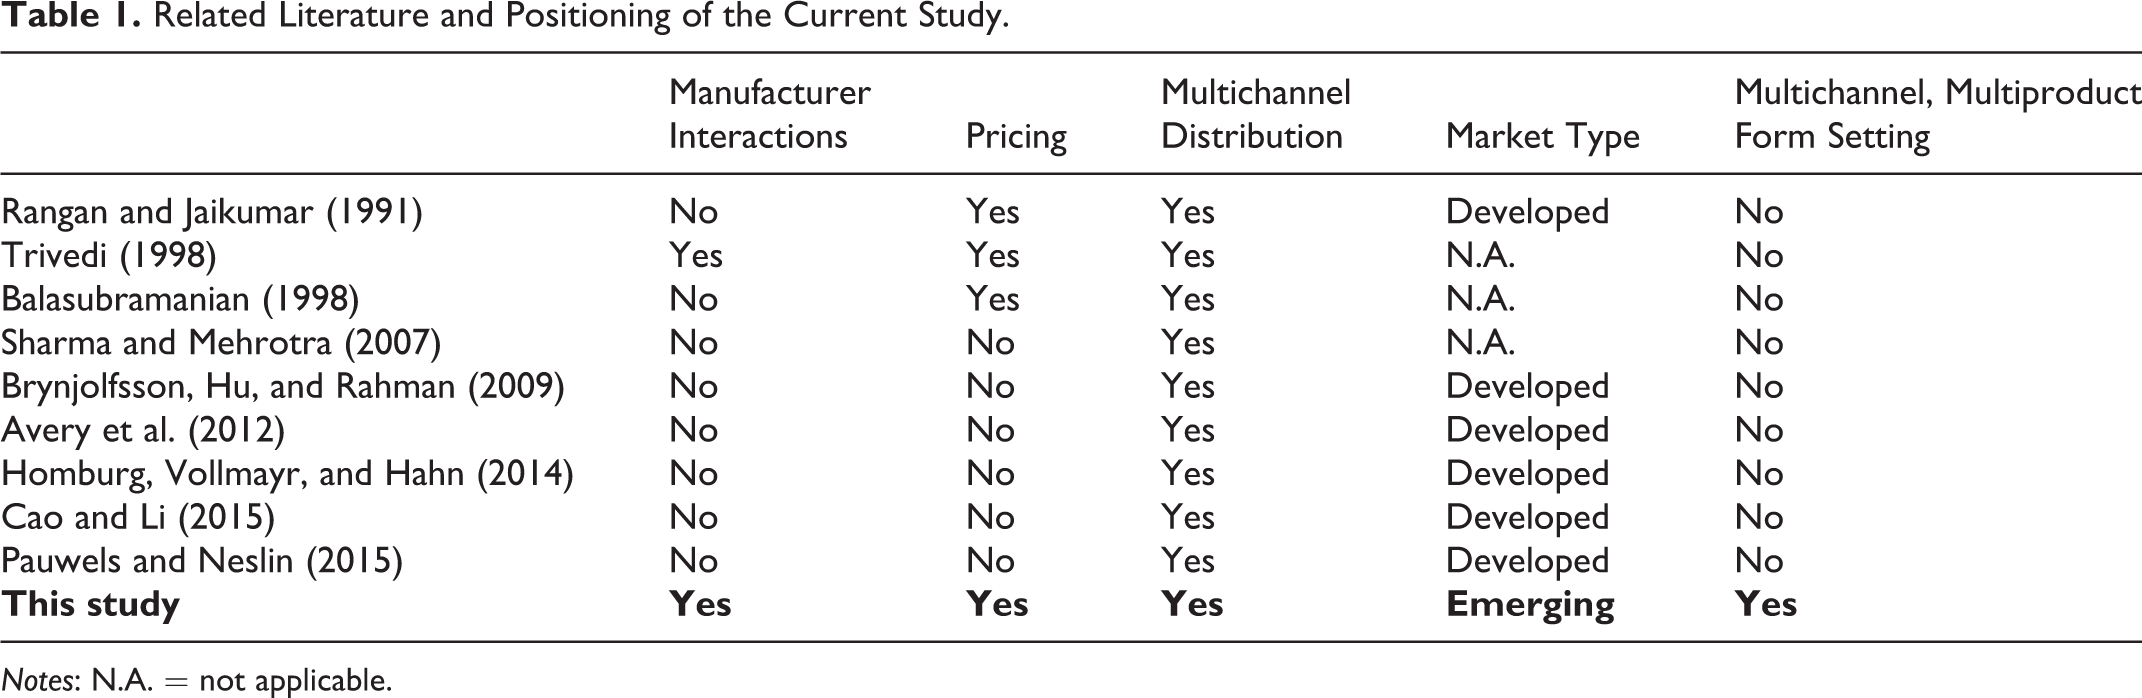
Notes: N.A. = not applicable.
Empirical Context and Data Description
Our emerging-market context is India, where firms rely largely on retail distribution and pricing not only to maximize profit and reach larger target markets but also to respond to competitors’ strategies (Export.gov 2018). The Indian retail market is projected to reach $865 billion by 2023 (compared with $490 billion in 2017; Export.gov 2018). The customer packaged goods or fast-moving customer goods market is predicted to grow by 10%–12% in the next ten years. Moreover, regarding retail distribution channels, there has been a significant retail distribution expansion in the last decade. Specifically, the total number of distribution outlets in India is estimated at over 12 million across different industries.
We study the Indian insecticide market, in which manufacturers manage the distribution of their products by engaging in multiple retail channels. Manufacturers rely on retail audits and past product shipments to evaluate the effectiveness of different retail channels. In this market, it is common for manufacturers to give credits to their retailers to push their products (i.e., manufacturers supply products to retailers with an understanding that the retailers will pay them back after a billing cycle). Manufacturers also incentivize retailers to push their products to end consumers through recommendations by the retailers’ sales personnel. Furthermore, manufacturers manage retailers by offering incentives for generated sales (the cap of sales varies from retailer to retailer). Manufacturers also use targeting strategies to reach consumers by targeting different customers with different retail channels. For example, manufacturers target rural and urban customers differently (e.g., paan-plus stores are typically used to target both urban and rural customers, whereas general stores are used to target largely urban and semiurban customers). Moreover, manufacturers use competitive strategies whereby they not only distribute through channels used by competitors but also provide incentives for retailers in specific competing channels to sell their products.
Our data are provided by a manufacturer operating in the insecticide market. The data are observed at the monthly level for a period of four years and aggregated to the national level by the data-providing firm. 5 In the data, brand sales at the manufacturer shipping level (in number of units) are observed for two product forms (solid [“Product Form 1”] and liquid [“Product Form 2”] 6 ) across two different retail channels (paan-plus [“Channel 1”] and general stores [“Channel 2”]). The data do not provide any evidence of exclusivity in the channel management by the manufacturers. However, such exclusivity is feasible. In the insecticide market, the two major manufacturers capture more than a 70% market share. The rest of the market is composed of many small firms. Because of this, we focus our attention on these two manufacturers and do not endogenize the price and distribution decisions of other small firms.
To understand marketing interactions among competing firms, we obtain firms’ monthly pricing information (at the product form level; the unit of price is paisa 7 ) and the number of retail stores (at the product form level in each retail channel). Furthermore, we acquire information about the time-variant expected average population size that is served by each channel. We use this measure to weight the total number of stores in each channel over time to construct the unique distribution variable that enables us to capture the effect of distribution across different channels at a more granular level. Given the lack of data at the regional level, our operationalization enables us to capture some cross-sectional variation in the distribution measure. We observe that, on average, Firm 1 (Firm 2) distributes through 64,718 and 420,546 (57,152 and 405,927) weighted paan-plus and general stores, respectively.
We provide descriptive statistics of the key variables in Table 2. As Table 2 shows, on average, Firm 1 charges 4 and 19 paisa higher than Firm 2 in solid and liquid product form, respectively. In terms of the distribution, on average, (1) Firm 1 has more stores than Firm 2 (901 vs. 838) and (2) Firm 1 (Firm 2) has 1.26 (1.34) times as many stores in the general stores channel as paan-plus stores channel. In terms of sales, on average, Firm 1 has almost the same amount of sales across the two channels, whereas Firm 2 sells 27% more units in general stores than in paan-plus stores. Finally, the average expected population size served by general stores is around five times larger than their paan-plus counterparts. All these observed asymmetries across firms, product forms, and retail channels in the key variables motivate us to develop our supply-side competition model to guide firms toward better understanding the existing dynamics in the emerging marketplace.
Descriptive Statistics.

Notes: Price is in paisa (one-hundredth of a rupee), distribution is in thousands, and sales numbers are in hundred thousands.
Modeling Framework
As discussed previously, we employ a two-step estimation approach (similar to Che, Sudhir, and Seetharaman [2007], Sudhir [2001b], and Cosguner, Chan, and Seetharaman [2018]). In the first step, we develop (and estimate) (1) an aggregate market share model at the brand, product form, and retail channel levels (by accounting for potential endogeneity in price and distribution variables and controlling unobserved consumer heterogeneity) and (2) a potential market size model as a function of macroeconomic factors in the relevant emerging marketplace. In the second step, we develop a multiproduct form, multichannel distribution and price competition model that takes the estimated aggregate market share and potential market size models (from the first step) as inputs. 8 We discuss our first- and second-step models along with their associated estimation procedures next.
An Aggregate Market Share Model at Brand, Product Form, and Retail Channel Levels
To develop an econometric brand choice model (at the product form and retail channel levels) with the no-purchase (i.e., outside) option for the typical household h (h = 1,…, H), we use an NL specification. In our specification, k = 1, 2 represents product forms (1 for solid product form and 2 for liquid product form), c = 1, 2 represents retail channels (1 for paan-plus stores and 2 for general stores), and j = 1, 2 represents manufacturers (firms, products, and brands are used interchangeably) under consideration. The NL tree for household h’s choice at time t is given as follows: at the top choice level (“channels”), the household chooses which channel to visit (c = 1, 2) or not to visit any channel (i.e., no purchase, c = 0). At the middle choice level (“product forms”), the household chooses which product form to choose (k = 1, 2, given the channel choice from the top choice level). Finally, at the bottom choice level (“brands”), the household chooses which brand to purchase (j = 1, 2, conditional on channel and product form choices from the top and middle choice levels). 9 For the visual representation of household h’s decision tree, see Figure 1.

NL tree.
Note that, given the NL tree from Figure 1, the household h can either choose to buy brand j in product form k of channel c or the no-purchase option
10
in period t.
11
The choice probability for brand j in product form k of channel c (
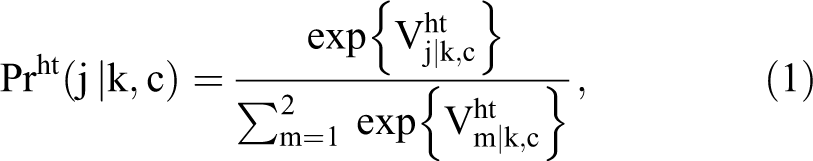
where

where
We model the (brand-, household-, and time-specific) price coefficient

where
Given the deterministic indirect brand utilities from Equation 2, product form choice probabilities k = 1,2 for household h at time t become
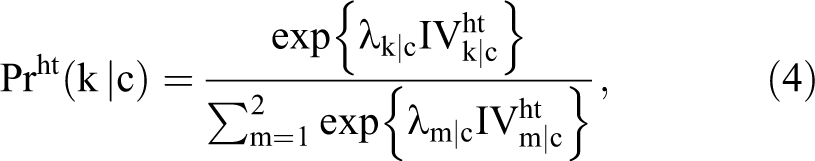
where k|c is product form k of channel c,

where
Given the household-specific brand, product form, and channel choice probabilities from Equations 1, 4, and 5, the probability of choosing brand j = 1, 2 in product form k = 1, 2 of channel c = 1, 2 by household h at time t becomes the following:

Given the household-level choice probability from Equation 6, the aggregate market share of brand j in product form k of channel c at time t (
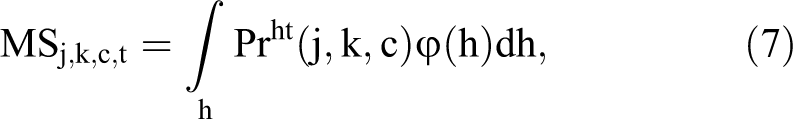
where the
Potential Market Size
Because our context is an emerging marketplace, the potential market size (Mt) is expected to change over time. To capture such variation in Mt, we model Mt as a function of observed macroeconomic factors of the relevant emerging marketplace as follows:

where Wt contains India’s population, the unemployment rate, and the GDP of India at time t, and ζ is the corresponding vector of parameters.
Note that, given the aggregate market share of brand j in product form k of channel c at time t (i.e.,

As discussed previously, Equation 9 (i.e., aggregate sales, becomes an input into our supply-side distribution and price competition model.
Price and Retail Distribution Endogeneity
Firms’ other marketing decisions that are unobserved (by the researcher) might be set together with their (product form–level) price and (product form– and channel-level) distribution decisions. Thus, firms’ price and distribution decisions might be endogenous (Pattabhiramaiah, Sriram, and Sridhar 2017). To account for the potential endogeneity of price and distribution variables, we use a control function approach (Petrin and Train 2010; an idea similar to the approach in Villas-Boas and Winer [1999]). This approach involves running first-stage linear regression models of price (
Due to difficulties in finding valid (and strong) instruments to account for the potential endogeneity problem in the price and distribution variables, we review existing marketing studies to identify instruments used in the literature (Ataman, Van Heerde, and Mela 2010; Kumar, Sunder, and Sharma 2015; Pancras and Sudhir 2007). Drawing on this review, we find that the widely used instruments (in the literature) to account for price (retail distribution) endogeneity are (1) the pricing (distribution) levels of firms in similar markets, (2) the cost of raw materials (diesel/gasoline), and (3) past performance metrics such as differences in lagged sales. Note that because our setting is the entire Indian market, it is not feasible for us to acquire marketing instruments from other similar markets (with similar retail channels, customer/firm characteristics, and behaviors). Regarding the other potential instruments discussed, we use a combination of instruments to account for the potential price and distribution endogeneity problem. First, we collect time-variant prices of raw materials—


First-stage regressions yield F-statistics that are significantly larger than 10. In addition, we obtain R2 measures of 55.3% and 42.1% (on average) from Equations 10a and 10b, respectively. We check the validity of our instruments using a correlation analysis and conduct a modified Sargan test. These analyses show that our instruments are both valid and strong. 16
We label
Unobserved Heterogeneity
Different households may have different intrinsic preferences for the different firm, product form, and retail channel combinations, and furthermore, they may respond to marketing-mix variables differently. To control for such unobserved household-level heterogeneity, we use the random coefficient specification (Keane and Wasi 2013; Park and Gupta 2009). The use of the random coefficient specification in the estimation of choice models with aggregate sales data (such as ours) is very common in the literature (see, e.g., Chintagunta 2001; Sudhir 2001a).
Specifically, we assume that the household-level preference parameters in Equations 2 and 3 come from the following distributions:
Supply-Side Price and Distribution Competition Model
For our empirical application, as noted previously, we focus on two major insecticide firms (i.e., J = 2), two major product forms (liquid and solid; i.e., K = 2), and two major retail channels (paan-plus and general stores; i.e., C = 2). We define the profit function for the jth (j = 1, 2) firm at time t as follows:
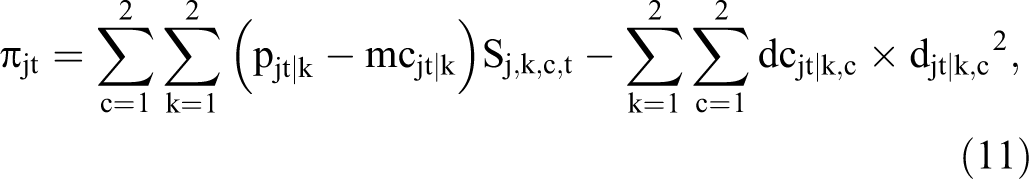
where
Under the Bertrand pricing and distribution assumption for the game played among manufacturers and the profit function of firm j at time t from Equation 11, the first-order conditions for the jth firm’s profit with respect to its product form–level prices can be written as
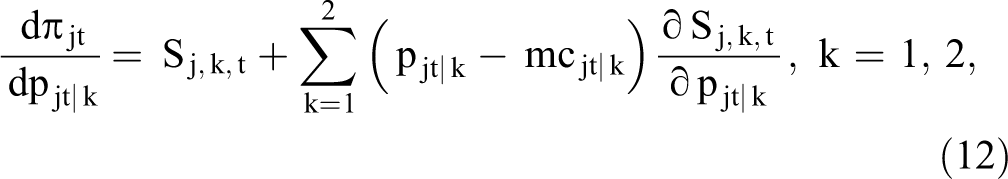
where
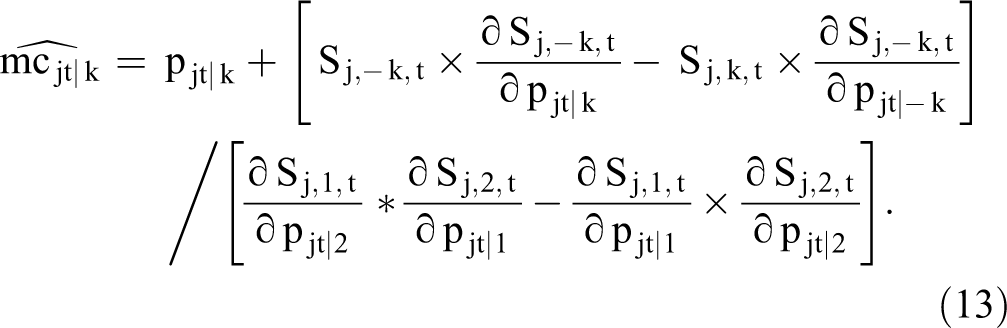
To invert time-variant distribution costs, we plug the inverted time-variant marginal costs from Equation 13 into the profit function from Equation 11 and then calculate the first-order conditions for firm j’s profit th respect to product form k of channel c distribution as follows:

By setting the first-order conditions in Equation 14 to zero, we can invert the time-variant distribution cost (

As Equations 13 and 15 show, we have closed-form expressions for the production and distribution costs (given the aggregate sales model from Equation 9 and the observed prices and distribution levels in the data). We acknowledge that the identification of the costs in Equations 13 and 15 relies on our supply-side Bertrand competition assumption of the game played among manufacturers. In other words, the inverted costs in Equations 13 and 15 would be different (but still identifiable) if a different game assumption was made in the supply side. Accordingly, we estimate an alternative game in which firms are assumed to be in tacit collusion to determine whether our Bertrand assumption is a reasonable one. For the details of that comparison, see the “Do Firms Collude in the Insecticide Market?” subsection.
Model Estimation
As discussed previously, we estimate our aggregate market share (at the brand, product form, and retail channel levels) and potential market-size models in our first-step estimation. We estimate parameters of the aggregate market-share model by maximizing the log of the simulated sample likelihood 21 :
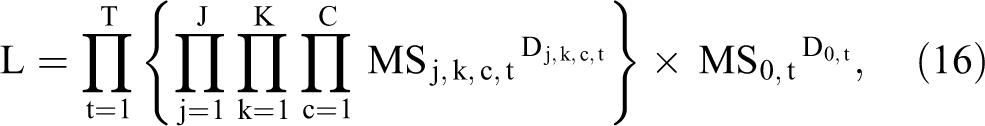
where
The aggregate sales model (i.e.,
Before discussing our estimation results, we would like to note that, in this study, we have not considered retailers’ pricing rules (i.e., we assume that retailers are not strategic, acquiring a fixed and small percentage of the entire channel’s profit margin 22 ), unlike some previous research studying vertical pricing interactions (e.g., Sudhir 2001b; Villas-Boas 2007) in distribution channels. We make this assumption for the following reasons. First, as explained previously, the retail industry is unorganized in most emerging markets (Jerath, Sajeesh, and John Zhang 2016). For example, 85% of the retail industry in Brazil, Russia, India, and China is unorganized (Mangalorkar, Kuppuswamy, and Groeber 2007). The retail industry in emerging markets is mostly dominated by small mom-and-pop and grocery channels, which are individually owned, small in size, low in capital investment, but large in number (Sarma 2005). Chain retailing or organized retail businesses are not as prevalent in emerging markets as in developed markets, although there is a slow transition to the adoption of chain retailing (modern stores) (Narayan, Rao, and Sudhir 2015). Thus, the bargaining power of retailers is very limited in emerging markets. In addition, because the size of emerging markets is large and the retail infrastructure is not well-developed (Sheth 2011), receiving supply from manufacturers regularly is more important (to satisfy customer demand) than strategically setting prices for small emerging-market retailers. Finally, in our empirical setting, it is not feasible for us to model the retailers’ pricing roles because we do not have sales data at the individual store level.
Estimation Results
In this section, first, we discuss our demand-side model selection by showing the importance of considering households’ sequential choice process (the channel first, product form next, and brand last) and the role of distribution in the demand estimation. Second, we discuss our demand-side estimation results. Third, we discuss our supply-side estimation results. Fourth, we discuss implications of ignoring the role of distribution in estimating firms’ profit margins. Finally, we discuss our robustness check regarding the identification of the supply-side game played in the data (i.e., Bertrand competition vs. collusion).
Demand-Side Model Selection
Table 3 reports our demand-side estimates. We estimate three different demand models: (1) MNL demand with price and distribution (labeled as Model 1), (2) NL demand without distribution (labeled as Model 2), and (3) NL demand with both price and distribution (i.e., our proposed demand model, labeled as Model 3). 23 As we expected, the NL demand model with both price and distribution 24 (i.e., Model 3) outperforms both Models 1 and 2 based on the BIC (BICModel 1 = 40,092.7 million, BICModel 2 = 40,113.0 million, BICModel 3 = 40,090.2 million). 25 Due to the inferior data fit of Models 1 and 2, we use Model 3 as our main model for further analysis.
Demand-Side Parameter Estimates.
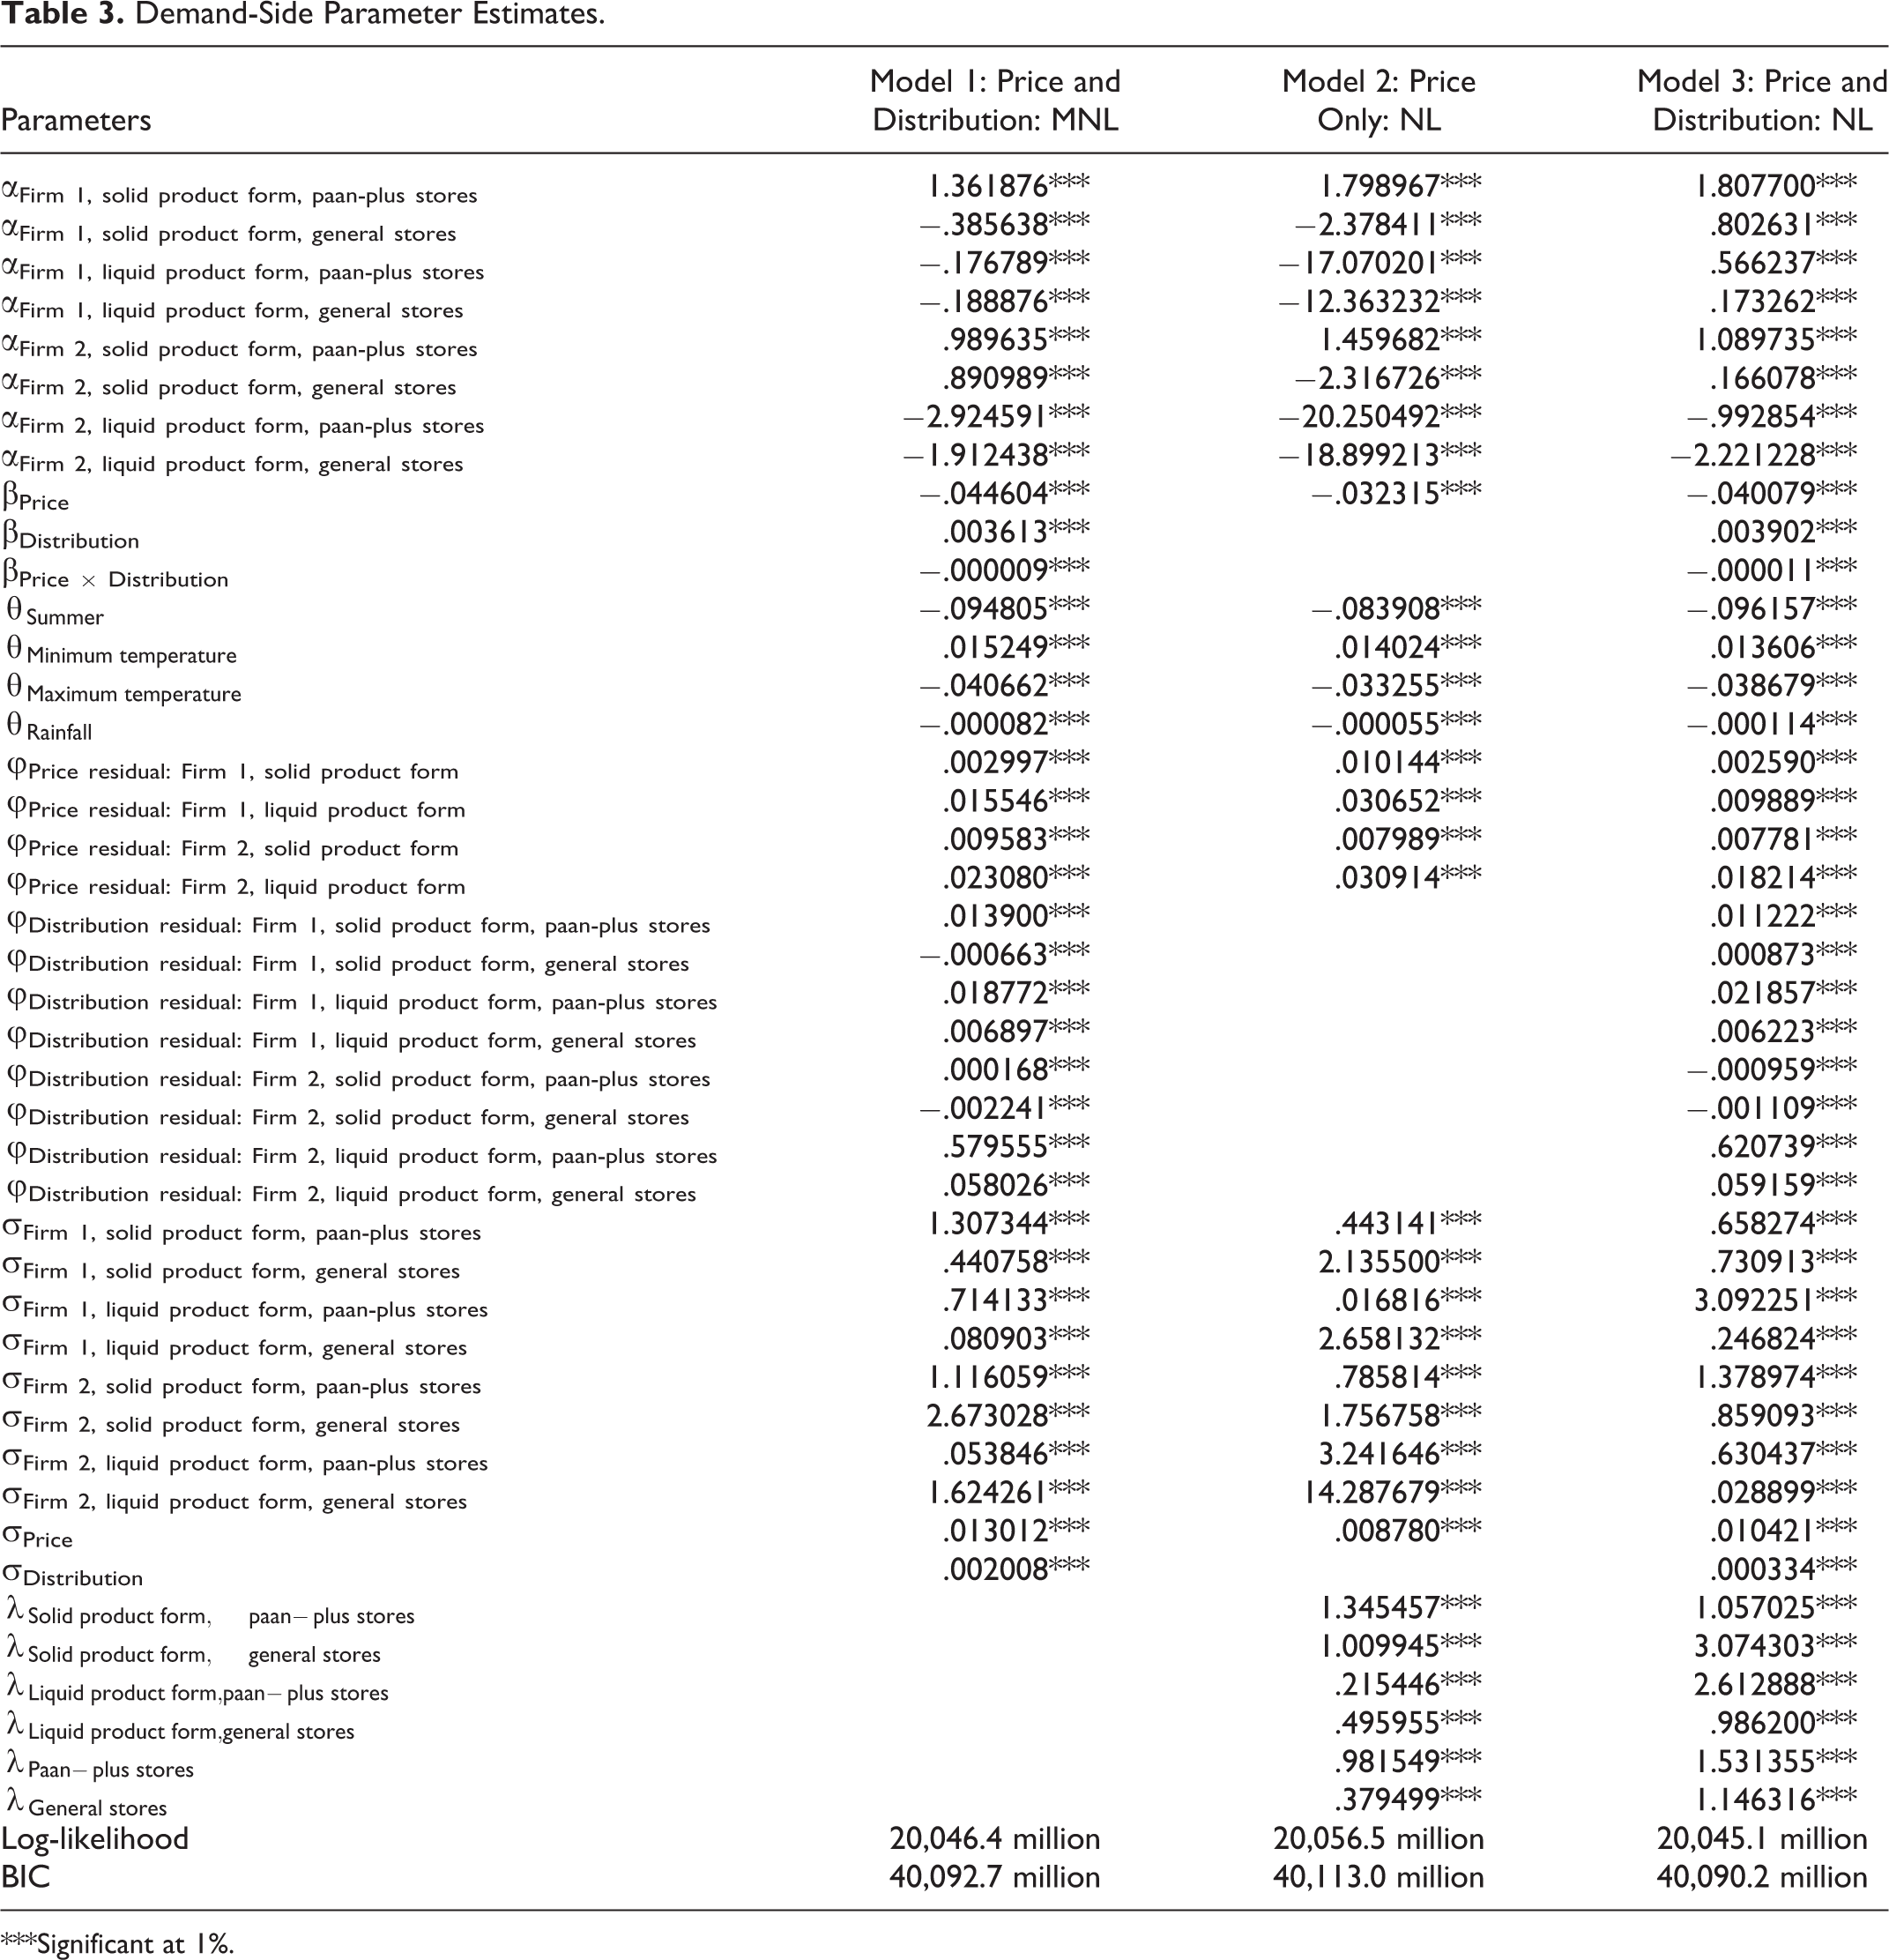
***Significant at 1%.
Demand-Side Estimation Results
As Table 3 shows, based on the estimated mean intrinsic preference parameters, customers prefer Firm 1 (vs. Firm 2), the solid product form (vs. the liquid product form), and paan-plus stores (vs. general stores). As expected, our estimated mean price and distribution coefficients turn out to be negative (−.04) and positive (.003), respectively. This suggests that as the price of a brand–product form (the distribution level of a brand–product form–channel) combination increases, customer utility for the corresponding combination decreases (increases). This finding suggests that there is a direct positive effect of distribution (through lowering the transportation burden) on customer utilities. As discussed previously, the level of distribution might also have an indirect effect through changing households’ price sensitivities. Our results suggest that as the level of distribution for a brand–product form–channel combination increases, customers’ price sensitivity for that combination also increases. This finding highlights the importance of modeling households’ price disutility as a function of the corresponding brand–product form–channel combination’s distribution level to be able to understand the true pricing responses of households.
Regarding unobserved heterogeneity, we find that households in the insecticide market are highly heterogeneous in terms of their intrinsic preferences and their responsiveness to marketing-mix variables. We find estimates for price and distribution endogeneity controls to be significant. Furthermore, our results suggest that seasonality, temperature, and rainfall controls are significant, suggesting that controlling weather-related factors is also important in understanding households’ demand for insecticides. Finally, we find that estimates for IV parameters (of our NL specification) are significant and varying in size across different channel and product form nests, suggesting that the nested structure helps us capture meaningful variations in the observed sales data.
Supply-Side Estimation Results
To estimate the production cost function, we first pool the inverted (marginal) production costs from Equation 13 across firms and product forms. Second, we estimate a linear regression model by using the pooled production costs as our dependent variable, and firm–product form dummies, 26 year dummies, 27 and the interaction of these dummies 28 as our independent variables. We report the parameter estimates of this regression model in the first column of Table 4 as Model 1. As Table 4 shows, all firm–product form dummies, year dummies, and their interactions are significant, implying that production costs differ not only across firms and product forms but also over time. Furthermore, the estimated production costs are in the same ballpark as the actual cost estimates of managers of the data-providing firm. The differences in costs between model predictions and managerial estimates vary between −8.73% to +10.12%. That provides face validity to our cost estimates.
Supply-Side Parameter Estimates: Marginal Cost Estimation.

*Significant at 10%.
**Significant at 5%.
***Significant at 1%.
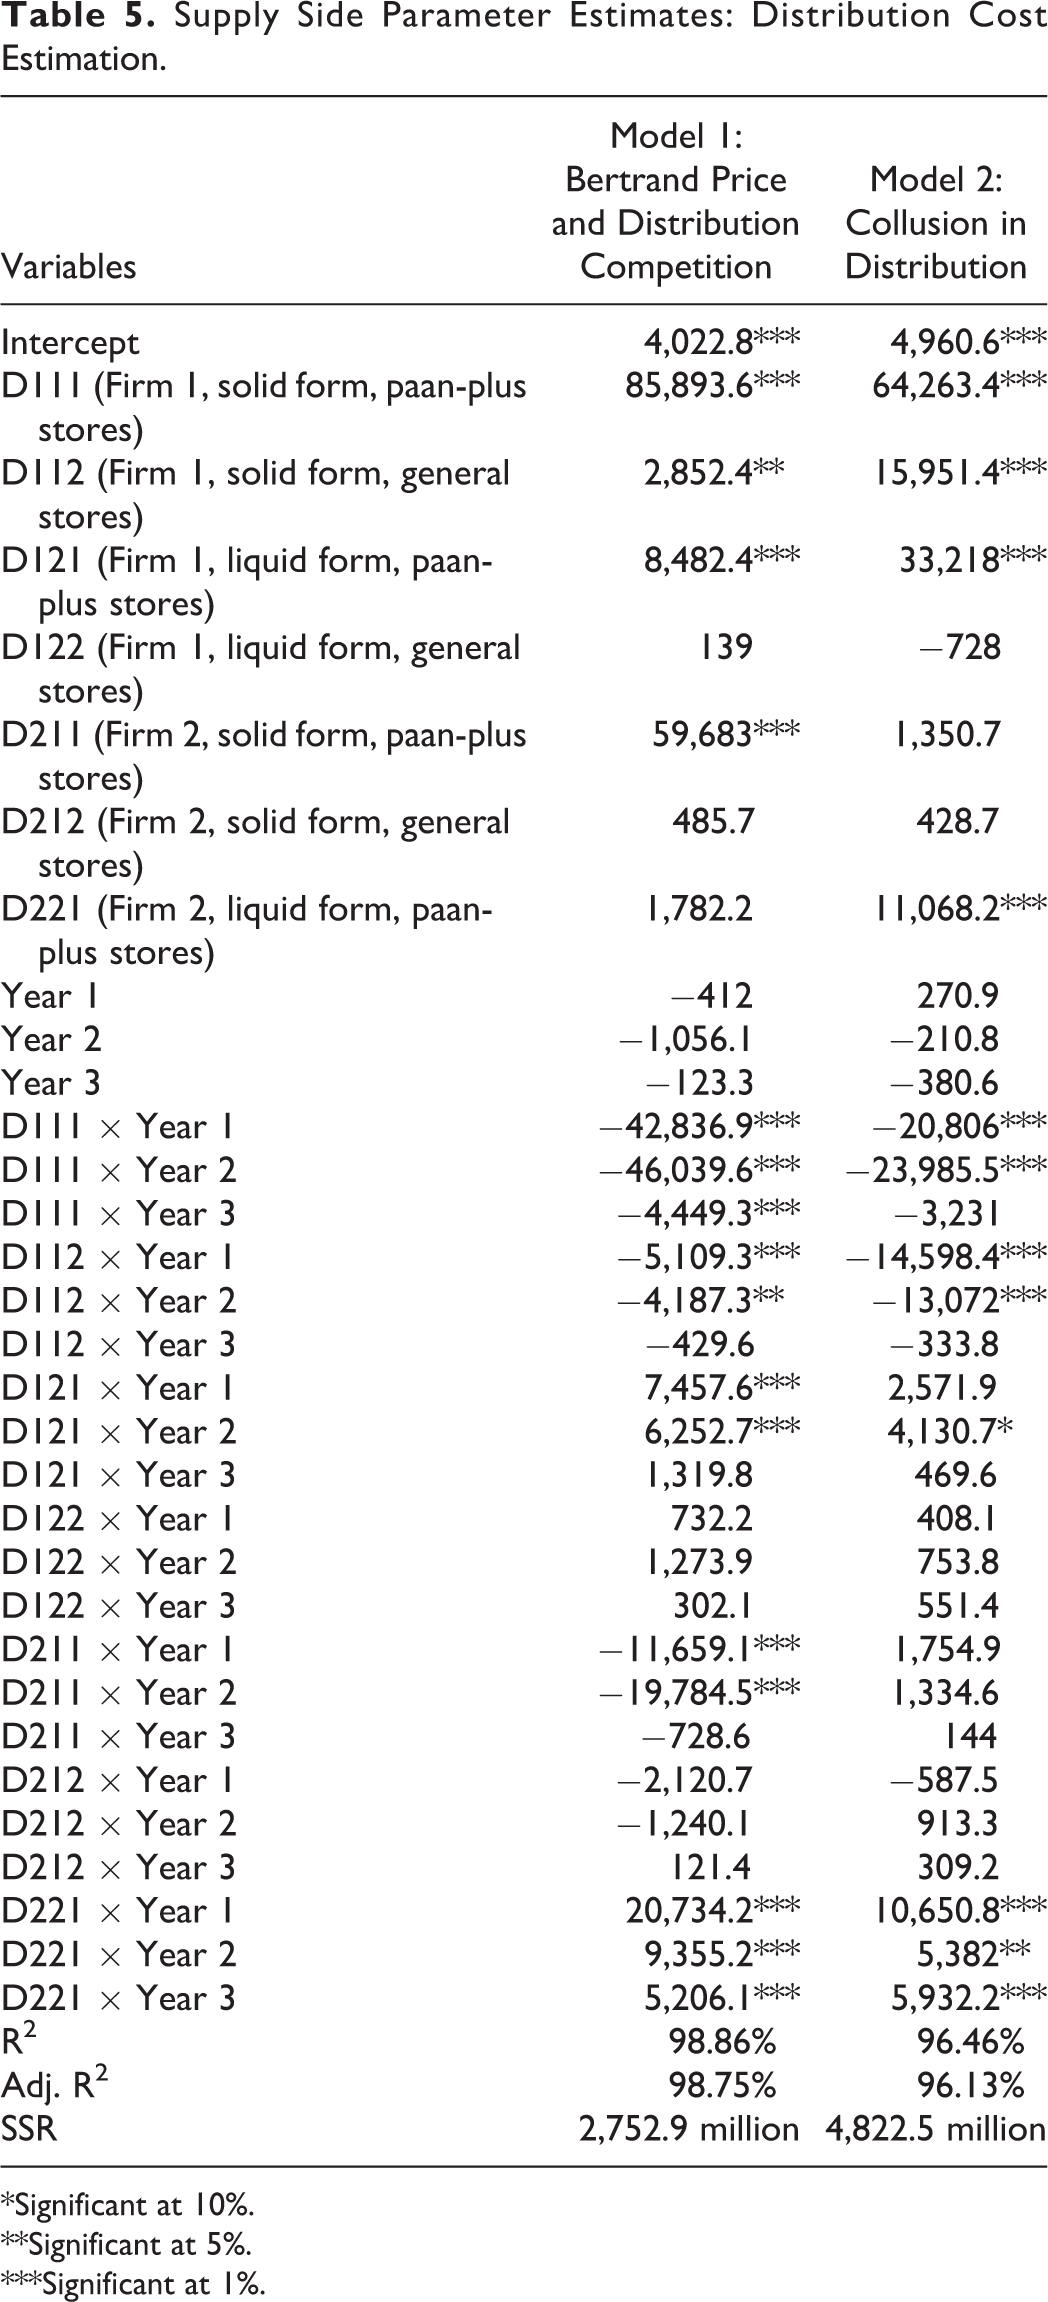
To estimate the distribution cost function, similar to the production cost function estimation, we first pool the inverted distribution costs from Equation 15 across firms, product forms, and retail channels. Next, we estimate a linear regression model by using the pooled distribution costs as our dependent variable and firm–product form–channel dummies, 29 year dummies, and the interaction of these dummies as our independent variables. We report the parameter estimates of this regression model in the first column of Table 5 as Model 1. As Table 5 shows, the estimates suggest that distribution costs differ not only across firms, product forms, and retail channels but also over time to a lesser extent.
Supply Side Parameter Estimates: Distribution Cost Estimation.
*Significant at 10%.
**Significant at 5%.
***Significant at 1%.
Note that emerging-market firms can easily use our proposed supply-side model to understand their competitors’ cost asymmetries. This information carries an important value for firms in optimizing their decisions and calculating their competitors’ reactions. Moreover, understanding the cost of distribution and production might be useful for firms that are planning to enter the insecticide market to assess the profitability of their entry decisions.
Role of Retail Distribution in the Supply-Side Estimation
In this subsection, we aim to illustrate the role of ignoring distribution on profit-maximizing firms’ pricing decisions. Because the previous models studying firm competition ignore the role of distribution and solely focus on price optimization, to achieve our objective, we estimate a price-only supply-side model and compare that benchmark model with our proposed supply-side model with price and distribution. For the price-only model, we use the estimated price–only demand model (Model 2) in Table 3 as the input and derive the marginal production cost in Equation 13. Next, we estimate a production cost function similar to Model 1 in Table 4 with firm–product form dummies, year dummies, and their interactions. We label this model as Model 2 and report its estimated parameters in Table 4. Our proposed model (Model 1) outperforms the price-only model (Model 2) both in terms of R2 (95.97% vs. 92.09%) and the sum of squared residuals (SSR; 1,002.24 vs. 1,421.90) criteria. This suggests that ignoring distribution significantly worsens the fit of the estimated production cost function. 30
Next, we use the estimated parameters from Models 1 and 2 (in Table 4) to calculate the optimal profit margins for each firm and product form combination over our observed data span of four years. Table 6 reports results related to the comparison of the calculated equilibrium profit margins. As evident from Table 6, ignoring distribution causes substantive overestimation of optimal profit margins ranging from 7% (Firm 1 in solid form on Year 2) to 55% (Firm 1 in liquid form on Year 4). These results suggest that the incorporation of distribution and price in firms’ profit maximization objectives is indeed a critical requirement for emerging-market firms, and ignoring the distribution might cause firms to set prices that are significantly higher than optimal levels.
Calculated Equilibrium Profit Margins.

Do Firms Collude in the Insecticide Market?
Note that we assume that firms (in our emerging-market context) compete in both price and distribution. However, there is a possibility that firms may tacitly collude (rather than compete) and decide on price and distribution levels on the basis of maximizing the combined profits in the insecticide category. 31 To show that our assumption of Bertrand competition in pricing is consistent with our data, we estimate a model of collusive pricing. For the estimated production cost function under this collusive pricing assumption, see Model 3 in Table 4. Results suggest that our proposed production cost model (Model 1 in Table 4) performs significantly better (R2 = 95.97%, SSR = 1,002.4) than the production cost model under the collusive pricing assumption (R2 = 87.78%, SSR = 7,026.77). This suggests that the observed price variations in the data can be better explained by the proposed price competition model than the alternative collusive pricing model.
Even though firms compete in prices, there is still a possibility that they might be colluding in their distribution decisions. To test whether the observed data supports collusion (rather than competition), we estimate the distribution cost function under the collusion assumption (for the estimates of this alternative model, see Model 2 in Table 5). Similar to the collusive pricing model, we find that the distribution cost model under the collusive distribution assumption has a poor fit compared with our proposed model (R2 = 96.46% vs. R2 = 98.86%, respectively; SSR = 4,822.5 million vs. SSR = 2,752.9 million, respectively). Given the inferior fit performance of the (price and distribution cost) models under the tacit collusion assumption and the respective performances of our proposed competitive models, we conclude that our emerging-market firms do not collude in the studied insecticide market.
Managerial Implications
In this section, we draw on the estimation results to conduct a series of counterfactual studies examining the policy implications of our distribution and price competition model. Specifically, our objective is to investigate what happens to prices, distribution levels, firm profits, and consumer surplus (in equilibrium) as (1) firms’ distribution costs decrease and (2) one firm starts to distribute exclusively.
Decreasing Distribution Costs
Because our context is an emerging market, it is possible that the government may improve the transportation infrastructure in India by constructing new roads and highways, and thus, it may become easier and ultimately less costly for product manufacturers to distribute their products in the future. Firms may respond to such decreases in distribution costs by changing their price and distribution levels asymmetrically across different product forms and retail channels. Therefore, our objective is to understand such asymmetries among firms in responding to decreases in distribution costs. To achieve this objective, we gradually decrease the estimated distribution costs from 0% to 20% by .1% increments (by keeping all else [marginal costs and demand-side estimates] constant) and numerically solve for the equilibrium of the supply-side (distribution and price) competition game for each candidate set of distribution costs. We plot how equilibrium prices, distribution levels, profits, and consumer surplus change as the distribution costs decrease in Figure 2, Panels A–D, respectively.

Equilibrium prices, distribution levels, profits, and surplus versus percentage decrease in distribution costs.
As Figure 2, Panels A and B, show, firms respond to decreases in the distribution costs by changing their distribution levels rather than prices. Panel B illustrates that both firms respond to decreases in distribution costs by increasing their distribution level in the paan-plus stores. This is because customers prefer paan-plus stores to general stores (based on our demand-side estimation results). In other words, increasing presence in paan-plus stores brings a higher sales return (on average) for both firms compared with general stores. Because of this relatively higher sales return, both firms increase their presence in paan-plus stores as the distribution costs decrease. Unlike paan-plus stores, in general stores, firms respond to decreases in the distributions costs asymmetrically: Firm 1 increases its distribution level, whereas Firm 2 does the opposite. This happens because Firm 1 is significantly more preferred in that channel compared with Firm 2 (based on our demand-side estimation results). In other words, even though general stores are less preferred than paan-plus stores because of the decrease in the distribution cost in this channel, Firm 1 prefers to increase its presence in general stores because the sales return of this investment is still significant (due to Firm 2’s inferior brand preference). Whereas for Firm 2, the sales return from investing in the general stores channel is only marginal (because of its inferior brand preference), so it prefers to decrease its presence in this channel and shift its distribution resources into the paan-plus channel. This strategy helps Firm 2 be more competitive against the more preferred Firm 1 in the paan-plus channel. Regarding the equilibrium profits and consumer surplus, as we show in Figure 2, Panels C and D, the welfare of all three parties—Firm 1, Firm 2, and consumers—increases as the distribution costs decrease.
Exclusive Distribution of Firm 1
Although the two manufacturers in the insecticide market do not distribute exclusively (as is evident from the available data), to be able to mitigate the competition, they may consider exclusively distributing their products in some parts of the emerging marketplace. Such exclusivity may help firms not only charge higher prices but also effectively reallocate their distribution resources to improve their profits. To understand the implications of such exclusivity on policies, profits, and consumer surplus, we allow the more preferred Firm 1 to cover 0% to 20% of the market exclusively with .1% increments (by keeping all else [production and distributions costs and demand-side estimates] constant) and numerically solve for the equilibrium of the supply-side (distribution and price) competition game for each exclusive coverage percentage (0%–20%) of Firm 1. We plot how equilibrium prices, distribution levels, profits, and consumer surplus change as the exclusivity percentage of Firm 1 increases in Figure 3, Panels A–D, respectively.

Equilibrium prices, distribution levels, profits, and surplus versus exclusivity percentage of Firm 1.
As Figure 3, Panel A, shows, Firm 1 increases its prices in both solid and liquid product forms as its exclusive coverage increases because the exclusivity helps Firm 1 avoid competing with Firm 2 in the corresponding exclusive segment. Regarding Firm 2’s pricing, as seen in Panel A, Firm 2 can keep its prices relatively the same as the exclusivity of Firm 1 increases (or the potential market size for Firm 2 decreases). Figure 3, Panel B, shows that both Firm 1 and Firm 2 increase (decrease) their distribution levels in general (paan-plus) stores. Regarding Firm 1, this happens for two reasons: (1) because of exclusivity (i.e., the lack of the competitor’s products in the exclusive segment), the less preferred general stores become more attractive in terms of bringing sales for Firm 1; and (2) moving distribution resources from paan-plus to general stores saves money because distributing to the former channel is costlier (based on the supply-side estimation results) than the latter. Regarding Firm 2, given that the potential market size decreases due to Firm 1’s exclusive coverage, sales return from distribution decreases for Firm 2. Thus, Firm 2 shifts its distribution from paan-plus to general stores to cut its distribution costs, because it is less costly to distribute to general stores (based on the supply-side estimation results). Finally, regarding the profits and consumer surplus, Panels C and D of Figure 3 show that the exclusivity of Firm 1 increases the welfare of Firm 1 only, but not the remaining two parties: Firm 2 and the consumers.
Conclusions
In this study, we choose an NL framework to model the aggregate demand of insecticide firms in India by using monthly sales data. In doing so, we control for unobserved consumer heterogeneity by using the random coefficient specification as well as account for the potential endogeneity in price and distribution variables through the control function approach. Next, we estimate a supply-side price and distribution competition model taking the estimated demand model as an input. Methodologically, we illustrate how to estimate competitive interactions among firms in a multiproduct form and multichannel setting. Because most emerging economies’ retail industries are composed of multiple firms, multiple product forms, and multiple channels, acknowledging this setup is a factual requirement.
From our demand estimation, we find that the retail distribution affects the market demand in two ways: (1) the direct effect (i.e., the higher the distribution level, the easier the transportation for consumers and, thus, the higher the demand) and (2) the indirect effect (i.e., the higher the brand’s distribution level, the higher the market’s price sensitivity for that brand). We further find that ignoring distribution in the demand estimation significantly biases the market’s response to firms’ pricing decisions. From our supply-side estimation, we find that there are significant differences in the estimated production (distribution) costs across firms, product forms (retail channels), and years (to a lesser extent). We also find that ignoring distribution and solely focusing on price optimization, as previous studies have done, results in overestimating the equilibrium manufacturer profit margins by 7% to 55%. Finally, we find that observed marketing-mix variations can be better explained by firm competition than by tacit collusion.
Drawing on our estimation results, we conduct a series of simulation studies to examine the policy implications of our distribution and price competition model. Our simulation studies show that understanding the asymmetries in consumers’ preferences for brands, product forms, and retail channels, as well as firms’ distribution costs, are important in understanding firms’ reactions to changes in the emerging marketplace. Our first study shows that as the transportation infrastructure in the emerging marketplace improves (as a result of the construction of new roads and highways), firms should respond by reallocating their distribution resources asymmetrically: rather than changing their prices, both firms should increase their presence in the more preferred paan-plus stores channel, and only the more preferred firm should increase its presence in the less preferred general stores channel. Our second study shows that the more preferred firm’s exclusive distribution (1) enables that firm to charge higher prices and (2) causes both firms to shift their distribution from the more preferred and costlier paan-plus stores channel to the general stores channel.
To reiterate, our study makes multiple contributions to marketing academia and practice, as this is the first study to (1) model competitive interactions in emerging-market firms across two important marketing decisions (i.e., distribution and price, using a unique granular measure of distribution intensity); (2) model marketing interactions at the multibrand, multiproduct form, and multichannel levels; and (3) guide emerging-market managers to make profitable marketing- mix decisions by providing an approach to respond to changes in the emerging marketplace.
Although we provide significant contributions to the marketing literature and to practice, our study has some limitations. It is worth noting that our findings are specific to emerging markets and may not be generalizable to mature markets for the following reasons. First, the unavailability of products due to limited, expensive, and unorganized retail distribution is a major issue for emerging-market manufacturers, whereas in mature markets, firms do not typically face these issues, as a result of their organized and streamlined retail distribution strategies. Second, in most emerging markets, firms use multiple channels/store formats (e.g., mom-and-pop stores, general stores) to reach their end consumers, unlike firms in mature markets, which distribute their products through large hypermarkets. Furthermore, these retail channels are typically unique to the corresponding emerging-market setting (e.g., kirana and general stores in the Indian market, professional and specialty stores in the Chinese market; Fung Business Intelligence and China Commerce Association for General Merchandise 2018) and are significantly different from the retail channels in mature markets. Finally, shelf spaces in a retail channel might be more limited in emerging markets (compared with mature markets) due to smaller store sizes and existing physical/locational constraints (e.g., lack of storage facilities, proper air conditioning). Although manufacturers in mature markets also face limited shelf space issues, most major manufacturers manage to acquire required shelf space for their products. Given such differences, insights from our study may not be applicable to developed-market managers.
One of the limitations of our study is that because our focus is on distribution competition and price, we treat the effects of other unobserved marketing variables (e.g., advertising) as exogenous demand shocks. Although we estimate the demand side and supply side with two marketing decisions, investigating how firms compete with other marketing-mix instruments is an important issue for future research, permitting that the data is available. Moreover, if the data (of a firm’s new vs. existing distributing stores) are available, modeling fixed costs of distribution can be another fruitful research direction. Second, our data are at the national level; as a result, we are not able to model regional heterogeneity (some regions have only one kind of store and/or one form of product). Future research could capture such an important decision. Finally, there is potential for overlap among the channels of a firm as well as some overlap with competitors’ channels. Although we do not observe such overlap, modeling the impact of such overlap on the availability of data could bring new insights.
Supplemental Material
Supplemental Material, jmr.17.0126-web_appendices - Modeling Emerging-Market Firms’ Competitive Retail Distribution Strategies
Supplemental Material, jmr.17.0126-web_appendices for Modeling Emerging-Market Firms’ Competitive Retail Distribution Strategies by Amalesh Sharma, V. Kumar and Koray Cosguner in Journal of Marketing Research
Footnotes
Acknowledgments
We thank the JMR review team for their valuable guidance during the revision process. We thank Renu for copyediting an earlier version of the manuscript. We thank several of our colleagues at Georgia State University, Texas A&M University, and the participants of the 2017 Marketing Science Conference. Finally, we thank the data-providing firm for giving us access to their data.
Author Contributions
All authors contributed equally to this research.
Associate Editor
John Roberts served as associate editor for this article.
Declaration of Conflicting Interests
The author(s) declared no potential conflicts of interest with respect to the research, authorship, and/or publication of this article.
Funding
The author(s) received no financial support for the research, authorship, and/or publication of this article.
Notes
References
Supplementary Material
Please find the following supplemental material available below.
For Open Access articles published under a Creative Commons License, all supplemental material carries the same license as the article it is associated with.
For non-Open Access articles published, all supplemental material carries a non-exclusive license, and permission requests for re-use of supplemental material or any part of supplemental material shall be sent directly to the copyright owner as specified in the copyright notice associated with the article.