
Abstract
The authors investigate how heuristics and analytics contribute to the advertising budget decision by decomposing it into four components: (1) baseline spending, (2) adaptive experimentation, (3) advertising-to-sales ratio, and (4) competitive parity. They propose a methodology to estimate and infer the weights of these four components. Applying this methodology to sales and advertising data across eight brands from three categories substantiates for the first time, and uniformly across all brands, that managers depart from optimality through adaptive experimentation, which is in line with dual control theory that suggests they do so to learn about advertising effectiveness. The adaptive experimentation finding, combined with evidence on the use of heuristic methods, suggests that budget decision making is characterized by bounded rationality. Furthermore, budgeting decisions are brand-specific, reflecting the considerations of a brand’s market position and performance. Finally, simulation studies show that brands from categories with high uncertainty in advertising effectiveness can benefit from double-digit revenue lifts by placing higher emphasis on adaptive experimentation.
Keywords
The advertising process starts with the budgeting decision and ends with the distribution of content to consumers through various media outlets. Although the effects of media spending on sales have received considerable attention in the literature, not much is known about how managers decide to set their advertising budgets and how their decisions affect sales performance. The limited available evidence suggests that sales performance varies depending on the budgeting method, particularly in markets characterized by uncertainty and dynamic advertising response (Wang and Zhang 2008). Furthermore, to counterbalance the predominance of heuristics rules (Danenberg et al. 2016), the advent of analytics and the proliferation of data call for the adoption of more evidence-based budgeting strategies.
What is known about the budgeting process, mostly at the industry level but not for individual brands, is that managers do not follow a single approach to set their budgets but rather use a combination of them. This practice is referred to as “multiple stakes in the ground” (Farris and West 2007). Such approaches include (1) heuristics drawing upon managerial judgment, such as percentage of past or expected sales (also known as advertising-to-sales [A/S] ratio) and competitive benchmarking, and (2) analytical approaches such as profit-maximizing models (e.g., West, Ford, and Farris 2014). In other words, decision making regarding budget setting invariably combines managerial judgment and model-driven insights (Rosenzweig 2014). However, interviews with top-level as well as brand managers reveal that identifying the different methods involved in the advertising budgeting process and quantifying the extent to which each method is used is a difficult task (e.g., Farris and West 2007; Low and Mohr 1999; Piercy 1987). For example, Farris and West (2007, p.316) note, “Exactly how the recommendations of various approaches are (should be) combined to determine a single dollar figure is, unfortunately, not clear.” Furthermore, the advertising budget decision process is the outcome of negotiations between top-level and marketing (or brand) management, involving considerations such as power and political influence (e.g., Piercy 1987). Consequently, disentangling the contribution of each method used in the budget decision-making process is a challenging task.
This discussion points to the lack of a systematic representation of the advertising budgeting process and its impact on sales performance. Such a representation would offer an unbiased assessment of the relative contribution of analytics and heuristics methods to the overall budgeting decision and provide a diagnostic tool to evaluate their effects on sales performance. For example, marketing managers may admit less to the use of heuristic-based methods and more to analytics-based approaches for fear of appearing less sophisticated. As West, Ford, and Farris (2014, p. 12) remark, “Companies need to become more open about their budgeting processes and acknowledge the role that heuristics play.”
To realize these benefits, we propose a dynamic model of advertising spending over time, without presuming optimality of managers’ behavior, and then link it to sales performance. In other words, our modeling framework accommodates bounded rationality in managerial decision making by acknowledging that managerial behavior goes beyond profit maximization, allowing multiple objectives such as maximizing revenues subject to satisficing profit levels, pursuing sales growth, or warding off competition (Baumol 1962; Gunny 2005; March and Simon 1958). In striving to satisfice these goals, managers often rely on heuristics and depart from optimality. Thus, in our framework, nonoptimality does not imply lack of rationality.
Our intended contribution is fourfold. First, we formulate the combined use of heuristics and analytics-based budgeting rules in advertising decision making consistent with the “multiple stakes” practice paradigm. This formulation constitutes a novel approach in the advertising budgeting literature. Second, we account for the role of managers’ ambiguity regarding the response function parameters (e.g., Tull et al. 1986) by explicitly incorporating the uncertainty of ad effectiveness in setting advertising budgets. This parametric uncertainty marks a departure from standard profit-maximizing models that assume full knowledge of advertising effectiveness. Third, we allow the advertising budget to evolve over time due to changing budgeting methods, market conditions, and temporal variation in advertising effectiveness. Fourth, we empirically show, for the first time in the literature, that managers depart from optimality by spending proportionately to the uncertainty in ad effectiveness. This knowledge sheds light on the rationalization of departing from profit-maximizing optimality. In other words, suboptimal behavior does not imply nonrational behavior.
We apply the proposed model to sales, advertising, and marketing mix data for eight brands across durable (hybrid cars) and nondurable (beer and yogurt) categories at different stages of their product life cycle. Using the proposed methodology, this study provides empirical evidence, uniformly across eight brands from three categories, that managers depart from optimality by spending proportional to the uncertainty in ad effectiveness, a hitherto untested hypothesis in marketing grounded in the dual control theory (see Filatov and Unbehauen 2004). Furthermore, managers also depart from optimality by using both advertising-to-sales ratio and competitive parity heuristics. Most importantly, the empirical results confirm the use of the “multiple stakes in the ground” practice of making ad budgeting decisions on the basis of market data. We emphasize that the extant literature (e.g., Farris and West 2007) employs managerial surveys rather than real-world market data and, consequently, the reported results are frequency counts summarized at the industry level—not at the disaggregated brand level—based on managers’ opinions about the budgeting methods they use. In contrast, the proposed framework provides the empirical weights for a specific brand on the basis of its actual ad spending and sales.
Conceptual Development
We consider both survey-based descriptive studies and normative studies to identify the salient methods managers use to set the advertising budget. Our review suggests that budgeting methods can be grouped into the following four broad categories: (1) baseline advertising spending, representing a certainty-based method; (2) adaptive experimentation, representing an uncertainty-based method; (3) percentage of sales (A/S ratios); and (4) competitive parity. The first two represent analytics-driven approaches, and the latter two are commonly used heuristics. We next review each method by discussing relevant literature.
Baseline Advertising Spending
A method focused exclusively on baseline spending reflects analytical thinking about cost control and profit maximization (Wang and Zhang 2008). For example, studies on the topic of optimal advertising spending have suggested that optimizing advertising allocation depends on the advertising effectiveness, margin, and discount rate (for a review, see Vakratsas and Naik 2007). More recently, Raman et al. (2012) derived the optimal solution when advertising effectiveness, margin, and discount rate vary over time. The existence of a closed-form solution suggests that managers can use optimal spending as a method for setting advertising budgets. At the same time, quantitative methods are difficult to implement, and so managers set aside a fixed amount as the baseline spending. Therefore, the baseline spending method reflects the optimal advertising level conditional on managerial knowledge of advertising effectiveness. In terms of performance implications, Wang and Zhang (2008) have suggested that constant spending can sustain sales in a stable market and overcome sales decline.
Of course, a priori managerial knowledge with complete certainty regarding advertising effectiveness, as in Raman et al. (2012), is a strong assumption given the presence of many different intervening factors such as competition, advertising wear-out, and unforeseen exogenous shocks. Therefore, managers may deviate their spending with the goal of learning about ad effectiveness through adaptive experimentation.
Adaptive Experimentation
Managers occasionally undertake field experiments by intentionally manipulating advertising levels to inject exogenous variation with the hope of discovering advertising effectiveness and its bounds (e.g., Ackoff and Emshoff 1975; Eastlack and Rao 1989). Random assignment of advertising timing, campaigns, or regions help rule out confounding factors to permit causal inference (e.g., Sahni 2015). The main drawback of field experiments, however, is that managers learn about ad effectiveness only at the intervention time, or for specific campaigns and test regions, and relative to the predetermined controlled campaigns/regions. In other words, the discovered ad effectiveness is localized in the space-time setting of the field experiments. Over time, this experimental knowledge is implemented to all regions, as it would be unprofitable and certainly unwise to restrict some regions to being permanent control units given a successful intervention or to keep permuting various regions as control units and not reap the benefits of a successful test.
So, as experiments end naturally, business-as-usual settles in and managers continue to face the need to understand how ad effectiveness varies over time for a host of factors beyond those tested or potentially tested under experimental conditions, such as copy and restoration wear-out (Naik, Mantrala, and Sawyer 1998), product life cycle stage (Kolsarici and Vakratsas 2015; Osinga, Leeflang, and Wieringa 2010), ad content (Kolsarici and Vakratsas 2010), competitive interference (Danaher, Bonfrer, and Dhar 2008), or product harm crisis (Rubel, Naik, and Srinivasan 2011; Van Heerde, Helsen, and Dekimpe 2007). In addition, temporal variation may be due to seasonality and coordination with promotional campaigns. The presence of time-varying advertising effectiveness suggests that managers must learn continuously about the impact of their advertising campaigns.
To this end, adaptive experimentation facilitates managerial learning regarding changes in advertising effectiveness. In their discussion of adaptive experimentation, Pekelman and Tse (1980, p.322) observe, “A useful experiment is the one which is conducted continuously over time.” An “experiment” does not have to be an intentional design localized in space-time; rather, it can involve introducing a variation into a constant setting. The fact that managers change ad spending over time and it induces changes in brand sales affords them steady opportunities to learn about ad effectiveness. However, this variation in ad spending need not be exogenous, and so managers should account for the endogenous nature of ad spending as in this study (see Equations 5 and 7) or control for endogeneity as in Varian’s (2016) review (e.g., instrumental methods, regression discontinuity, differences-in-differences).
Another advantage of adaptive experimentation is that managers can learn not only about time-varying ad effectiveness but also time-varying uncertainty in ad effectiveness. Then, according to the hypothesis grounded in the dual control theory (see Filatov and Unbehauen 2004), managers can set the ad budget proportional to the uncertainty in ad effectiveness (we elaborate on this in the section “Analytics-Driven Budgeting Decision: Dual Control”). Finally, experimentation differs from the practice of pulsing; the latter reflects the timing and spacing of media schedules (see Vakratsas and Naik 2007), whereas the former is focused on the setting of ad budgets proportionately to uncertainty in ad effectiveness.
Percentage of Sales Heuristic (A/S Ratios)
Interviews with marketing managers suggest that almost no advertising budget decision starts from a “zero basis” (Low and Mohr 1999). Instead, managers typically rely on their judgment and beliefs regarding ad effectiveness, as well as recent performance, to form a starting point for budgeting deliberation. The surveys by Piercy (1987) and Bigné (1995) indicate that managers rely extensively on A/S ratios to determine their budgets. Although largely considered an “unsophisticated” method applied in “top-down” budgeting processes in which top management’s influence is greater, A/S is anchored on performance expressed by either past sales or projected future sales. Nerlove and Arrow (1962) showed that the A/S ratio is proportional to the ratio of advertising and price elasticities, a finding that Raman (1990) extended for the stochastic case. Thus, the A/S is a “responsive” budgeting rule (Wang and Zhang 2008), albeit benchmarked only against a brand’s own performance and effectiveness without taking into account the competitive environment.
The performance implications of the A/S method depend on the market conditions. Implementation of the A/S method in a growing market will lead to sustained growth but will lead to sales erosion in a declining market. The predominance of this top-down budget process is possibly due to the lack of top-level management confidence in the role of advertising. It also reflects a belief in reverse causality in which sales determine advertising rather than the other way around (Danenberg et al. 2016).
Competitive Parity Heuristic
There are two approaches to the competitive parity method: one uses absolute benchmarks by setting the budget roughly equal to that of the competition, and the other uses relative metrics by setting the share-of-voice (SOV) to be roughly equal to share of market (SOM) (Farris and West 2007). The latter is also known as the “SOV equals SOM” method and is preferred by managers operating in mature markets (Danaher, Bonfrer, and Dhar 2008). Naik, Prasad, and Sethi (2008) analyzed the N-brand dynamic game and showed that the Nash equilibrium spending for each brand is proportional to the total market share of other brands. In other words, a large (small) brand should spend less (more) than its fair share in dynamic oligopoly markets. This normative finding counters the SOV equals SOM method. Therefore, the use of the competitive parity heuristic (i.e., ad spending proportional to market share) constitutes evidence for managerial departure from optimal behavior. Another drawback of the competitive parity heuristic is that it may lead to escalation and, consequently, erode ad effectiveness due to increased clutter as brands try to continuously keep up with their competitors (Danaher, Bonfrer, and Dhar 2008).
Given the well-documented practice of “multiple stakes in the ground,” a model of advertising budget decision process should allow for the possible use of a combination of the four salient methods discussed in this section. The next section shows how to incorporate the four budgeting methods in a dynamic model of ad spending, assess their relative contributions, and estimate and infer time-varying ad effectiveness and its uncertainty.
Model Development
Our model incorporates the previously discussed two main features of the ad budget decision process: (1) use of a combination of multiple methods and (2) the role of ad effectiveness uncertainty. To accommodate the first feature, we assume that managerial decision making is characterized by bounded rationality and is driven by both analytics and heuristics considerations. The analytics-driven component is informed by dual control theory, whereas the heuristics-driven component consists of the A/S ratio and competitive parity methods. For the second feature, we model sales and ad effectiveness in a state space framework that captures both time-varying ad effectiveness and its associated uncertainty. We first discuss the analytics-driven component of the ad budget decision and then formulate the state space model.
Analytics-Driven Budgeting Decision: Dual Control
Prior literature on optimal ad budgeting assumes that managers know with certainty the parameters of the advertising response function (e.g., Naik, Raman, and Winer 2005; Tull et al. 1986). Under this assumption, managers can determine the optimal budget using standard optimal control theory. By contrast, in the presence of uncertainty in ad effectiveness, managers must dually focus on both brand profits and parameter learning. Adaptive dual control theory applies perfectly to this dual objective setting, as it envisions a manager who finds the control policy (i.e., ad spending over time) and learns about the uncertain model parameters simultaneously. Although the original formulation of the optimal adaptive dual control problem, due to Feldbaum (1965), is unsolvable, the bicriterial synthesis method, developed a decade later (see Wittenmark 1975), successfully addresses the problem. As the name “dual control” suggests, the bicriterial approach maximizes two objective functions that correspond to the two goals of finding the control policy and learning about the uncertain parameters of a dynamic system (see Filatov and Unbehauen 2004 for more details). As discussed in the “Conceptual Development” section, Little (1966) and Pekelman and Tse (1980) applied the ideas in dual control theory to promotions and advertising, respectively, to lay the pioneering groundwork for adaptive experimentation in marketing.
To make the ideas of dual control theory precise, we specify a commonly used dynamic advertising–sales model with sales carryover and other covariates:

where

where the drift equals
The Appendix derives the profit-maximizing advertising trajectory,

Equation 3 combines the baseline spending and the increment caused by the uncertainty in ad effectiveness, thus suggesting that managers can rationally depart from optimality. In other words, nonoptimal does not imply nonrational. Besides the rational departure from optimality, the realities of ad budget setting suggest that managers may need to combine analytically driven decisions with heuristics, which represent managerial experience and firm-related practices. Therefore, we augment the analytics component by incorporating the role of heuristics in advertising budget decisions.
Augmented Budget Decision Model: Incorporating Heuristics
If managers were to rely exclusively on analytical approaches to set ad spending, Equation 3 would accurately reflect the budget decision. However, as our literature review suggests, managers also use heuristic approaches. Thus, we augment Equation 3 by incorporating the heuristic influences of the A/S ratio and competitive benchmarking. According to the A/S ratio method, ad spending is proportional to expected sales,

Finally, we combine the analytics and heuristics budget decision components (Equations 3 and 4) with relevant covariates to arrive at the augmented advertising budget decision

where
Equation 5 suggests that the advertising budget depends on analytical and heuristic decision rules as well as various brand and market related variables. Thus, it reflects a bounded rationality approach to resource allocation in which, in addition to analytics, managers rely on their own judgment and experience (Low and Mohr 2000). More specifically, managers set aside a baseline budget
State Space Framework
The state space framework is commonly used in the marketing literature (e.g., Ataman, Van Heerde, and Mela 2010; Bruce 2008; Kolsarici and Vakratsas 2010; Kolsarici and Vakratsas 2015). It is represented by two sets of equations: the transition equation and the observation equation. In a vector-matrix form, the transition equation can be expressed as follows:
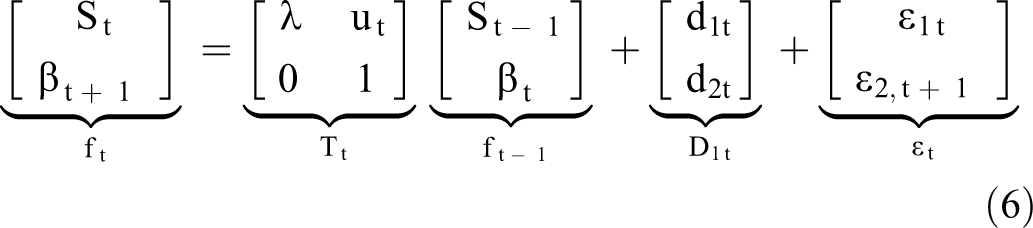
where
We next link the state vector to the observation equation

where the vector
Finally, we explain how the proposed modeling framework accommodates over- or underspending. Figure 1 presents the second row of Equation 7 that connects to Equation 5 substantively, and Table 1 describes the notations. The y-axis in Figure 1 depicts the observed spending

Graphical illustration of the second row in Equation 7.
Summary of Notation.

In summary, the proposed modeling framework addresses five key issues. First, the transition equation (Equation 6) simultaneously captures the dynamics in sales and advertising effectiveness over time. Second, the ad budget is decomposed into four components: baseline spending, adaptive experimentation proportional to ad effectiveness uncertainty, and the two heuristic methods of A/S ratio and competitive parity. Third, the advertising budget decision depends on covariates such as seasonality, price, promotions, coupons, and annual controls. Fourth, the state space framework directly incorporates the endogenous nature of advertising. Finally, as discussed previously, Equation 7 accommodates over and underspending.
Estimation Approach
The transition and observation equations are estimated using the Kalman filter, which is uniquely the best estimator (i.e., it yields the minimum mean squared errors) of the state vector
Kalman Filter Recursions.

The extent of uncertainty in ad effectiveness at each instant,
Next, we maximize the log-likelihood function to obtain the parameter estimates:

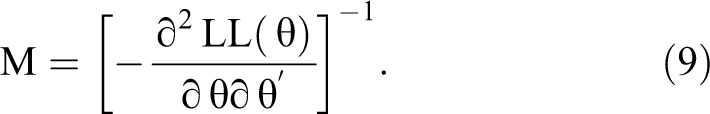
To infer significance of the estimated parameters, we obtain the standard errors from the square root of the diagonal elements of the inverse of the information matrix:
To safeguard against unknown forms of misspecification, we conduct robust inference using the sandwich estimator (White 1980):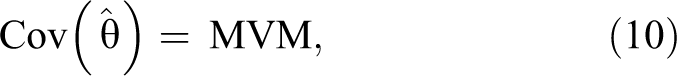
where
Finally, by applying the Delta method (see Davidson and MacKinnon 2004, p. 205), we obtain the standard error for the carryover effect as follows:
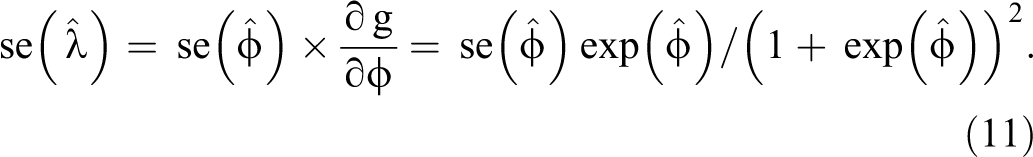
The standard errors of positively constrained parameters are given by
Monte Carlo Simulations
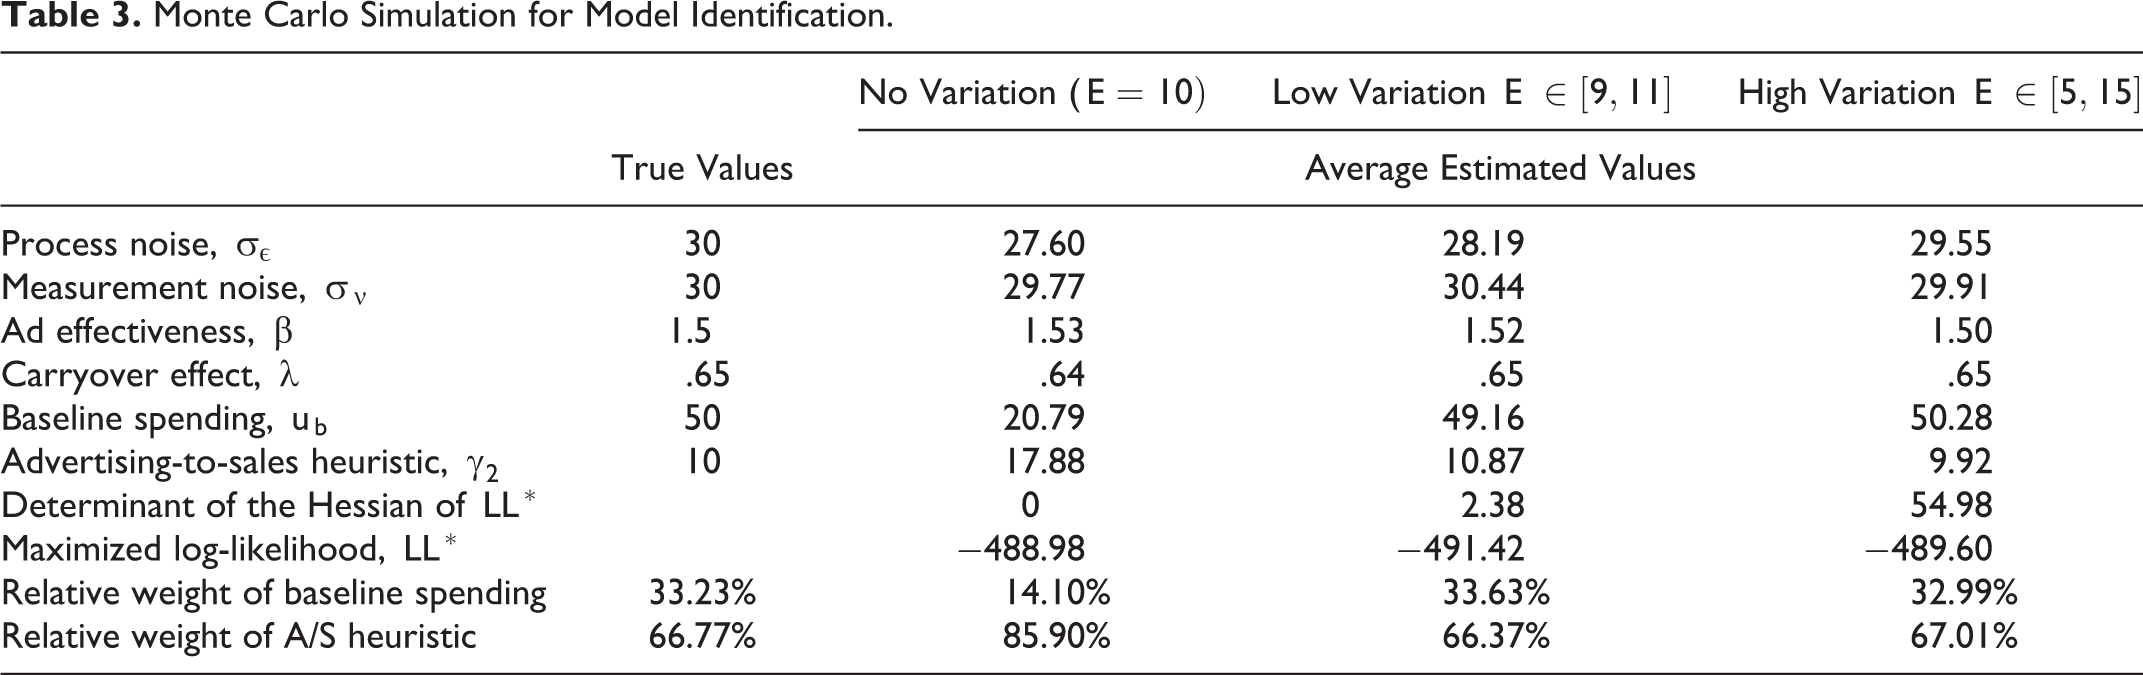
Although the proposed model seeks to assess the contributions of the different methods to the total budget, we acknowledge that disentangling the contributions when the shared variation between them is high would be difficult. To investigate this issue, we use a simplified version of Equation 5 with the baseline spending and A/S ratio components only representing analytical and heuristic decision rules, respectively. We conduct Monte Carlo simulations under three conditions of variation in the advertising-to-sales heuristic—constant expected sales (i.e., no variation), low variation in expected sales, and high variation in expected sales—operationalized using the expected sales
For the three conditions, Table 3 presents the actual and mean estimated parameters, average log-likelihood, average determinant of the Hessian matrix of the log-likelihood function, and the true and average estimated level importance of the two advertising rules in contributing to the overall ad budget (see the “Ad Budget Decomposition” section for details on “level importance”). In the no variation condition, the Hessian is singular because its determinant equals zero, so the model is not identifiable. This is also evident from the parameter estimates and the weights of baseline spending and the A/S heuristic, which depart significantly from their true values. In other words, if sales do not exhibit variation, both baseline spending and the A/S heuristic predict rather flat advertising expenditures and it is not possible to distinguish between the two rules. By contrast, for both the low and high variation conditions, Table 3 reveals that the estimated parameters and weights are retrieved satisfactorily. Parameter recovery improves as the variation in expected sales increases. Thus, the presence of variation in expected sales is sufficient for estimating the parameters. We do not expect identification issues in the empirical application because sales and method-based spending exhibit sufficient variation over time and the estimated Hessian was nonsingular.
Monte Carlo Simulation for Model Identification.
We also conduct simulations with all advertising decision rules. Specifically, we generate 1,000 data sets from the system of Equations 6 and 7 using random walk ad effectiveness as per Equation 2 and expected sales and competitive spending from the uniform distribution U(5, 15). The true parameter vector is
Empirical Analysis
Data Description
For the purpose of generalizability and understanding the nuances of advertising budgeting decisions, we test our model on eight brands from three product categories. Specifically, we use data from the categories of hybrid cars, beer, and yogurt in the U.S. market. The categories differ with respect to the product type (i.e., durable for hybrid cars and nondurable for consumer goods), maturity (i.e., new markets for hybrids and established ones for consumer goods), level of fragmentation (i.e., consolidated for hybrids, medium fragmentation for yogurt, and high for beer), and frequency of purchase. We focused on the top performing brands—namely, Toyota Prius and Honda Civic in hybrids cars, which had a combined market share of 95%, Yoplait and Danone in the yogurt category, which had a combined market share of 62%, and Bud Light, Budweiser, Coors Light, and Miller Lite in the beer category, which had a combined market share of 39% during the observation periods. These brands also represent the top advertisers in their respective categories.
The data sets consist of monthly observations of sales, advertising, and various covariates, covering a 68-month period from January 2005 to August 2010 for hybrid cars and a 132-month period from January 2001 to December 2011 for the yogurt and beer categories. The sources for sales data are JD Power and Associates (JDPA) for hybrid cars and the IRI Marketing data set (see Bronnenberg, Kruger, and Mela 2008) for the packaged goods brands. The media spending data represent aggregated monthly spending across all media outlets for the advertised brand (e.g., TV, print, newspaper, internet, outdoor) and are sourced from Kantar media. We include several covariates to capture the drivers of dynamic state variables. Specifically, we account for the effects of price, promotions, coupons, annual controls, and seasonality on multiple outcomes such as sales, ad effectiveness, and ad spending for the beer and yogurt brands. We use federal tax credits as a proxy for new model introduction for the hybrid car data.
Operationalization of Variables
The IRI data consist of weekly store-level sales, promotions, coupons, and price for each SKU between 2001 and 2011. We aggregated the packaged goods data from (1) SKUs to brand, (2) weekly to monthly level, and (3) store to market level, as follows: First, we aggregated the sales, price, coupon, and promotions data from SKUs to brand and store to market level. In the aggregation process, we standardized the variables where possible (e.g., price per ounce) and averaged across SKUs weighted by the store-level SKU sales. We used a similar procedure to obtain the mean price promotion and mean coupon probability for each brand at the market level. Second, we aggregated these brand and market-level weekly variables to monthly level by taking into account the start and end dates of the observed weeks. When a week spanned over two consecutive months, we performed the aggregation by taking the weighted average of variables across the number of days/week in each month assuming uniform distribution across the days of the week. Third, we dropped feature and/or display variables due to the high correlation of their frequency with price promotions. The resulting brand-level variables exhibited adequate variance for estimating the determinants of brand-specific budgeting decisions. Finally, we adjusted prices for inflation by dividing them by the consumer price index of each month for the respective product category according to the U.S. Bureau of Labor Statistics. Table 4 presents the descriptive statistics.
Descriptive Statistics.

Note: IRI data covers roughly 5% of the stores in the United States. Therefore, sales values reported for the CPG brands are sums across stores that are members of the IRI panel and not estimates of the total market volume.
Figure 2 presents the evolution of advertising and sales for each brand. Across all brands, ad spend varies over the observation period, contrary to the constant optimal advertising suggested in the literature (e.g., Naik and Raman 2003). This variation is higher for the hybrid car brands than their consumer packaged good (CPG) counterparts. Moreover, beer brands are mature and exhibit less dynamics. Yogurt, although established as a category, displays growth in sales, and the emerging hybrid cars category also exhibits growth in sales. These differences across categories can potentially translate into diverse scenarios with respect to the combination of methods used for the advertising budgeting decision, a point on which we subsequently elaborate.

Sales and advertising over time.
Parameter Estimates
Table 5 reports parameter estimates and t-values (in parentheses) from the proposed model for the eight brands. Four key findings deserve attention. First, the majority of brands use a combination of methods in their advertising budgeting decisions, corroborating the practice paradigm of “multiple stakes in the ground.” However, they do so at varying degrees, as evidenced by the magnitudes of the corresponding parameter estimates, which are mostly significant at the 95% confidence level. Because the variables are scaled to similar operating ranges to achieve convergence in estimation, the magnitudes of the coefficients are comparable to some extent. Second, significant parameters have the expected signs. For example, promotions and coupons have positive effects on sales for the CPG brands. Similarly, price influences sales negatively by decreasing advertising spending and effectiveness. The direct effect of price on sales is insignificant, which is likely due to the limited variation (i.e., the median coefficient of variation is 3.23%) of the inflation-adjusted price variable akin to Liu and Shankar (2015). For hybrid cars, tax credits do not affect sales directly but boost the advertising effectiveness of Prius. Third, for many of the CPG brands, promotions and coupons have a negative impact on ad spending and tend to also have a negative impact on ad effectiveness. Thus, promotional activities not only reduce ad spending directly but also diminish ad effectiveness, which, in turn, reduces the optimal ad spending—a promotion “double whammy.”
Estimation Results.

Notes: t-values in parentheses. *p = .10, **p = .05, ***p = .01. Annual controls are omitted from the table for brevity.
Finally, Figure 3 displays time-varying advertising effectiveness and its corresponding 95% confidence intervals for all brands. The brands in the mature CPG categories (beer, yogurt) exhibit much less ad effectiveness uncertainty than the brands in the emerging niche of hybrid cars, as evidenced by the narrower confidence bands. Since CPGs and hybrid cars differ regarding their product life cycle stage, the resulting differences in ad effectiveness uncertainty are plausible. We use the proposed model and the Kalman filter estimation to quantify the time-varying uncertainty for each brand through the trajectory of Time varying ad effectiveness and its uncertainty.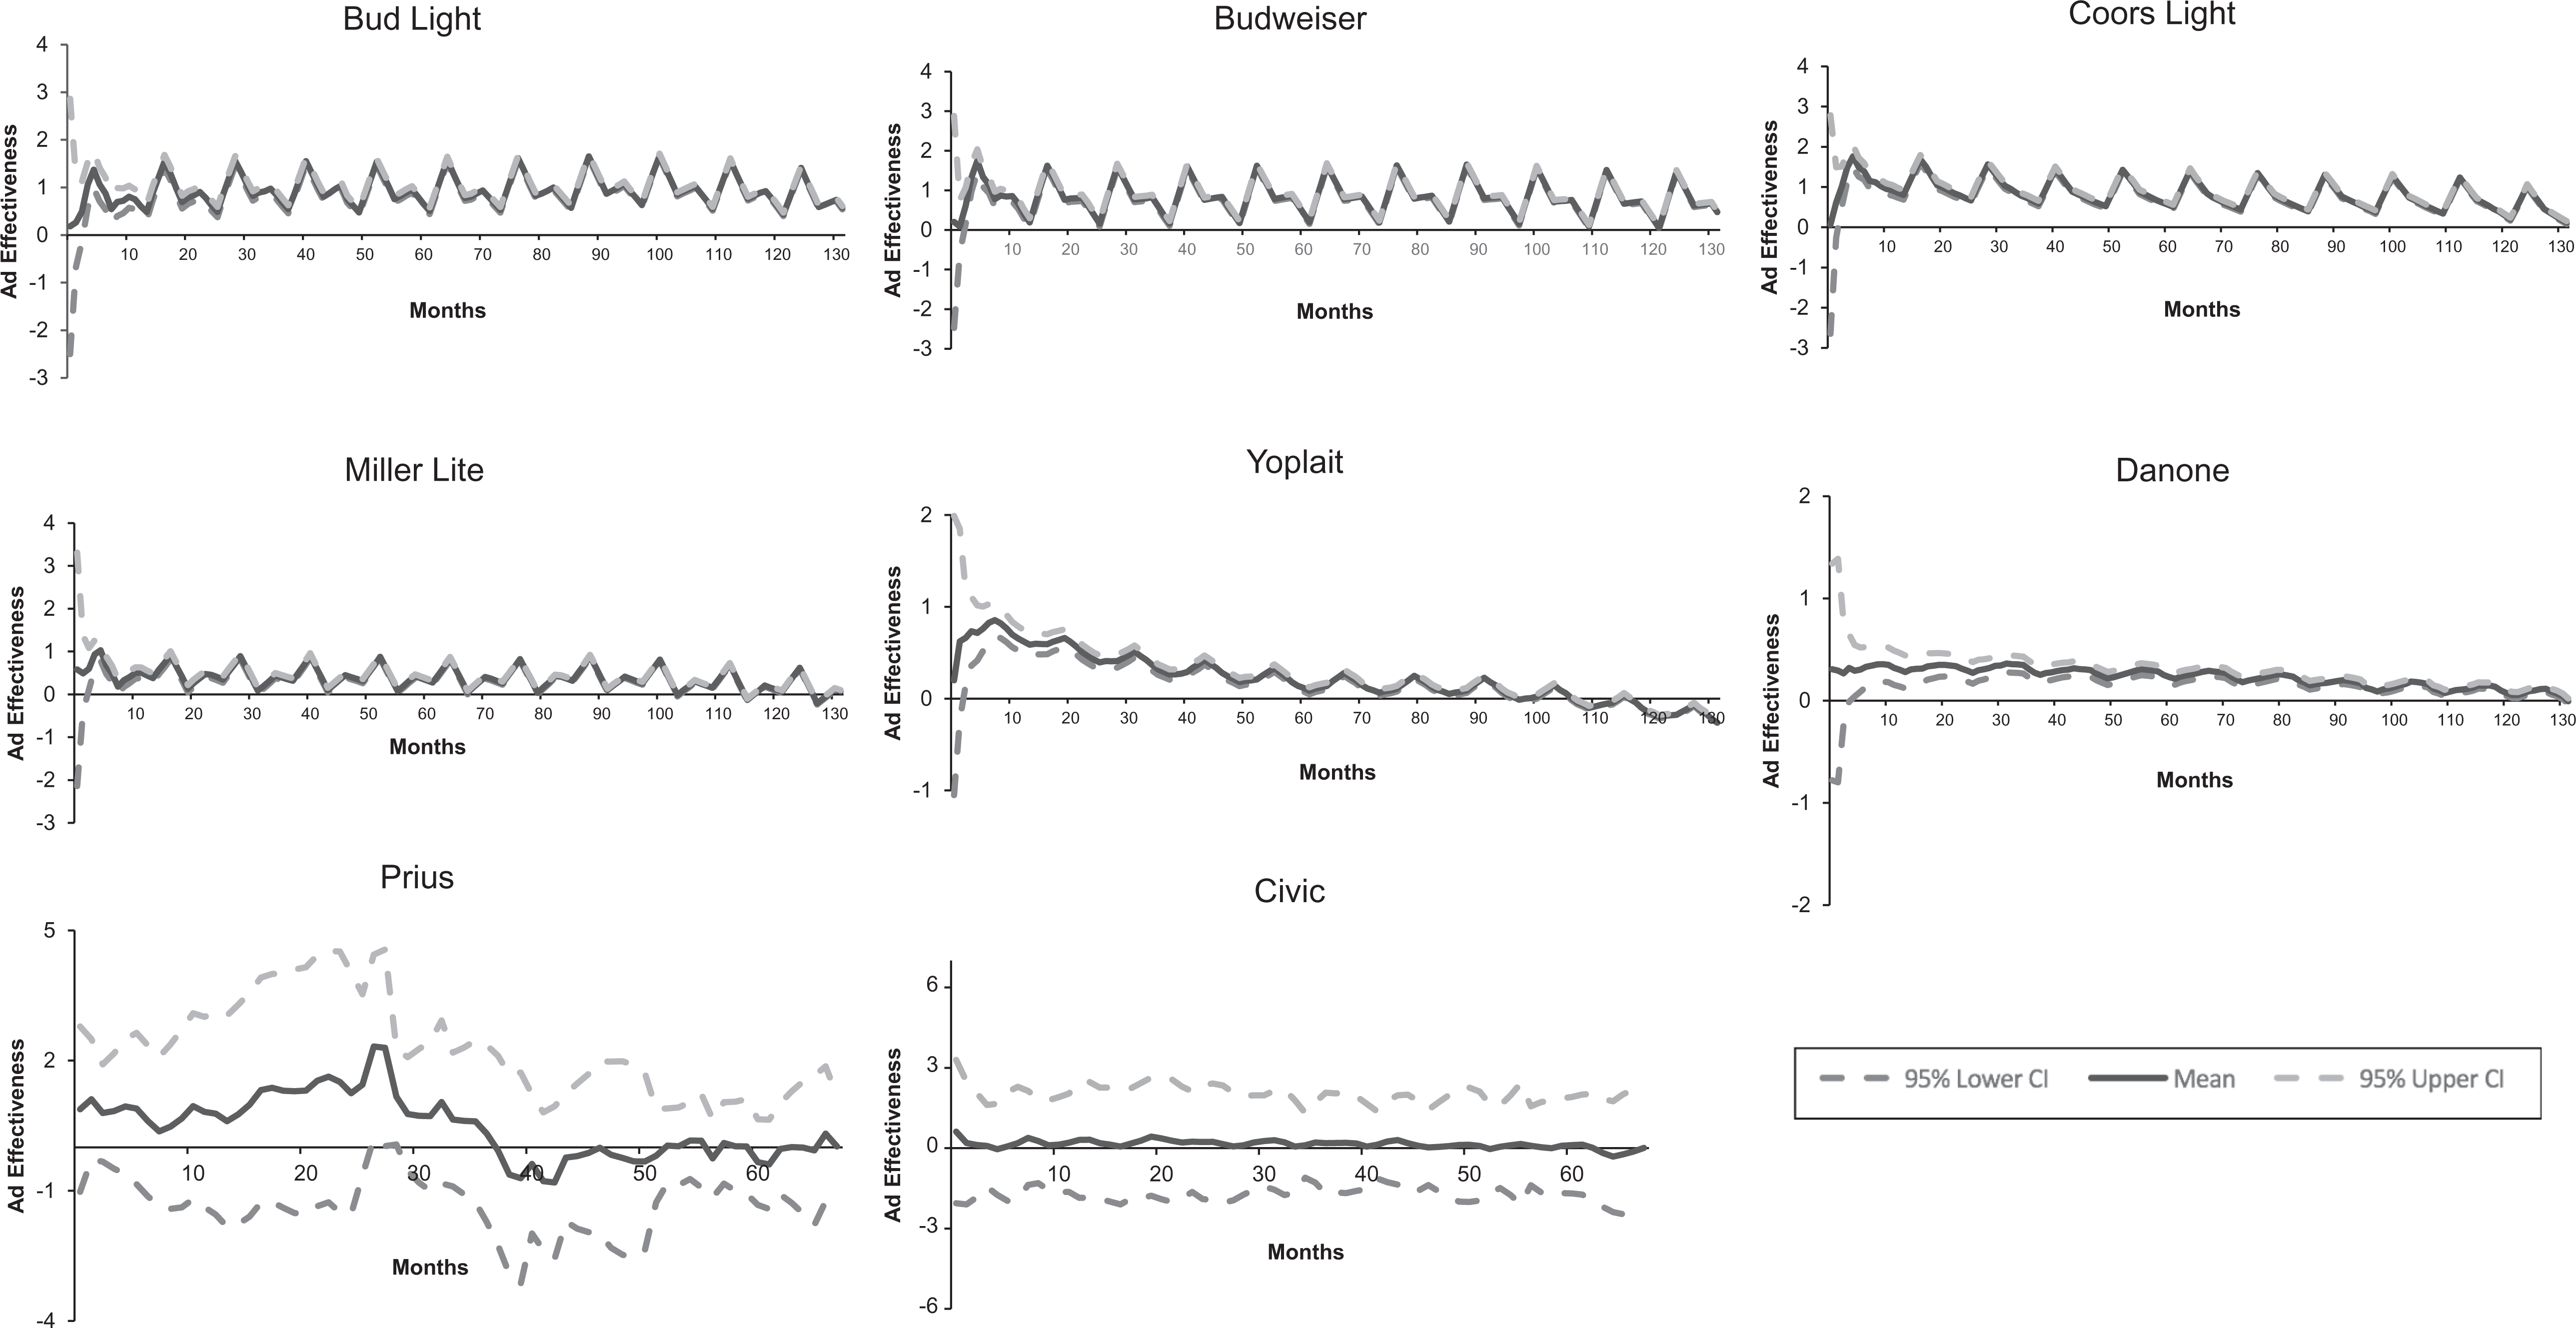
Model Validation
To validate the proposed model, we first compare its performance with that of a benchmark model with no budget decomposition. Specifically, the benchmark model is specified by


In Equation 13, we delete the second row of Equation 7 to exclude budget decomposition, and we replace
Model Validation.
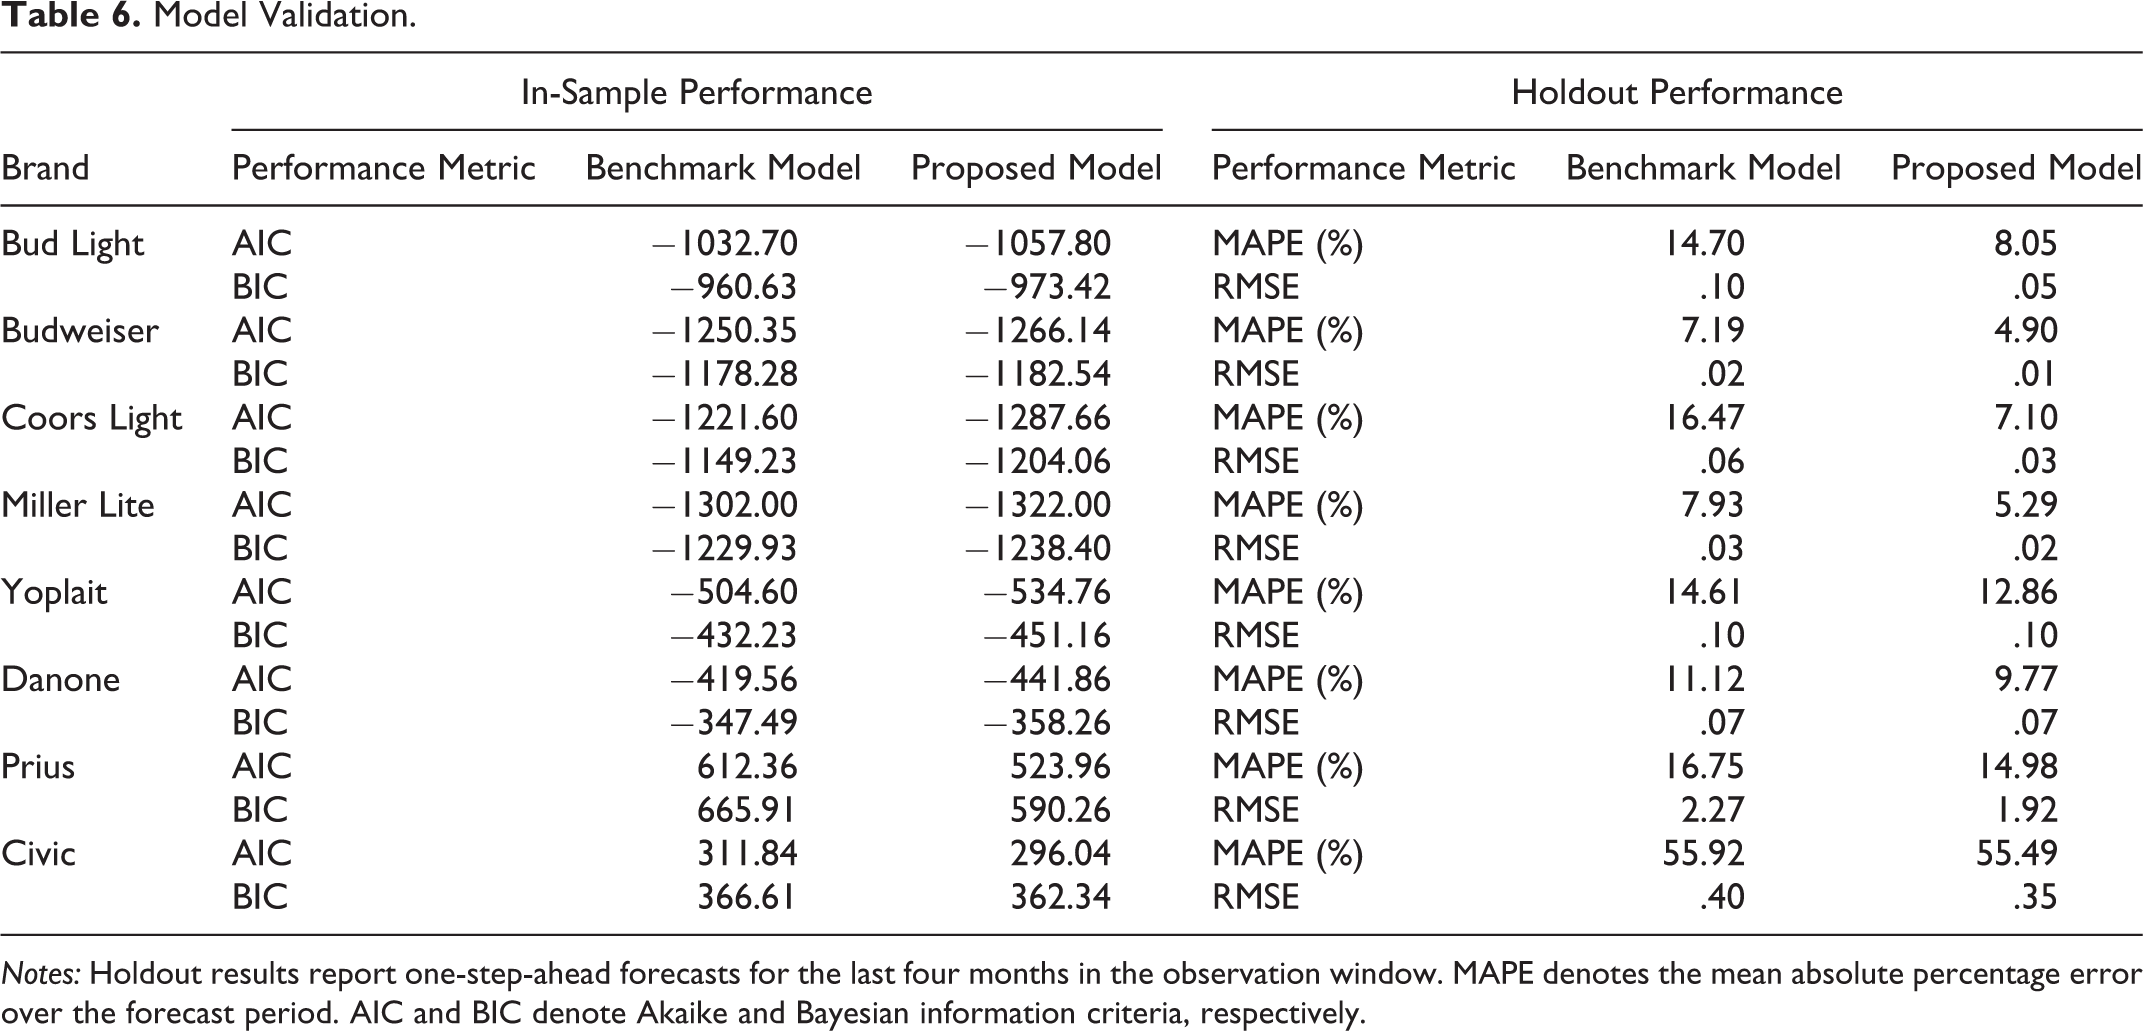
Notes: Holdout results report one-step-ahead forecasts for the last four months in the observation window. MAPE denotes the mean absolute percentage error over the forecast period. AIC and BIC denote Akaike and Bayesian information criteria, respectively.
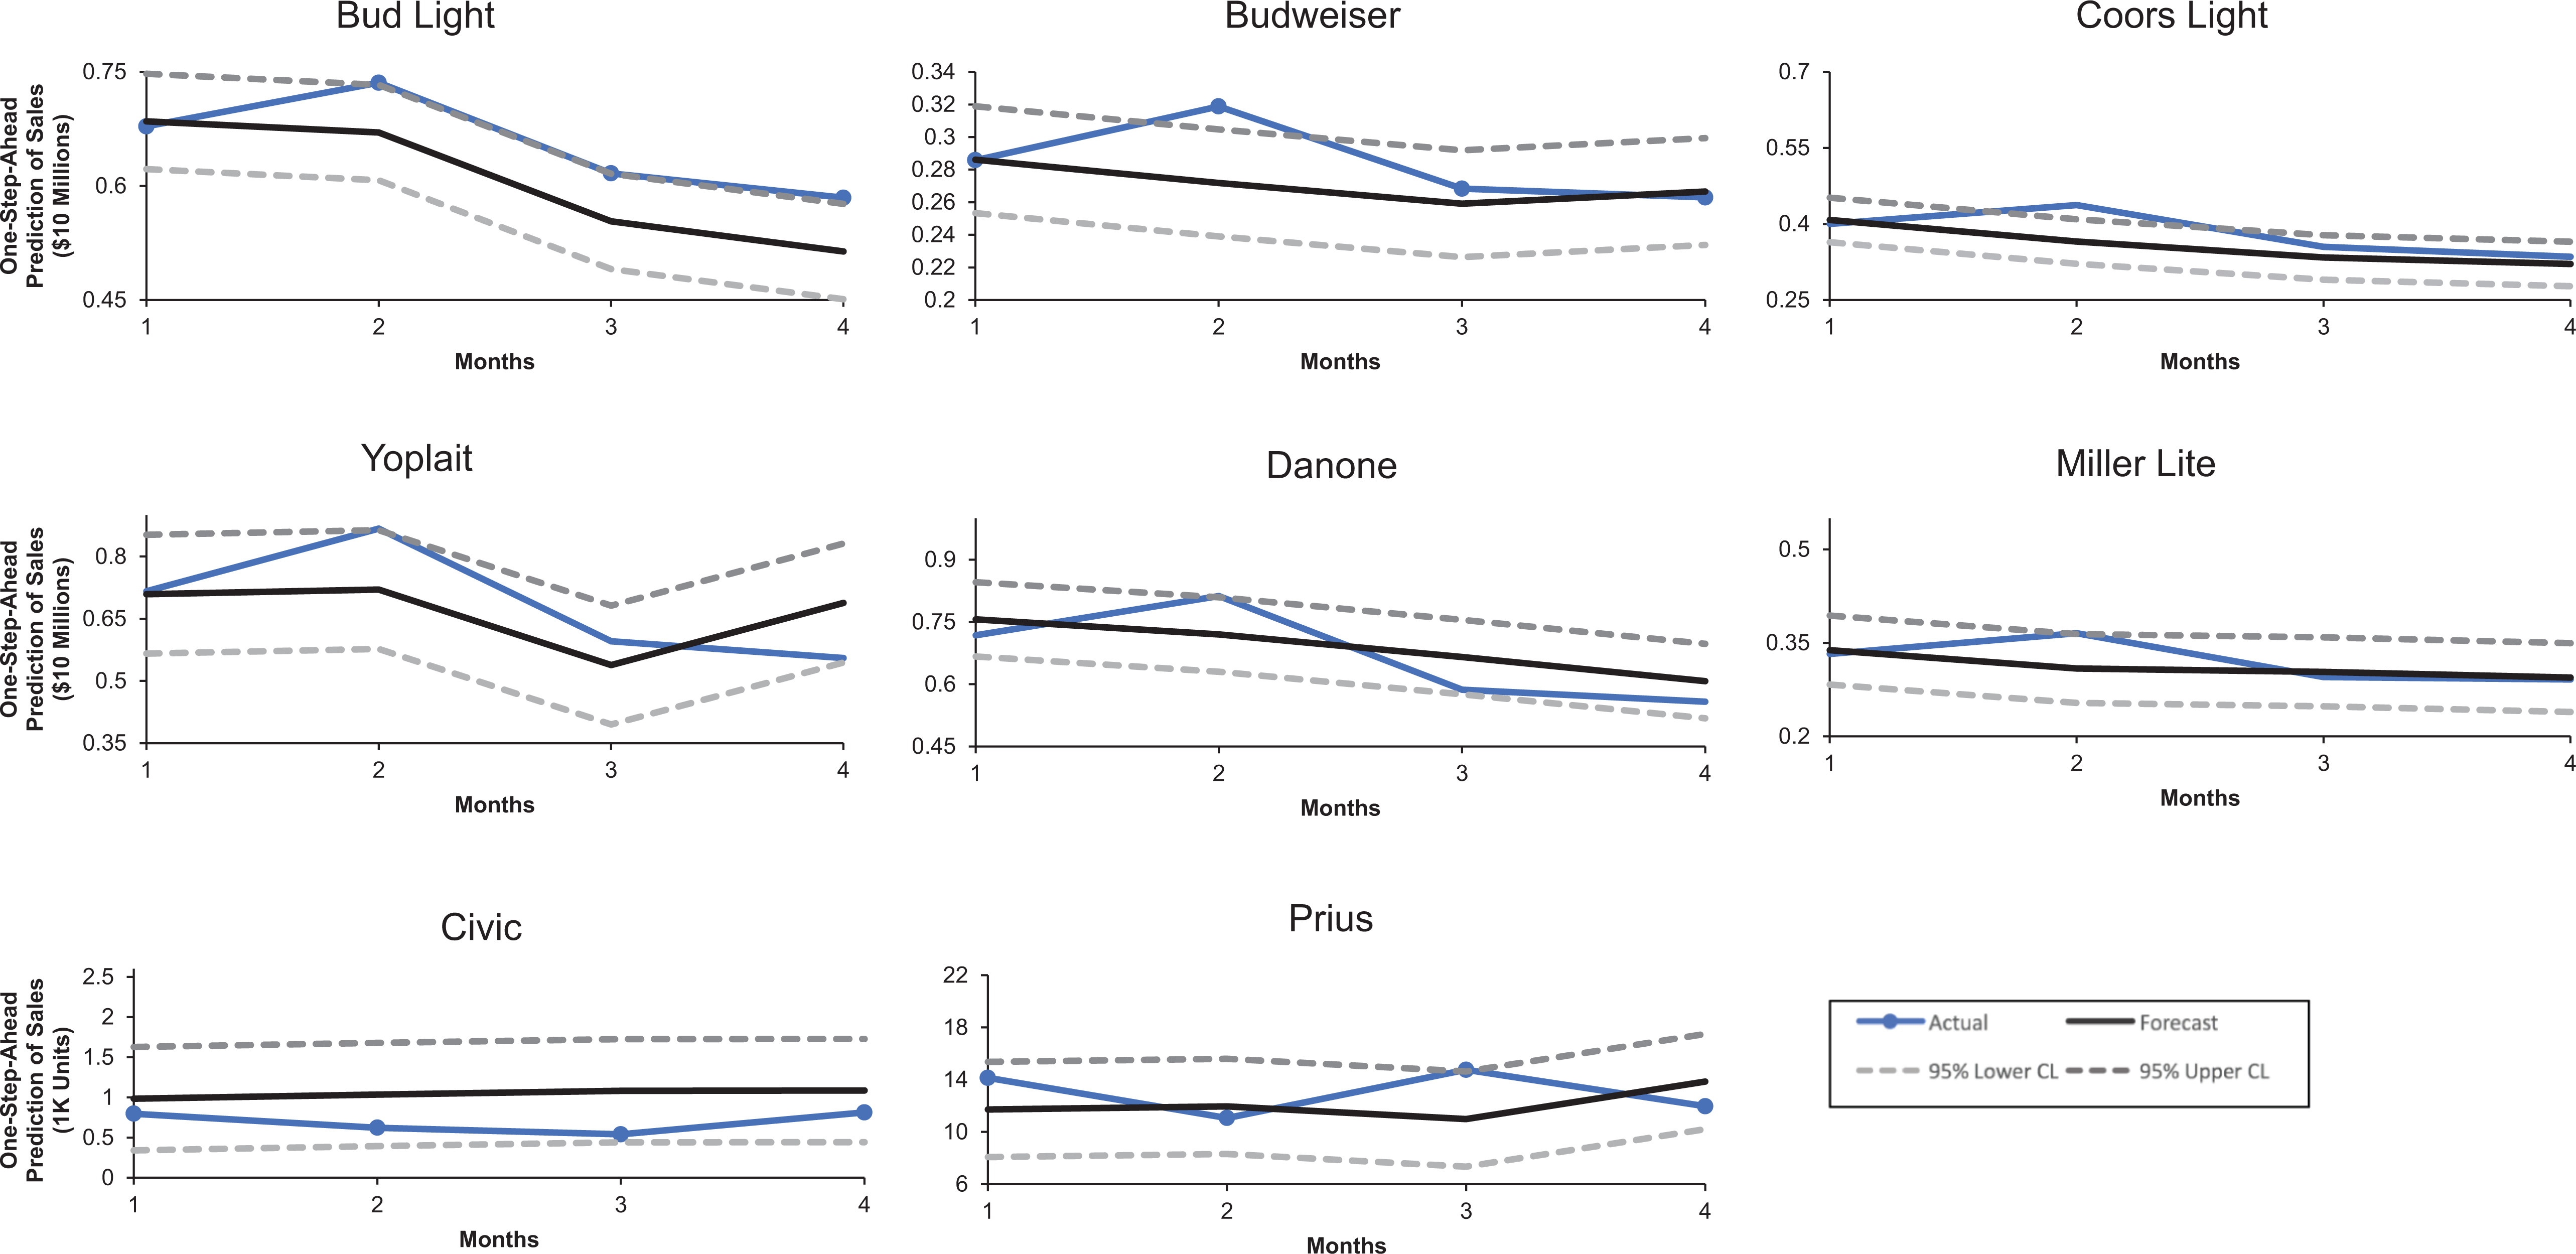
One-step-ahead forecasts.
Finally, we assess multicollinearity using pairwise correlations between decision rules. Table 7 presents the median and range of pairwise correlations between budgeting methods for the eight brands. The average absolute correlation across the eight brands is .11. The two highest correlations are between competitive parity and the A/S heuristic for Yoplait (.61) and competitive parity and adaptive experimentation for Prius (−.65). However, as Table 5 shows, Yoplait’s estimated effect (.39) and t-value (2.41) for the A/S rule and the estimated effect (.52) and t-value (20.14) for the competitive parity rule are nonzero and significant. Similarly, for Prius, the estimated effect (1.40) and t-value (8.23) for adaptive experimentation and the estimated effect (.58) and t-value (119.44) for the competitive parity rule are nonzero and significant, thereby reassuring that collinearity does not substantively affect the empirical results.
Correlations Between Budget Decision Rules.

Notes: Figures across eight brands.
Implications
Ad Budget Decomposition
To explore the insights from our findings, we convert the parameter estimates corresponding to the different decision rules in Table 4 into relative weights. In order to succinctly present the relative weights, we re-express the expected observed spending resulting from the second element of the observation vector in Equation 7 together with Equation 5 as follows:

where

where
Relative Contributions.

Notes: Percentages rounded to nearest integers.
The results shed light on how managers combine the different analytics and heuristics-based methods to determine their ad spending and how such decisions vary across brands and categories. For each brand, we also report advertising elasticities, which range from .07 to .27 and broadly comport with those reported in prior literature (Assmus, Farley, and Lehmann 1984; Sethuraman, Tellis, and Briesch 2011).
Table 8 indicates that the combinations of budgeting rules vary across brands and categories. Three key observations emerge: First, car brands tend to use experimentation to a greater extent because hybrid cars represent an emerging niche characterized by an uncertain market environment with limited knowledge of consumer response to a new technology and/or brand advertising. Second, yogurt brands use almost exclusively heuristics-based methods, maintain a similar balance between A/S and competitive benchmarking, and exhibit similar advertising elasticities. Third, beer brands use a mix of approaches, with the leading brand (Bud Light) relying on baseline spending, Coors Lite using a balance of analytics and heuristics methods, and the other two (Budweiser and Miller Lite) relying on heuristics but with different combinations of the A/S and competitive benchmarking methods.
Most importantly, ad budget decomposition not only offers new insights for firms’ internal audits of their own brands and business intelligence on competing brands but it also reveals information at the brand level on the basis of market data, which would be impossible using the survey-based approaches in the extant literature (e.g., Farris and West 2007) that summarize at the industry level the frequency counts of managers’ opinions on which methods they use in their companies. More specifically, our findings suggest that budgeting decisions are brand-specific, and one size does not fit all as far as the budgeting mix is concerned. Rather, different methods and combinations are deployed by different brands, possibly to leverage conditions such as market leadership, market maturity, and category growth. For example, car brands competing in an emerging niche tend to use more experimentation than mature CPG brands due to the higher uncertainty characterizing advertising effectiveness. In terms of heuristics, Prius relies considerably on competitive parity to maintain its leadership, whereas Civic relies on the A/S ratio method, possibly to leverage growth and strengthen its market position (see also Wang and Zhang 2008). Similarly, the yogurt brands, which enjoyed growth over the observation period, rely on A/S to leverage market growth conditions.
Evidence for Adaptive Experimentation
A primary goal of this study was to empirically test the hitherto untested hypothesis—that experimentation budget is proportional to the uncertainty in ad effectiveness—grounded in the dual control theory (see Filatov and Unbehauen 2004). This study is the first to furnish strong empirical evidence. Theoretically, we expected ad budgets to increase proportionately to the uncertainty in ad effectiveness, or
Revenue Implications of Shifting to Adaptive Experimentation
Would more experimentation benefit brands? To answer this question, we conduct simulations to reallocate heuristic spending to experimentation. Specifically, we shift 50% of the ad budget due to competitive benchmarking to experimentation for each brand and calculate the change in average sales over the observation period. In the process, we kept the ad budget for each year fixed to its observed value and performed the budget reallocation on an annual basis. Here we present the key steps of this simulation: Calculate the estimated contribution of the four decision rules to the advertising budget: Calculate the aggregate contribution of the competitive parity heuristic for each year and reallocate 50% of it to experimentation; For each year, assign the annual shift calculated in Step 2 to experimentation for each month weighted by the experimentation spending of that month (i.e., each month’s additional allocation is proportional to that month’s experimentation contribution to the annual experimentation contribution); Evaluate the new total predicted sales from the simulated contributions and calculated the percent change from the total predicted sales prior to the reallocation.
Table 9 presents the simulation results. All brands experience a lift in sales due to the increased experimentation spending. The change is modest for brands in the mature categories, ranging from .97% to 1.89%. In contrast, the hybrid car brands benefit substantially, as evidenced by the double-digit sales lifts. The incremental benefit of experimentation is lower for Civic, at 12%, than the market leader Prius, at 23%. However, the shift represents 14% of the total budget for Civic versus 33% for Prius, thereby explaining the differential returns to experimentation between the two brands. These findings not only corroborate the arguments of dual control theory regarding the role of uncertainty in ad effectiveness but also show there is room for improvement by relying on more analytics to determine advertising budgets.
Shifting Allocation from Heuristics to Adaptive Experimentation.

Conclusion
Our analysis reveals that advertising budgeting is a complex process requiring managers to make decisions under uncertainty of ad effectiveness. To assess ad effectiveness, managers may undertake field experiments by manipulating ad spending over a fixed duration in chosen test/control regions. However, advertising field experiments are not common in practice because they typically lack the power to accurately measure ad effectiveness. Informative experiments can require more than 10 million person-weeks in test/control markets, making them costly and infeasible for many firms (Lewis and Rao 2015, p. 1941). More specifically, on the basis of 25 large field experiments, Lewis and Rao (2015, p. 1950) note that “…even a very successful campaign has a minuscule
Second, according to our analyses of eight brands from three categories, durable and nondurable at different stages of the product life cycle, managers can learn how to reverse engineer their budgeting processes by decomposing ad budgets into four methods: baseline spending, adaptive experimentation, advertising-to-sales heuristic, and competitive parity heuristic. This decomposition quantifies the relative contributions of each method, corroborating the “multiple stakes in the ground” paradigm of ad budgeting, which has so far been captured through surveys aggregating information at the industry level and relying on managers’ opinions (e.g., Farris and West 2007). In contrast, using our proposed model, managers can learn about the decomposition (1) of both their own (i.e., self-audit) and competing brand ad budgets (i.e., business intelligence) in their industry, (2) at the brand level rather than the aggregated industry level, and (3) based on market data, not managers’ opinions.
Third, we find that budgeting decisions are brand-specific even for brands belonging to the same corporate group (e.g., beer brands), which is consistent with previous empirical evidence provided by Anheuser-Busch experiments (Ackoff and Emshoff 1975) and Kraft’s product harm crisis in Australia (Van Heerde, Helsen, and Dekimpe 2007). Thus, our findings reflect the consideration of brand-specific needs in budget setting for multi-brand companies (Low and Mohr 1999) and the role of brand architecture (see Avery 2016, pp. 12–17; Hill, Ettenson, and Dane Tyson 2005). More specifically, due to their different market positioning and objectives, brands belonging to the same architecture of a multi-brand firm require different budgeting approaches, which may also be dictated by their market performance. We observe this reality in the beer category, in which Bud Light and Budweiser, the top selling brands of Anheuser-Busch, use different budgeting methods. Bud Light, the leading brand in a category in which ad effectiveness uncertainty is low, heavily relies on baseline spending to maintain its market leadership (Wang and Zhang 2008). In contrast, Budweiser, the number two brand in the Anheuser-Busch portfolio, experienced declining sales during the observation period, and its budget is determined predominantly by the A/S ratio heuristic. This could reflect an effort to make advertising spending commensurate with sales performance to justify advertising support.
Finally, pioneering articles of Little (1966) and Pekelman and Tse (1980) advocated the concept of adaptive experimentation, which was later grounded in the dual control theory (see Filatov and Unbehauen 2004), suggesting that the experimentation budget should be proportional to the uncertainty in ad effectiveness. This hypothesis was hitherto untested in the marketing literature. This study is the first one to provide empirical evidence that shows managers spend ad dollars proportional to the uncertainty in ad effectiveness, shedding light on the rationality of managers departing from profit-maximizing optimality. In other words, suboptimal behavior does not imply nonrational behavior.
Much more can be discovered by extending this study. Replication across many brands and multiple industries would reveal how relative weights depend on market conditions (e.g., scope) and brand positioning (e.g., role). Extension of the total budget split across analytics and heuristics subcomponents to each of the multimedia channels may yield novel insights. Finally, an empirical demonstration that a combination of different budgeting rules is the outcome of joint negotiations between multiple actors in the decision-making unit would make an important contribution to the canons of advertising.
Footnotes
Appendix: Stochastic Optimal Control of Advertising
Associate Editor
Peter Danaher
Declaration of Conflicting Interests
The author(s) declared no potential conflicts of interest with respect to the research, authorship, and/or publication of this article.
Funding
The author(s) received no financial support for the research, authorship, and/or publication of this article.