
Abstract
This article develops the first structural model of organizational buying to study innovation diffusion in business-to-business markets. The model is particularly applicable for routinized exchange relationships, whereby centralized buyers periodically evaluate and choose contracts and then downstream users order items on contracted terms. The model captures different utility trade-offs for users and buyers while accounting for how buyer and user choices interact to influence user adoption/usage and buyer contracting. Further, the authors consider the dynamics induced by share-of-wallet (SOW) pricing contracts, commonly used in business-to-business markets to reward customer loyalty with discounts for buying more than a threshold share from a supplier. The authors assemble novel panel data on surgeons’ product usage, SOW contracts, contract switching, and hospital characteristics. They find two segments of hospitals in terms of the relative power of surgeons and buyers: a buyer-centric segment and a surgeon-centric segment. Further, they find that innovations diffuse faster in teaching hospitals and when surgical procedures are concentrated among a few surgeons. Finally, the authors answer questions such as these: Should the marketer focus on push (buyer-focused) or pull (user-focused) strategies? Do SOW contracts hurt the innovations of smaller firms? Surprisingly, the authors find that SOW contracts can help speed the diffusion of major innovations from smaller players.
Keywords
The business-to-business (B2B) sector in the United States has a transactional value of $10.7 trillion, roughly the same as the value of the business-to-consumer (B2C) sector. Further, B2B accounts for a staggering 90% of all e-commerce in the United States (Lilien 2016). Yet the share of academic research on B2B in leading marketing journals is very small at 3.4% (LaPlaca and Katrichis 2009). Despite a long history of organizational buying models in marketing (e.g., Robinson, Faris, and Wind 1967; Sheth 1973; Webster and Wind 1972) and a rich literature testing various components of models using survey data (see integrative reviews in Lewin and Johnston [1996] and Sheth [1996]), econometric work using secondary data on organizational buying is scarce. Lilien (2016, p. 544) attributes the relative scarcity and “misallocation of academic resources on B2C versus B2B” to three challenges: (1) modeling organizational choice in B2B is more complex than modeling individual choice, requiring consideration of multiple stakeholders who differ in their objectives and priorities in B2B settings; (2) modeling of B2B markets requires institutional immersion and knowledge; and (3) B2B panel data with choices of multiple stakeholders are harder to obtain than B2C panel data. 1
We study organizational buying and innovation diffusion in a duopoly B2B market: the U.S. hospital market for a surgical device. In studying this market, we address the three challenges mentioned previously. First, we develop a tractable structural econometric model of organizational buying wherein multiple stakeholders with different objectives and preferences interact and influence each other to generate the buying outcomes within the organization. The model is particularly applicable in B2B buying modes characterized as “routinized exchange relationships” (RERs) (Grewal et al. 2015). In these relationships, centralized buyers periodically evaluate and choose contracts on the basis of price and service terms, and downstream users order items on these terms during the contract period. Second, we lay out institutional aspects of buying in hospital markets (particularly medical devices), clarify which aspects are relevant to our research questions, and discuss how we account for the relevant aspects in our modeling approach. Such institutional aspects include contract structure and the role of group purchasing organizations (GPOs) as intermediaries, common in health care markets. Finally, we assemble a rich and novel B2B panel data set on decisions made by different agents within each hospital. We obtain proprietary data on usage share of various products by surgeons and complement that information by hand-coding the terms and conditions of contracts available to each hospital plus the hospital administrator's contract choice. The collection of such data is critical to model and capture the multistakeholder nature of this B2B market.
In our hospital setting, suppliers use share-of-wallet (SOW) contracts, common in B2B markets, to induce and reward customer loyalty to suppliers. 2 Under SOW contracts, discounts are tied to achieving a certain threshold SOW level with the supplier. 3 In practice, customers contract with one supplier, committing to a certain wallet share and receiving a price discount for meeting the share threshold. Sellers use audits to verify share compliance. In B2B markets, SOW discounts are more common than quantity discounts, as quantity is typically outside the buyer's control. In business markets, quantity is usually a function of the total output of the firm and determined by strategic and tactical decisions made by senior management or other departments such as marketing and finance—not by the buyer. The buyer only decides from whom to buy products, thereby determining the SOW. 4 We therefore model buyers’ choice of supplier to sign SOW contracts with and surgeons’ choice of product to use (from contracted and noncontracted suppliers).
Accounting for these two critical market features—namely, the multiagent nature of B2B buying and routinized buying under SOW contracts—we answer the following questions. First, which stakeholder, the buyer or the user, has more influence on the other in an organization's adoption and usage of an innovation? Is the relative influence of buyers (or users) the same across all hospitals? Second, given that buyers and users have different objectives and preferences, and the hospital’s product adoption and usage is the outcome of their interactions, when should suppliers focus on buyers (push tactics) versus users (pull tactics) to drive product adoption and usage? Third, given that theoretical research has shown that SOW contracts typically favor larger dominant suppliers (Inderst and Shaffer 2010; Majumdar and Shaffer 2009), do SOW pricing contracts suppress adoption of innovations from smaller players? This question is important, not only for smaller firms, but also for regulators, because medical device innovations disproportionately come from smaller firms (Roberts 1988). The question remains open because existing theoretical papers consider only unitary buyers and not the multistakeholder nature of B2B buying. For example, a smaller supplier with a superior but expensive innovation may gain user adoption by targeting price-insensitive users, leaving the hospital unable to meet the dominant firm's SOW threshold. This violation of the dominant supplier’s SOW threshold can potentially trigger faster contract switching to the smaller innovator and may speed up innovation diffusion.
Overall, we make three key modeling contributions. First, our model captures the multistakeholder nature of a B2B buying center involving RERs in an internally consistent manner. To the best of our knowledge, there are no econometric models of organizational buying for B2B markets; the multistakeholder core of our framework can serve as a workhorse model for other B2B markets, especially in RER settings. As discussed, the structural model for a B2B market needs to consider the different (and potentially divergent) objectives and preferences of stakeholders and how they interact and influence each other to determine organizational choice. A key element of our contribution is how we model the buyers’ and sellers’ mutual influence on each other in an internally consistent way. Although users can use products from both contracted and noncontracted suppliers, disutility arises because of the inconvenience of using off-contract products. This inconvenience nudges users to choose the contracted product. But user dissatisfaction also affects buyer utility and can restrain the extent of misalignment between buyer choice and user preference. A key innovation that we introduce in our model is the construct of inclusive value loss (IVL) to parsimoniously capture the total user dissatisfaction with a buyer's contract choice. The relative weight of the users’ and buyers’ influences on each other determines who has greater impact on product adoption in a given organization. Such disaggregate modeling of each stakeholder's choices and their influence on each other's utility helps with better predictions of organizational buying outcomes in counterfactual marketing environments. For estimation, we formulate our multistakeholder model as a mathematical program with equilibrium constraints (MPEC) problem (Dubé, Fox, and Su 2012). What is novel in our application of the MPEC approach relative to previous work is that we impose the new product adoption process as an extra constraint in addition to product share constraints in the optimization problem. This method speeds up the estimation by circumventing the need to solve iteratively for user adoption parameters.
Second, our empirical model captures the nuances of how SOW contracts affect an organization's choices in terms of product adoption, usage, and contracting. Consider a duopoly market with one large supplier and a smaller innovating supplier that launches a new product. Given the empirical context, we assume there is no other entry. The buyer has expectations about price evolution and usage share evolution based on contracts with the two suppliers. Buyer payoffs consist of two elements: (1) costs to the firm due to prices, and (2) user dissatisfaction with chosen contracts. At any given time
Finally, our model provides a structural framework to study the diffusion of disposable products in a trial-repeat context. Thus far, structural models of new product diffusion have focused only on durable products in B2C markets involving only single purchases (e.g., Nair 2007; Song and Chintagunta 2003). Trial-repeat diffusion models (e.g., Hahn et al. 1994; Lilien, Rao, and Kalish 1981) tend to be focused on B2C markets and are nonstructural in that they merely fit diffusion curves. Further, the dynamics of innovation adoption in structural models for durables usually stem from the trade-off of buying a product now versus waiting for lower price or higher quality in the future. In contrast, for disposables in our trial-repeat context, the dynamics stem from the SOW pricing contracts and the multiagent nature of buying. The buyer's decision to switch contracts is not driven by falling prices but rather by the wait for enough users (surgeons) to adopt the new product such that the total disutility from purchasing cost and user dissatisfaction is minimized.
Our key findings reveal two distinct hospital segments: a large “buyer-centric” segment and a smaller “user-centric” segment. For the focal innovation, the user-centric hospital segment drives initial adoption. We also find that innovation diffuses faster in hospitals with surgical procedures more highly concentrated among surgeons (i.e., a few surgeons perform a large share of the hospital's surgeries). Using the model estimates, we performed two counterfactual analyses to answer our other research questions. The first counterfactual compares the differential effects of focusing on buyers by lowering prices (i.e., push strategy) relative to improving the surgeon's perception of the innovation's value (i.e., pull strategy). We find that price reduction (push) has limited impact on the innovation diffusion as the dominant supplier's product still has a significant price advantage; however, focusing on users (pull) is more effective, especially in the user-centric hospital segment, where sufficient surgeon adoption triggers the buyer to switch contracts to the innovator to obtain the SOW discount. After an initial focus on the surgeons (pull) until a threshold share is reached, it is optimal for the innovator to shift the focus to buyers through price (push) strategy. The counterfactual also reveals that the smaller innovator should focus on “major” innovations to make the pull strategy effective. Overall, by modeling the multistakeholder aspect of organizational buying, we obtain deeper insights about the proper tactics and timing of focusing on each stakeholder to maximize innovation adoption.
The second counterfactual addresses the question of whether SOW contracts hurt the diffusion of innovations introduced by smaller firms. As discussed previously, SOW contracts require the consolidation of shares with one seller to obtain discounts. Although conventional wisdom based on current theory suggests that this type of contract favors the larger, dominant firm, we find that SOW discounts can speed up the adoption of innovations from smaller firms if they have a superior innovation—even when it is more expensive. This diffusion acceleration is driven by hospitals in the user-centric segment because they adopt innovations on the basis of an innovation's superior benefits, rather than price, and are less influenced by buyers. Once the SOW threshold needed for the larger firm is breached, buyers accept the reality of the superior innovation and switch contracts. The contract switching further accelerates user adoption of the innovation.
The rest of the article is organized as follows. After outlining the links to related literature and providing institutional background for the market, we describe details of the data and provide model-free evidence to support the modeling assumptions. We then present the model, the estimation approach, and details of model identification, followed by the estimation results and counterfactual analysis. We conclude with suggestions for future research.
Related Literature
This article is related to three key streams of literature: organizational buying and group decision making, SOW pricing contracts, and new product adoption and diffusion.
Organizational Buying and Group Decision Making
The pioneering conceptual models in organizational buying behavior (Robinson, Faris, and Wind 1967; Sheth 1973; Webster and Wind 1972) spawned a rich literature focusing on concepts such as the buying center and decision-making processes within the buying center, make versus buy, and modified rebuy. Grewal et al. (2015) provide a more recent taxonomy of B2B buying modes: (1) RERs, (2) transactional buying operations, and (3) organic buying relationships. As discussed previously, our model and empirical setting address the common RER buying mode. In a review and assessment of the organizational buying literature, Sheth (1996, p. 8) notes that much of this research tends to be descriptive “survey research wherein a key informant is asked to either role play or recall incidents of specific organizational buying decisions” and calls for empirical approaches that are common in B2C markets.
As discussed in the introduction, the modeling of organizational buying entails three key challenges: (1) lack of data on choice and preferences at the intraorganizational level from the multiple stakeholders involved in the organizational outcomes; (2) modeling innovations needed to integrate each stakeholder's choice in an internally consistent manner to generate the organizational buying outcome; and (3) adequate knowledge of the institutional details to reasonably capture the stakeholders’ objectives and buying processes within the organization. The limited work on organizational buying using transactional data in B2B markets typically has used data on the final choices or outcomes only, without incorporating information on choices or preferences of other stakeholders in the organization 6 ; these papers typically assume an “as-if” model of unitary buyers. This assumption addresses the data limitations but also bypasses the challenges of modeling multistakeholder objectives and choices (e.g., Bruno, Che, and Dutta 2012; Zhang, Netzer, and Ansari 2014).
Specifically, much of the early work on medical device markets involved surveys. For example, Laczniak (1979) employed Webster and Wind's (1972) model to analyze the buying behavior in a sample of midwestern hospitals using semistructured, in-depth interviews and questionnaires. Moon and Tikoo (2002) used surveys of buyers and doctors to study commonalities and differences among buyers and users. Recent work uses organizational data but typically employs a unitary model. For example, Grennan (2013, 2014) used observational data to estimate a structural model of bargaining between hospitals and suppliers but treated the negotiation as one between unitary decision makers. Notably, these papers abstract away from the role of surgeons and GPO contracts available to hospitals and assume that heterogeneity in bargaining power and ability drives the price variation across hospitals. In contrast, we leverage data on SOW contract availability through GPOs for different hospitals and find that SOW thresholds and usage share explain most of the price variation across and within hospitals in the context of our market.
In summary, our article addresses all of the challenges discussed previously around data, manages the complexity of modeling multiple stakeholders’ objectives and choices, and accounts for the purchasing process in RERs at hospitals with SOW contracts. We hope our formulation inspires other scholars to appropriately modify it for different organizational buying settings.
Our work is also related to the literature on group decision making. One stream of research in this area measures the influence of different group members on the team's decision using stated preference or influence data, but these data have well-documented biases (e.g., Corfman 1989; Turk and Bell 1972). Others use conjoint methods to measure the preferences and relative influences of different group members. Arora and Allenby (1999) and Arora (2006) study preferences and influences of members within family units (e.g., husband–wife, parent–child) using individual and joint conjoint data. Aribarg, Arora, and Bodur (2002) seek insight into the preference revision and concession process among parents and teenagers using a conjoint data collection procedure for individual and joint choices interspersed with an intermediate information exchange stage. In contrast, we use observational data about users’ and buyers’ choices within an organization over time to structurally model their preferences and influences. Unlike stated preference or conjoint data, our joint model of users and buyers reflects actual organizational choices in a real-world setting and thus illustrates how to extend revealed preference modeling used in B2C markets to B2B settings.
SOW Contracts
In B2B markets, SOW pricing contracts are commonly used to encourage customer loyalty. Suppliers offer discounts to customers if they purchase more than a particular threshold share in the category from the supplier. In B2B markets, SOW discounts are preferred to quantity discounts to induce loyalty because quantity is driven by the downstream demand and usually is outside the buyer's control, whereas the buyer controls the SOW.
A small theoretical literature has addressed SOW discounts in a manufacturer–retailer setting, but no empirical work is available. Mills (2010) studies how a retailer's downstream selling effort is affected by SOW discounts. Inderst and Shaffer (2010) find that SOW contracts favor a dominant supplier and can help increase its profit. Calzolari and Denicolò (2013) compare SOW discounts in competitive settings with exclusive contracts. These papers abstract away from the multistakeholder nature of the buying organizations, however, so they offer little guidance on equilibrium outcomes when users’ decisions moderate buyers’ contract choices. Further, this literature does not consider the dynamics of new product adoption and diffusion, which shed light on push–pull strategies over time. These two factors explain the divergence between our findings and existing results that SOW contracts favor dominant players.
New Product Adoption and Diffusion
The current article is closely related to new product diffusion models and structural models of new product adoption. Early papers in this literature focused on fitting the diffusion curve at an aggregate level without attending to the micro-foundations of adoption. Although most diffusion papers focused on first purchase (e.g., Bass 1969; Fourt and Woodlock 1960; Mansfield 1961), a smaller literature extended these first-purchase models to include trial and repeat purchases (e.g., Hahn et al. 1994; Lilien, Rao, and Kalish 1981). 7
Recently, researchers have used structural models to provide a micro-foundation for new product adoption of consumer durables, focusing only on first purchase diffusion. In these models, falling prices or increasing quality over time drives the diffusion (e.g., Nair 2007; Song and Chintagunta 2003). In contrast, prices and quality for consumables are typically fairly stable. The rising share of the consumable innovation over time (diffusion) is due to the growth in the installed base of users who have tried the product and are more likely to continue using it. Our work provides a structural framework for diffusion of consumables. Thus, our diffusion model is more similar to ongoing prescriptions by doctors (Hahn et al. 1994), whereby once a doctor or consumer has been acquired, ongoing prescriptions drive sales. There is a qualitative difference in that context, however, because a physician's prescriptions may vary by patient, whereas a surgeon typically uses the same product line for all surgeries.
Further, in the context of our category, the buyer's decision to switch contracts involves balancing the total cost to the hospital against disutility from user dissatisfaction. This balancing takes into account the buyer's expectations of not only future prices but also surgeons’ usage behavior. Thus, beyond the differences in diffusion due to the consumable nature of the product category, the forward-looking buyer's trade-offs are also novel to the literature on structural modeling of innovation diffusion.
Institutional Details
We study a surgical device category involving instruments that help surgeons handle internal tissues and organs during surgeries. The category is sold through hospitals and has annual revenues of over $700 million. Two suppliers compete in the category. The market leader (Supplier A) has one product line and 60% market share. The smaller supplier, Supplier B, with the remaining 40% market share, had one existing product line and during the study period introduced a new product line that was marketed as easier to use and more efficient than the existing product lines. The article focuses on the adoption and diffusion of this innovation from Supplier B.
Each product line has a set of tools (each tool is a stock keeping unit [SKU]). Different surgeries require different subsets of tools from the product line; some tools are used more commonly than others. The tools are single-use disposable items that can be used for only one surgery. Surgeons have preferences between these product lines due to training and experience but may be willing to switch if they believe a superior product line is easier to use (with some training), more efficient, or more effective (e.g., in reducing complications). Because this category is considered a physician preference item, surgeons can choose which product line to use for their surgeries. Although it is technically feasible to use items across multiple product lines for different surgeries, enough differences exist in usage that in practice surgeons use only one product line at any point in time.
A hospital administrator (hereafter buyer) signs a contract with one of the two suppliers. Contracts involve three parties: suppliers, GPOs, and hospitals. Contracting terms are negotiated between the suppliers and GPOs and renegotiated at intervals of one to three years. Each hospital is typically a member of multiple GPOs. In each category, the buyer chooses a supplier and the “best” contract available through its GPOs. Hospitals become members of GPOs to (1) obtain good contract terms (from the GPO's consolidated buying power) and (2) reduce contracting costs for supplies across a large number of categories (Schneller and Smeltzer 2006). Because any given category accounts for a small share of the overall contracting value through GPOs, GPO membership can be treated as exogenous for a category. 8
Each contract consists of three elements: an off-contract (or list) price, a discounted price, and a SOW threshold. 9 The SOW threshold is defined as the supplier's share of a hospital's total purchase in a category (all product lines and SKUs in the category) and can differ across suppliers; in our market, the larger Supplier A has a threshold of 80%, whereas the smaller Supplier B has a threshold of 60% (the same threshold for all GPO contracts). A hospital that signs a contract with a supplier and meets the SOW threshold pays the discounted price; otherwise it pays the higher off-contract price. The contracts also stipulate “service” levels for surgeon support. The support includes (1) surgeon assistance from supplier representatives with product usage in operating rooms (Moed and Israel 2017; O’Connor, Pollner, and Fugh-Berman 2016) and (2) priority delivery of infrequently used tools (Montgomery and Schneller 2007). Such contract-tied support induces more trials by surgeons soon after the hospital switches contracts to the innovating supplier; the buyer can thus induce a bump in trials by contracting. Further, suppliers (especially the ones without contracts) provide greater support to surgeons with a higher share of surgeries at a hospital. This support induces the high-share surgeons to try the innovation earlier.
Our sample contains nine GPOs and 201 hospitals. The average number of GPO affiliations per hospital is 2.6, but membership is concentrated among the top GPOs. For example, the top three GPOs for Supplier A have affiliations with 91%, 85%, and 69% of hospitals. The average number of hospital members for each of these GPOs is 164. Further, 94% of supplier contracts are concentrated among the top three GPOs. The off-contract price differences across GPOs are relatively small. On average, Supplier A, with the higher SOW threshold of 80%, offers larger discounts; the average baseline discounts in this category for the top three GPOs are 45%, 42%, and 41% respectively. The corresponding figures for Supplier B, with the 60% SOW threshold, are 36%, 34%, and 33%. The discounts vary over time.
As noted previously, discounts also vary by hospital spending. Larger hospitals with greater spending receive higher discounts for meeting SOW thresholds. For example, Supplier B offers a 42% discount through the largest GPO for spending of $950,000 or more; it offers discounts of 37% and 39% for spending of $750,000 or more through the second- and third-largest GPOs. But these spending thresholds are set such that smaller hospitals cannot obtain discounts meant for larger hospitals by merely shifting their SOW. Effectively, spending criteria serve as a proxy for hospital size for third-degree price discrimination.
Given this background, we treat GPO memberships at each hospital as exogenous in the model because they are based on considerations beyond the category. 10 We also treat discounts based on spending thresholds as different contracts available to hospitals of different sizes during model estimation because the choice among spending thresholds is outside the buyer's control.
Data and Model-Free Evidence
We assembled data in cooperation with various departments of Supplier B and from third-party providers. We obtained Supplier B's sales to each hospital for 19 quarters from its marketing department. We procured data on each hospital's contract status and each GPO's contract terms and conditions from Supplier B's commercial analytics department. Supplier B's competitive analytics group provided estimates of each hospital's total sales potential in the category and GPO affiliations in addition to Supplier A's GPO contracts in the category. We then supplemented these data on prices, shares, and contracts with data on hospital and surgeon characteristics from third-party data providers, specifically Health Market Science and IMS Health.
As this market is duopolistic, we use the quarterly sales of Supplier B and the total sales potential to compute the quarterly shares/sales of Supplier A at each hospital. Each contract has information about the off-contract (i.e., list) price, SOW threshold, spending requirements, and discounts from each supplier. For Supplier B, we observe the actual prices paid, given its GPO contract and threshold. For Supplier A, we infer the price paid by the hospital in each quarter on the basis of our knowledge of hospital GPO memberships, the supplier each hospital has contracted with, contract details on off-contract prices, and discounts in that quarter. We exclude seven hospitals that directly negotiate contracts with each supplier and do not use GPO contracts. More details about the construction of Supplier A's price sequence are provided in the Web Appendix.
For hospital characteristics, we have data on (1) whether the hospital is a teaching hospital, (2) number of surgeons in the category, and (3) number of surgeries performed by each surgeon. We do not observe product line choices by individual surgeons, only the aggregate share of each product line in each hospital. To account for differential support for higher-share surgeons, we label as “high-share surgeons” those whose share of total surgeries in the category in their hospital is in the top decile among all surgeons in the sample.
In all, we have 201 hospitals (34.3% teaching) across the United States in our sample (we exclude 13 hospitals with either non-GPO contracts or incomplete data), collectively employing 17,239 surgeons. The average number of surgeons per hospital is 85, with a median of 70 and a standard deviation of 53. The average share of high-share surgeons in our sample is 17.4%, with a median of 12.8% and a standard deviation of 15.7%. We have 19 quarters of data, 4 of which were before the launch of the innovation. Therefore, we have a balanced panel of 3,819 (201 × 19) hospital-quarters for analysis.
Descriptive Statistics
We begin with descriptive statistics on prices and contracts to build intuition around the data. Table 1 shows the descriptive statistics of prices from both suppliers. Hospitals with contracts pay significantly lower prices for all three product lines. Figure 1 shows the average off-contract and discounted prices; the discounted prices are about 30% to 50% lower than the off-contract prices. The old product from Supplier A is the cheapest in terms of both the off-contract price and the discounted price.
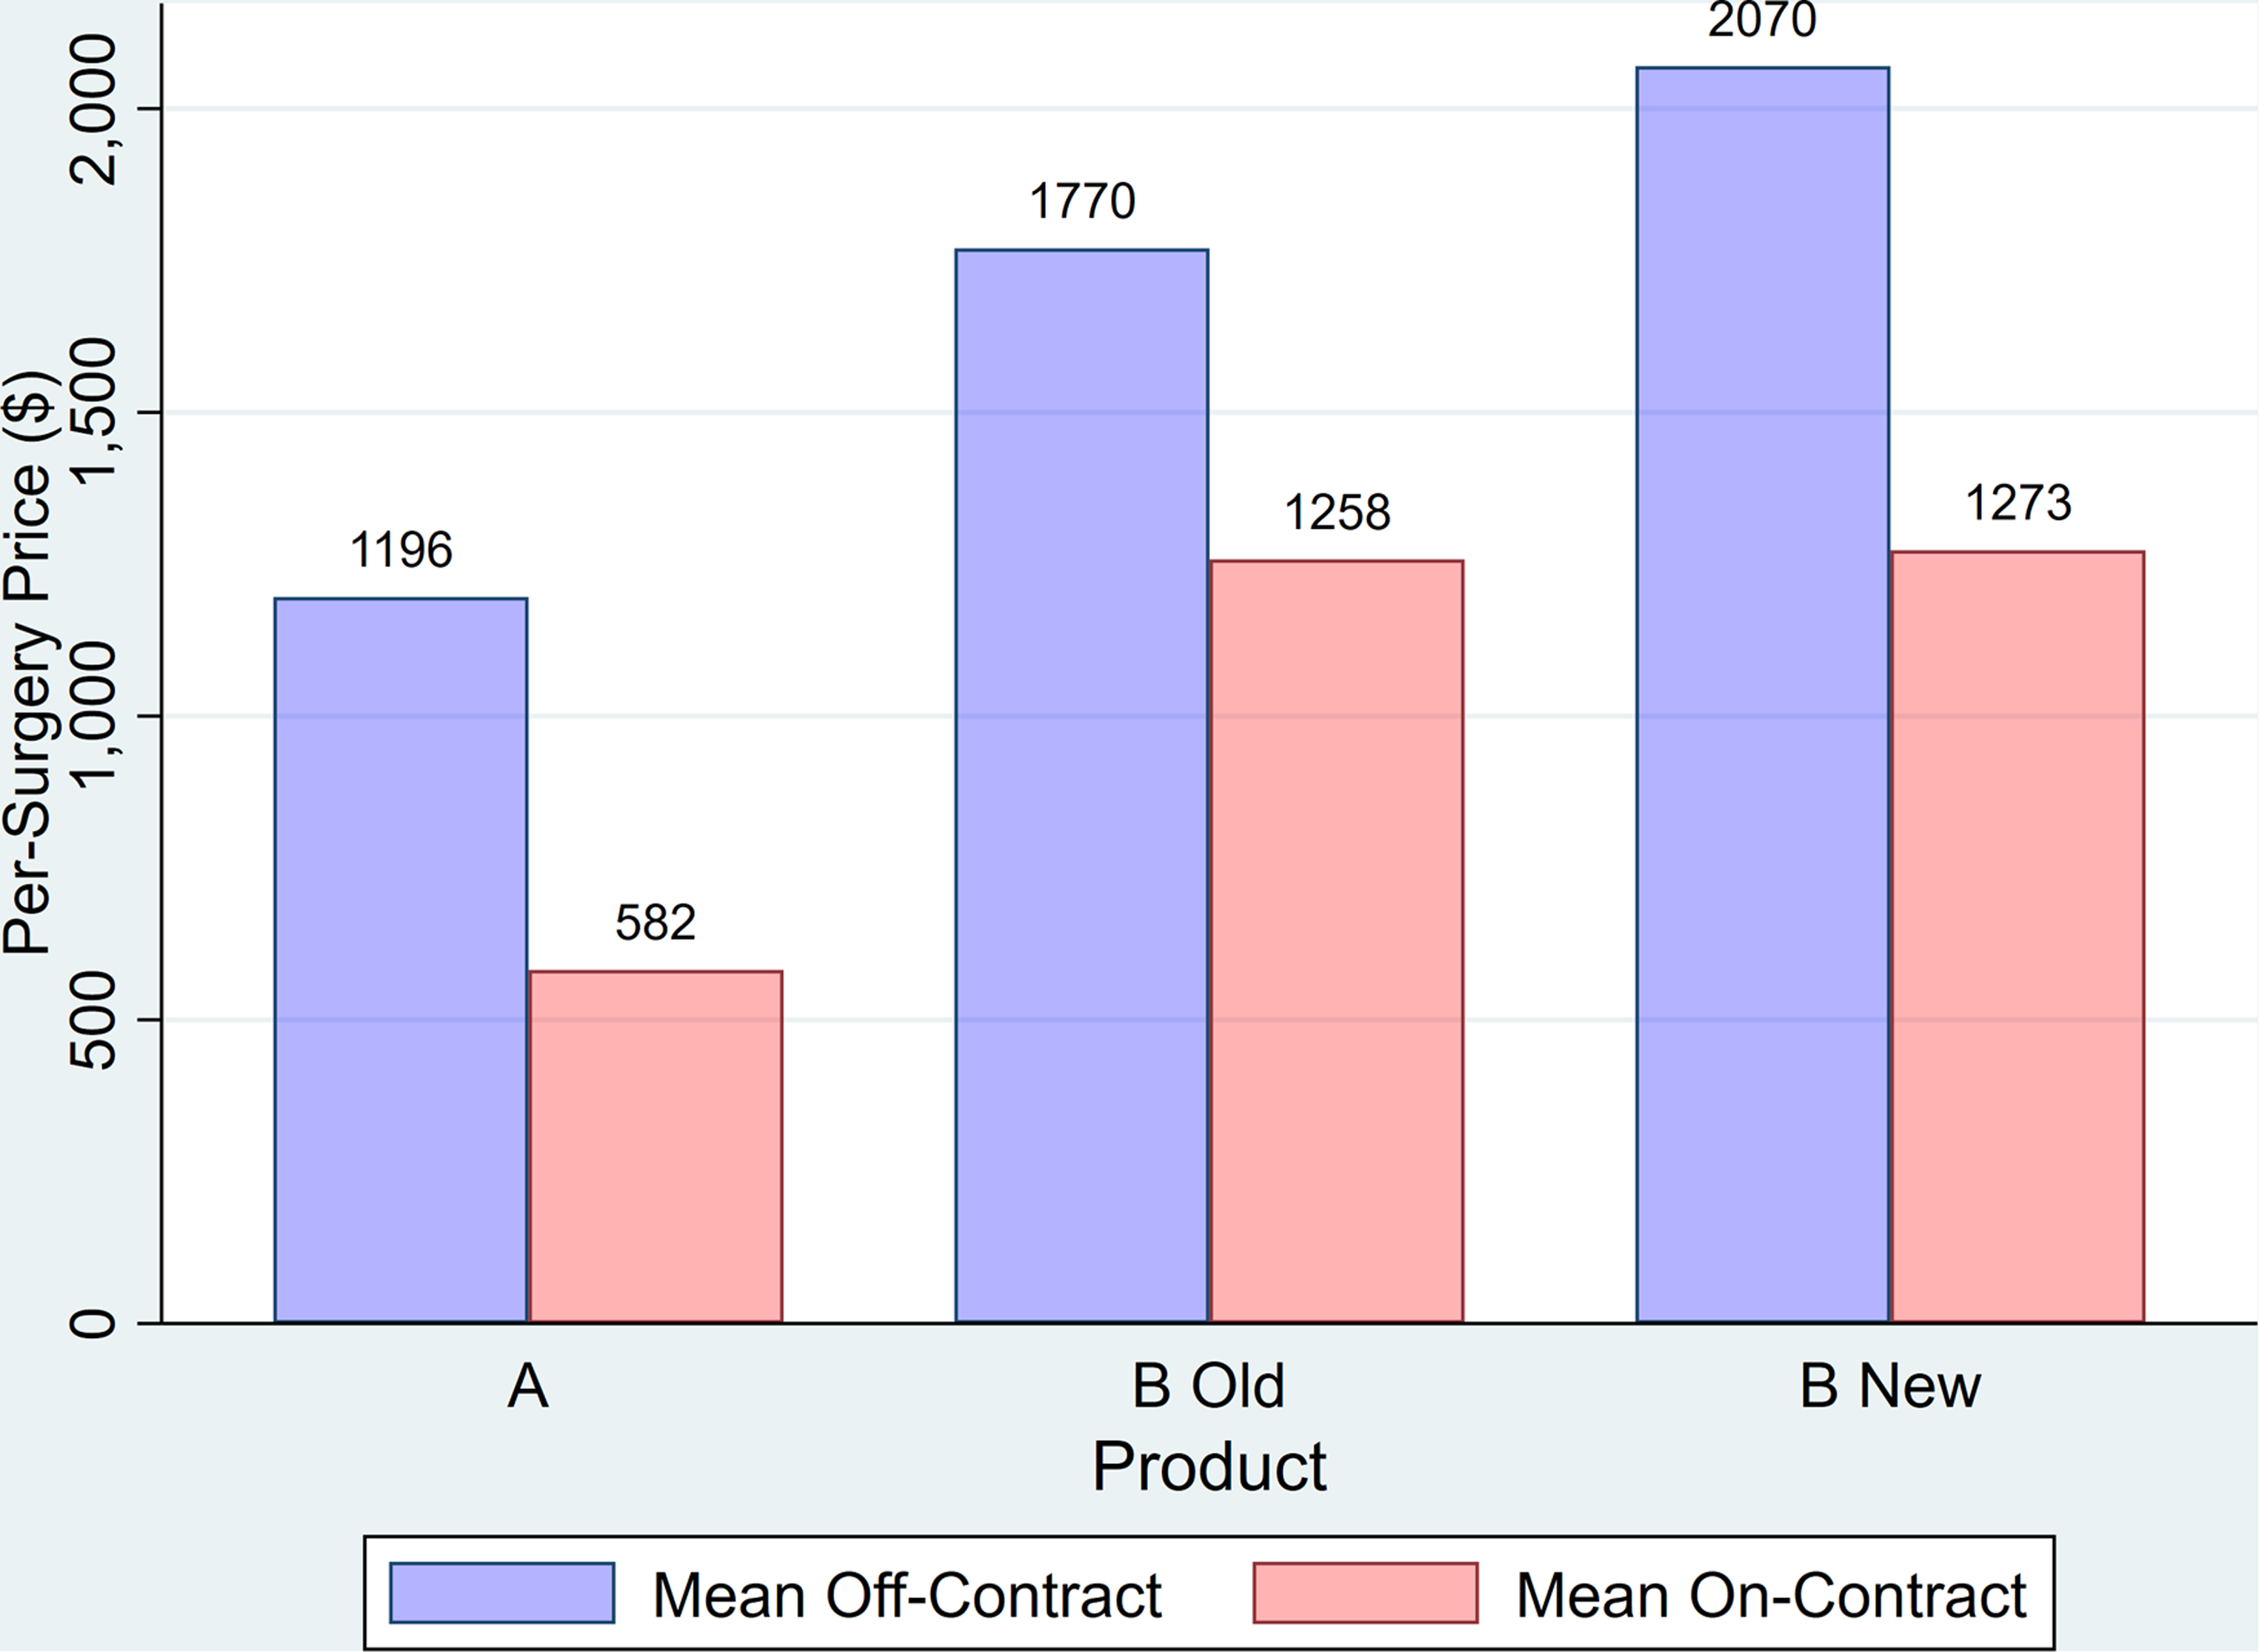
Average per-surgery prices.
Per-Surgery Prices by Contract Across Hospital-Quarters.
Notes: The maximum price with contract is close to the maximum price without contract because hospitals occasionally do not meet the share threshold for the discount. This situation is relatively infrequent and has limited impact on the mean price with contracts, so the mean reflects the discounted price.
Figure 2 shows the time series of average on- and off-contract prices for each of the three products. A few observations are noteworthy. First, both off-contract and discounted prices for Supplier A's product drop over time. The price drop starts a couple of quarters before the launch of Supplier B's product, perhaps in anticipation of that launch. Second, although the off-contract price of Supplier A's product is initially higher than that of Supplier B's old product, the average contracted prices of the two products are initially about the same. Third, as Supplier B's new product gains share over time, the supplier increases the off-contract prices of both its old and new products. Such a price increase might seem counterintuitive at first, because for a novel technology a skimming pricing strategy could be more common in B2C markets. In this case, however, because of the decoupling of purchase and consumption, price is not the main driver of adoption; surgeons who adopt the new product will keep using it regardless of its price, and surgeons who would like to switch to the new product will also consider the usage benefits rather than price. Therefore, raising the off-contract prices over time can encourage hospital buyers to switch contracts as their surgeons increasingly start using the new product. Fourth, Supplier B increases its old product's contracted price while keeping the contracted price of its new product roughly the same over time. Anecdotally, this strategy incentivizes buyers to encourage surgeons to use Supplier B's new product, as the supplier plans to shelve the older product for production efficiency. Finally, small price jumps in the graph are due to price renegotiations with one or more GPOs over time. 11
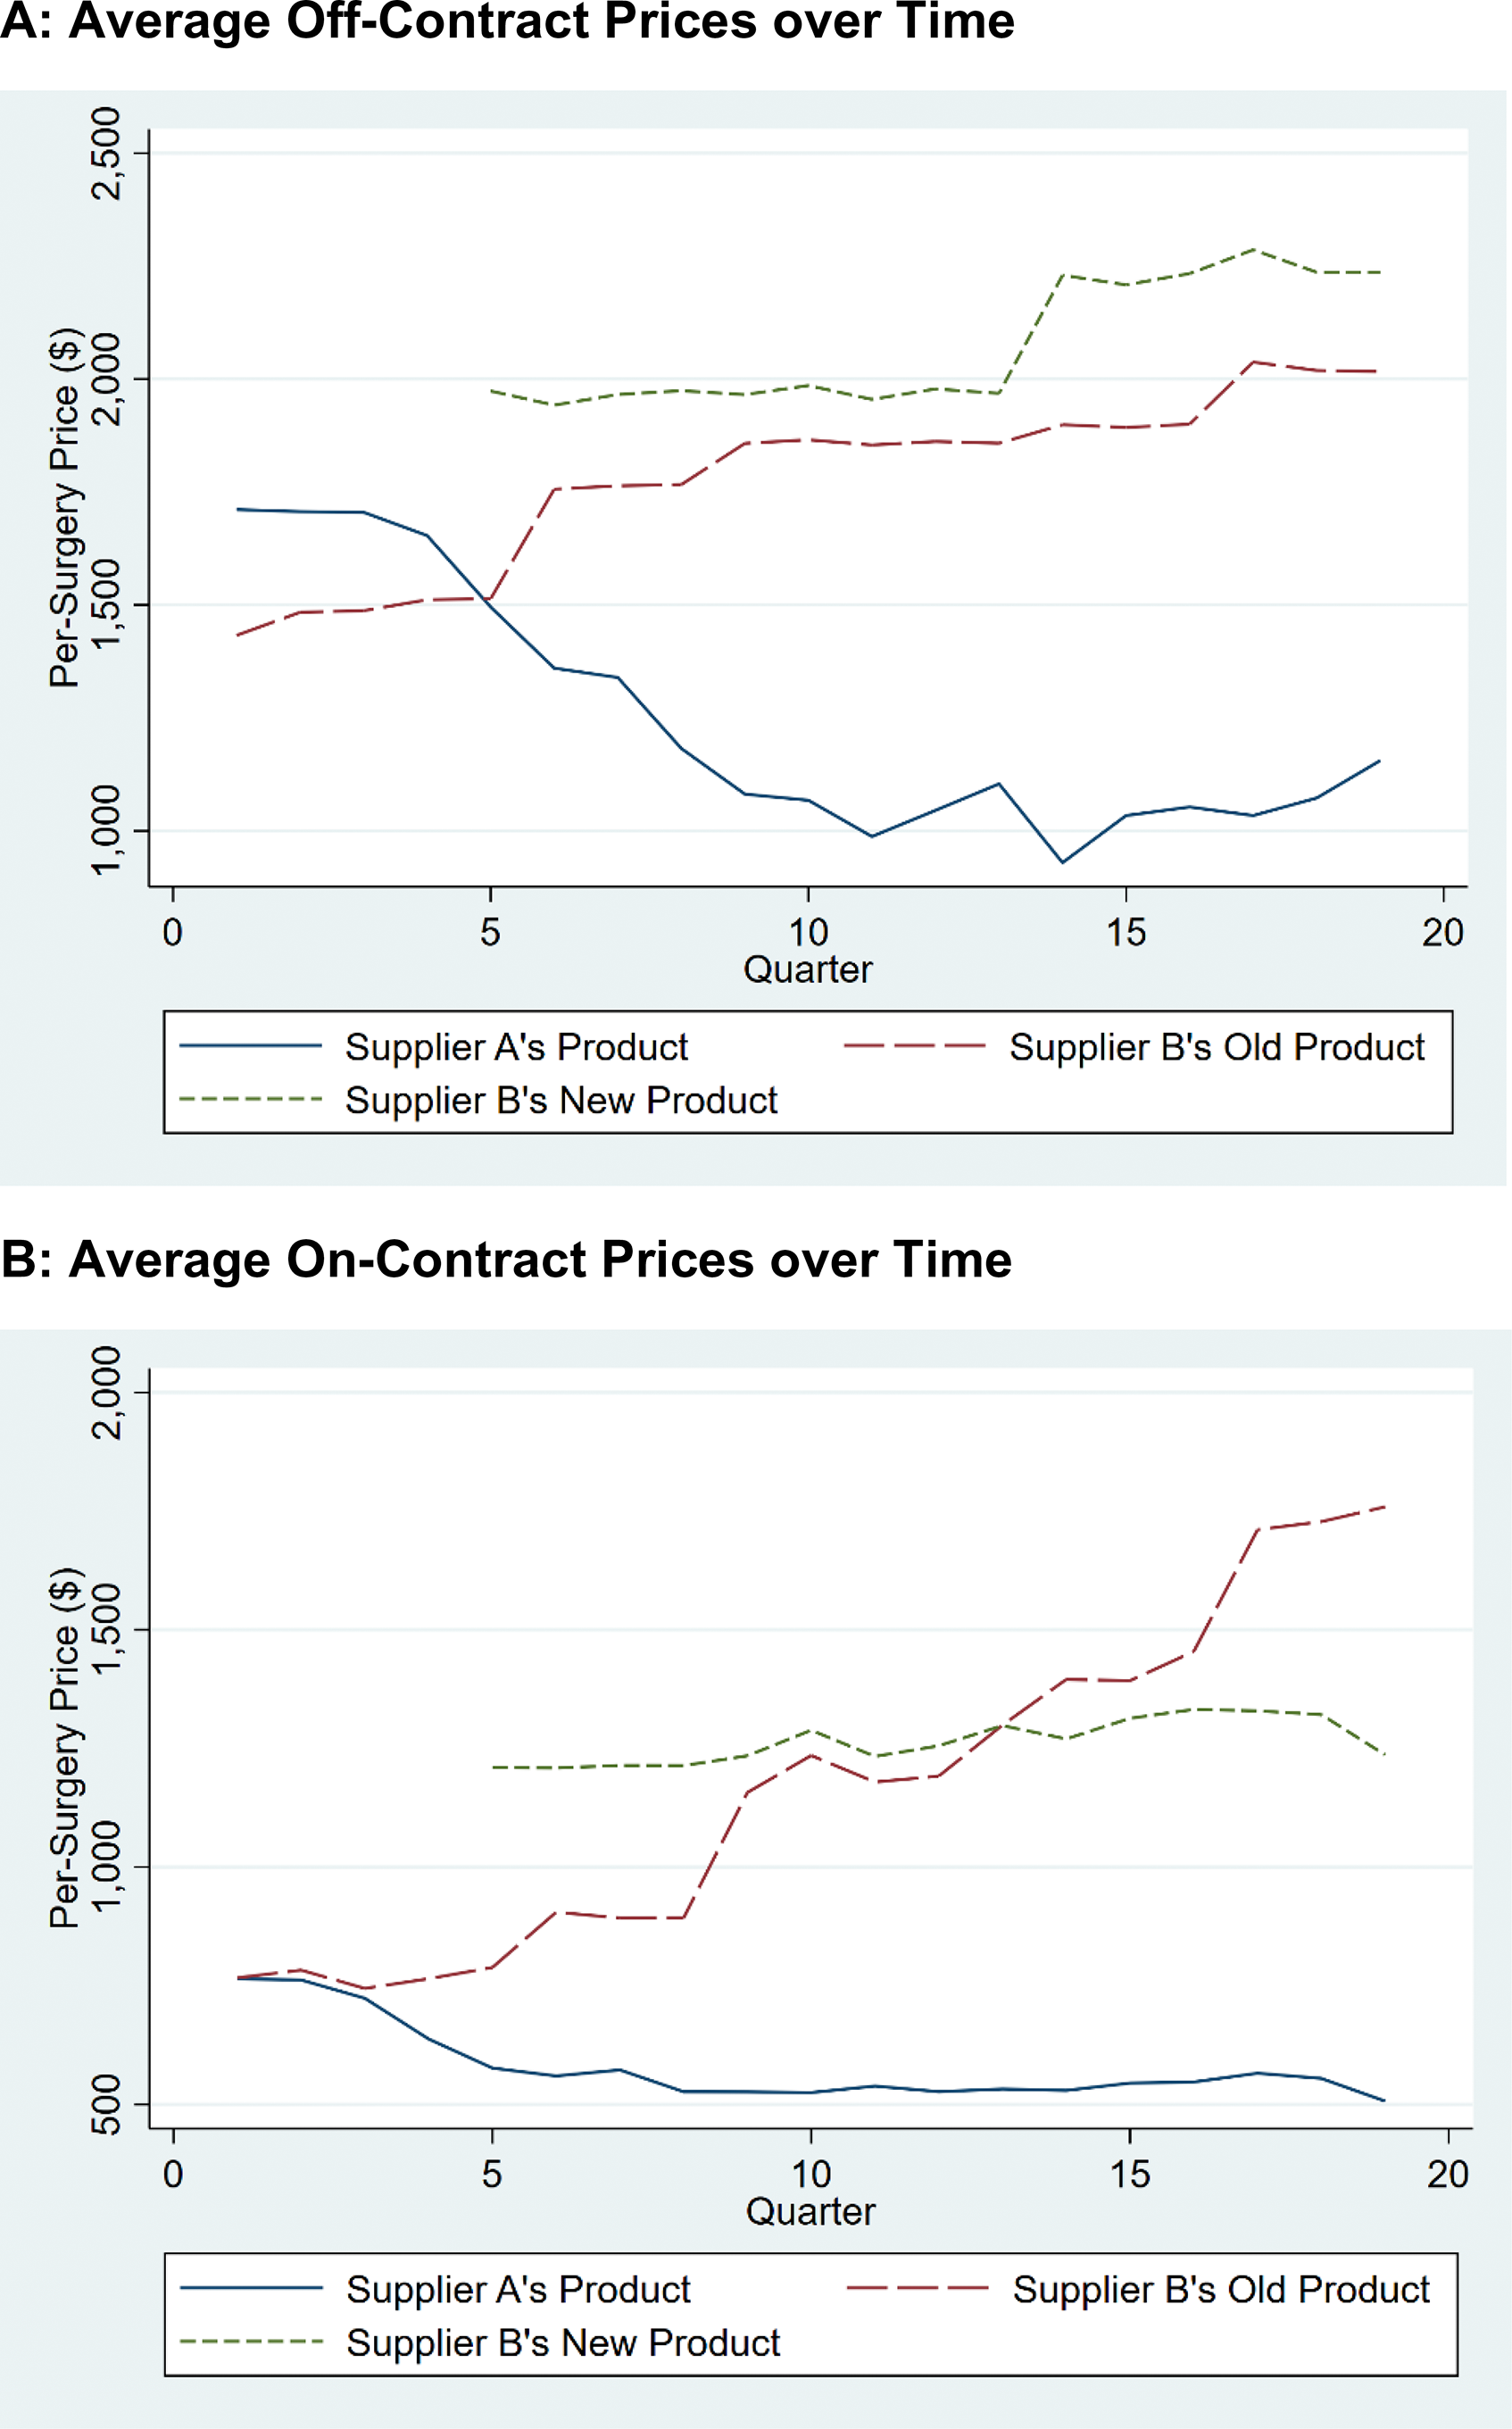
Average per-surgery product prices over time.
Next, we consider the cross-sectional price variation across hospitals. Figure 3 presents snapshots of per-surgery price distributions across hospitals for the three product lines at Quarter 5 (Q5, when the innovation was launched) and Quarter 19 (Q19, last period). Each snapshot shows two clear groups: For a large group of hospitals in contract with Supplier A that meet the threshold share, the price for Supplier A's product is significantly lower than the price for Supplier B's products. For a smaller group of hospitals in contract with Supplier B, Supplier A's price is much higher than the price for Supplier B's products. The distributions of prices in other periods are similar. Around Q19, however, the number of hospitals charged a lower price by Supplier B increases. This change reflects that more hospitals switched to Supplier B closer to Q19.

Snapshot of distribution of per-surgery prices for products at Q5 and Q19.
Finally, we explore the realized distribution of shares for products from Supplier B across hospitals in Figure 4. Considering the duopoly structure of the market, the distribution of Supplier A's shares is the mirror image of Figure 4, Panel A. Most hospitals purchase less than 20% of their supplies in the focal category from Supplier B for majority of quarters (Figure 4, Panel A). This distribution is expected, given that for a large part of the data collection period, most hospitals are in contract with Supplier A, with its 80% share threshold. For a smaller number of hospital-quarters, Supplier B's share is greater than 60% (the threshold share for the supplier) with a high concentration around 60%. Examining the breakdown of Supplier B's share across its two products reveals that the supplier's new product pushes many of the hospitals’ shares toward 20% (Figure 4, Panel C). Moreover, the new product is responsible for the concentration of hospitals around the 60% threshold, whereas both old and new products are responsible for hospitals that use higher shares. Hospitals with higher shares of Supplier B are those that were already committed to Supplier B before the launch of the new product or that switched to Supplier B earlier, meaning that surgeons had more time to start using the new product.
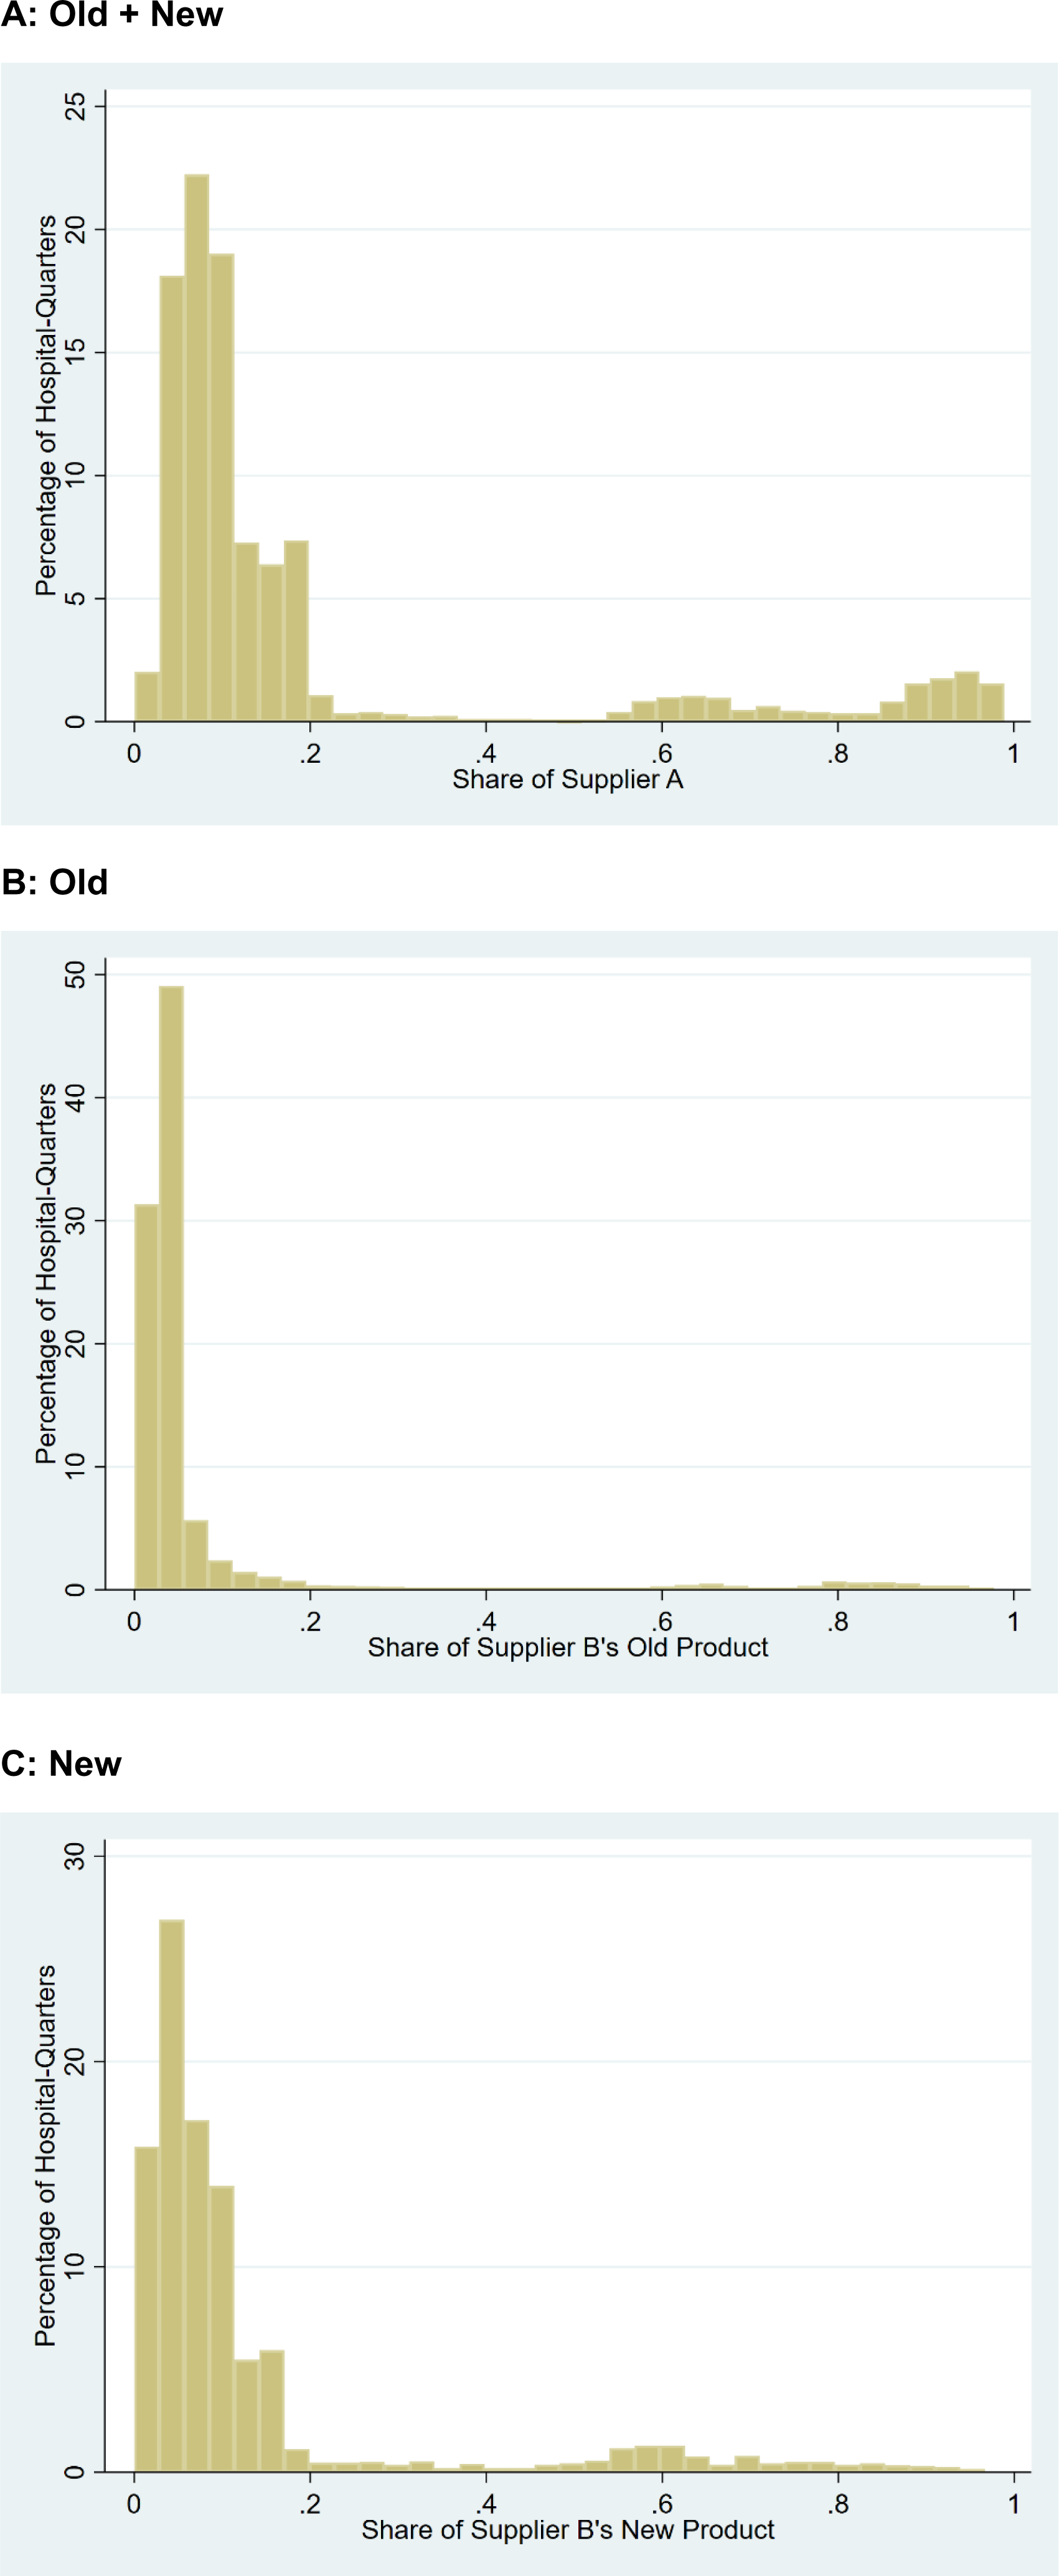
Distribution of Supplier B product shares.
Model-Free Evidence
We provide model-free evidence to support the following assumptions and features of the organizational buying and innovation adoption model: (1) users’ influence on buyer contracting, (2) the effect of hospital contracts (by buyers) on users, (3) forward-looking behavior by buyers, and (4) limited effect of GPO affiliations on price.
User influence on buyers’ contracting
The solid line in Figure 5 shows the share of hospitals that contract with Supplier B over time. It reveals that even though the innovation is more expensive, it induces contract switching (the key buyer decision) over time to Supplier B. Prior to the new innovation, the share of hospitals contracting with Supplier B is around 10%. Supplier B introduces the new product in Q5, after which we observe a steady increase in the share of hospitals in contract with (or “committed to”) the supplier; by Q19, it reaches over 23%.
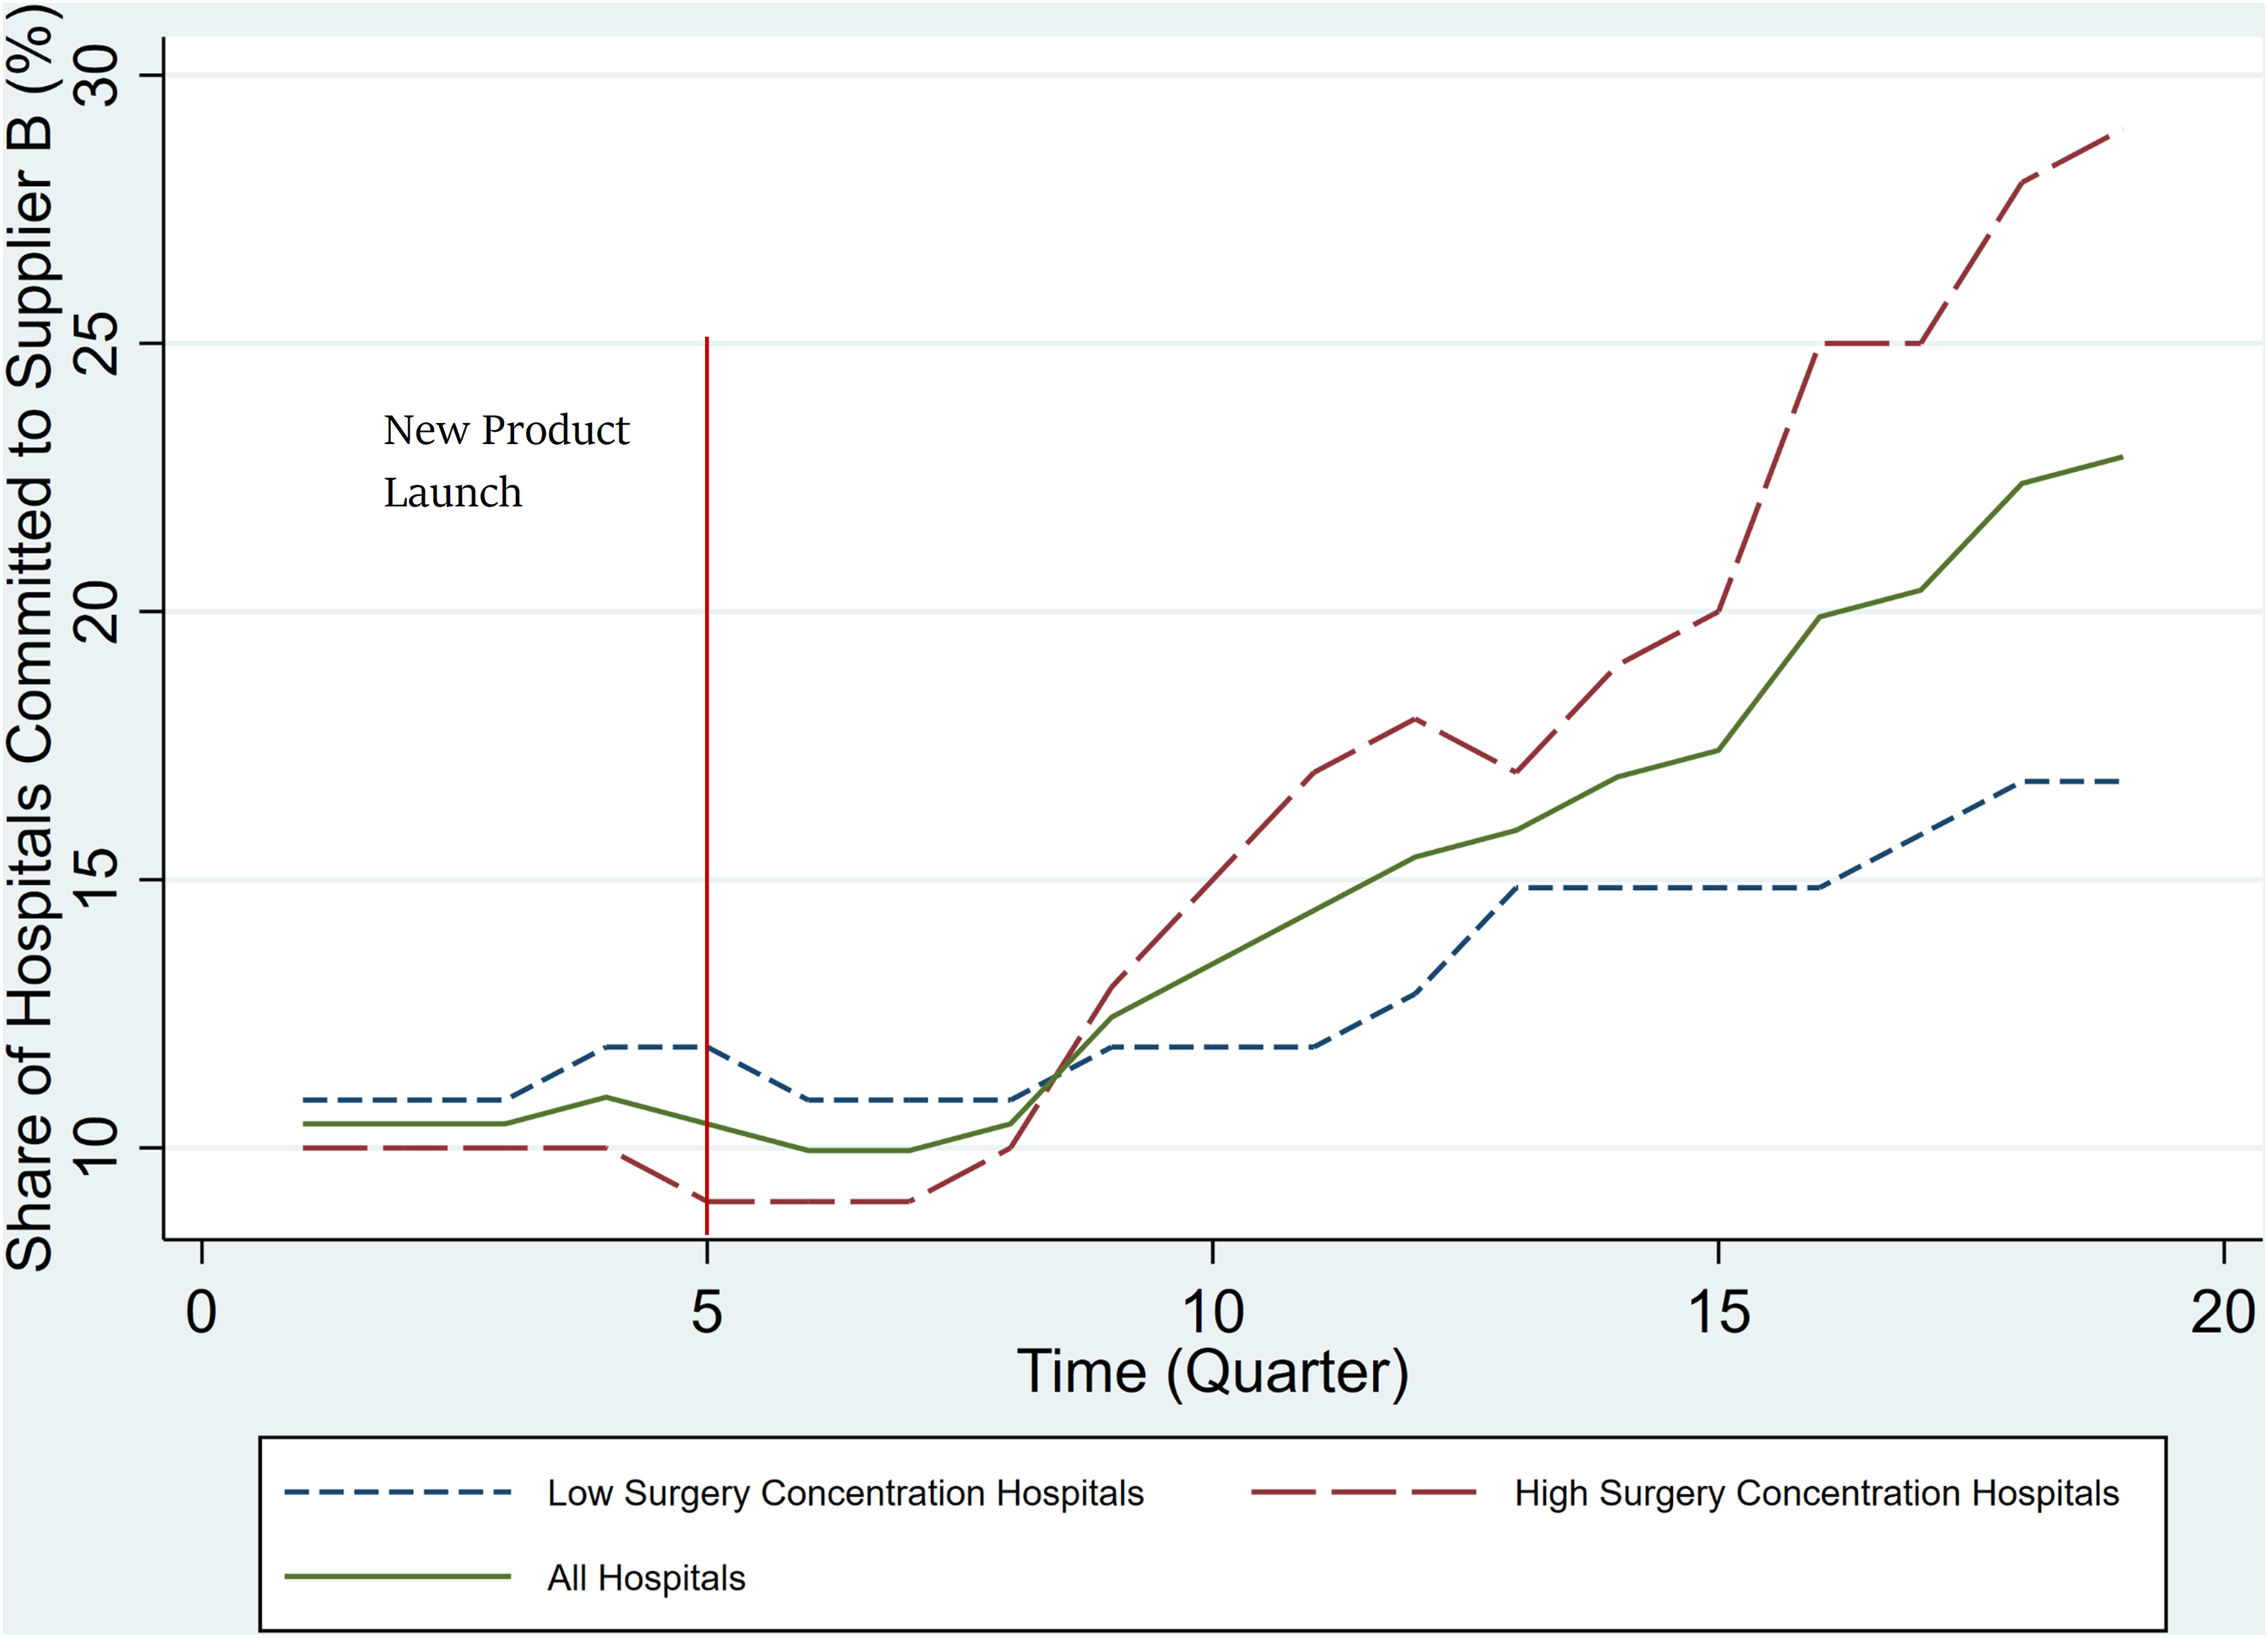
Share of hospitals in contract with Supplier B over time.
To assess whether users (surgeons) influence contract switching, we explore whether the contracting pattern varies by the extent to which surgeries are concentrated among fewer surgeons. The underlying assumption is that surgeons who perform a larger share of surgeries in a hospital have more clout. Therefore, in a hospital with highly concentrated surgeries, influential surgeons will sway contracting decision toward a more expensive, but preferred product. Accordingly, we compare contract switching patterns across hospitals on the basis of a median split of surgery concentration. 12 Figure 5 shows that, indeed, hospitals with greater surgery concentration switch faster; not only is the trajectory (slope) of contract switching to Supplier B greater for hospitals with greater surgery concentration, but the overall percentage of hospitals who contract with Supplier B is also higher (29% and 17% for hospitals with higher and lower concentration, respectively), even though there is little difference between the two types of hospitals before the introduction of the innovation. To rule out the pattern reflecting faster attainment of threshold shares in hospitals with greater concentration, we estimate a logit model of contract switching controlling for Supplier A's share of surgeries in Table 2. We find that hospitals with greater surgery concentration have a higher probability of contract switching than those with lower concentration even after controlling for Supplier B's SOW from the hospital. This evidence suggests that more powerful surgeons have greater influence on contracting decisions, or, more broadly, that surgeons influence contracting decisions. This finding supports our accounting for surgeons’ influence on buyers in the model.
Surgery Concentration and Contract Switching.

*p < .05.
**p < .01.
***p < .001.
Notes: This table presents the estimates of four different specifications of a logit model of contract switching to Supplier B on hospital surgery concentration. The results show a positive relationship between probability of switching contracts and surgery concentration, measured by HHI or share of high-share surgeons, and controlling for overall share of Supplier B, or share of each of its products. Standard errors are in parentheses.
Influence of buyer contracting on surgeon usage
Contracts provide superior support for surgeons and thus nudge them toward using the contracted supplier's product lines. Here we show empirical support for the shift in surgeon usage toward contracted products.
Figure 6, Panel A, shows the evolving innovation share among hospitals that switched from Supplier A to Supplier B during the analysis period. The quarter in which each hospital switched is coded as 0 on the x-axis. Around the quarter in which the hospital switches to Supplier B, the share is about 20% (the maximum share without affecting Supplier A discounts), but over the next two quarters the share shifts dramatically toward the innovation, ultimately reaching over 60% (the threshold to obtain discounts for a hospital in contract with Supplier B). In contrast, Figure 6, Panel B, is constructed using hospitals already in contract with Supplier B before the innovation launch. The x-axis in this figure represents time since the innovation launch. In Figure 6, Panel B, the change in share toward the innovation from the old product is much more gradual; it takes about 10 quarters to hit the 60% share. The contrast with Figure 6, Panel A, suggests that contract switching by buyers influences surgeon product usage.

Average share trajectory of innovation.
Forward-looking behavior by buyers
We find that 73% of hospitals that switch to Supplier B do so before Supplier B's hospital share reaches 50% (well below the 60% discount threshold). Further, Supplier B's share does not hit 60% in these hospitals in the quarter after switching, although the switching accelerates the share shift. If buyers were myopic, they would not have switched early, as switching increases their current cost. Switching is justified only if the buyers are forward-looking and consider that switching speeds up surgeons’ usage of the new product. 13
GPO affiliations and price
Finally, we explore the extent to which GPOs affect prices paid by hospitals beyond other factors. Table 3 presents the explanatory power (i.e.,
Drivers of Price Variance for Different Products.

Indicates whether the hospital has a contract with the supplier and has met the contract SOW threshold (60% for Supplier B or 80% for Supplier A).
Other hospital characteristics, such as size and teaching status, have no additional explanatory power as their effect is already absorbed by category spending and GPO affiliation.
Notes: This table presents the explanatory power (
Model
The market consists of J suppliers, each offering an existing product, j = 1…J. Without loss of generality, we denote supplier J as introducing a new product J + 1 during the analysis period. In the market under consideration, there are only two suppliers, so J = 2. The market has an existing product j = 1 from supplier 1, an existing product j = 2, and a new product j = 3 from supplier 2. Table 4 presents the complete list of the notation used in the model.
Model Notation.

The customers are the hospitals, but two sets of decision makers influence demand at each hospital: the buyer and users (surgeons). Buyers make the contracting decision; that is, they decide whether to continue with the current contract or switch suppliers (by incurring a contract switching cost), taking into account not just the costs of the product (what the hospital pays) given the SOW contract but also the aggregate user dissatisfaction that will arise from contracting with one supplier relative to another. The surgeons can use products from either the contracted or noncontracted suppliers, but contracted suppliers provide higher levels of service. Surgeons make the decision about which product to use for surgeries conditional on the buyer's contract choice. We assume that because the share of surgeries for any one surgeon at a hospital is relatively small, surgeon impact on the buyer's choice is only in the aggregate; an individual surgeon's choice cannot have a direct impact on the buyer's contracting decision, so the individual surgeon treats the buyer's choice as exogenous. In any given period, each surgeon uses only one product for all their surgeries. Whereas all surgeons have tried the existing products, trying the new product for the first time involves a trial cost.
As explained in the section on institutional details, GPO membership and the SOW contracts available from the GPO are exogenous to the hospital buyer at this stage and outside the scope of the model. Let shrjht be the share of supplier j (all its products in the category) from total category purchases of hospital h at time t. Given GPO membership and size of a hospital, the buyer has only one relevant contract from each supplier that yields the lowest price. We treat these contracts from each supplier as the choice set of the buyer. The relevant SOW contract from each supplier j for hospital h has an off-contract price of
We now present a structural model of contracting by buyers at hospitals facing SOW contracts from
Overall, we consider an infinite horizon model: Within each period, there are two stages of decision making by the buyer and the users. At the beginning of each period, the buyer makes a contracting decision to continue the contract with the current supplier or switch to a competing supplier. Conditional on the contract, users (surgeons) decide which product to use. Of relevance to the multiagent nature of the B2B model, in the contracting decision the buyer considers not only the total financial cost to the hospital but also user dissatisfaction with the choice of contracted supplier. As discussed previously, given this trade-off between costs to the hospital arising from SOW contracts and user dissatisfaction, the buyer's problem is an optimal stopping problem involving forward-looking behavior. The surgeon's choice problem is, by contrast, myopic. We next discuss the user and buyer choice models in turn.
Users (Surgeons)
We model the utility from product
In addition to these three sources of utility, we incorporate two unobservable shocks. First, we allow for an i.i.d. shock at the surgeon-product-time level from an extreme value distribution in every period to model surgeon product choice as a probability that can be integrated across surgeons to obtain the product's share in each hospital and period. Finally, as in the model provided by Berry, Levinsohn, and Pakes (1995), we allow for an unobservable shock at the hospital-product-time level that helps match the model-predicted share with the observed aggregate hospital share data in each time period. Equation 1 presents the surgeon's utility function, the terms of which are defined in Table 4:
In the estimated model, we allow for product fixed effects (
All surgeons have tried the existing products and face no trial cost for those; they only face a trial cost for the innovation when they try it for the first time. We therefore model the trial process only for the innovation and track the evolving base of surgeons who have tried the innovation:
The Buyer
In each time period, the buyer decides whether to stay with the same supplier or switch to another supplier by signing a new contract. For this decision, the buyer considers (1) the predicted purchasing costs to the organization, (2) the cost of switching contracts to a new supplier, and (3) the predicted surgeon unhappiness if the buyer contracts with a supplier not preferred by users. Operationalizing the purchase costs and costs of switching is conceptually straightforward; our key innovation is in how we operationalize user unhappiness under alternative supplier contracts.
User disutility from buyer contracting
Let
We operationalize the effect of unhappiness of surgeon 

Note that in Equation 6, zero is included in the set of values of which we take the maximum, because it includes the currently contracted supplier. Therefore, the value of 
We now specify the per-period utility of the buyer at hospital 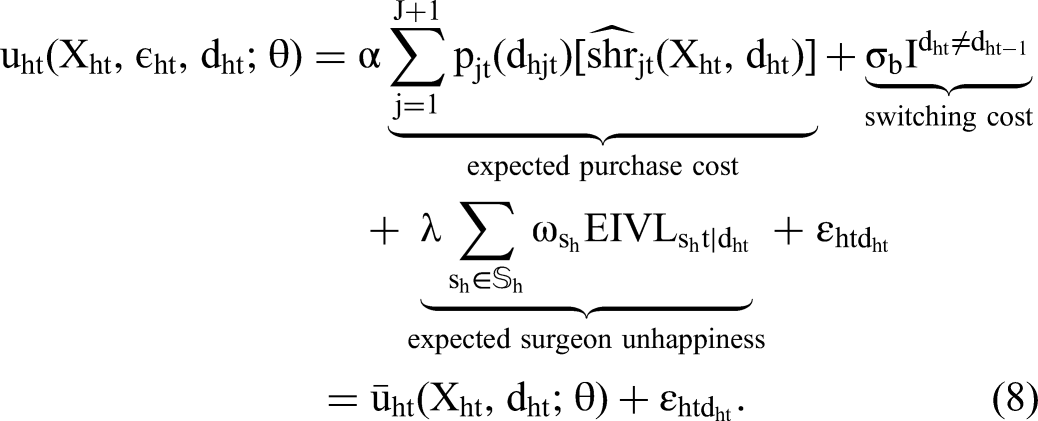
As more surgeons (users) adopt the new product, the buyer must decide whether to continue the contract with the current firm or switch to the innovating firm. The buyer's objective is to maximize the total discounted utility over the infinite horizon and can be summarized in the following sequence problem: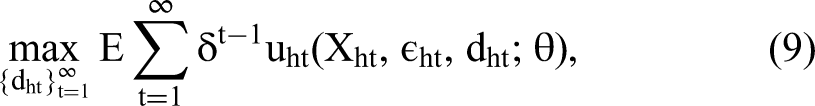
Value functions
We can rewrite the buyer's problem, presented in Equation 9, as an infinite sequence of single-period decisions. We first define the (ex post) value function as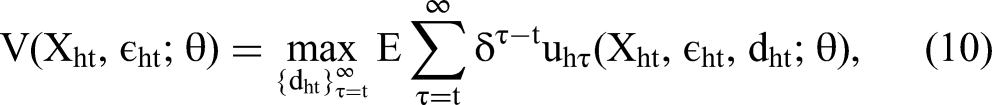


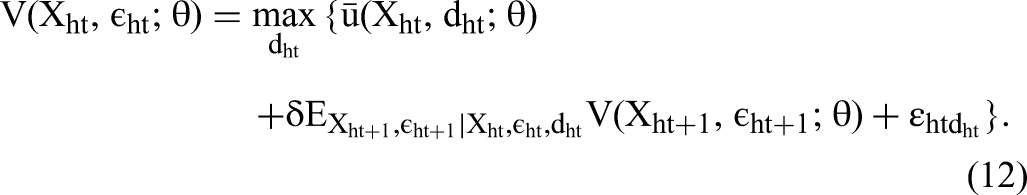

Transition of state variables
The set of observed state variables includes all the factors that affect each of the first three components of the utility specified in Equation 8. That set of factors entails on- and off-contract prices for different products, observed characteristics of surgeons (
In any period, there are two relevant prices for each product in each hospital: an off-contract price (
Estimation
Mojir and Sudhir (2021) combine the expectation maximization (EM) algorithm approach introduced in Arcidiacono and Jones (2003) with the mathematical program with equilibrium constraints (MPEC) approach developed in Su and Judd (2012) to estimate a dynamic structural model of consumer search with heterogeneous (latent class) preferences. In the MPEC approach, the dynamic structural model is formulated as a mathematical programming optimization problem of maximizing the likelihood function of observed agent choices. The Bellman equations of the dynamic structural model serve as constraints for the optimization problem. This approach has the advantage of not requiring contraction mapping to solve for the value functions in every stage of iteration, which speeds up estimation considerably.
The Arcidiacono and Jones (2003) EM approach introduces a computationally easier iterative method to estimate heterogeneous preferences by separating the estimation of utility preferences for each segment within an optimization step and describing the probability of belonging to a segment as a Bayesian update based on estimated utility preferences. The estimation approach is amenable to parallelization techniques, and we exploit these to speed up estimation.
We now describe how we adapt the procedure developed in Mojir and Sudhir (2021) to estimate the model of organizational buying. A key element of the organizational buying model is that there are multiple agents (surgeons and buyers in our setting) whose choices and interactions are considered in explaining organizational buying outcomes. Essentially, we estimate the surgeon model and buyer model parameters separately and iteratively, conditional on the parameters estimated for the other agent in the previous iteration or step. We begin by outlining the overall estimation algorithm and subsequently describe more details of the procedure.
The estimation algorithm is as follows:
Assume a certain number of segments. Start with initial values of buyer and surgeon model preference parameters for each segment and the segment probabilities for each hospital. Use generalized least squares (GLS)
18
to estimate surgeon model parameters for each segment, Estimate buyer model parameters for each segment, using estimated surgeon parameters from Step 2 and conditional probabilities of hospitals being in each segment. Update the conditional probabilities of a hospital being in each segment, using estimates of the surgeon model from Step 2 and buyer model estimates from Step 3. Go to Step 2 and iterate until convergence.
We first explain the estimation procedure for the surgeon model (Step 2). Next, we present the estimation for the buyer's dynamic model using the MPEC approach (Step 3). Finally, we discuss the calculations for conditional probabilities of segment membership in Step 4 and conclude with a brief discussion of identification. The EM algorithm allows parallelization and helps speed up Step 3, estimating the dynamic buyer structural model with heterogeneity.
19
 , conditional on segment probabilities for each hospital.
The Surgeon Model
To estimate the surgeon model, we need to obtain values of 


The market share equations are imposed in the first constraint, as in Dubé, Fox, and Su (2012). What is novel here is imposing surgeons’ adoption processes as constraints to the optimization problem (see Equations 16 and 17). This approach is equivalent to solving the nonlinear system of equations using contraction mapping to retrieve values of
We allow for observed heterogeneity among surgeons by categorizing them into high-share and low-share surgeons on the basis of their share of total surgeries in the category at each hospital. High-share surgeons may have different preferences for contract benefits. If a surgeon has an especially high share of surgeries, the off-contract supplier might provide a support representative just for that surgeon, in which case the surgeon would not care about using the off-contract product; however, if such accommodations are not available, it might be more costly for a surgeon to forgo the benefits of the contract. Therefore, the differential preference for contract benefits for high-share surgeons is an empirical question.
The Buyer Model
The buyer has two different options at each time period: sign a contract and commit to Supplier A, or sign a contract and commit to Supplier B (the innovator).
20
Using additive separability of the unobserved error shocks in the utility of the buyer, and assuming that it follows an i.i.d. Type I extreme value distribution, the probability of choosing each option based on the observed part of choice-specific value functions, conditional on estimated parameters for surgeons, is

We formulate the estimation of the buyer's parameters as a constrained optimization problem. That is, instead of using a contraction mapping approach to solve for the dynamic programming problem in each iteration, we will impose Bellman equations as constraints in maximizing the likelihood. In this case, choice probabilities would be written as functions of not only model parameters and state variables but also value functions.
More formally,
In Equation 21, the maximand could be written as the sum of multiple terms, each being a function of parameters for one segment. Given that there is no dependence in parameters across segments at this stage, instead of maximizing over all the parameters, we can maximize over the parameters of each segment separately. This design speeds up the estimation because the subproblems are faster to solve and can be solved in parallel.
Conditional Probabilities of Segment Membership
In Step 2 of the estimation procedure, we calculate the probability that each hospital is a member of each segment, conditional on a set of parameters and segment sizes. Following Arcidiacono and Jones (2003), we can write:

Identification
We present an informal discussion of identification of the model parameters starting with the user model. Unlike the common diffusion models of durable goods, wherein each consumer makes one purchase and exits the market, our model is for a disposable category involving trial, adoption, and ongoing product usage. As product quality tends to be relatively stable and surgeons do not directly consider price in choosing a product, the diffusion over time arises from the heterogeneity in the surgeon's timing of trial and the buyer's contract switching (through its step function impact on surgeon utility). Therefore, the gradual increase in share of the new product over time when there has been no contract switching allows us to identify the surgeon’s trial cost separately from product preferences. Further, the stable differences in long-term shares across the three products after contract switching and user adoption have stabilized identify the relative overall preferences for the three products.
The benefit from contracts for surgeons is identified by the change in product share after hospitals switch contracts. The effect of contract switching on shares varies by the share of high-share surgeons at the hospital; this variation identifies the differential benefits of contract by surgeon type. Cross-sectional variation in observed hospital characteristics (e.g., teaching hospital) identifies differential preferences based on these characteristics.
Because surgeons’ product choices in each period are conditional on the buyer's contract choices in that period, surgeon model parameters are identified independently of buyer utility parameters. Given surgeon model parameters, each hospital's purchasing cost and surgeon dissatisfaction and their evolution are known. Variation in hospitals’ purchasing costs helps identify the buyer's price sensitivity. This variation arises from differences in hospitals’ product share compositions and from differences in prices that hospitals face (mainly due to the status of compliance with SOW thresholds, hospital size, and changes in contracts after periodic renegotiations between suppliers and GPOs). The surgeon dissatisfaction (i.e.,
Results
We begin by reporting the model estimates and then discuss the counterfactual analyses.
Model Estimates
Table 5 presents the estimates of the structural model with two segments. All parameters are statistically significant either at the 1% or 5% level, except the buyer's aversion to surgeons’ dissatisfaction (i.e.,
Model Estimates.

*p < .05.
**p < .01.
***p < .001.
Notes: Standard errors are in parentheses.
The first segment makes up more than two-thirds of the sample. We begin with discussion of the surgeon utility function. Segment 1 has higher preference for the new product:
As expected, low-share surgeons of both segments have a higher contract utility (i.e., low-share surgeons value the contract benefits more;
Buyers in Segment 2 are more price sensitive, whereas buyers in Segment 1 are more reluctant to switch contracts (larger magnitude of
Table 6 compares the observed behaviors of the two latent segments. Given that the innovation from Supplier B is superior in quality but more expensive, buyers who care more about price are more likely to stay with Supplier A, but surgeons who care about product superiority are more likely to switch to the new supplier. Therefore, we expect the user-centric segment to switch to the innovation faster. In fact, the probability of switching is much higher for the user-centric segment at 42.2% and is negligible at 2.9% for the buyer-centric segment. 22 As anticipated, conditional on switching, the probability of being in the user-centric segment is 87.1%. In terms of observable characteristics, teaching hospitals have a larger share in the buyer-centric segment, but as expected, the concentration of surgeries measured in either percentage of high-share surgeons or HHI index is significantly higher in the user-centric segment.
Segments’ Observed Behavior.

Notes: This table presents key dimensions of each segment's observed behavior. To calculate the numbers presented in this table, we computed the average value for each variable across all the hospitals weighted by each hospital's probability of being a member of each segment over the total number (i.e., sum of membership probabilities) of hospitals in the segment. The membership probabilities are calculated using Equation 22 in Step 3 of the estimation algorithm.
Counterfactual Analysis
We consider two counterfactuals. The first reveals how push–pull marketing tactics targeted toward buyers versus users in an organizational buying setting influence market outcomes. The second investigates how SOW discounts affect the diffusion of innovations; specifically, we assess the conventional wisdom that SOW contracts always favor dominant firms, even when smaller firms launch superior products. 23
Marketing Mix and Push–Pull Tactics
An important marketing question in organizational buying contexts is whether and when sellers should focus on push tactics targeted to buyers versus pull tactics targeted to end users (surgeons). This counterfactual explores the differential impact of push–pull tactics. We operationalize the pull tactic with a 10% increase in the coefficient of user preference for Supplier B's new product (i.e.,
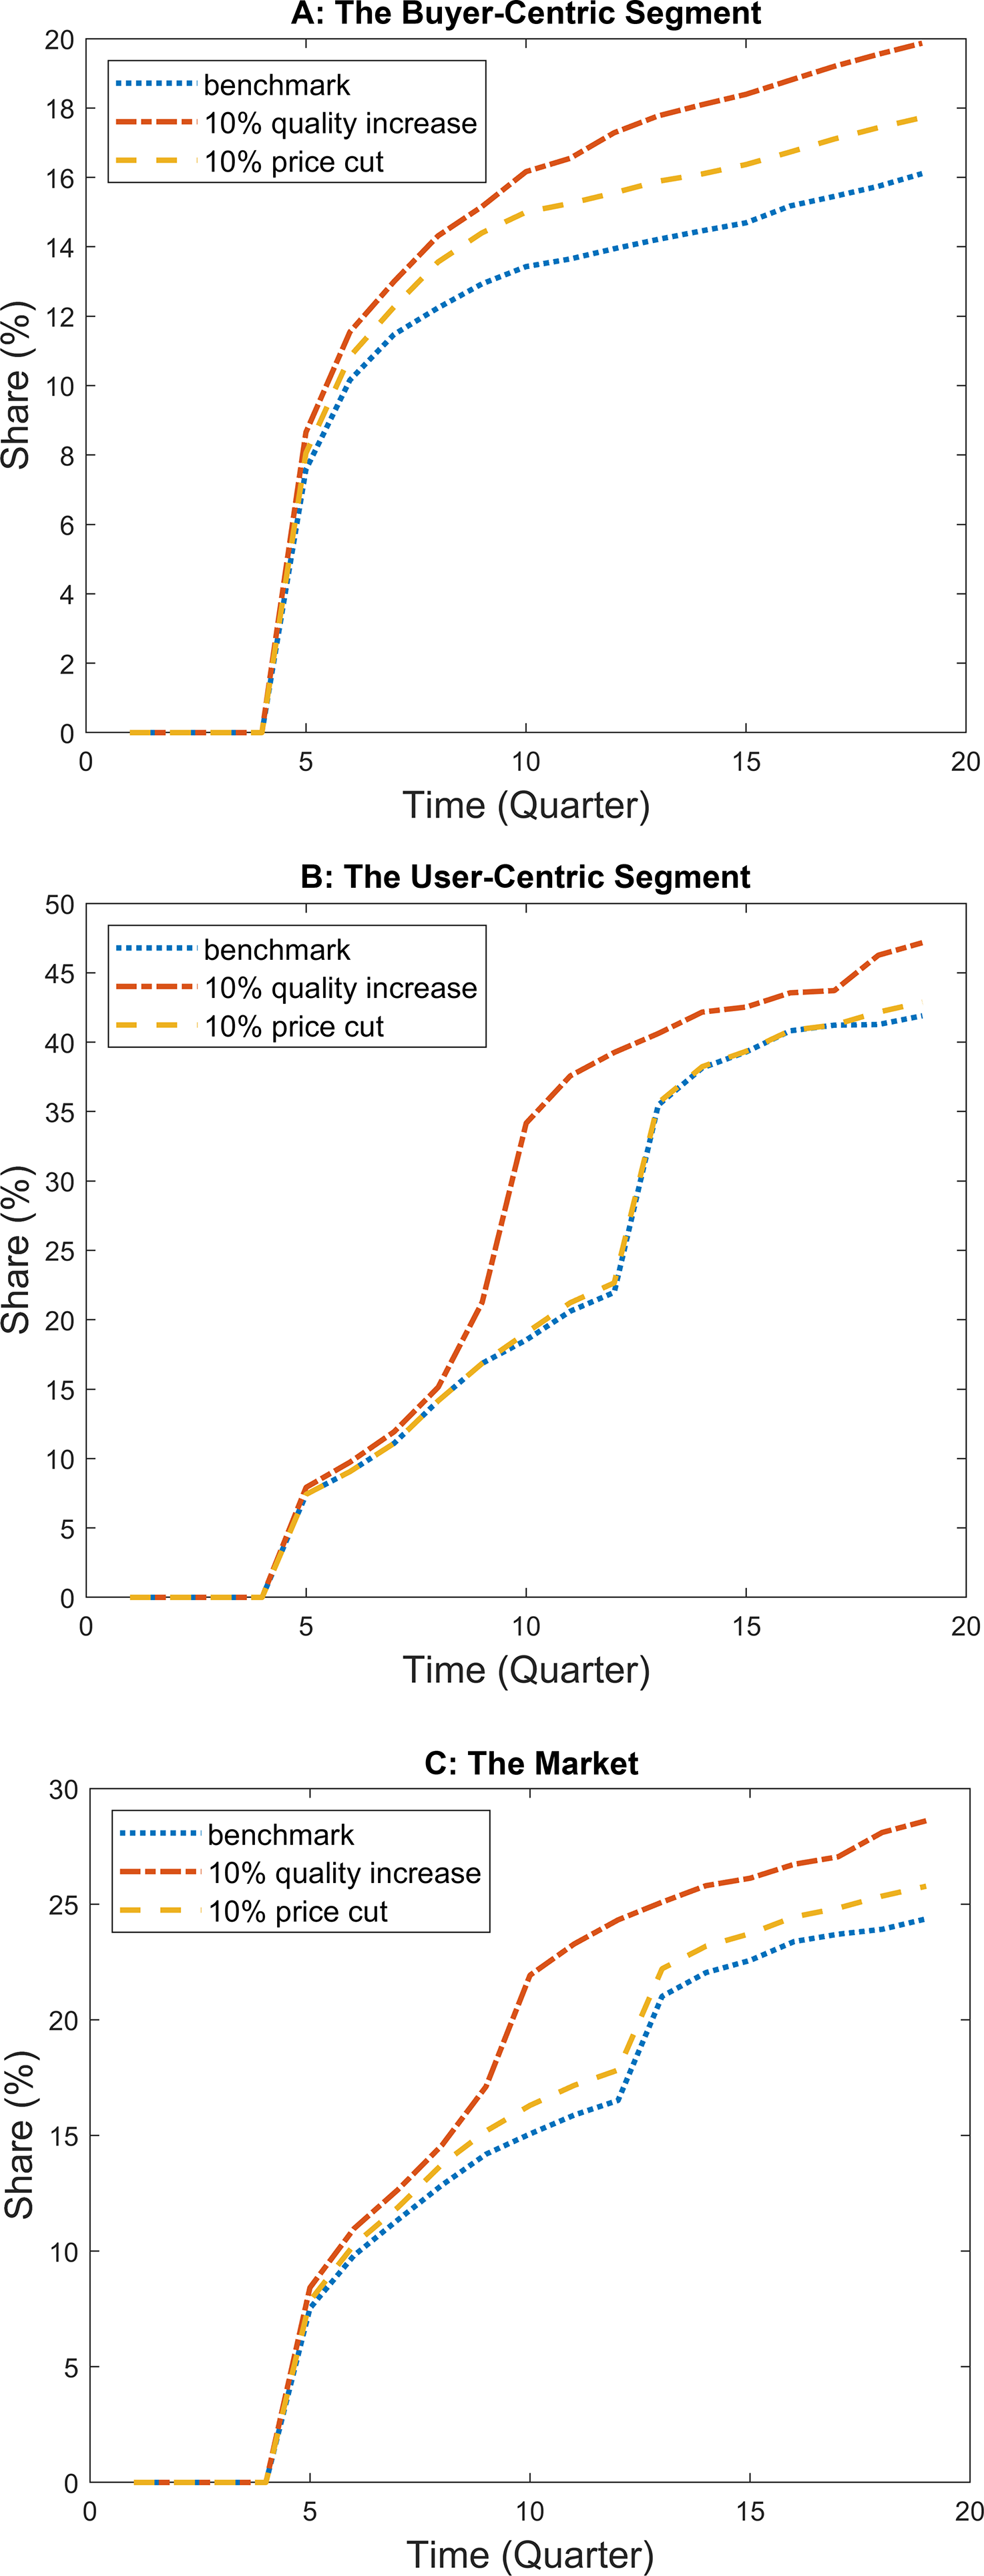
Change in diffusion of new product with price cuts and product quality improvement.
To understand the results, it is useful to recognize that buyers are more sensitive to price cuts, whereas surgeons are more sensitive to product improvements. We begin our discussion with the buyer-centric segment. Interestingly, although buyers care directly about price, both price cut and preference increase lead to faster and higher penetration in the buyer-centric segment. This is because even when Supplier B offers a price cut, Supplier A's product is still cheaper and preferred by the buyer. Thus, the buyer has little incentive to switch to Supplier B; at most hospitals, Supplier B's shares do not exceed the 20% threshold even 15 quarters after the innovation launch. In the few hospitals where usage exceeds 20% (mostly hospitals with higher surgery concentration and teaching hospitals), the discount speeds up contract switching to Supplier B, leading to an increase in average shares with price cuts compared with the benchmark. In contrast, with the preference increase, the 20% threshold is met more often because of the pull from the surgeons. Thus, for a smaller player to succeed in buyer-centric hospitals that receive SOW discounts, increasing user product preference is more effective; price cuts are not that effective when the innovation is more expensive.
Next, we discuss the user-centric segment. Interestingly, here the price discount has almost no effect on innovation diffusion, as buyers have little ability to change surgeon behaviors, and the price cut does not increase surgeon usage. Therefore, the SOW discount has little impact on contract switching, and overall price discounts do not affect diffusion at all. In contrast, the improvement in product preference leads to greater adoption among surgeons, and their choices lead to accelerated contract switching among hospitals in this segment.
Overall, we conclude that an innovating small supplier selling a relatively higher-quality, more expensive product in markets with SOW contracts will find it better to invest first in pull tactics that increase product preference (e.g., surgeon education, more user benefits) than to invest in push tactics (e.g., price discounts or buyer-focused service). Further, the pull strategy is more effective in the user-centric segment. Within the user-centric segment, it is important to seed the diffusion early on and generate the pull effect by marketing to surgeons to increase their adoption. But once share of the innovating supplier is close to the SOW contract threshold of 20%, adopting push tactics that persuade buyers to switch contracts helps accelerate diffusion. 25 The counterfactual illustrates how our organizational buying model can inform which marketing tactics to adopt for which stakeholder and when. Consider especially that although the user-centric segment has higher price sensitivity, without the pressure from users to switch, the price cut has lower impact on the user-centric segment than on the buyer-centric segment.
SOW Discounts and the Diffusion of Innovation
We next explore how SOW discounts affect innovation diffusion, especially those from smaller firms. As discussed, this counterfactual is interesting given that extant theory research concludes that SOW contracts favor dominant firms. It is also motivated by the smaller Supplier B's concern that SOW discounts are intrinsically anticompetitive and suppress innovations from smaller firms, which could warrant regulatory actions or remedies. 26
We simulate the new product diffusion under two counterfactual scenarios: (1) reducing the SOW thresholds for both suppliers by 10% (from 80% to 70% for Supplier A and from 60% to 50% for Supplier B) or (2) setting SOW thresholds to zero. In both scenarios, we allow additional services (e.g., better stocking, support for product use during surgery) under a contract as before; thus, the buyer and supplier could still influence the demand for different products in the hospital through the choice of the contract. If the semi-exclusive nature of SOW discounts slows the diffusion of innovations from smaller players, we would expect to see adoption of Supplier B’s new product speed up when we lower the SOW threshold or eliminate SOW discounts.
Because our model does not include a pricing game, we allow for contract discounts to change when SOW thresholds change in this counterfactual analysis. Maintaining the original off-contract prices, we conduct a grid search over a focal supplier's discounts, conditional on the other supplier's discount choice, and vice versa iteratively until convergence, to arrive at the new equilibrium discount. Not surprisingly, discounts are lower for both suppliers with lower share commitments. The larger Supplier A, with the higher discount threshold of 80%, reduces the discount by 30% for the no-SOW-threshold case and by 20% for the lower-SOW-threshold case. The corresponding discounts for Supplier B, with the less stringent threshold of 60%, are 10% and 5%. 27
Recall that Supplier A's product is cheaper, and all else being equal the buyer would prefer Supplier A. Thus, the buyer-centric segment is likely to be more aligned with Supplier A. Further, although Supplier B's innovation has a higher price, it is considered superior and preferred by surgeons who do not consider price. Consequently, the innovation is likely to succeed more in the user-centric segment. Figure 8 presents the diffusion of the new product under the two counterfactual scenarios and a benchmark with the SOW thresholds in the market (80% for A and 60% for B). We highlight two key results. First, contrary to Supplier B's concern that SOW discounts hurt its innovation, the SOW discounts with tighter thresholds speed up diffusion; in fact, the more exclusive the contract, the faster the diffusion. Second, despite their price sensitivity, SOW thresholds and discounts have little impact on innovation diffusion in the buyer-centric segment. The faster diffusion is due to the user-centric segment.

The effect of share-of-wallet contracts on diffusion of the new product.
Clearly, buyers prefer Supplier A's product even without SOW discounts (because of the lower off-contract price). Therefore, buyers in the buyer-centric segment try to suppress the innovation's diffusion by contracting with Supplier A; they can persuade surgeons to continue using Supplier A's product because contract benefits are highly valued by surgeons in the buyer-centric segment. Thus, the share of Supplier B's innovation never exceeds 20% at these hospitals, so there is little difference in the innovation diffusion trajectory either with or without SOW discounts in this segment.
For the user-centric segment, where surgeons have greater influence and contract benefits are less valued, more surgeons are willing to try the innovation, and buyers are less able to use contracts to restrict them. Forward-looking buyers switch contracts as Supplier B's share reaches the SOW noncompliance threshold for Supplier A and the hospital cannot receive discounts from Supplier A; contract switching speeds up surgeon trial of the innovation and helps the hospital reach Supplier B's threshold faster. For both the benchmark and lower-SOW-threshold cases, the innovation diffusion accelerates at two points compared with the no-SOW-threshold case. Around Q7, hospitals with higher surgery concentration (and some teaching hospitals) reach the noncompliance threshold for Supplier A; forward-looking buyers switch contracts to reach Supplier B's threshold faster. For the benchmark case, other hospitals pass the 20% threshold (the noncompliance threshold for Supplier A) at Q12 and switch contracts. In the lower-SOW-threshold case, this passing of the noncompliance threshold is delayed by two quarters, as the buyer now has more room before hitting Supplier A's noncompliance threshold (30% instead of 20%). Nonetheless, the maximum share after 19 quarters for both the benchmark and lower-SOW-threshold cases is the same. In the no-SOW case, however, the buyer does not have much incentive to switch contracts, because the hospital pays Supplier A's very low discounted prices regardless of the supplier's share, as long as it has a contract with the supplier. This lack of incentive for buyers leads to fewer hospitals switching contracts to Supplier B, and explains the more gradual diffusion of the new product under the no-SOW scenario. Overall, with SOW thresholds, Supplier B reaches more than a 40% share of sales in the user-centric segment and about 25% of market share. Our result contrasts with the extant conclusions in the theoretical literature based on unitary buyer models that SOW contracts always favor dominant firms; it clarifies the importance of accounting for the multistakeholder nature of organizational buying to generate the correct insights around SOW contracts because of their different impacts on users and buyers. 28
Conclusion
We develop a structural model of organizational buying behavior accommodating the preferences and interactions of multiple stakeholders (users and buyers). It is particularly applicable in RER contexts, where a buyer periodically evaluates and chooses contracts and downstream users choose between on- and off-contract products, conditional on the buyer's decision. The model accounts for the effect of buyers’ contracting decisions on users’ trial and ongoing usage of the innovation. Similarly, it allows for user influence on buyers. A key idea is how we account for user influence on the buyer through an internally consistent utility-based construct of user dissatisfaction with the buyer-chosen contract (inclusive value loss). We contribute to the innovation diffusion literature by introducing a novel structural model for diffusion of disposables in a trial-repeat context, in contrast to past structural models of diffusion focused on one-time durable goods purchases. Finally, the article introduces an empirical analysis of SOW contracts, which are common in B2B markets.
In terms of findings, our research provides insights on the effective use of push–pull tactics in B2B markets. For example, it illustrates how a smaller innovator with a major innovation that is liked by users can use pull tactics to build early market share and then shift to push tactics once it has breached the SOW threshold. Further, in contrast to conventional wisdom that SOW contracts always favor larger firms, we show that in multistakeholder settings (involving a buyer and users), SOW contracts can help accelerate innovation diffusion even from smaller firms as long as their products are major innovations that are strongly preferred by end users. This finding should give regulators pause on treating SOW contracts as per se anticompetitive and antithetical to innovation in markets where small manufacturers drive innovation.
We conclude with a discussion of limitations and suggestions for future work. Although our main contribution is the development of an empirical framework to model organizational buying behavior under SOW contracts, the application is in one category: a disposable surgical device product sold to hospitals and used by surgeons. Future work should extend the model and analysis for other product categories across a range of B2B markets to yield richer insights about how different user, buyer, and influencer interactions shape organizational buying outcomes. Similarly, it would be useful to assess the generalizability of our conclusions about SOW contracts and their effect on innovation diffusion in settings with other market structures.
As our model applies to buying modes involving RERs, we hope future research can employ our framework in other RER contexts; some examples include procurement from original equipment manufacturers by downstream producers or service contracting (e.g., information technology maintenance contracts). The buying center in these cases usually consists of multiple stakeholders with diverging preferences and priorities (e.g., design engineers and sourcing directors or employees and information technology departments) and ongoing use of suppliers/service providers to address user-specific needs as they arise. Further, with novel technologies such as Internet of Things and cloud-based services, usage data beyond purchases and contracting choices in B2B markets are becoming easily available (e.g., Mojir and Yucaoglu 2021). Overall, along with easier data availability, our modeling framework that addresses critical challenges in the econometric modeling of organizational buying will catalyze interest and growth in B2B research.
Supplemental Material
sj-pdf-1-mrj-10.1177_00222437221084986 - Supplemental material for A Structural Model of Organizational Buying for Business-to-Business Markets: Innovation Adoption with Share-of-Wallet Contracts
Supplemental material, sj-pdf-1-mrj-10.1177_00222437221084986 for A Structural Model of Organizational Buying for Business-to-Business Markets: Innovation Adoption with Share-of-Wallet Contracts by Navid Mojir and K. Sudhir in Journal of Marketing Research
Footnotes
Acknowledgments
The authors thank the participants at marketing seminars at Chinese University of Hong Kong, University of Colorado, Cornell University, Duke University, Harvard Business School, Hong Kong University of Science and Technology, University of Illinois, University of Maryland, University of Minnesota, University of Notre Dame, University of Rochester, Syracuse University, Texas A&M University, University of California San Diego, University of Southern California, University of Texas at Dallas, University of Virginia, the marketing camp at Dartmouth University, the 2018 Institute for the Study of Business Markets Academic Conference, the 2017 KU Leuven Manufacturer-Retailer Symposium, and the 2017 Marketing Science Conference. This article builds on dissertation proposals that received the 2016 Marketing Science Institute Alden G. Clayton Award, the 2016 INFORMS Society for Marketing Science Dissertation Proposal Award, and the 2015 Institute for the Study of Business Markets Dissertation Proposal Award.
Associate Editor
Shrihari Sridhar
Declaration of Conflicting Interests
The author(s) declared no potential conflicts of interest with respect to the research, authorship, and/or publication of this article.
Funding
The author(s) received no financial support for the research, authorship, and/or publication of this article.
Notes
References
Supplementary Material
Please find the following supplemental material available below.
For Open Access articles published under a Creative Commons License, all supplemental material carries the same license as the article it is associated with.
For non-Open Access articles published, all supplemental material carries a non-exclusive license, and permission requests for re-use of supplemental material or any part of supplemental material shall be sent directly to the copyright owner as specified in the copyright notice associated with the article.