
Abstract
Discriminant validation examines to what extent constructs measured with multi-item scales, which are hypothesized to be conceptually distinct, are empirically distinct. A literature review of published scale development studies shows that a variety of criteria and approaches to assess discriminant validity are in use. However, the requirements for an appropriate criterion have not been spelled out, which has led to the use of problematic criteria. The present research introduces three requirements that an appropriate discriminant validation criterion should satisfy, concerning the correlation, comparison standard, and comparison method. It shows that the common Fornell–Larcker criterion is based on an inappropriate comparison standard and method and that alternative criteria have weaknesses as well. The authors therefore propose an improved comparison standard, congeneric reliability, and develop a systematic discriminant validation procedure based on congeneric reliability and the existing phi criterion, both of which satisfy the three requirements. The procedure provides continuous measures of support for discriminant validity and accounts for measurement and sampling error. A detailed case study and reanalyses of seven published scale development articles demonstrate the application and strengths of the procedure. Example code and an online application facilitate its implementation.
Discriminant validation examines to what extent constructs measured with multi-item scales, which are hypothesized to be conceptually distinct, are empirically distinct. Discriminant validation is crucial for both the development of new scales and the deployment of existing ones (Churchill 1979; Gerbing and Anderson 1988; Haws, Sample, and Hulland 2023; MacKenzie, Podsakoff, and Podsakoff 2011). Constructs should be empirically distinct from conceptually related constructs, and the same holds for the dimensions of multidimensional constructs. Lack of support for discriminant validity encourages the proliferation of semantically distinct but empirically indistinguishable constructs (Shaffer, DeGeest, and Li 2016). Such conceptual fragmentation hampers theoretical progress, complicates syntheses of the literature, and may give the illusion of theoretical richness where conceptual redundancy prevails (Albert and Thomson 2023; Morrow 1983). It also reduces the effectiveness of managerial interventions that are based on the assumed distinctiveness of constructs and their measures. Establishing discriminant validity between similar but distinct constructs therefore enables the development and testing of meaningful theories and practical interventions based on these theories.
Various criteria to assess discriminant validity have been proposed and are being used (Fornell and Larcker 1981; Franke and Sarstedt 2019; Henseler, Ringle, and Sarstedt 2015; Rönkkö and Cho 2022; Voorhees et al. 2016). However, current practice faces two challenges. First, the requirements that an appropriate discriminant validation criterion should meet have not been spelled out explicitly. This has resulted in a plethora of criteria (Rönkkö and Cho 2022) and conflicting recommendations. For instance, Voorhees et al. (2016, p. 133) conclude that the widely used criterion proposed by Fornell and Larcker (1981) “should be the standard for discriminant validity testing.” In stark contrast, Rönkkö and Cho (2022, p. 27) advocate against the use of this criterion because it has “a very high false positive rate” (i.e., it flags discriminant validity problems when none are present). Second, it is unclear how appropriate individual criteria can be combined to comprehensively assess the discriminant validity of constructs. Recently, Rönkkö and Cho (2022) have argued that discriminant validation procedures should refrain from drawing “all or nothing” conclusions and instead should assess the degree of distinctiveness of constructs. A systematic discriminant validation procedure incorporating multiple criteria would enable this but is currently unavailable.
The present research addresses these challenges as follows. First, based on the measurement and scale development literatures (Fornell and Larcker 1981; Lord and Novick 1968; Rönkkö and Cho 2022), we identify three requirements that an appropriate discriminant validation criterion should satisfy. Specifically, a conceptually valid criterion should use an appropriate correlation, comparison standard, and method of comparison.
Second, we document the use of discriminant validation criteria in a review of 79 scale development articles published between 2000 and 2024, which updates earlier reviews in marketing (Voorhees et al. 2016) and management (Shaffer, DeGeest, and Li 2016). It shows that commonly used and newly proposed discriminant validation criteria fail one or more of the three requirements and therefore cannot be recommended for discriminant validation. This is particularly the case for the Fornell and Larcker (1981) criterion. Although this criterion is routinely recommended (Albert and Thomson 2023; Farrell 2010; Pieters 2017; Voorhees et al. 2016) and the article in which it was proposed is the most highly cited article in the Journal of Marketing Research (having garnered over 90,000 cumulative citations according to the Web of Science as of this writing), we demonstrate that the criterion is inappropriate for discriminant validation of multi-item scales and should no longer be used.
Third, we propose a new two-step procedure for discriminant validation that integrates two criteria, the existing phi criterion and a new congeneric reliability (CR) criterion, both of which meet all three requirements. The proposed procedure offers a graded approach to discriminant validation and moves beyond binary “yes” or “no” conclusions. Annotated R code and an online Shiny application (app) implement the proposed procedure.
Fourth, we demonstrate empirically that using the CR criterion instead of the Fornell and Larcker (1981) criterion matters in practice. We do so with a detailed case analysis and by reanalyzing seven articles that report discriminant validity issues. The results demonstrate that the proposed procedure can lead to conclusions about discriminant validity that differ from and are more informative than those reached by currently used approaches.
The following section presents the three requirements for an appropriate discriminant validation criterion. We then assess the extent to which current criteria satisfy the three requirements. Next, we describe the new discriminant validation criterion and a procedure that incorporates the new criterion and an existing one. Next, we report the empirical applications. The final section offers recommendations. Supplemental material, including data and R code, is available on OSF (https://osf.io/57srv/). The Shiny app can be found at https://constantpieters.shinyapps.io/discriminantvalidation/.
Three Requirements for Discriminant Validation Based on the Confirmatory Factor Model
Discriminant validation assesses to what extent constructs are empirically distinct (Campbell and Fiske 1959; Fornell and Larcker 1981; Jöreskog 1971; Lord 1957; Rönkkö and Cho 2022). Both direct and indirect approaches have been proposed for this purpose. Direct approaches examine whether the correlation between two constructs is small enough relative to some comparison standard (Campbell and Fiske 1959). Indirect approaches complement the direct approaches; they examine, for example, whether a construct C relates differently to constructs A and B, or whether C moderates the association between A and B. Such findings support the distinctiveness of A and B (Franke, Sarstedt, and Danks 2021; Tesser and Krauss 1976). Because the direct approach is more common, and the indirect approach does not provide direct evidence about the discriminant validity between A and B and requires information about C, our research focuses on direct discriminant validation.
Next, we describe three requirements that a discriminant validation criterion under the direct approach should satisfy. Because direct discriminant validation entails comparing a correlation with a comparison standard, the three requirements (which are jointly sufficient) focus on the correlation, the comparison standard, and the comparison method.
To guide the analysis, Figure 1 presents a confirmatory factor model with hypothetical population-level data as an illustration. It contains two correlated constructs, each represented by a factor and measured with multi-item scales. Both factors are measured with three items: F1 with x1–x3 and F2 with x4–x6. The model readily extends to situations with additional factors and more or varying numbers of items for each factor. For all items xi, the loadings λi1 or λi2 quantify how well an item measures F1 or F2, respectively. In the example, the loadings of x1–x3 on F1 are .550, .750, and .950, respectively, and the loadings of x4–x6 on F2 are all .700. For ease of exposition, the observed items are assumed to be standardized so that random measurement error ɛ has variance
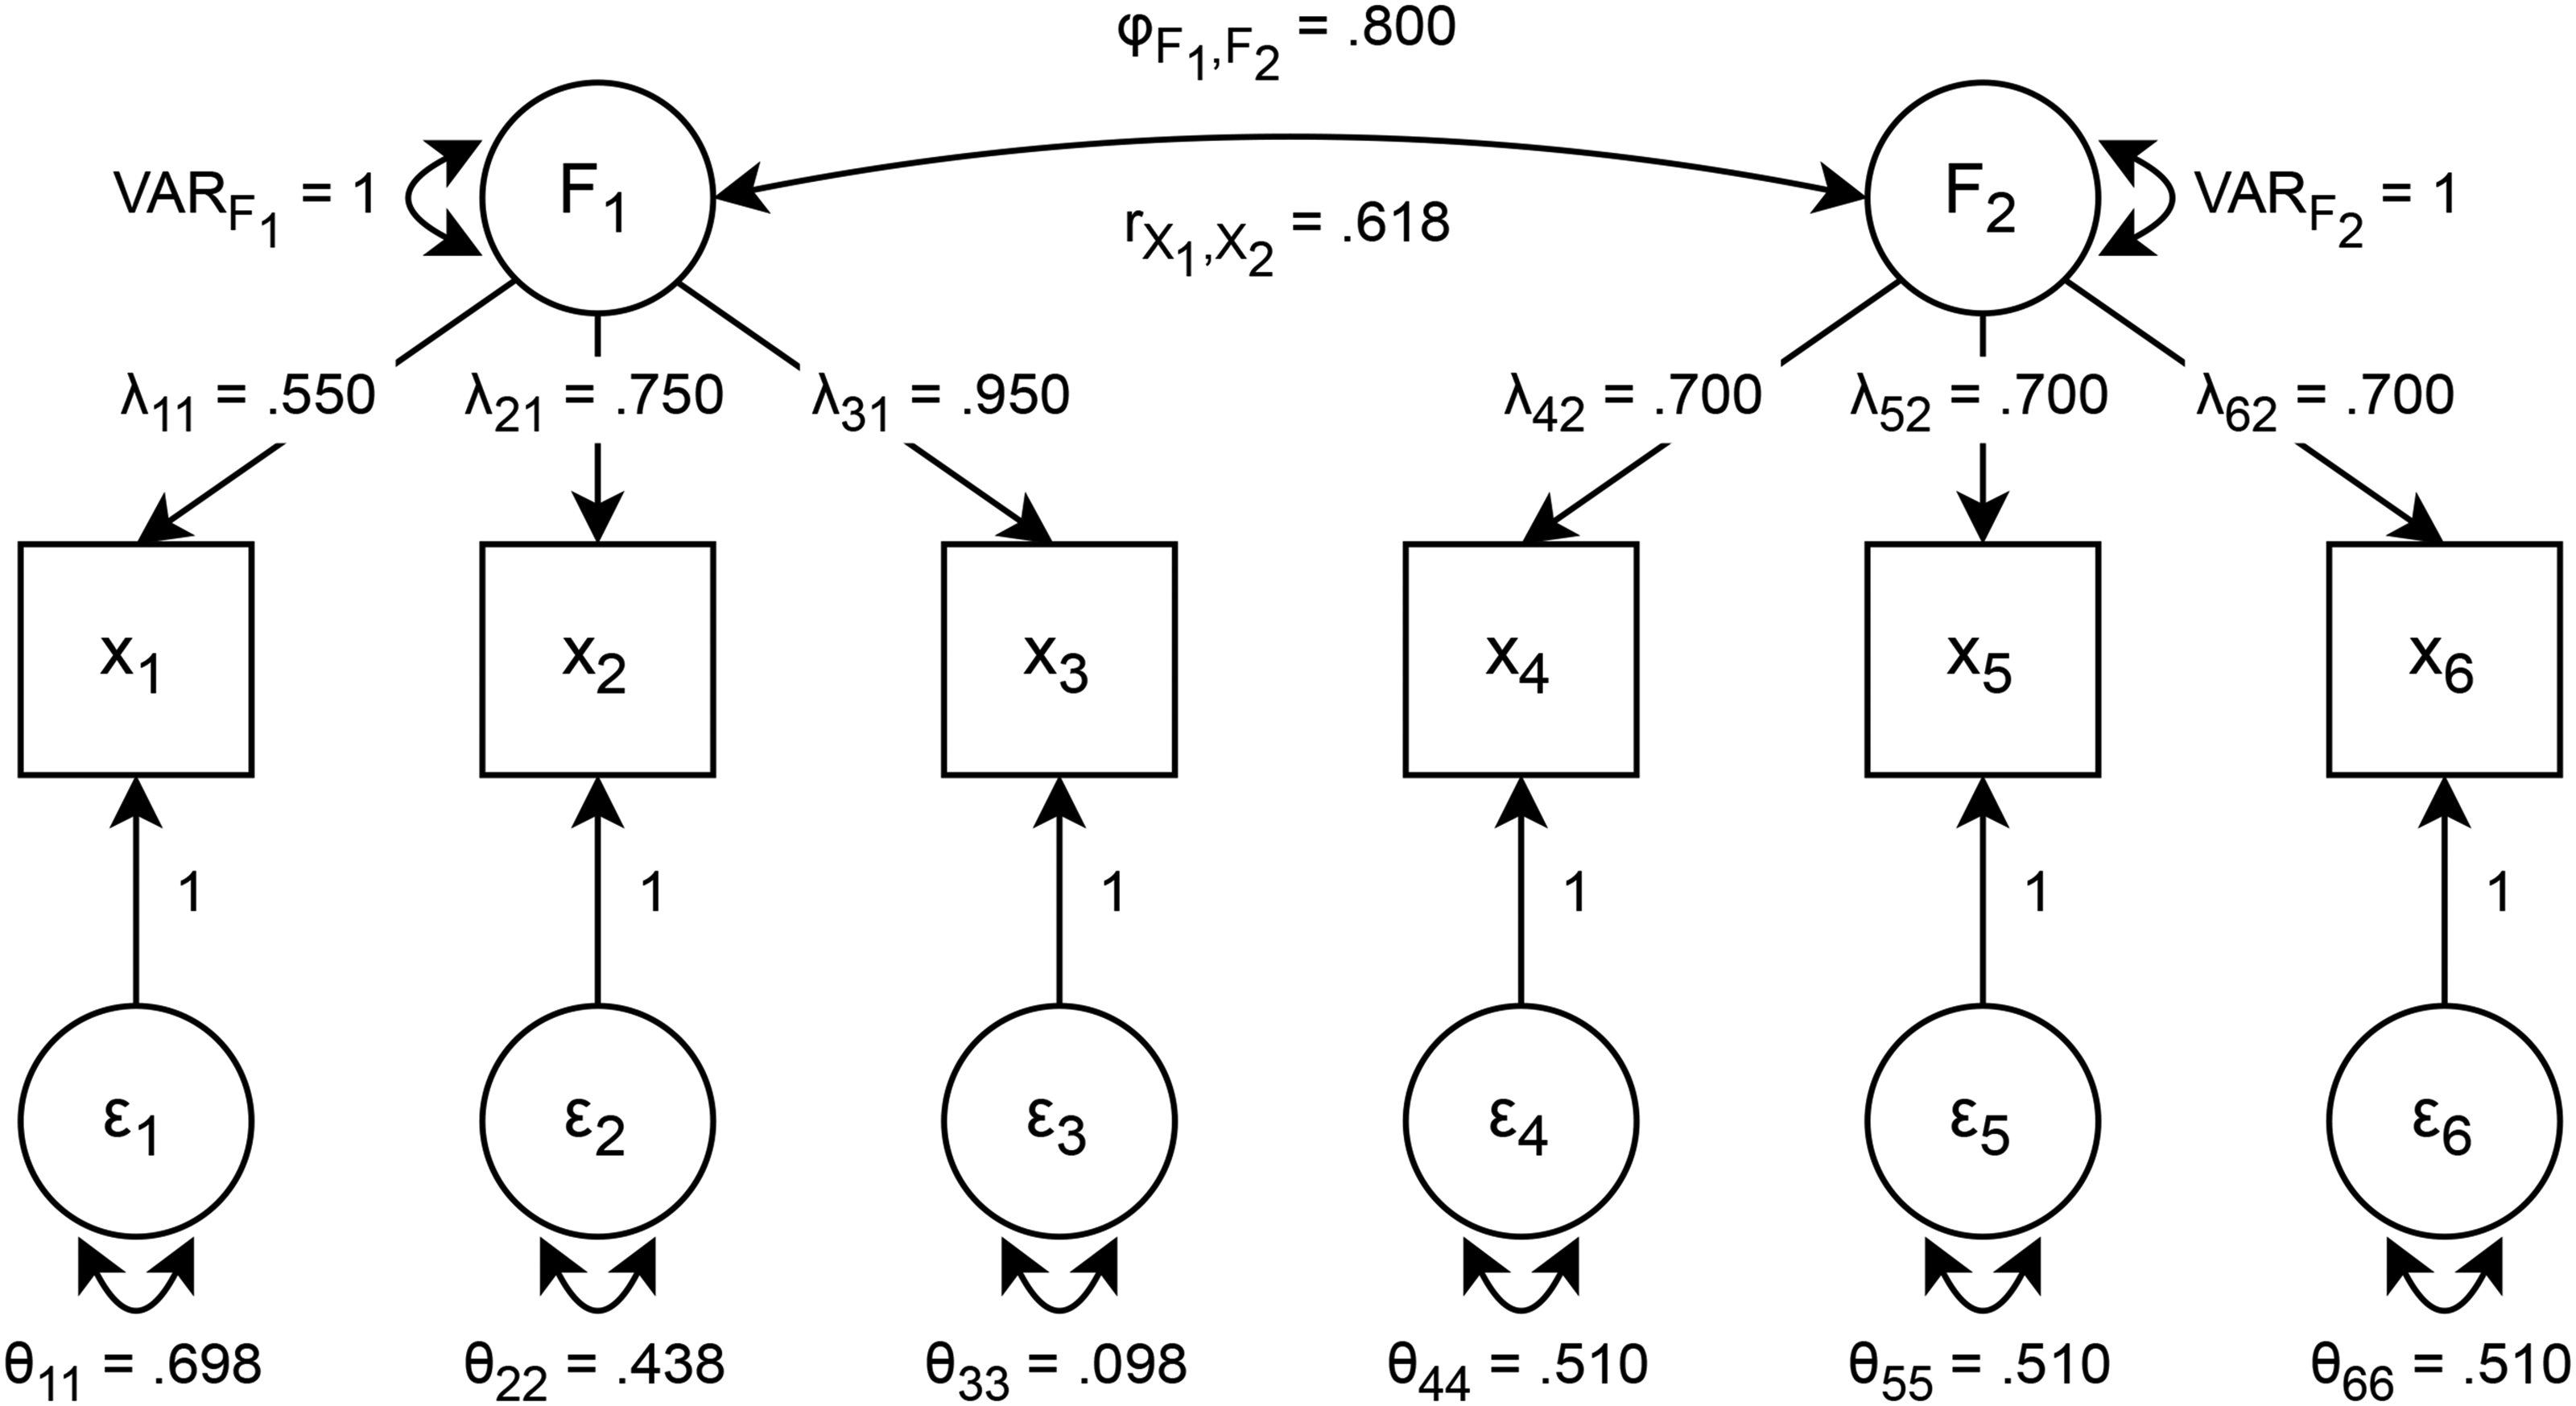
Illustrative Discriminant Validation Model.
Three classic measurement models have been distinguished in the psychometric literature (Lord and Novick 1968). The parallel measurement model, which is the most restrictive, assumes that all items of a given factor have the same loadings and error variances. The (essentially) tau-equivalent measurement model, which is less restrictive, allows the error variances of the items to vary, but it assumes that the loadings of all items measuring a given factor are the same. The congeneric measurement model, which is the most general and flexible model, allows both the loadings and the error variances of the items to vary. Applying these concepts to the example in Figure 1, the three items measuring factor F2 comprise a parallel measurement model: All three loadings are .700 and all three error variances are .510. The three items measuring F1 comprise a congeneric measurement model because both the loadings and error variances vary. This example also shows that with standardized items the parallel and tau-equivalent models are the same because identical loadings across items imply identical error variances.
Requirement 1: Use a Factor Correlation Derived from a Well-Fitting Confirmatory Factor Model
An appropriate correlation estimates the true correlation between constructs by accounting for measurement error. A correctly specified and well-fitting confirmatory factor analysis (CFA) model explicitly accounts for measurement error, making the resulting factor correlation (φ, phi) an appropriate correlation measure. In contrast, correlations between observed scale scores are biased because they do not sufficiently account for measurement error and should therefore be avoided in discriminant validation.
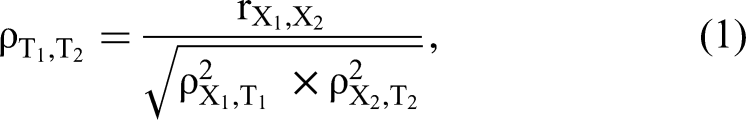
There are two sources of measurement error. First, random measurement error reduces the reliability of multi-item measures and thereby attenuates the correlation between scale scores. This exaggerates discriminant validity because the bivariate correlation between observed scale scores is almost always smaller than the true correlation and never larger. For two constructs, the relationship between the true correlation
Second, systematic measurement error can either attenuate or inflate the correlation between the observed scores of multi-item measures. For example, individual differences in stylistic responding (e.g., acquiescence) or properties of items such as their keying direction can bias the correlation upward or downward (Baumgartner and Weijters 2022). Also, items that primarily capture one construct may cross-load on another construct, which can inflate the factor correlation when the cross-loadings are restricted to 0 (Asparouhov and Muthén 2009). A correctly specified CFA and well-fitting factor model provide evidence that the estimated factor correlation is unconfounded by systematic measurement error. Ideally, the chi-square value that assesses overall model (mis)fit will be sufficiently low, but when the sample size is relatively large, even relatively minor misspecifications, such as small nontarget loadings or small error covariances, can produce large chi-square values. Alternative fit indices such as RMSEA (root mean square error of approximation), CFI (comparative fit index), or TLI (Tucker–Lewis index) may then be used to assess whether the fit of the model is good enough from a practical perspective (see Baumgartner and Weijters [2022] for details, including robust test statistics and flexible cutoff values for alternative fit indices). In the example of Figure 1, systematic error is absent and the fit of the model is perfect.
There are several alternative approaches besides CFA to account for measurement error, which are not recommended. First, the correlation between observed scale scores can be corrected for measurement unreliability post hoc via a model-free approach using Equation 1. For the example of Figure 1, using the CR values of .804 for F1 and .742 for F2 to correct the observed correlation of .618 recovers the true correlation of .800 perfectly because the model fit is perfect and appropriate reliability estimates are used (discussed subsequently). However, such post hoc corrections of the observed correlation often rely on simplifying assumptions and therefore may not correctly estimate the true correlation. For instance, using Cronbach's coefficient alpha assumes that the items are at least tau-equivalent and underestimates reliability if this assumption is violated. An underestimated reliability then overcorrects the observed correlation. Cronbach's coefficient alpha is .785 for F1 and .742 for F2 in the example. Coefficient alpha and CR are identical for F2 because tau-equivalence holds in the present case. However, coefficient alpha underestimates the true (congeneric) reliability of F1 (.785 vs. .804) and therefore (slightly) overestimates the true correlation (.810 vs. .800). In practical applications, the bias could be larger, but the presence and magnitude of the bias is unknown without an explicit measurement model as in CFA. Moreover, model-free approaches to estimating the factor correlation, such as post hoc corrections, cannot assess the presence and effect of systematic measurement error (Rönkkö and Cho 2022).
Second, although exploratory factor analysis (EFA) can be used to estimate the factor correlation or ascertain whether the hypothesized number of factors can be recovered, it is inappropriate for discriminant validation. EFA does not fully account for measurement error and thus produces biased correlation estimates (Bollen 1989). Moreover, EFA with orthogonal factors, such as when using the common varimax rotation, is uninformative for discriminant validation because it imposes uncorrelated factors a priori, even though the factor correlation is the metric of interest. Recovering the hypothesized number of factors in an EFA or not finding substantial cross-loadings of items on nontarget factors is also inappropriate because it does not assess discriminant validity but instead explores the dimensionality of constructs measured with multiple items (Gerbing and Anderson 1988).
Requirement 2: Compare the Factor Correlation with a Principled Maximum Correlation
The comparison standard is pivotal in discriminant validation and widely debated (Franke and Sarstedt 2019; Henseler, Ringle, and Sarstedt 2015; Rönkkö and Cho 2022; Voorhees et al. 2016). An overly lenient standard risks false claims of discriminant validity, whereas an overly strict standard risks false rejections of discriminant validity.
We distinguish three categories of comparison standards: (1) a perfect correlation of 1, (2) correlations smaller than 1, and (3) scale reliability. First, using a perfect correlation of 1 as a comparison standard ensures that conceptually distinct constructs are not perfectly correlated (Lord 1957). This is an appropriate standard because two perfectly correlated constructs (after correction for attenuation) cannot be distinct. However, since it is relatively easy to establish that two factors are less than perfectly correlated (as explained in greater detail subsequently), more stringent standards have been proposed.
A second category of comparison standards uses cutoffs that are smaller than a perfect correlation of 1. These comparison standards are arbitrary, based on subjective judgments rather than theoretical or logical arguments, which may encourage researchers to selectively choose standards based on the obtained outcome. Among others, the following comparison standards have been proposed: .70 (Haws, Sample, and Hulland 2023), .71 (MacKenzie, Podsakoff, and Podsakoff 2011), .85 (Henseler, Ringle, and Sarstedt 2015; Voorhees et al. 2016), and .95 (Bagozzi and Yi 1988). Based on a review of comparison standards used in practice, Rönkkö and Cho (2022) propose the following classification: A correlation below .80 indicates no problem with discriminant validity, .80–.90 is a marginal issue, above .90 but below 1 is a moderate problem, and a correlation not statistically different from 1 constitutes a severe problem. Henseler, Ringle, and Sarstedt (2015, p. 129) conclude that the choice of a comparison standard depends on “how conservative the researcher is in his or her assessment of discriminant validity.” Bagozzi and Yi (1988, p. 77) point out that “what constitutes ‘too high’ a correlation is a somewhat arbitrary issue.” It is apparent that consensus on what constitutes a defensible comparison standard that is smaller than 1 remains elusive.
Some prior work has relied on simulations to recommend comparison standards smaller than a perfect correlation (Franke and Sarstedt 2019; Voorhees et al. 2016). However, since the true population correlation for discriminant validity is unknown (Rönkkö and Cho 2022, p. 34), such simulations use arbitrary standards as inputs to judge the outputs. To illustrate, Voorhees et al. (2016, p. 130, Table 4) conducted a simulation study assuming that a population correlation of .75 between factors was discriminant valid whereas a correlation of .90 was not. Based on a comparison standard of .85 and a sample size of n = 500, all 200 replications in the simulation flagged discriminant validity issues at the larger correlation of .90, and only 1 replication flagged issues at the smaller correlation of .75. This led to the recommendation that .85 should be used as a comparison standard. However, the assumptions about problematic and unproblematic population correlations predetermined the conclusions derived from the simulation. For example, if a correlation of .70 had been deemed problematic (following Haws, Sample, and Hulland 2023), a population correlation of .75 would have violated discriminant validity in many replications, and if .95 had been used as the cutoff (Bagozzi and Yi 1988), a population correlation of .90 would have confirmed discriminant validity in at least some of the replications. In sum, fixed comparison standards less than 1 are problematic, and simulation evidence based on judgmental input is futile for choosing a comparison standard.
Third, comparison standards can be based on the reliability of multi-item measures. A reliability-based comparison standard is based on the notion that a construct should have more in common with its own multi-item measure than with another, conceptually related but supposedly distinct construct. Classical test theory specifies that the reliability of a multi-item measure is the shared variance between a construct and its measures (Lord and Novick 1968), and the shared variance between two constructs is equal to the squared factor correlation. Thus, using a reliability-based comparison standard requires that the squared factor correlation be smaller than the reliabilities of the multi-item measures of the two constructs. Equivalently, the factor correlation should be smaller than the square roots of the reliabilities of the two multi-item measures. Besides being intuitive, an advantage of a reliability-based comparison standard is that it is estimated from the data and not determined subjectively. A reliability-based comparison standard is also more stringent than a comparison standard of perfect correlation, except for boundary cases of perfect scale reliability. Fornell and Larcker (1981) can be credited with first proposing a reliability-based comparison standard, but unfortunately their measure of reliability is inappropriate for discriminant validation, as shown subsequently.
Requirement 3: Provide a Continuous Measure of Support for Discriminant Validity and Account for Sampling Error
We propose the discriminant validity index (DVI) as a simple and continuous measure of the extent of support for discriminant validity. It is defined as the comparison standard minus the (assumed to be positive) factor correlation φ:

The DVI is theoretically bounded between −1 and +1. More positive values provide greater evidence in support of discriminant validity. Negative values point to a violation of discriminant validity because the factor correlation exceeds the standard. Numerical or statistical comparisons can be used to assess whether the DVI is sufficiently positive.
The DVI in Equation 2 holds at the population level. At the sample level, the estimated support for discriminant validity may differ from the population value due to sampling error e: DVIsample = DVIpopulation + e. Even when the DVI is 0 in the population, sample values provide directional support for discriminant validity in about 50% of cases (assuming a symmetric distribution of the errors). Researchers commonly use the algebraic difference between the comparison standard and φ to evaluate discriminant validity (Campbell and Fiske 1959; Fornell and Larcker 1981), but this ignores sampling error. When sampling error is ignored, a .84 factor correlation would be judged to be smaller than a comparison standard of .85, even though there is little support for discriminant validity in this case.
Statistical comparisons account for sampling error and are therefore recommended (Franke and Sarstedt 2019; Pieters 2017; Rönkkö and Cho 2022). They provide a P-value 1 of the extent of incompatibility of the data with the model as well as a confidence interval (CI) to indicate the uncertainty associated with the point estimate of the DVI. Statistical tests can be conducted using a Wald test (i.e., an estimate of the DVI divided by an estimate of its standard error based on the multivariate delta method) or a likelihood ratio (chi-square difference) test (Bollen 1989; Cheung and Pesigan 2023; Jöreskog 1971), and corresponding CIs are available for both tests. If the sample size is small and/or the normality assumption is questionable, resampling approaches such as the bootstrap method yield more accurate CIs (Efron and Tibshirani 1994).
Because discriminant validity is a matter of degree, researchers can quantify the evidence supporting the discriminant validity of constructs by reporting DVIs, CIs, and precise P-values, and interpreting these statistics continuously. To enable continuous and robust inference, we report DVIs with 95% CIs based on percentile bootstrapping with 10,000 resamples. The R code on OSF allows alternative confidence levels to be set. We also report exact (for .001 and larger) one-sided P-values of statistical tests of DVI = 0 based on the proportion of bootstrap resamples with a negative DVI (or the proportion of positive DVIs if the estimate is negative). Results based on Wald or likelihood ratio tests are an option in the R code on OSF.
In sum, from the discussion of the three requirements it follows that an appropriate discriminant validation criterion should use a factor correlation derived from a well-fitting CFA model, compare the factor correlation with a principled maximum (a perfect correlation or an appropriate measure of scale reliability), and provide a continuous measure of support for discriminant validity that accounts for sampling error.
Evaluating Current Discriminant Validation Criteria
This section examines the extent to which current discriminant validation criteria satisfy or violate the three requirements. Panel A in Table 1 summarizes the findings. The example in Figure 1 is used to demonstrate each criterion. We also report the results of a literature review of 79 scale development articles published in the 2000–2024 volumes of the Journal of Consumer Psychology, Journal of Consumer Research, Journal of Marketing, and Journal of Marketing Research to illustrate current discriminant validation and reporting practices (Web Appendix A has details).
Analysis of Discriminant Validation Criteria.
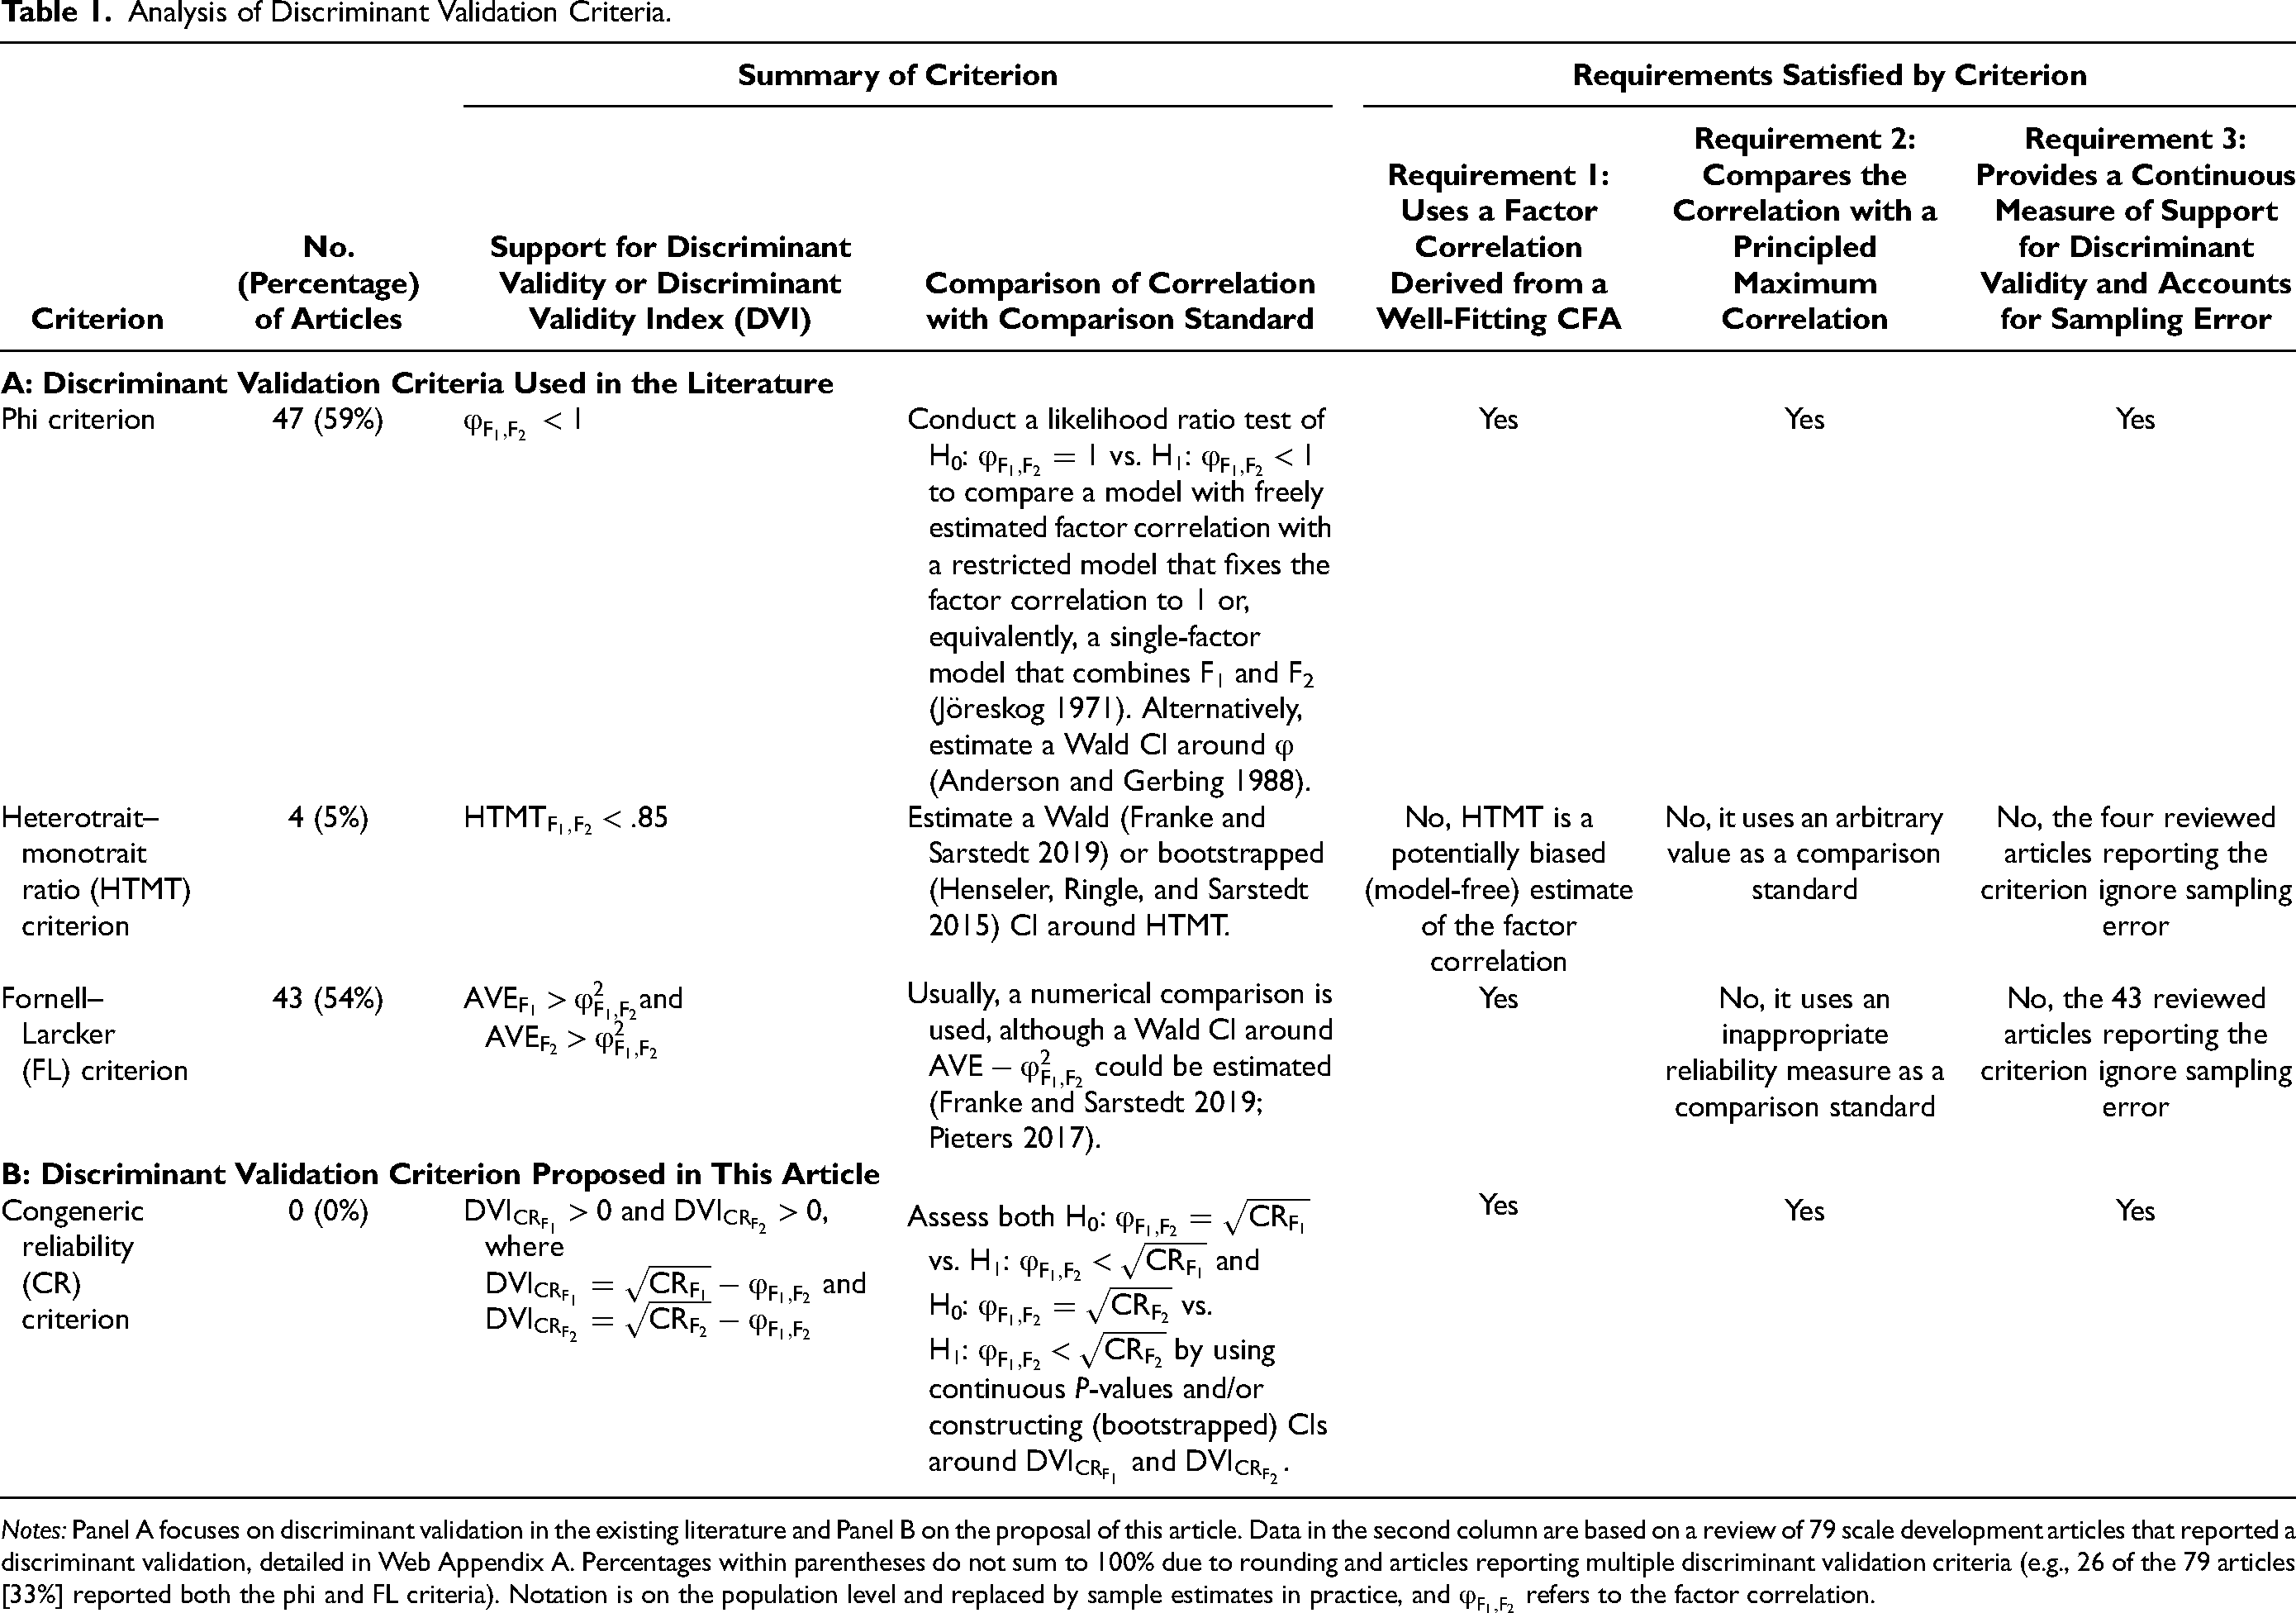
Notes: Panel A focuses on discriminant validation in the existing literature and Panel B on the proposal of this article. Data in the second column are based on a review of 79 scale development articles that reported a discriminant validation, detailed in Web Appendix A. Percentages within parentheses do not sum to 100% due to rounding and articles reporting multiple discriminant validation criteria (e.g., 26 of the 79 articles [33%] reported both the phi and FL criteria). Notation is on the population level and replaced by sample estimates in practice, and
Phi Criterion
The phi criterion is dominant in marketing and management (Franke and Sarstedt 2019; Voorhees et al. 2016). It was used in 39% of the studies in an earlier review of 621 survey-based articles in seven major marketing journals between 1996 and 2012 (Voorhees et al. 2016) and in 47 (59%) of the 79 articles in our review. The correctly implemented phi criterion meets all three requirements (Table 1): (1) the factor correlation based on a well-fitting CFA model accounts for measurement error; (2) the factor correlation is compared with an appropriate (perfect correlation) standard (DVI1 = 1 − φ, with the subscript 1 referring to a perfect correlation of 1); and (3) the comparison accounts for sampling error because a Wald CI is constructed around DVI1 (Anderson and Gerbing 1988) or a likelihood ratio test is used to compare the fit of a model with a freely estimated factor correlation to the fit of a restricted model that combines the two factors into a single factor or, equivalently, fixes the factor correlation to 1 (Jöreskog 1971). The more the upper limit of the CI deviates from 1 or the greater the misfit of the restricted model relative to the unrestricted model, the greater the support for discriminant validity. The name “phi criterion” is ingrained in the discipline (Voorhees et al. 2016), and we retain it for legacy reasons even though most criteria compare the factor correlation phi with some standard.
To illustrate, consider the example in Figure 1 at a large sample size of n = 1,000, about double the mean sample size in the literature review (M = 504, median = 201, SD = 1,297, range = 34–12,263). The 95% CI around DVI1 = 1 − .80 = .20 is [.160, .240] (p < .001). The lower limit of the interval is substantially larger than zero, and the p-value is very small, so there is convincing support for the phi criterion. Setting the sample size to a moderate n = 500 yields a similar result: the 95% CI is [.143, .260] and p < .001. Even at a modest sample of n = 100, the lower limit of the 95% CI of DVI [.059, .355] exceeds zero (p = .002).
A drawback of the phi criterion is its leniency because it can be met even when the correlation is very large. Based on follow-up simulations, the factor correlation would have to be larger than about .92 (DVI1 = .08 with 95% CI = [−.007, .189]), .96 (DVI1 = .04 with 95% CI = [−.004, .086]), or .98 (DVI1 = .02 with 95% CI = [−.006, .046]) for the 95% CI of the DVI to overlap zero at sample sizes of n = 100, 500, and 1,000, respectively. Web Appendix B demonstrates the leniency of the phi criterion more systematically.
Heterotrait–Monotrait Criterion
The heterotrait–monotrait ratio (HTMT) was used in four studies (5%) in the literature review. The HTMT estimates the factor correlation from the ratio of the arithmetic mean interitem correlation between pairs of indicators of two multi-item scales in the numerator and the geometric mean of the arithmetic mean interitem correlation within each of the scales in the denominator (Henseler, Ringle, and Sarstedt 2015). The original HTMT assumes parallel items, which overestimates the factor correlation and thus underestimates the support for discriminant validity when this assumption is violated (Rönkkö and Cho 2022). An updated HTMT relaxes the parallel item assumption (Ringle et al. 2023):
The updated HTMT criterion still has four problems (Table 1). First, the model-free approach is unnecessary because it estimates the factor correlation indirectly, whereas a CFA automatically provides an estimated factor correlation. Second, the HTMT is a potentially biased estimate of the true correlation because it makes assumptions in line with the congeneric factor model and the model-free approach does not allow researchers to verify these assumptions or make adjustments, if necessary. This violates the first requirement. As a case in point, the updated HTMT is .800 for the example in Figure 1, identical to the factor correlation estimated with CFA. The two correlations are identical because the assumptions required for using the HTMT approach happen to be satisfied. However, there is no way to assess whether systematic measurement error is present or whether remedial action to improve the fit of the model is necessary. Web Appendix C demonstrates that factor correlations estimated via the HTMT approach can be substantially biased in the presence of systematic error, whereas a CFA would point to the need for respecifying the factor model to obtain trustworthy correlation estimates. Third, the HTMT criterion usually violates the second requirement. The literature recommends a perfect correlation of 1 or arbitrary standards of .85 or .90 (Franke and Sarstedt 2019; Henseler, Ringle, and Sarstedt 2015; Voorhees et al. 2016). All four articles in the review that reported the HTMT criterion use a .85 comparison standard. Fourth, it is recommended that a Wald test or bootstrapping be used for statistical inference when implementing the HTMT criterion (Franke and Sarstedt 2019; Henseler, Ringle, and Sarstedt 2015). However, all four articles in the review that reported the HTMT criterion use a numerical comparison without a statistical comparison, violating the third requirement.
The HTMT criterion was initially proposed for variance-based structural equation modeling (SEM), such as partial least squares (Henseler, Ringle, and Sarstedt 2015). Henseler, Ringle, and Sarstedt (2015) find based on simulations that the Fornell and Larcker (1981) criterion, discussed subsequently, performed very poorly in that context, and they propose the HTMT criterion as an alternative. However, some researchers have misapplied the HTMT criterion to covariance-based SEM under the mistaken belief that it is a new and improved approach for assessing the discriminant validity of constructs in general. It should be clear that, based on the foregoing discussion, there is little reason to recommend the HTMT criterion in the context of the more common covariance-based SEM.
Fornell–Larcker Criterion
The Fornell–Larcker (FL) criterion (Fornell and Larcker 1981) is generally viewed as an essential part of an assessment of discriminant validity (Albert and Thomson 2023; Farrell 2010; Pieters 2017; Voorhees et al. 2016), and it is commonly reported in the literature. Forty-nine percent of 621 survey-based articles in seven major marketing journals between 1996 and 2012 used the FL criterion (Voorhees et al. 2016), and 43 of the 79 articles (54%) in the current review did. However, the FL criterion is inappropriate for discriminant validation and should no longer be used for this purpose, as explained next and summarized in Table 1.
The FL criterion specifies that the average variance extracted (AVE) by a construct from the items in a scale should be larger than the variance that the construct shares with other constructs. It relies on CFA to estimate the squared factor correlation as an estimate of the shared variance between factors, thus meeting the first requirement. However, it numerically compares AVE with the squared factor correlation (AVE > shared variance), thus failing the third requirement. Although it is straightforward to implement a statistical test to account for sampling error (Franke and Sarstedt 2019; Pieters 2017), none of the articles in the literature review report a statistical test. The FL criterion also fails the second requirement, which is more problematic. Because the FL criterion occupies a central position in discriminant validation, we elaborate on this deficiency of the FL criterion in more detail.
First, AVE does not capture scale reliability but the reliability of a hypothetical “average” item, which is uninformative for discriminant validation. Specifically, the AVE for factor F1 with J items, each with loading λj1 and error variance θjj, is:
This expression can be rewritten as follows: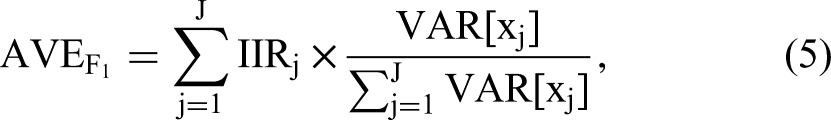
Second, to demonstrate that AVE is not a measure of scale reliability and an inappropriate comparison standard for discriminant validation, consider again the example in Figure 1. The AVEs of F1 and F2 are .589 and .490, respectively, and the observed correlation between the multi-item scale scores is .618. Substituting these values into Equation 1 yields a corrected correlation of 1.150, which is much larger than the true factor correlation of .800; in fact, it is an improper correlation estimate because it is larger than 1.
Third, the AVE of a multi-item measure is always lower than a measure of scale reliability, except for boundary cases where all loadings are 1 or 0. Web Appendix D provides additional detail. Therefore, the FL criterion systematically underestimates the extent of discriminant validity. As a consequence, discriminant validity may appear to be violated when this is not the case. To illustrate, the FL criterion in Figure 1 is violated even though the factor correlation of .800 does not seem overly large: The squared factor correlation of .640 numerically exceeds both the AVE of F1, which is .589, and the AVE of F2, which is .490.
In sum, the FL criterion is an inappropriate discriminant validation criterion because it violates the second and third requirements. The FL criterion uses the average item reliability instead of the total scale reliability and therefore underestimates the support for discriminant validity. Using a statistical test would further exacerbate the issue because it makes an already overly strict criterion even more difficult to meet. The next section proposes to replace the FL comparison standard by a more appropriate metric based on the reliability of the entire multi-item scale.
The CR Criterion: An Improved Reliability-Based Discriminant Validation Criterion
CR (congeneric reliability, also known as composite reliability) is a common estimate of scale reliability in the context of CFA (Bollen 1989; Cho 2021; Fornell and Larcker 1981; Jöreskog 1971; Werts, Linn, and Jöreskog 1974). Cho (2021) compares 18 scale reliability coefficients and concludes that CR maps best onto the classical test theory definition (Lord and Novick 1968), has the least restrictive assumptions compared with alternatives such as Cronbach's coefficient alpha, and performs well across datasets. To our knowledge, it has not been used as a comparison standard in discriminant validation.
Equation 6 specifies CR for a construct F1 measured with J items (Fornell and Larcker 1981; Jöreskog 1971; Werts, Linn, and Jöreskog 1974):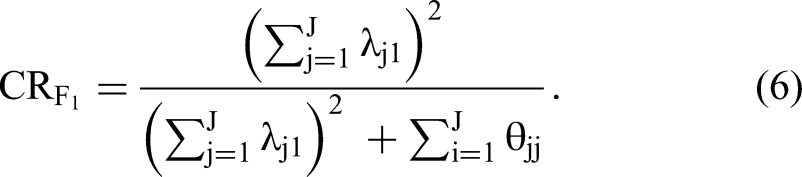
This expression looks superficially similar to AVE in Equation 4, but it differs because the numerator and denominator in Equation 6 both contain the square of the summed loadings rather than the sum of the squared loadings as in Equation 4. This makes a crucial difference. CR is the proportion of the total true score variance captured by the multi-item scale as a whole, rather than the average true variance captured by the individual items. Thus, CR correctly reconstructs the factor correlation when an observed correlation is disattenuated. In contrast to AVE, CR also increases with increasing scale length, as it should, because scales with more items generally are more reliable. Web Appendix D provides additional details.
CR assumes a congeneric measurement model and therefore makes less restrictive assumptions than Cronbach's coefficient alpha, which assumes at least tau-equivalent items. In the example of Figure 1, the loadings of the items measuring F1 differ, resulting in a CR of .804, which is larger than the coefficient alpha of .785 (which is a lower bound on reliability in the present case). The item loadings for F2 (as well as the error variances, since the items are standardized) are the same, and therefore the coefficient alpha of .742 is identical to CR.
The square root of CR is the correlation of the true score of the construct with the observed multi-item scale score. We propose to use it as comparison standard as follows:
The subscript CR of the DVI indicates that the factor correlation is compared with (the square root of) CR. The CR criterion is stricter than the phi criterion and more lenient than the FL criterion, except for corner cases with perfect reliability. The bootstrap method can be used to construct a CI and P-value around the DVI. Web Appendix E shows that bootstrap intervals outperform Wald- and likelihood-based CIs, particularly when the items are nonnormally distributed.
Applying the CR criterion to the example in Figure 1,
In sum, the CR criterion meets all three requirements for an appropriate discriminant validation criterion (see Panel B of Table 1). It uses the factor correlation obtained from a well-fitting CFA as the correlation metric to account for measurement error. It compares the factor correlation with the square root of CR, which captures the reliability of the multi-item scale and relies on less restrictive assumptions compared with alternatives such as Cronbach's coefficient alpha. The DVI based on CR quantifies the support for discriminant validity, with a precise P-value indicating the extent of incompatibility of the data with the model, and a CI around the DVI quantifying its estimated uncertainty. Next, we integrate the CR criterion into our proposed discriminant validation procedure.
A Proposed Discriminant Validation Procedure
Figure 2 summarizes our proposed discriminant validation procedure based on two appropriate criteria that are ordered from easier to more difficult to meet. The phi criterion is a minimum criterion because it uses a perfect correlation as a comparison standard. When it is met, the more stringent CR criterion is tested next and can be met for none, one, or both of the focal constructs. Together, the two steps provide a four-tiered classification to facilitate decision-making and drawing conclusions. The two steps in the procedure and the four possible conclusions are described next. Annotated R code on OSF (https://osf.io/57srv/) implements the procedure when raw data are available. A Shiny app (https://constantpieters.shinyapps.io/discriminantvalidation/) implements the procedure when only summary statistics are available, which requires more restrictive assumptions (Web Appendix F has details).
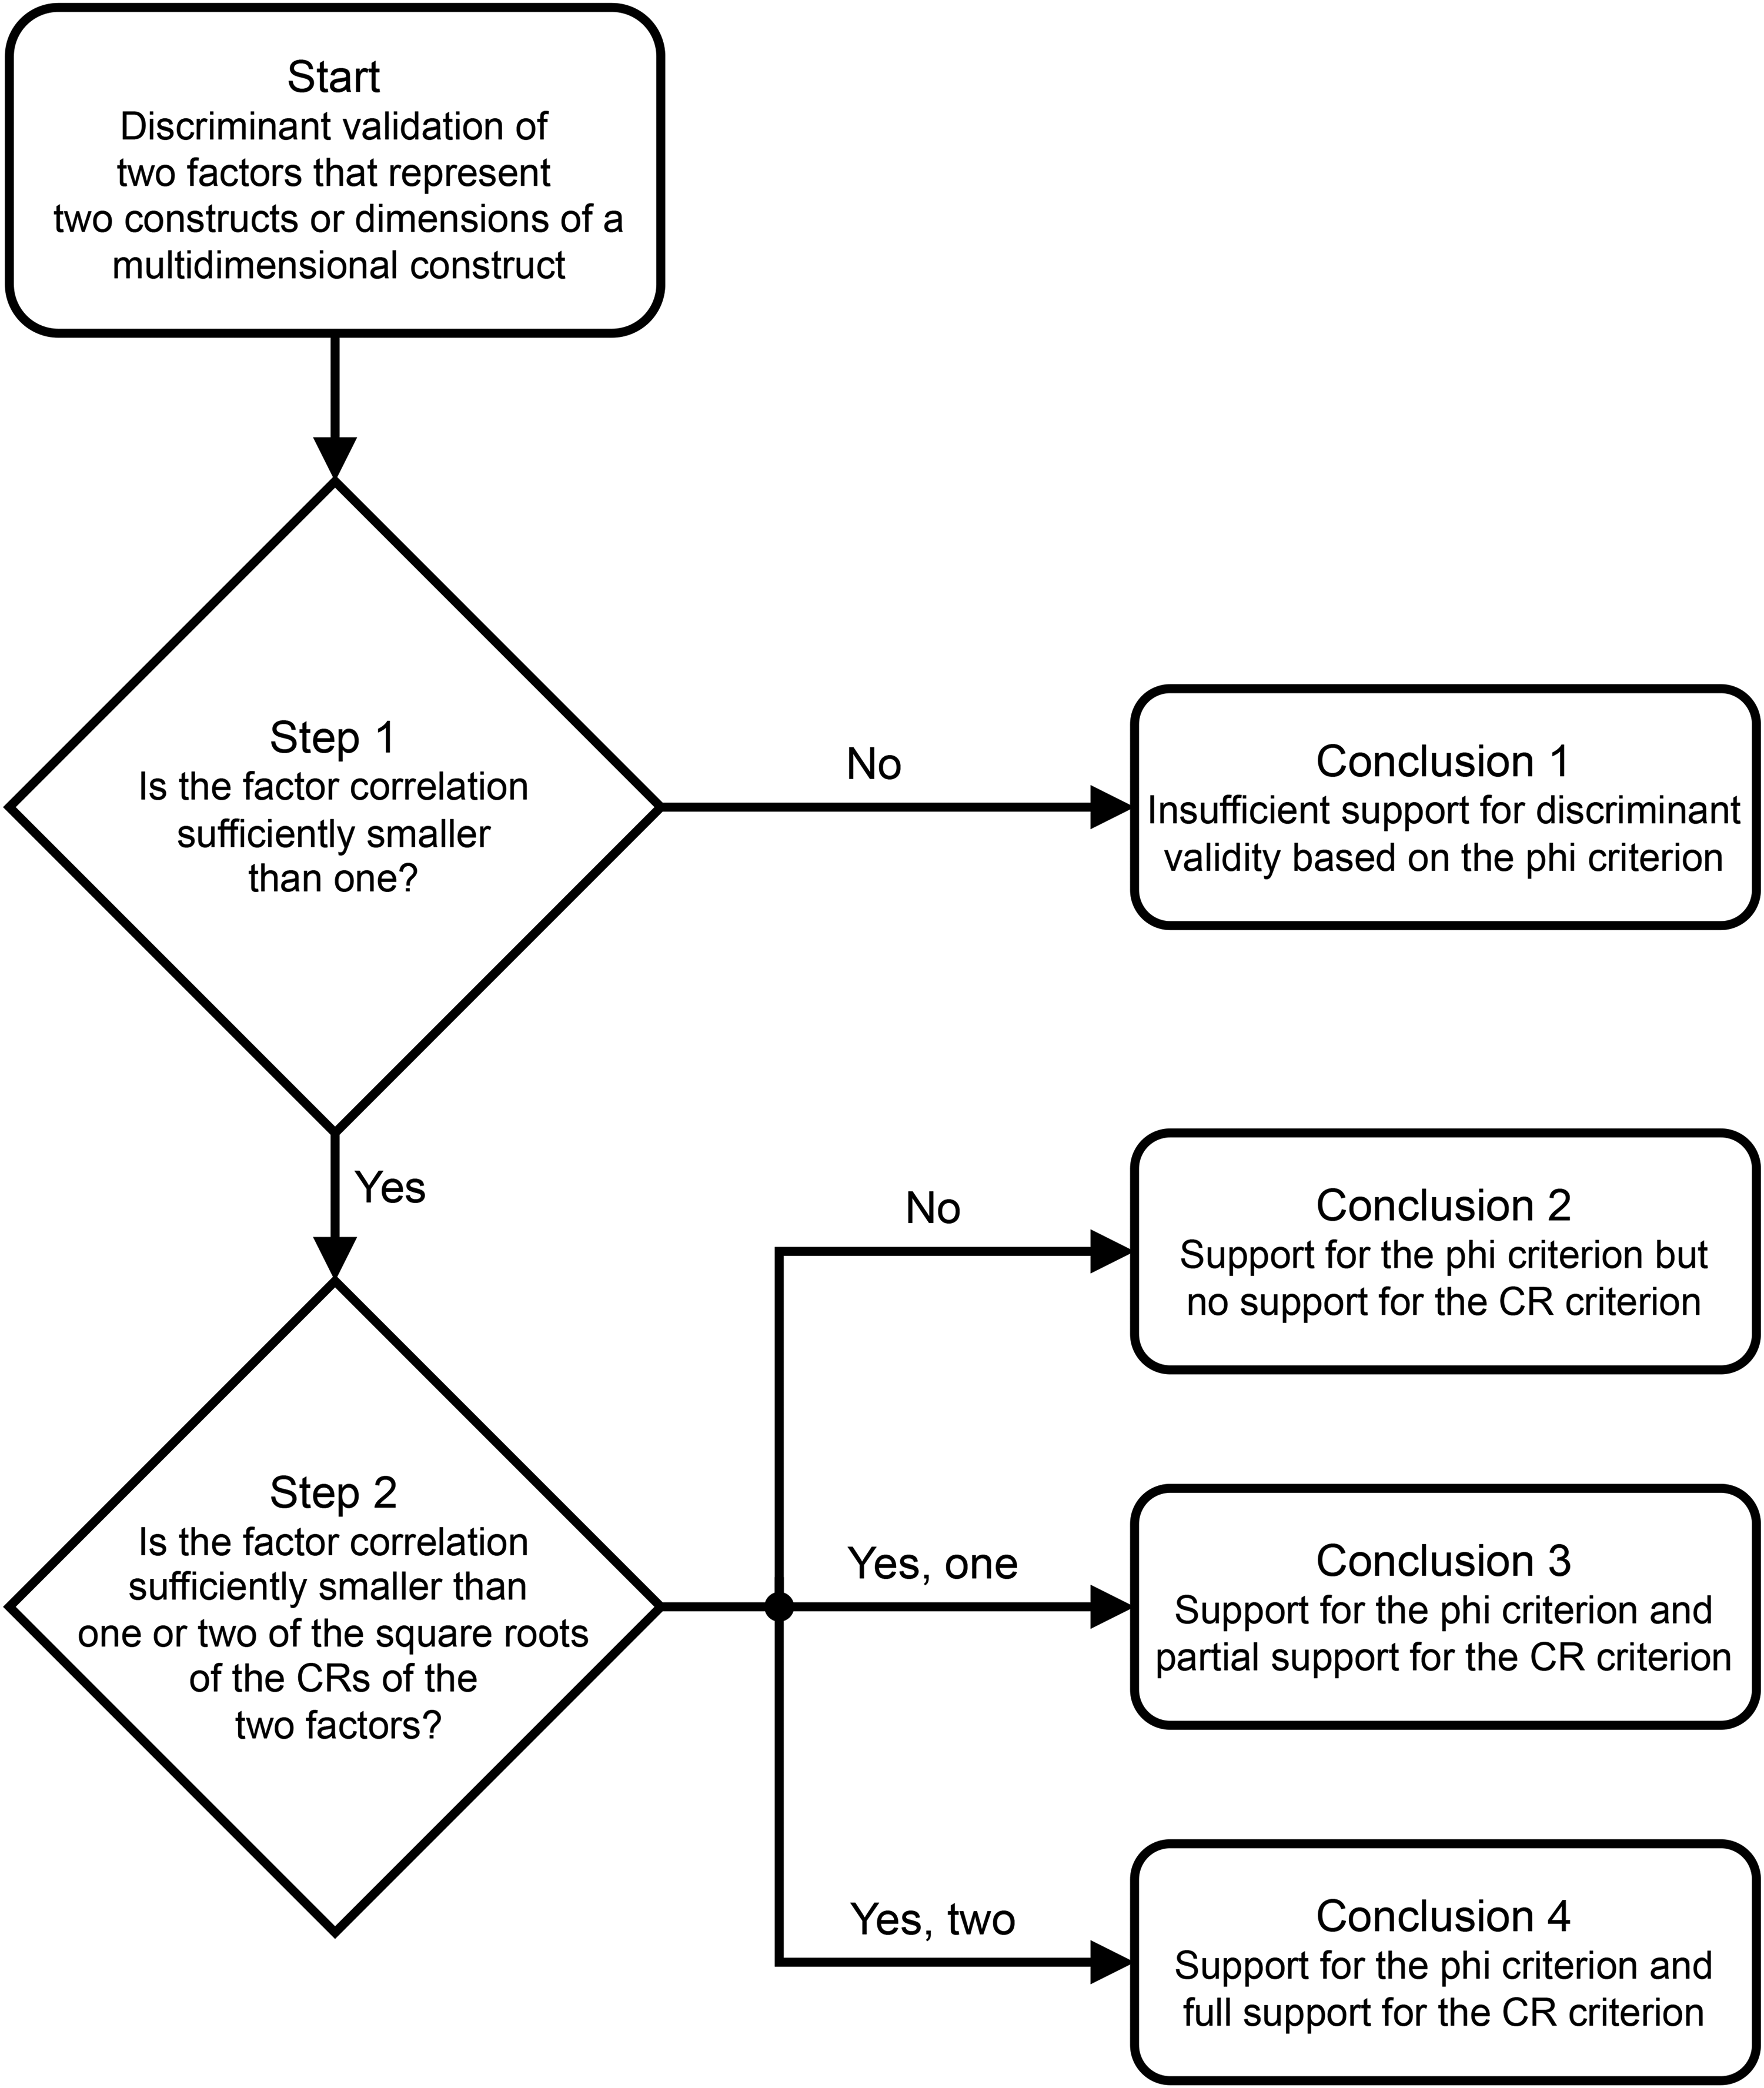
Proposed Discriminant Validation Procedure.
Step 1 uses CFA to estimate the factor correlation and assess the extent to which it is smaller than 1. Only factor correlations from well-fitting models should be considered, as discussed previously. A (1 − α) bootstrapped CI provides the estimated uncertainty associated with the point estimate of DVI1 = 1 − φ, and a test of the null hypothesis that DVI1 = 0 versus the alternative hypothesis DVI1 > 0 yields a P-value. If the phi criterion is supported (i.e., DVI1 is sufficiently larger than zero), move to Step 2; else end the procedure. In the latter case, there is insufficient support for discriminant validity of the two constructs because even the minimum phi criterion is not met (Conclusion 1 in Figure 2).
Step 2 compares the factor correlation with the square roots of the CRs of the two constructs. Again, P-values are available, and a (1 − α) bootstrapped CI around
Based on Step 2, a construct pair only meets the phi criterion if neither of the two factors meet the CR criterion (Conclusion 2). A construct pair partially meets the CR criterion if there is sufficient support for only one factor (Conclusion 3), which can occur when the scale reliabilities differ. A construct pair fully meets the CR criterion if both DVIs are sufficiently positive while accounting for sampling error (Conclusion 4). These conclusions are drawn based on continuous statistical results (McShane et al. 2024). In both steps, those are the DVIs, their CIs, and the P-values of tests of the DVIs against zero. Since discriminant validity is a precondition for meaningful theory testing (Pieters 2017), the four conclusions in the proposed procedure aid reporting and decision-making, a point to which we return in the “General Discussion” section.
When the proposed procedure is applied to the example in Figure 1 at a modest sample size of n = 100, only the phi criterion is met (Conclusion 2) based on DVI1 = .20 with a 95% CI of [.059, .355] and p = .002, but the CR criterion is not met for either F1 (
The proposed procedure provides a systematic approach to assessing the extent to which two constructs are empirically distinct. It provides continuous measures of discriminant validity and a decision-theoretic procedure with four conclusions that go beyond drawing binary conclusions based on a single criterion. The next section presents empirical applications of the procedure. It shows that the procedure can result in conclusions that differ from the conclusions obtained via currently used criteria.
Empirical Applications
We first present a case study to illustrate the proposed procedure with actual rather than synthetic data and to empirically compare it with other criteria. Then, we reanalyze 7 of the 79 articles in the literature review, each of which reported at least one discriminant validity issue based on the phi or FL criterion.
Case Study
Wilson and Bellezza (2022) conceptualize the construct of consumer minimalism with a minimalist consumer scale that has three conceptually distinct facets, each measured with four items: number of possessions (NoP; e.g., “I restrict the number of things I own”), sparse aesthetic (SA; e.g., “I prefer simplicity in design”), and mindfully curated consumption (e.g., “I am mindful of what I own”). In their Study 3, n = 394 valid Prolific panelists completed the minimalist consumer scale, and CFAs supported its dimensionality and reliability. Our reanalysis based on raw data focuses on NoP and SA, which had the largest factor correlation. Wilson and Bellezza (2022) conclude discriminant validity of the minimalist consumer scale, and our reanalysis strengthens this conclusion.
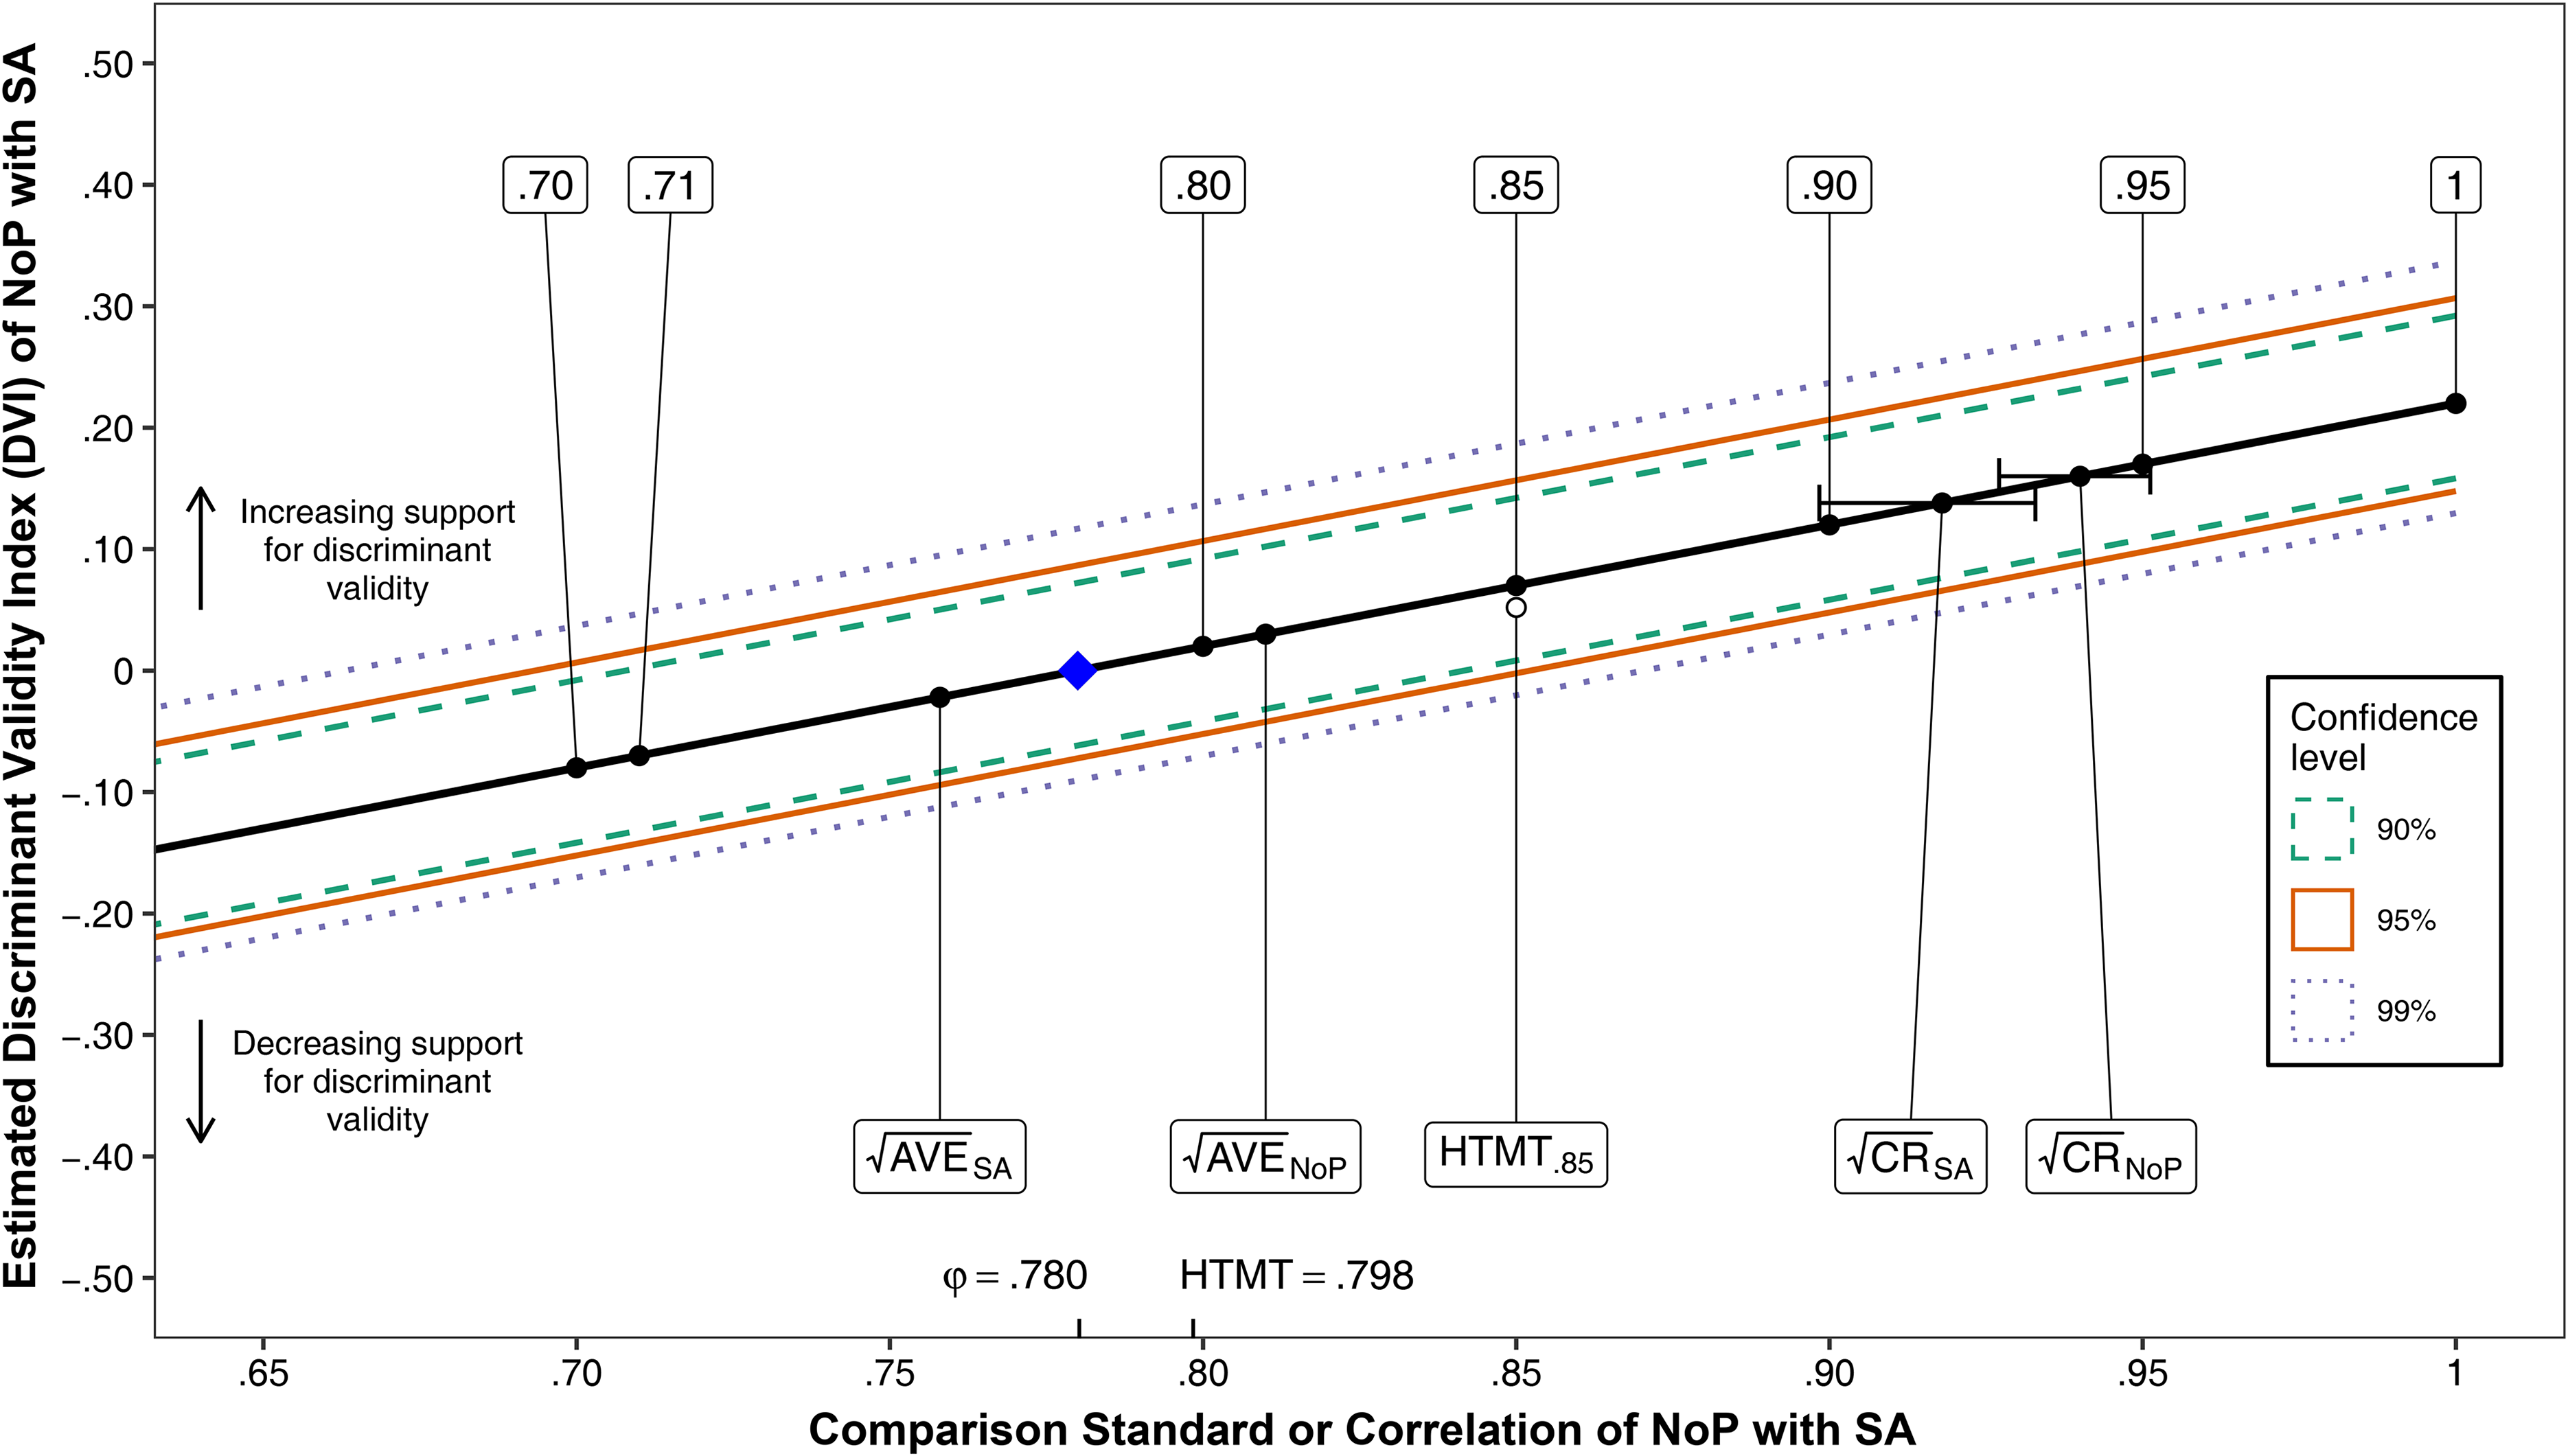
Figure 3 plots the estimated DVI of NoP with SA (based on the estimated factor correlation) on the vertical axis against a continuous range of comparison standards from .65 to 1 on the horizontal axis, which furthermore denotes the estimated factor correlation of .780 (the HTMT is .789). The diamond also points out that factor correlation, at which DVI = 0. The DVI slopes upward: The higher the comparison standard, the more the DVI exceeds 0, and the greater the support for discriminant validity. DVIs below 0 indicate violations of discriminant validity. Also visualized are the 90%, 95%, and 99% bootstrapped CIs around the DVI. The goal of Figure 3 is to compare several discriminant validation criteria, and we discuss them one by one. Web Appendix G tabulates the detailed results.
Case Study of Wilson and Bellezza (2022, Study 3): Support for Discriminant Validity Depends on the Comparison Standard.
First, the phi criterion uses a comparison standard of unity and has the maximum support for discriminant validity: DVI1 = .220, with the lower limit of the CIs much greater than zero (e.g., 95% CI = [.148, .307], p < .001), visualized at the right side of Figure 3. This is intuitive because the estimated factor correlation is a moderate .780, and the phi criterion only flags issues with very large correlations that are close to 1.
Second, the estimated CR values are .884 for NoP and .842 for SA, and their square roots are much larger than the factor correlation (for instance,
Third, the result based on CR is in stark contrast to that for the FL criterion, which is met for NoP but not for SA: The estimated AVEs are .656 (
Fourth, the estimate of the HTMT is .798, very similar to the .780 factor correlation, as it should be. Using .85 as a comparison standard,
Fifth, Figure 3 includes various fixed comparison standards less than 1 that have been suggested in the literature. Conclusions about discriminant validity depend much on the particular judgmental standard chosen. For example, discriminant validity is supported for a comparison standard of .90 (DVI.90 = .120 with 95% CI = [.048, .207], p < .001), but not for a comparison standard of .80 (DVI.80 = .020 with 95% CI = [−.052, .107], p = .316). Without a clear theoretical foundation, drawing unambiguous conclusions based on judgmental standards is hard even if multiple standards are used. The factor correlation of .780 is substantially smaller than .90, but not much smaller than .80, which would yield a “marginal” discriminant validity problem according to Rönkkö and Cho (2022). In contrast, the CR criterion estimates the comparison standard from the data based on a clear theoretical foundation. The CR and judgmental criteria only coincide if the judgmental standard happens to be equal to the square root of CR.
Reanalysis of Seven Articles Reporting Discriminant Validity Violations
Eight articles in the literature review report at least one discriminant validity violation. One article reports not meeting the phi criterion (Bloch, Brunel, and Arnold 2003). Seven articles report failures to meet the FL criterion (Drolet et al. 2021; Fischer, Völckner, and Sattler 2010; Garbinsky et al. 2020; Grohmann 2009; Homburg and Pflesser 2000; Morhart et al. 2015; Nenkov, Inman, and Hulland 2008). None of the four articles reporting the HTMT criterion identify discriminant validity issues.
Whereas the case analysis relied on raw data, this reanalysis uses sufficient summary data reported in the articles, assuming well-behaved data and adequately fitting measurement models. One article does not report sufficient data (Homburg and Pflesser 2000). Seven articles do; three report factor correlations and standardized loadings (Bloch, Brunel, and Arnold 2003; Morhart et al. 2015; Nenkov, Inman, and Hulland 2008), and four report factor correlations and AVEs or coefficient alpha. This enabled us to reconstruct the item correlations assuming parallel items. Although this assumption is restrictive, it was necessary given the available data. Our reanalysis replicated all reported violations of discriminant validity, which is reassuring and suggests that the parallel item assumption is reasonable. In total, we reanalyzed 13 construct pairs based on seven articles, using Monte Carlo resampling to estimate CIs (Preacher and Selig 2012). We report the results from the proposed procedure and focus on the comparison with the FL criterion because of its prominence in scale development research. We report a numerical comparison for the FL criterion, which is consistent with how the criterion is used in practice. Web Appendix G contains statistical results for the FL criterion as well as the results for the HTMT criterion and fixed comparison standards.
Table 2 summarizes the results. We refer to specific construct pairs by their row number and name of the first author in Table 2. Several findings stand out.
Reanalysis of Seven Articles Reporting Discriminant Validity Violations.
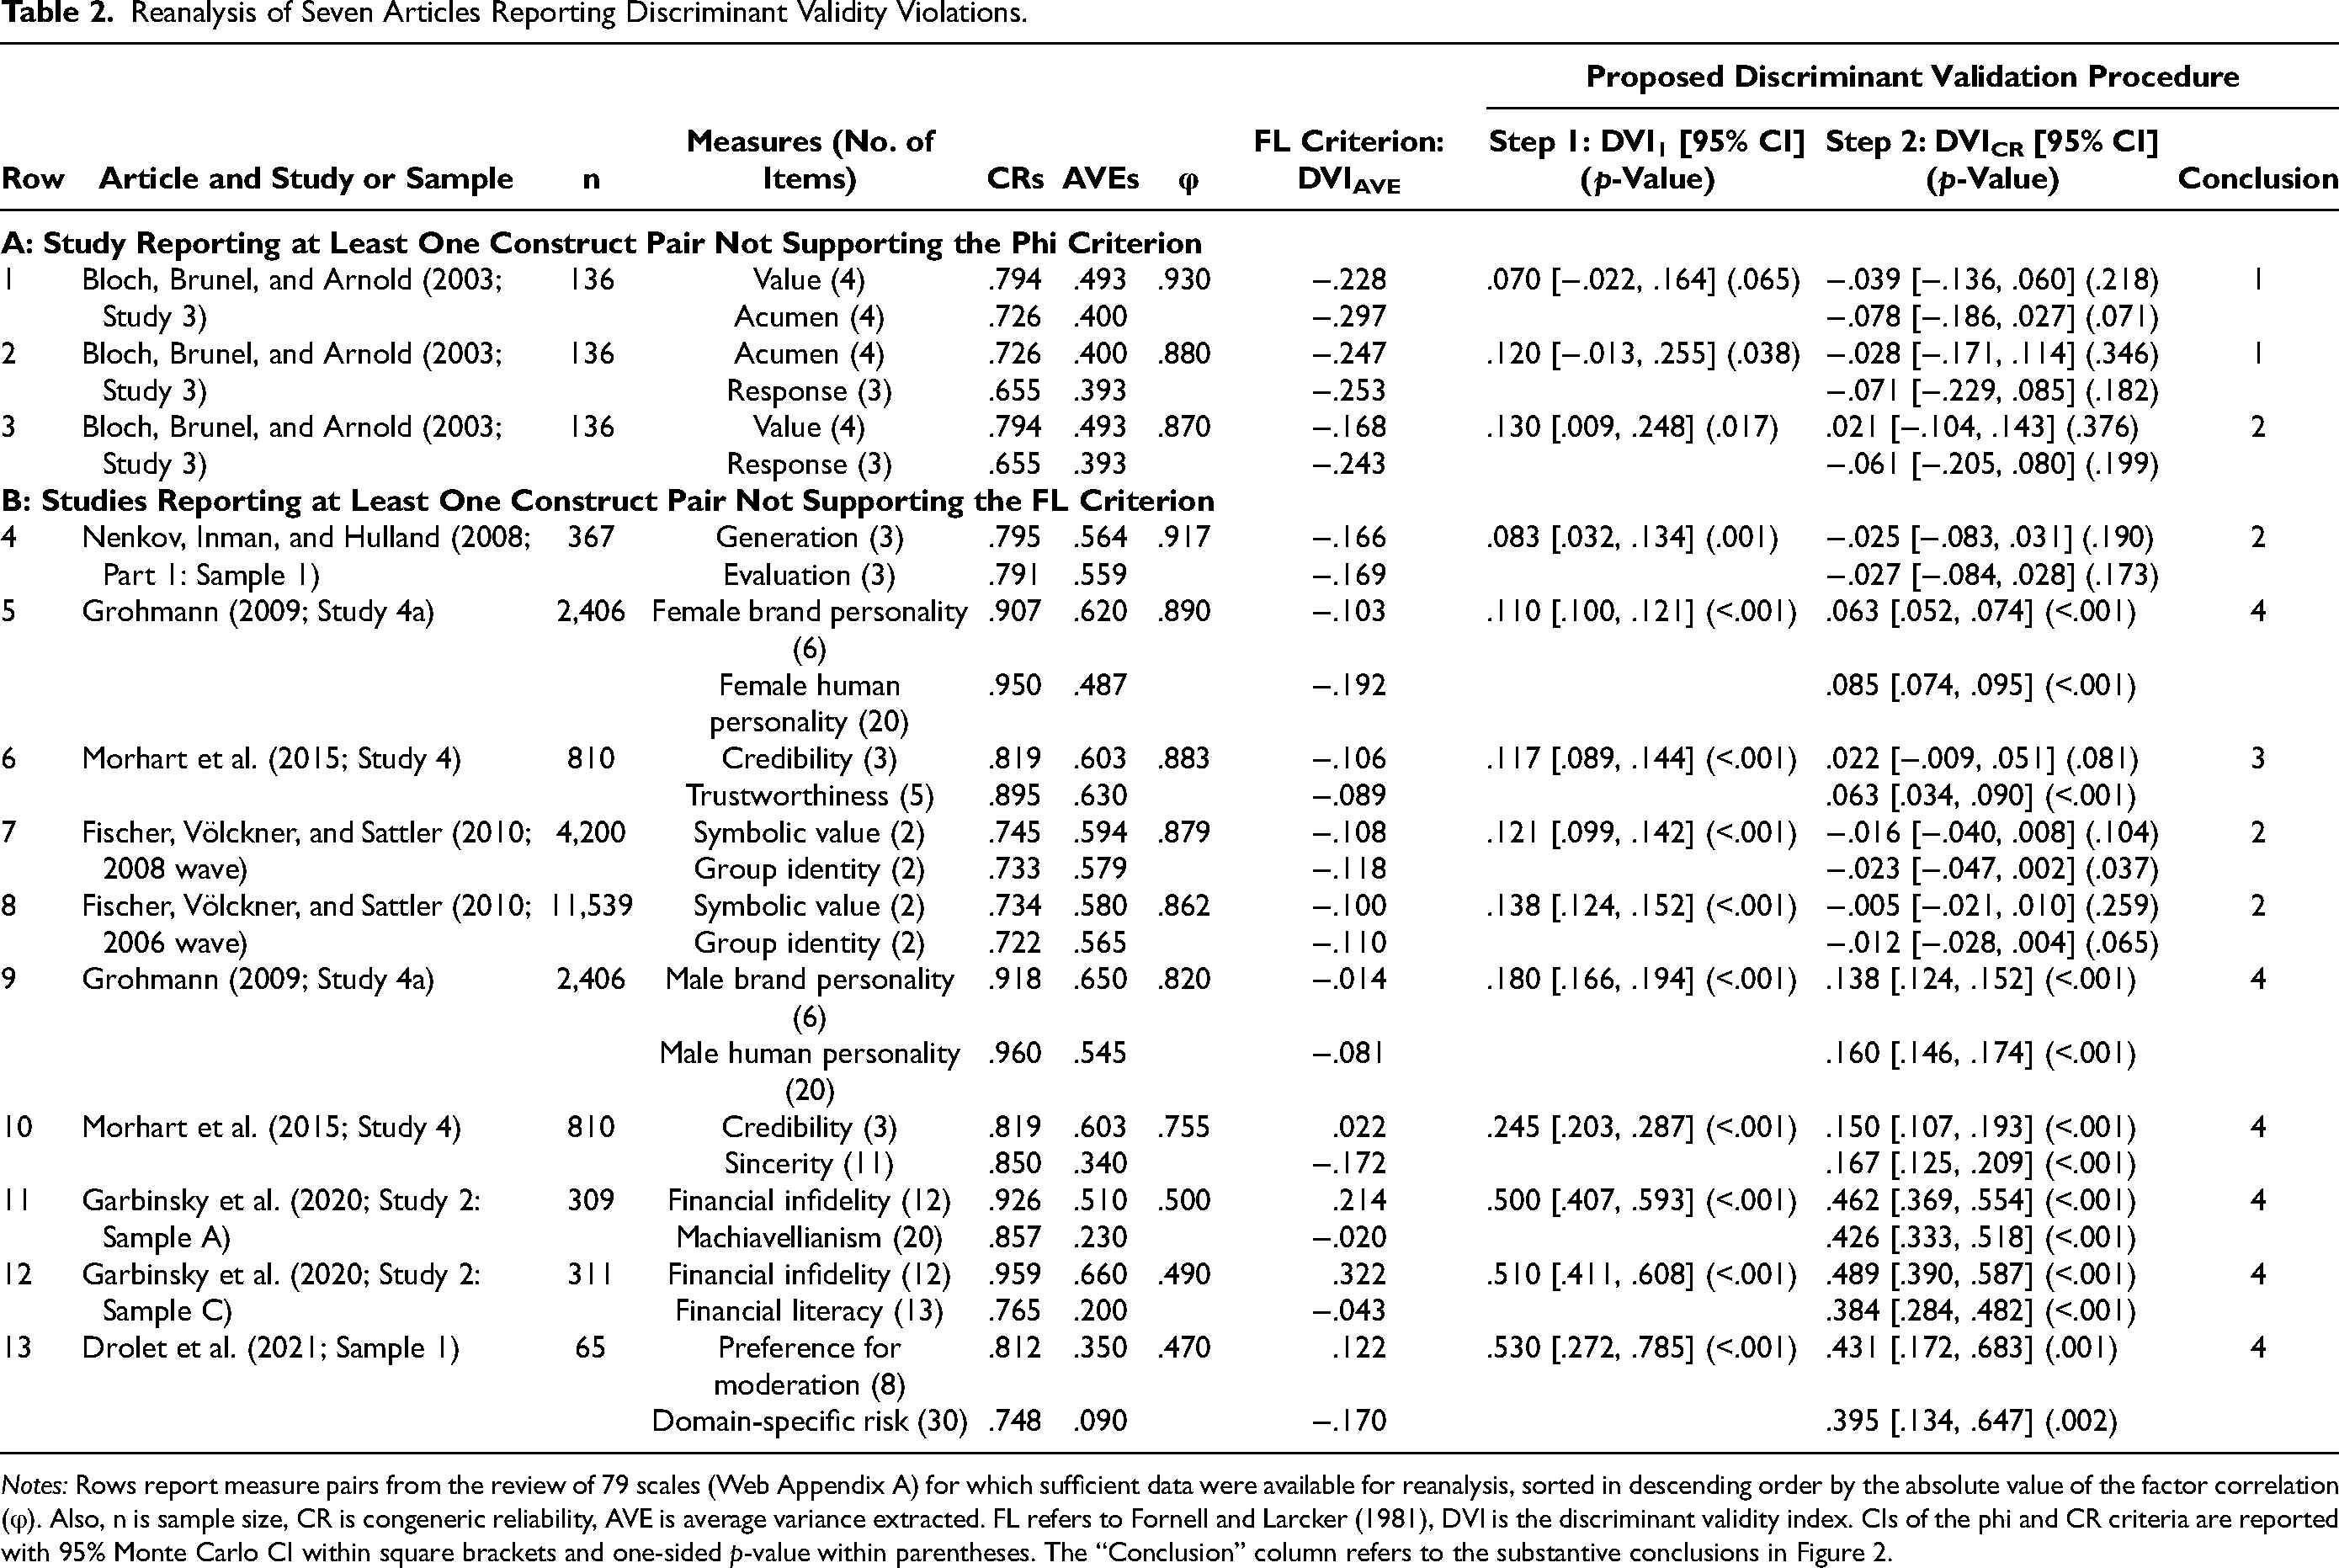
Notes: Rows report measure pairs from the review of 79 scales (Web Appendix A) for which sufficient data were available for reanalysis, sorted in descending order by the absolute value of the factor correlation (φ). Also, n is sample size, CR is congeneric reliability, AVE is average variance extracted. FL refers to Fornell and Larcker (1981), DVI is the discriminant validity index. CIs of the phi and CR criteria are reported with 95% Monte Carlo CI within square brackets and one-sided p-value within parentheses. The “Conclusion” column refers to the substantive conclusions in Figure 2.
First, at a sample size of n = 136, the construct pairs in Rows 1 and 2 (Bloch) failing the phi criterion had factor correlations of .930 (DVI1 = .070 with 95% CI = [−.022, .164], p = .065) and .880 (DVI1 = .120 with 95% CI = [−.013, .255], p = .038; note again that the p-value is one-sided), respectively. Although the phi criterion identified a violation of discriminant validity in these two cases, the reanalysis also demonstrates the relative leniency of the phi criterion: The second largest factor correlation, .917 at n = 367 in Row 4 (Nenkov), still supports the phi criterion: DVI1 = .083 with a 95% CI of [.032, .134] and p = .001.
Second, the FL criterion is not only inappropriate but also overly strict. It flags discriminant validity issues even at moderate factor correlations. In Row 13 (Drolet), for instance, a factor correlation of .470 at a sample size of n = 65 had AVEs of .350 and .090, respectively. Using a numerical comparison, the FL criterion was violated for the second construct with
Third, the FL and CR criteria are not only conceptually but also empirically different. That is, 16 out of the 20 cases in Panel B of Table 2 violated the FL criterion when using a numerical comparison (all except one comparison in Rows 10–13). However, the CR criterion was statistically supported in 9 out of 16 cases based on CIs not overlapping zero. For example, returning to Row 13 (Drolet), the CR criterion was supported:
Fourth, the rightmost column of Table 2 summarizes, for each construct pair, the conclusion from the discriminant validation procedure. Eleven of the 13 pairs meet the minimum phi criterion. Four pairs meet the phi criterion but not the stricter CR criterion. One pair partially meets the CR criterion, and six pairs fully meet the CR criterion. In sum, the proposed four-tiered procedure provides new and informative insights.
General Discussion
Conclusions
This research outlines three requirements that an appropriate discriminant validation criterion should satisfy. First, an appropriate criterion uses a factor correlation from a well-fitting CFA that accounts for measurement error. Second, the factor correlation is compared with a principled maximum such as a perfect correlation or the square root of scale reliability (i.e., CR). Third, the comparison method accounts for sampling error and provides a continuous measure of support for discriminant validity.
The analysis of current criteria showed that the phi criterion, which specifies that the factor correlation should be less than perfect, meets all requirements but is lenient. Moreover, the FL criterion fails the second and third requirements. We therefore recommend that the FL criterion not be used in future scale validation research, and we recommend replacing it with the CR criterion, which meets all three requirements.
We integrated the more lenient phi criterion and the more stringent CR criterion into a procedure that yields a four-tiered classification of discriminant validity. The procedure provides continuous measures of the degree of support for discriminant validity, as well as statistical results. Empirical applications demonstrated how the proposed procedure systematically assesses discriminant validity and can lead to conclusions that differ from those based on the FL criterion.
Implications
First, the CR criterion is easier to meet than the FL criterion that it replaces because multi-item scale reliability is generally higher than average item reliability (on average .328 across the reanalyses in Table 2). The CR criterion can therefore support the discriminant validity of more closely related constructs that would not pass muster with the FL criterion, which our empirical applications demonstrate. We speculate that valid scales of important constructs may not have reached the submission or publication stage because they failed to meet the inappropriate FL criterion. At the same time, the CR criterion flags discriminant validity issues between constructs that are too closely related but still meet the more lenient phi criterion. Having two constructs that meet the CR criterion strengthens their construct validity because it implies that each construct correlates more strongly with its own multi-item measure than with another, presumably distinct construct. This ensures meaningful theory testing (Pieters 2017) and prevents the proliferation of constructs that may be semantically but not empirically distinct (Albert and Thomson 2023; Morrow 1983; Shaffer, DeGeest, and Li 2016).
Second, our procedure meaningfully combines the phi and CR criteria to provide graded discriminant validity conclusions. It is common practice to report multiple discriminant criteria in scale development research; 60 out of the 79 reviewed articles (76%) did so, although there was little consistency in how different criteria were combined (Web Appendix A has details). Prior literature appears to have treated the various criteria as equivalent without clearly differentiating their relative stringency. In contrast, the proposed procedure systematically combines two increasingly stringent criteria and acknowledges that discriminant validity is a matter of degree, rather than a single all-or-nothing decision (Rönkkö and Cho 2022). Quantifying the extent of support for discriminant validity in terms of the DVI, together with a CI around the DVI and a precise P-value based on a test of DVI = 0, further supports continuous reporting and interpretation.
Third, our analysis focused on the discriminant validation of multi-item scales using CFA with a reflective measurement model; the phi and CR criteria are sufficient for this purpose, without a need for additional criteria. This is particularly the case for the FL criterion, which the CR criterion replaces. Our analysis showed that AVE should not be used as a comparison standard for discriminant validity, although it might still be reported as a useful summary measure of individual-item reliability or convergent validity. We see little reason for authors to report the HTMT criterion for reflective measurement models because it potentially violates the first requirement (at best it is an indirect way to estimate the factor correlation), and it uses an arbitrary comparison standard (usually .85), thus violating the second requirement. The HTMT criterion was initially developed for variance-based SEM (such as partial least squares), and it might be informative in that context (Henseler, Ringle, and Sarstedt 2015). However, it is unnecessary for reflective measurement models. Arbitrary fixed comparison standards such as .85 should also be avoided in general, although the systematic use of multiple standards alleviates the problem of selecting an appropriate single fixed standard to some extent (Rönkkö and Cho 2022).
Implementing the Proposed Procedure
To facilitate the implementation of the proposed procedure using raw data, researchers can use the R code described in Web Appendix F and available on OSF (https://osf.io/57srv/). For purposes of illustration, the code implements the case study reported previously and in Figure 3. An online Shiny app (https://constantpieters.shinyapps.io/discriminantvalidation/) enables discriminant validation with menus when only summary data are available, assuming standardized and parallel items. Using raw data for discriminant validation is preferable: It relaxes the assumption that all items are equally good measures of the underlying construct, which provides the most appropriate assessment of discriminant validity.
We recommend that researchers fully report and continuously interpret the following results of discriminant validation: factor correlations, CR estimates, estimated DVIs for the phi and CR criteria, the estimated uncertainty of each DVI captured by CIs, and P-values for the tests of each DVI against zero. Using our reanalysis of Study 3 in Wilson and Bellezza (2022) as an example, the results could be summarized as follows: We assessed discriminant validity with the phi and CR criteria. NoP (CR = .884) and SA (CR = .842) have a factor correlation of φ = .780, which meets the phi criterion (DVI1 = .220 with 95% bootstrapped CI based on 10,000 resamples [.148, .307], one-sided bootstrapped p < .001). Moreover, the factor correlation is substantially smaller than the square root of the CR for NoP (DVICR = .160 with 95% CI = [.088, .245], p < .001) and SA (DVICR = .138 with 95% CI = [.064, .223], p < .001). Thus, the phi and CR criteria both support the discriminant validity of NoP with SA in the present study.
It is more difficult to offer normative recommendations when the phi criterion is met but the CR criterion is not, for either one construct or both constructs. In these cases, either the reliability of one or both constructs is too low or the factor correlation is too large. If the scale reliabilities are comparatively low, efforts might be directed at improving measurement reliability before proceeding to the next stage of scale development. However, researchers should avoid the trap of inflating scale reliability artificially by adding synonyms of existing items, which leads to unnecessarily long scales with a narrow scope (Voorhees et al. 2016, p. 132). The CR criterion can be met for only one factor if the reliabilities differ. This insight is particularly useful when two competing scales of a construct are validated because it suggests that the scale for which the CR criterion is met is to be preferred based on the discriminant validation results. If the factor correlation is large, subscales might be combined, which Nenkov, Inman, and Hulland (2008) do based on a correlation of .917 (also see Row 4 in Table 2). In mature research areas, large factor correlations may be tolerated if it can be demonstrated that the constructs can be treated as distinct. In particular, if indirect approaches to discriminant validation show that two highly correlated constructs are differentially related to a third construct, or that a third construct moderates the relation between two highly correlated constructs (Franke, Sarstedt, and Danks 2021; Tesser and Krauss 1976), then there is remedial evidence of discriminant validity despite the large factor correlation relative to the scale reliabilities.
To conclude, discriminant validation is a crucial step in the development and deployment of multi-item scales. This research proposed a new CR criterion and systematic procedure that combines the CR criterion with the existing phi criterion. We hope that the new criterion and procedure contribute to improved discriminant validation of multi-item scales and thereby to better theory and practice.
Supplemental Material
sj-pdf-1-mrj-10.1177_00222437251388994 - Supplemental material for Improving the Discriminant Validation of Multi-Item Scales
Supplemental material, sj-pdf-1-mrj-10.1177_00222437251388994 for Improving the Discriminant Validation of Multi-Item Scales by Constant Pieters, Hans Baumgartner, and Rik Pieters in Journal of Marketing Research
Footnotes
Acknowledgments
The authors are grateful to the JMR review team for their thoughtful and constructive comments, which substantially improved the article. The authors also thank colleagues from the Department of Marketing at Copenhagen Business School, participants of the 2024 Association of Consumer Research annual conference, and participants of the 2025 European Marketing Academy annual conference for useful suggestions and feedback.
Coeditor
Raghuram Iyengar
Associate Editor
Jan Heide
Declaration of Conflicting Interests
The author(s) declared no potential conflicts of interest with respect to the research, authorship, and/or publication of this article.
Funding
The author(s) received no financial support for the research, authorship, and/or publication of this article.
Data Availability
Notes
References
Supplementary Material
Please find the following supplemental material available below.
For Open Access articles published under a Creative Commons License, all supplemental material carries the same license as the article it is associated with.
For non-Open Access articles published, all supplemental material carries a non-exclusive license, and permission requests for re-use of supplemental material or any part of supplemental material shall be sent directly to the copyright owner as specified in the copyright notice associated with the article.