
Abstract
A prominent explanation of the resource–conflict relationship suggests that natural resources finance rebellion by permitting rebel leaders the opportunity to purchase weapons, fighters, and local support. The bunkering of oil in the Niger Delta by quasi-criminal syndicates is an example of how the black-market selling of stolen oil may help finance anti-state groups. More systematic assessments have also shown that the risk and duration of conflict increases in the proximity of oil and diamond deposits. Yet despite the emphasis on rebel resource extraction in these arguments, empirical assessments rely almost exclusively on latent resource availability rather than actual resource extraction. Focusing on maritime piracy, this article argues that piracy is a funding strategy neglected in current research. Anecdotal evidence connects piracy in the Greater Gulf of Aden to arms trafficking, the drug trade, and human slavery. The revenue from attacks may find its way to Al-Shabaab. In Nigeria, increasing attacks against oil transports may signal an effort by insurgents to use the profits from piracy as an additional revenue stream to fund their campaign against the Nigerian government. The article hypothesizes that piracy incidents, that is, actual acts of looting, increase the intensity of civil conflict. Using inferential statistics and predictive assessments, our evidence from conflicts in coastal African and Southeast Asian states from 1993 to 2010 shows that maritime piracy increases conflict intensity, and that the inclusion of dynamic factors helps improve the predictive performance of empirical models of conflict events in in-sample and out-of-sample forecasts.
Keywords
Introduction
Rebellion is costly. Grievances may motivate insurgents, but rebel leaders require resources to purchase weapons, pay fighters, and guarantee local support. Indeed, prying a local resident off the proverbial fence is made easier when accompanied by financial remuneration. Drugs, gemstones, and oil provide the lootable resources to fund insurgency. Further, such resource wealth increases the value of regional control of territory and pushes rebel leaders into separatist conflicts (Fearon, 2004; Ross, 2006). If resource control supports rebellion, maritime piracy as a form of illicit resource appropriation may provide rebel groups with critical funds for the financing of armed conflict. 1 The bunkering of oil and kidnapping for ransom by quasi-criminal syndicates in the Greater Gulf of Guinea may represent one such focused funding strategy for anti-state groups. 2 Experts agree that many pirates are current or former Niger Delta militants that have extensive experience targeting oil pipelines and platforms (Pérouse de Montclos, 2012; Ikelegbe, 2006). Additionally, in Southeast Asia, Islamist groups have allegedly turned to piracy and other crime when resources run low (Liss, 2014; Hastings, 2012). In the Philippines, for example, Abu Sayyaf remains active in the Southern Sulu archipelago where piracy flourishes.
Research indicates that resource rebellions are particularly difficult to resolve when profiting from the sale of contraband incentivizes continued fighting (Fearon, 2004). Further, the number of intrastate conflicts funded through drugs and or minerals appears to have increased after the collapse of the Soviet Union because competitive Cold War funding levels plummeted (Ross, 2006). Rebels sought alternative funding streams that could be developed locally and are not dependent on outside actors. Maritime piracy re-emerged around the same time. The International Maritime Bureau (IMB) recorded 107 pirate attacks in 1991, which increased by 300% over the next ten years. Maritime piracy and the exploitation of other available resources may thus have jointly emerged as a means of revenue generation for rebels.
A cursory look suggests that piracy thrives in countries where insurgency also prospers. Figure 1 maps geolocations of pirate attacks and armed insurgencies in Africa and Southeast Asia. The figure suggests a correlation between piracy incidence and conflict events, showing that some of the most conflictual countries in Africa and Southeast Asia also experience significant maritime piracy. The five most piracy-prone countries since 1993 – Indonesia, Bangladesh, Nigeria, India, and Somalia – have all experienced, or continue to experience, significant political violence.
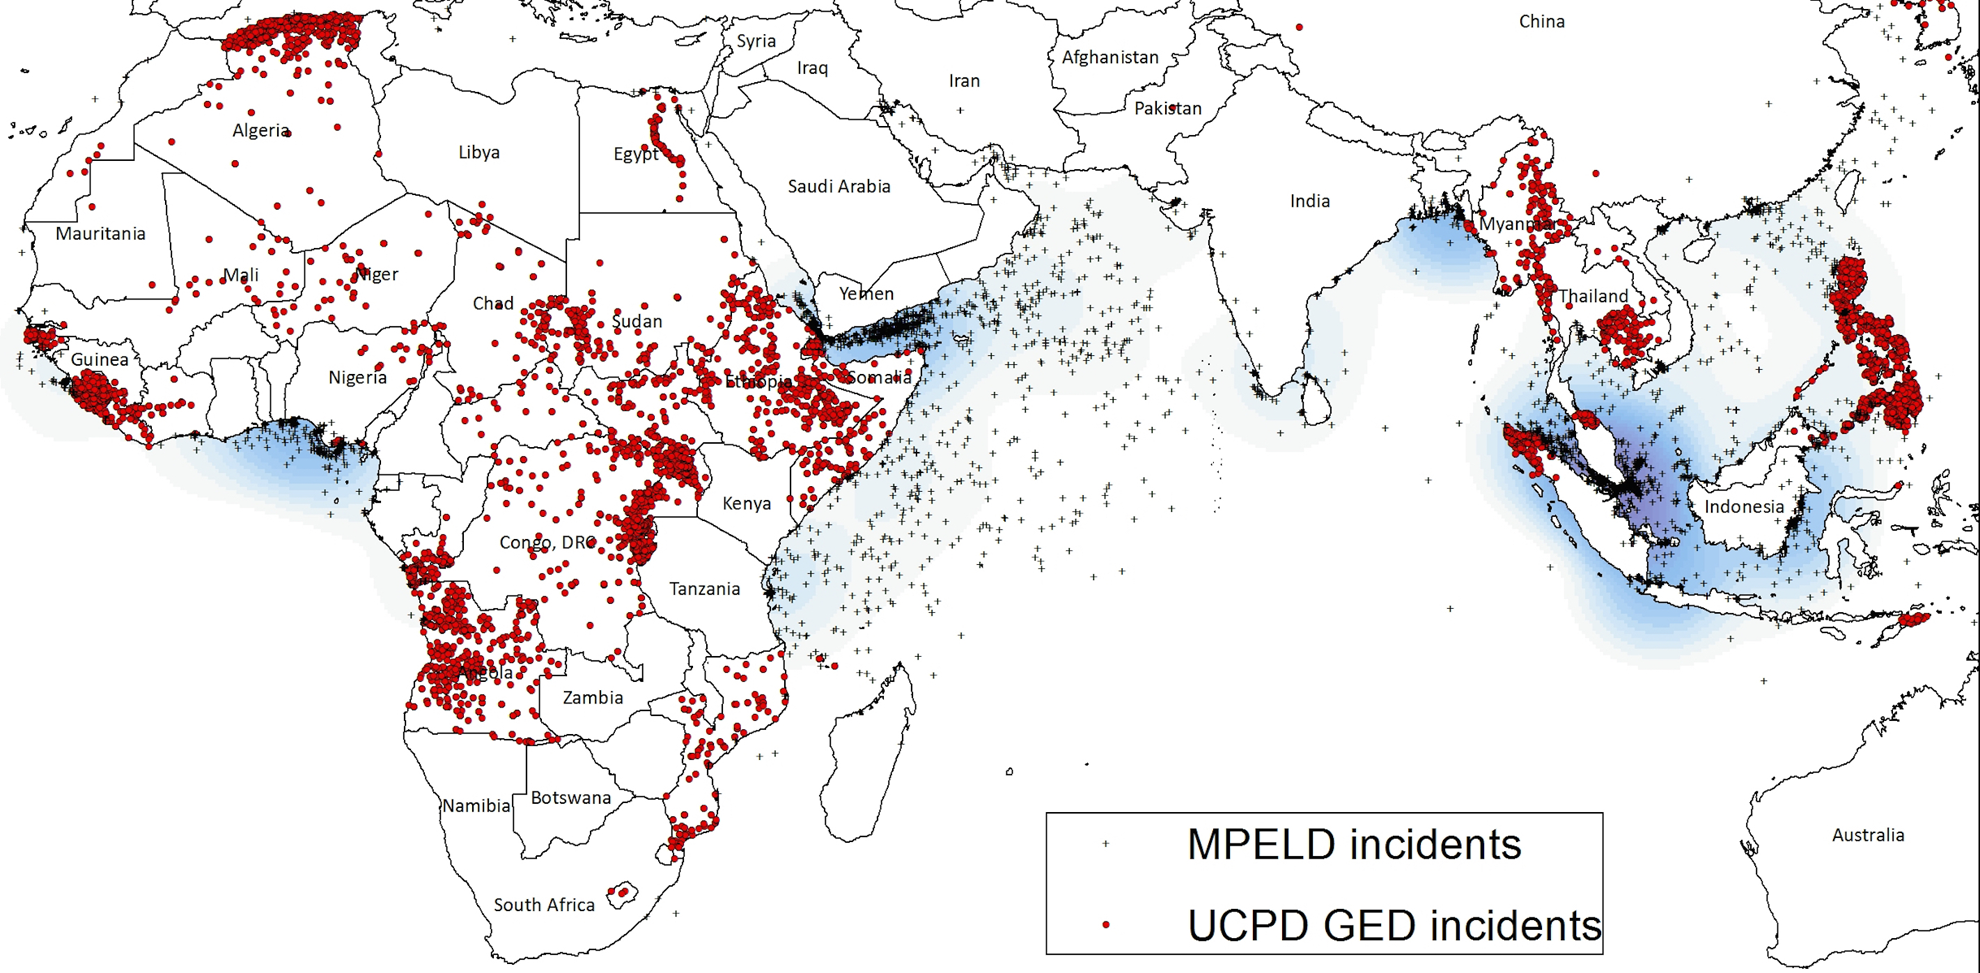
Heat map of piracy incidents (MPELD), and state conflict events (UCDP GED) in Africa and Southeast Asia, 1993–2010
Conditions that facilitate the emergence of violent non-state groups may also facilitate piracy. It may thus be that piracy and insurgency develop from similar environments, such as economic and ethnic inequality, poverty, and state weakness (Hastings, 2009; Murphy, 2009; Marchione & Johnson, 2013). Yet piracy, similar to the use of contraband or oil, may also result from strategic decisions made by insurgent leaders looking for resources to fund rebel activities. Groups such as Abu Sayyaf and Al-Qaeda in the Islamic Maghreb use kidnapping for ransom as a fund-raising tactic. Transnational criminal organizations (TCOs) also gravitate towards weak and corrupt governments exploiting political instability and subsequently prolonging armed conflict. 3 This suggests that disrupting the funding arm of rebellions could help reduce conflict by eliminating the economic basis of fighting.
We contribute to research on the political economy of civil war by examining the relationship between maritime piracy and armed conflict. 4 First, to our knowledge, this is the first attempt to document systematically whether piracy serves as a funding arm of insurgent groups, similar to natural resources such as diamonds, drugs, or oil. By studying the effect of piracy, we focus on a form of resource appropriation that captures actual acts of looting rather than demonstrating the effect of latent resource availability common in other research. 5 In what is likely an implausible assumption, work on resources such as oil, diamonds, or drugs, generally expects these resources to affect the onset and duration of insurgency invariantly over time. 6 We establish a more direct and dynamic effect of resource appropriation by demonstrating that piracy incidents increase conflict activity using temporally disaggregated data. Our findings for African and Asian conflicts show that piracy incidents increase conflict activity, and these results are robust to various model specifications.
Second, we use predictive analyses to assess whether dynamic measures of lootable resources both improve our understanding of conflict processes and facilitate more accurate forecasts of political violence. Our results confirm that dynamic and disaggregated information on resource extraction, including maritime piracy, is more helpful in tracing the trajectory of a violent insurgency than static measures. Out-of-sample predictions demonstrate that predictions with maritime piracy as a right-hand-side variable perform better than naïve model predictions. In addition, predictive analyses helped inform our empirical expectations. Longer time windows for piracy (such as six-month moving average) improved predictive accuracy, which makes sense considering that loot from piracy may not be immediately fungible.
Third, while research on civil conflict often alleges the presence of shadow networks in which criminal and insurgent activity overlap, the lack of detailed data on criminal activity has made it difficult to establish these connections empirically. Using data on piracy incidents, we show that illicit attacks on ships coincide with increases in conflict activity.
We divide the article into several sections. We first review research on the financing of rebellion. Our theoretical section explores direct and indirect connections between piracy and insurgency. Noting how insurgents-turned-pirates have used the bunkering of oil, ransoming of ships and crew, and looting of maritime vessels to fund their campaigns, we argue that piracy represents one lucrative strategy to directly sustain rebellion. Piracy may also help sustain conflict less directly as a result of collusion between criminal and insurgent groups. We test the empirical implications of our arguments with monthly data for ongoing civil conflicts in coastal African and Southeast Asian states from 1993 to 2010.
Resources, lootability, and the risk of insurgency
Conventional wisdom establishes a relationship between natural resource rents, low economic growth (Ross, 1999), poor governance (Weinstein, 2005; Arezki & Gylfason, 2013), and higher conflict risk (Collier & Hoeffler, 2004). We focus on rebel-centered rather than state-centered explanations. 7 The opportunity mechanism connects resource exploitation to conflict by arguing that easily lootable resources provide the financial means for insurgency or help rebels extort resources (Basedau, Mähler & Shabafrouz, 2014). Yet empirical evidence remains mixed, data-dependent, and theoretically overdetermined. Using cross-national and yearly research designs, Collier & Hoeffler (2004), Humphreys (2005), and Ross (2006) find that countries with larger natural resource endowments run a higher risk of civil war onset. Other cross-national research finds no relationship between resources and conflict onset (Bazzi & Blattman, 2014) or observes that most empirical evidence is fragile (Hegre & Sambanis, 2006). 8 With regard to conflict duration, Collier, Hoeffler & Söderbom (2008) and Fearon (2004) note that profitability lengthens civil war. Collier, Hoeffler & Söderbom (2008) suggest that the rewards associated with resource control reduce rebels’ incentives to negotiate with government leaders. Recognizing extensive variation in the location of resources within states, research examining subnational locations of both resources and conflict events finds stronger support for a resource–conflict link. Buhaug & Rød (2006) and Lujala (2010) show that conflict risk increases and lasts longer in the proximity of resources.
Latent natural resources may incentivize rebellion, but the ease with which such resources can be exploited ultimately determines the success of recruiting efforts and fighting capability. Alluvial diamonds and other gemstones, for example, require less labor and are less capital intensive than kimberlite diamonds found deep within the Earth. Similarly, the illegal siphoning and black-market selling of oil from exposed pipelines presents a more lucrative and less difficult operation than illicitly harvesting timber (Le Billon, 2012). Civilian support also remains critical to insurgency success, but the actions of civilians can be observed by both rebels and government forces, leading civilians to conceal their sympathies during conflict to avoid targeting and punishment (Wood, 2003; Kalyvas, 2006). Moreover, if opportunistic resource extraction, such as armed robbery against foreign ships, can help to replenish rebel coffers, securing the support of local communities may be less important to insurgents. Indeed, this type of resource extraction mostly targets foreigners and thus does not threaten or alienate local communities. Resources are not stripped from civilians in the surrounding areas, preserving local support and preventing their collusion with government forces.
If lootable resources enable rebels to fight, contraband accessibility should associate with overall conflict intensity. Evidence from Colombia suggests that changes in narcotics production increase guerrilla attacks (Gonzales & Smith, 2009). Anecdotal accounts also tie piracy in Somalia to insurgent and terrorist activity. If rebels seek a political solution to their conflict with government elites, gains from attacks against ships provide insurgents with the ability to pay for fighting. But attacks and the threat of attacks also provide leverage with the government. The attacks against ships not only demonstrate rebel strength and resolve, but they also preserve local support and thus likely affect bargaining between leaders and rebels. Further, conflict intensity may increase after pirate attacks because governments seek to respond to challenges to their authority.
Are pirates really insurgents?
We develop a rebel-centric explanation of piracy and the intensity of armed conflict because resource windfalls from piracy are unlikely to be large enough that the resource curse implications prominent in state-centered explanations of piracy will play out. 9 Moreover, it is unlikely that central governments will allow for large and long-term inflows from activity they have criminalized. 10 In line with work on resources and civil war duration and intensity (Bazzi & Blattman, 2014), respectively, we focus on the effect of resources on the continuation of conflict rather than its onset. We distinguish a direct and an indirect link between piracy and civil conflict.
Regarding a direct link, we first explore whether insurgents themselves use piracy to support their operations. As mentioned earlier, arguments on resources as opportunity for sustaining rebellion imply that insurgents engage in resource extraction to sustain their operations, yet typically rely on latent resources rather than actual acts of looting in establishing empirical relationships. Some empirical illustrations help document the use of piracy as a tactic to procure resources for insurgency. For example, in June 2008 a floating production storage and offloading vessel (the Bonga) owned by oil giant Royal Dutch Shell was attacked by more than 20 armed militants close to 120 km off the Nigerian coast. The attack was both violent and costly, forcing Shell to shut down one of its primary oil fields in the Gulf of Guinea (Kashubsky, 2011; Kamal-Deen, 2015). The Movement for the Emancipation of the Niger Delta (MEND) claimed responsibility for the attack, which was only one incident among many that MEND took credit for in 2008. Shortly after the Bonga incident, insurgent leaders and government officials came to the bargaining table and agreed to an amnesty program. Simultaneously, piracy in the Greater Gulf of Guinea began to decrease. In fact, according to the IMB reporting center, pirate attacks dropped by approximately 75% between 2008 and 2011. 11 However, the ceasefire between Niger Delta militant groups and the Nigerian government appears to have disintegrated in 2010 and 2011. Not long after, piracy attacks off the Nigerian coast began to increase again along with conflict events.
This example illustrates how insurgents became pirates in the Gulf of Guinea (Kamal-Deen, 2015). MEND militants used attacks against onshore oil pipelines and offshore oil facilities not only as a way of bringing the Nigerian government to the negotiating table, but the attacks additionally raised critical funds for rebel leaders (Rinkel, 2015). Oil companies were extorted by militants and at times agreed to pay ransoms for kidnapped employees (Kamal-Deen, 2015). These tactics likely raised millions of dollars for Nigerian rebels. Moreover, the bunkering of oil became an additional fund-raising tactic used by militants. 12 Pirates increasingly target oil tankers carrying refined petroleum for siphoning and resale on the black market (Brock, 2013). Estimates are that somewhere around $100 million worth of petroleum has been siphoned from tankers in the Gulf of Guinea since 2010.
Evidence also ties Islamists to pirates in Somalia. Alexander (2013: 69) concludes, ‘there is an increasing nexus between pirate organizations, al-Shabaab, and AQAM. It is known that funding from ransom is used to assist in financing terrorist organizations’. Similarly, Tsvetkova (2009: 49) writes, ‘since the late 1990s, Somali piracy has dramatically increased and attracted rebel groups who have joined piracy in order to generate additional revenues for war-fighting’. While data are scarce, Tsvetkova cites reports on ransom payments being used for the war in Somalia, including to Al-Shabaab. In 2010, Al-Shabaab seized control of the Haradheere, a known pirate den, and supposedly negotiated a 20% cut on all ransoms (Kambere, 2012). 13 If our argument is accurate, then revenue generated from piracy off Somalia should lead to an increase in conflict. Indeed, according to the UCDP GED data, conflict events increased by 42% from 2010 to 2012, while Somali piracy increased by 100% from 2009 to 2011. Admittedly, conflict intensity has remained relatively high in Somalia even as pirate attacks have plummeted after 2011. But our argument highlights attacks against ships as one means of revenue generation that may be substituted by others over time.
Pirate groups operating in Southeast Asia now use similar tactics (Kemp, 2014; Liss, 2014). Liss (2014), for example, points to pirate attacks carried out by insurgent groups like Abu Sayyaf and the Moro Islamic Liberation Front in the Philippines, and the Free Aceh Movement in Indonesia. 14 Hastings (2012: 689) describes an increase in kidnappings for ransom during the height of the Aceh movement, and notes that at least some of the attacks were carried out by insurgents themselves.
If insurgents rely on local resources to pay fighters, purchase supplies, and keep civilian loyalties, then oil bunkering, kidnapping for ransom, and simple armed robbery represent resources that rebels can reasonably obtain. Moreover, since many pirate attacks occur in port or anchorage and mostly involve simple ship-stores being stolen, carrying out piracy attacks does not necessarily require marine equipment or navigation skills (Murphy, 2009). Such armed robbery describes many pirate incidents in Indonesia, Malaysia, Bangladesh, and Nigeria (likely resulting in profits of $10,000–$15,000 per attack). 15 Increasingly, though, oil transport ships are targeted for a much larger payoff. Siphoning hundreds of thousands of gallons of refined petroleum would likely be worth several million US dollars on the black market resulting in $30 million or so US dollars over a year’s time (UNODC, 2013). 16 This is a considerable sum of money that would help facilitate and sustain rebellion. Taken together, these examples support the contention that piracy represents a potentially lucrative strategy for insurgent organizations. 17
Second, research on insurgency often highlights connections between rebels and criminal organizations, but they are rarely explored systematically because of the dearth of information about illicit activity such as the drug trade, weapons sales, or petty crime (Kalyvas, 2015). Networks between criminals and insurgents are frequently mentioned in work on political violence, which argues that insurgents turn to the black market and criminal networks to raise funds (Reno, 1999, 2009; Felbab-Brown & Forest, 2012). Such a network, according to Peters (2013: 77), ‘sustains insurgencies from a financial standpoint, [and] also supports their asymmetric warfare campaign by spreading fear and insecurity, frustrating efforts to establish rule of law, limiting the emergence of a healthy, commercial economy, and contributing to public perceptions that the state is corrupt and incapable of countering the rebellion’. Qualitative assessments of political violence in West Africa find support for these claims; for example, illicit economic activity in Nigeria is concentrated in the south in areas proximate to MEND and other insurgent groups (Felbab-Brown & Forest, 2012). Gonzales & Smith (2009) show that drug production correlates with guerilla attacks in Colombia. For piracy, as noted above, some evidence for collusion between pirates and insurgents comes from Somalia but also Southeast Asia (Liss, 2003; Alexander, 2013). 18 In Somalia, Al-Shabaab initially opposed piracy, but later news reports document compensation agreements with pirates (Kambere, 2012). 19
The empirical implication of the above discussion is that piracy incidents should coincide with increased insurgent activity. Whether directly or indirectly benefiting from pirate gains, increasing funds should help sustain conflict activity for rebel groups. Conversely, increasing gains for insurgents may trigger counter-attacks by the government. Empirically distinguishing between direct and indirect connections between piracy and insurgent activity is unfortunately not possible. As Liss (2003) notes for Southeast Asia, the boundaries between pirate and insurgent activity are often blurry, making it difficult to establish whether insurgent groups themselves engage in piracy or simply collude with pirate organizations for a share of the profit. Like other crime, piracy includes spontaneous, opportunistic acts such as theft from ships in port or at anchor, but can also be much more organized, including carefully planned violent attacks against ships or even hijackings. Insurgents can use gains from both types of piracy to fund their activities. In robustness tests we distinguish different types of piracy, but our main expectation posits a general relationship between maritime piracy and conflict attacks.
20
Hypothesis: Piracy incidents are expected to increase civil conflict activity.
Research design, data, and analyses
Data and variables
We use a new dataset on maritime piracy (Maritime Piracy Event & Location Database, MPELD, Daxecker & Prins, 2016) 21 and data on armed conflict from the UCDP Geo-Coded Events Dataset (GED, version 1.9, Sundberg & Melander, 2013; Sundberg, Lindgren & Padskocimaite, 2010) to measure key independent and dependent variables. 22 The UCDP GED records all state conflict events with at least one fatality that occurred as part of an armed conflict in Africa and Southeast Asia. The data are currently available until 2010. 23 To test the effect of piracy on conflict, we construct a dataset using MPELD and UCDP GED at the conflict-month level for African and Southeast Asian coastal states included in UCDP GED. Our data include 38 conflicts in all coastal African states and seven Southeast Asian coastal states (Cambodia, Indonesia, Malaysia, Myanmar, Papua New Guinea, Philippines, Thailand). Restricting our analyses to Africa and Southeast Asia limits our inferences since we cannot know whether these findings would extend to piracy and conflict in other regions or countries.
Our dataset includes all conflict months while a conflict is ongoing, thus also months without conflict events. 24 The conflict-country-month is the unit of analysis in our statistical models. We aggregate to the country-conflict level for two reasons. First, data for several right-hand-side variables are not available at lower levels of aggregation. In particular, subnational data for institutional capacity, an important control to account for state-centered effects, are not available. Second, we do not expect that the effects of piracy on conflict remain localized to a specific grid cell. Piracy happens at sea while conflict happens on land, and we expect that the effects of piracy materialize at distances from conflict zones that exceed the size of grid cells. In an effort to address potential overaggregation, we include models that spatially limit conflict events and maritime piracy. We exclude events occurring more than 50 kilometers from the coast in Model 8, Table I to ensure that events committed by groups geographically removed from the coast (and thus unlikely to have connections to piracy) are not influencing our results.
The determinants of UCDP GED conflict events in African and Southeast Asia, 1993–2010
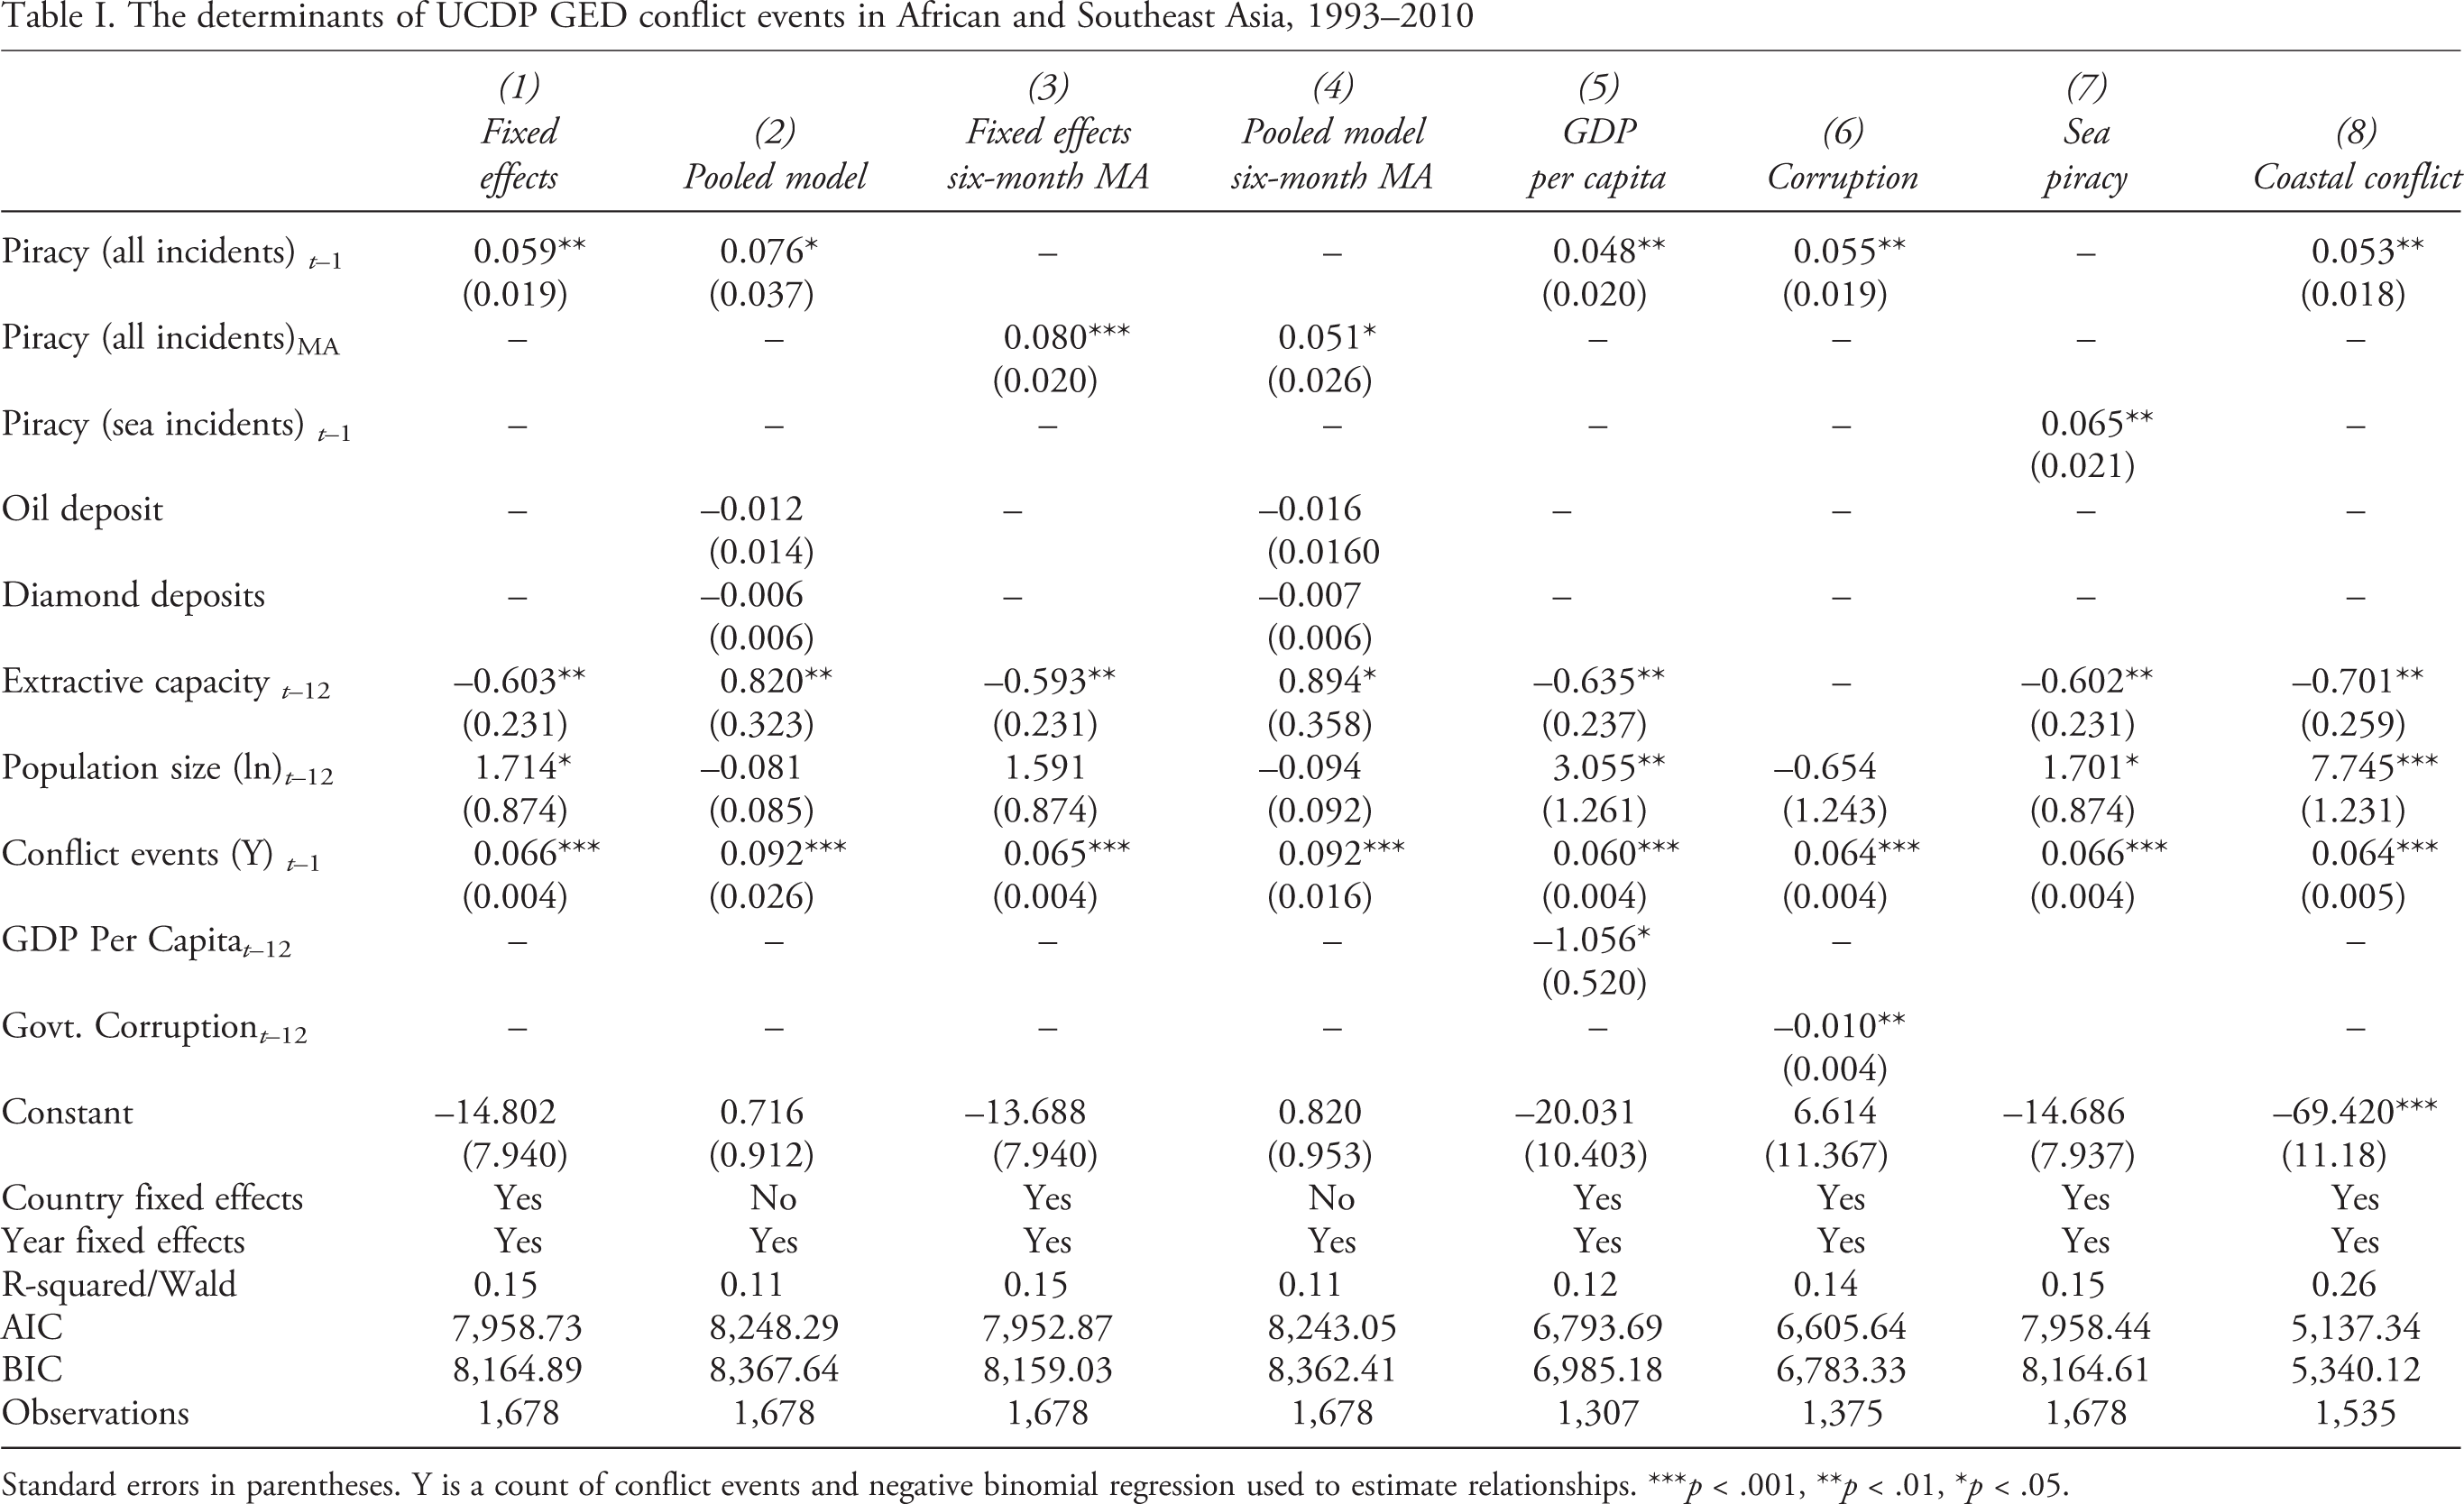
Standard errors in parentheses. Y is a count of conflict events and negative binomial regression used to estimate relationships. ***p < .001, **p < .01, *p < .05.
We model the effect of monthly piracy events on the number of state conflict events for each month in these states from 1993 to 2010. We begin our analysis in 1993 because reliable location information is not available for earlier piracy incidents, and end in 2010 because we retain years 2011–14 for out-of-sample predictions (see Colaresi & Mahmood, 2017). Our dependent variable is the monthly count of state-based conflict events with at least one fatality. In our sample, monthly conflict events range from 0 to a maximum of 67 (Angola in June 1994), with 71% of country-months experiencing one or more conflict events. We use a negative binomial model since our dependent variable is a count with overdispersion (mean 5.5, variance 57.6). Our data have a panel structure with more time units than cross-sections. We control for unobserved country-specific effects with separate country dummies, which also has the added benefit of providing consistent estimates even when unobserved unit-specific effects are correlated with the regressors (Cameron & Trivedi, 1998; Johnston & DiNardo, 1997). We also include year dummies and a lag of Y to control for serial correlation, which may not be fully addressed by unit-specific controls. With a larger number of time points than cross-sections, this dynamic structure still provides consistent estimates.
Our main independent variable measures the monthly incidence of piracy events attributed to countries with armed conflict. 25 Incidents range from 0 to 21 (Indonesia in April 2003), and 18.4% of conflict months experience one or more piracy incidents. Our primary models use a one-month lag of all piracy incidents, but we experiment with different lag structures based on findings from our predictive analyses, including a six-month moving average of all piracy incidents in Models 3 and 4. Additional specifications with lags of six and twelve months (not reported) also produced consistent results. We also measure piracy in several ways. Our main models use all incidents. In Model 7, Table I, we limit piracy incidents to those occurring while ships are in transit, which presumably indicates both a greater skill level and enhanced planning and coordination. In additional specifications (not reported), we model with violent pirate attacks and separate models limiting our piracy measure to incidents occurring in a country’s territorial sea (12 nautical miles from the coast) and a country’s exclusive economic zone (200 nautical miles from the coast) also produced consistent results.
We include six control variables. The first three controls are particularly important for distinguishing the effect of piracy from alternative explanations such as general resource availability and state capacity. Regarding natural resource availability, empirical models account for the presence of other natural resources by including controls for oil and diamonds. Since we argue that piracy can function as a form of resource appropriation for rebel groups, it is important to establish this effect while controlling for the availability of other resources. We include data on offshore and onshore oil deposits from PETRODATA, a dataset described in Lujala, Rød & Thieme (2007). 26 While PETRODATA provides some information on discovery and production dates, these dates are not always available and we thus include oil deposits as a time-invariant measure. Oil deposits range from 0 to 30 (Indonesia) and 93% of observations have one or more deposits. We include the number of all oil deposits for each conflict country. The second resource measure counts the number of diamond occurrences for each conflict with data from DIADATA presented in Gilmore et al. (2005). Diamond occurrences range from 0 to a high of 52 (Guinea), and 57% of conflict-months have one or more occurrence. Similar to oil deposits, dates on the discovery of diamond resources are missing often enough that we include them as time-invariant measures.
Our theoretical discussion noted that piracy and armed conflict may both be driven by weak state capacity and that piracy can further weaken the state, which suggests that piracy could affect conflict primarily through a state-centered mechanism. We try to address this issue by including a control for state capacity. The state’s ability to extract taxes from society is often emphasized as one of the most conceptually valid indicators of state capacity (Herbst, 2000). In order to account for structural differences between economies, we use data on relative extractive capacity rather than absolute taxing capacity since they compare ‘actual levels of extraction to their predicted values based on economic endowment’ (Kugler & Tammen, 2012: 17). The relative extractive capacity measure ranges from 0.1 to 2, with higher values representing higher relative extracting capacity. In additional tests (see Model 6 in Table I), we include a measure of control of corruption since it helps account more specifically for collusion between pirate organizations and state actors.
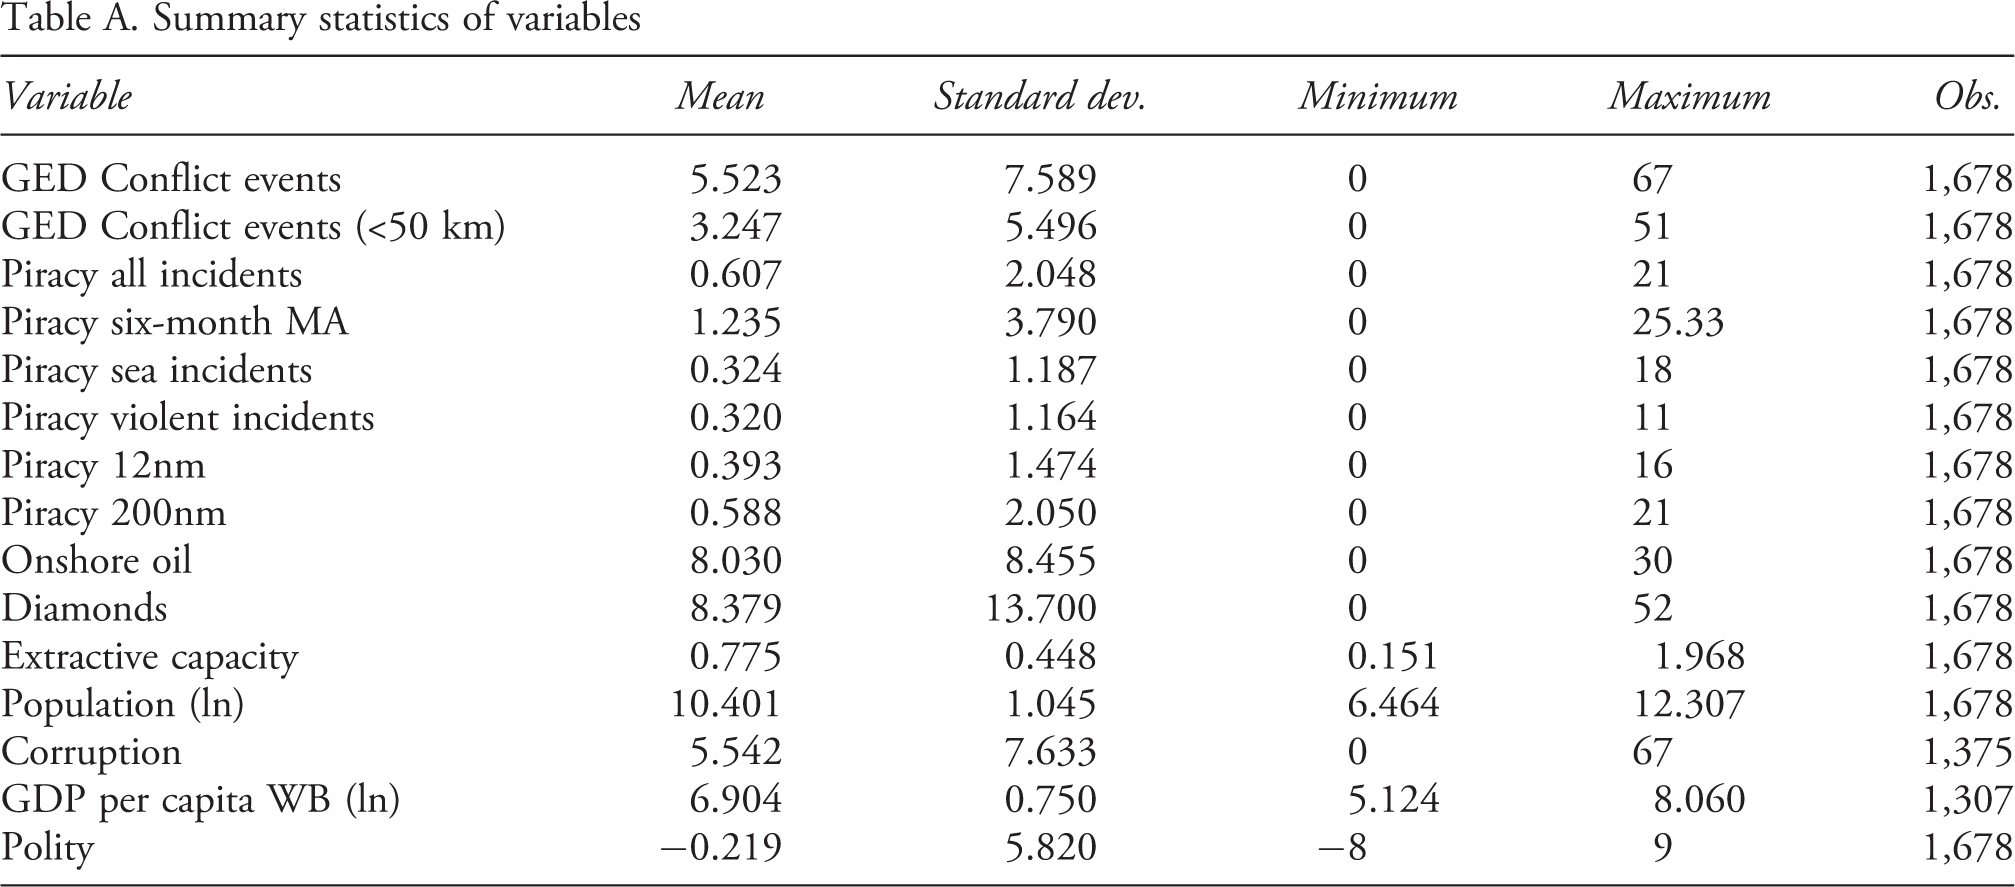
We include three additional controls likely to affect conflict intensity. We include a lagged dependent variable to account for temporal dependence in the data. We also control for country population size since research shows greater conflict risk in populous states. 27 With the exception of time-invariant measures (oil and diamond deposits), we lag independent variables by either a month (conflict events) or a year (capacity and population size). Given the strong possibility of omitted variable bias in our models, several of our models include country dummies to eliminate unobservable across-country differences that could bias our coefficient estimates. Year dummies are also included to control for a time trend. 28 Descriptive statistics for all variables can be found in Table A in the appendix.
Statistical results
Model 1 (see Table I) presents negative binomial results for the lagged piracy variable and controls using country and year fixed effects. The coefficient for piracy incidents is positive and significant, supporting the claim that piracy increases conflict intensity as expected. Natural resources variables cannot be included in the fixed-effects estimation because they are time-invariant, but are included in Model 2 discussed below. State capacity and population have expected effects on conflict. Increases in state capacity decrease the number of conflict events while countries with larger populations tend to have more conflict events. Finally, the coefficient for the lagged dependent variable indicates temporal dependence. These results are consistent with research on civil war onset. In Model 2, we include the same variables as in the first model but pool all observations and cluster errors on UCDP conflicts. The pooled model includes controls for natural resource variables. Piracy has a positive and significant effect on conflict events, supporting our findings from Model 1. We find little evidence that natural resources have an impact on conflict events. Neither onshore oil nor diamond deposits appears to either increase or decrease conflict events. Importantly, piracy incidents have a positive and significant effect on conflict intensity even when controlling for the presence of other resource endowments and the capacity of states in conflict.
Models 3 through 8 provide results using different estimator and variable specifications. In Models 3 and 4 we alter the lag structure of piracy. It may be that takings from pirate attacks are not immediately fungible. Equipment and cargo removed from a pirated vessel require reselling before becoming useful to insurgents. As will be discussed in more detail below, we learned from predictive analyses that models with multiple lags improved predictions. Rather than a one-month lag, we included a six-month moving average lag to predict piracy, which helped improve predictive assessments. Revising our models to reflect these findings, we find a positive and statistically significant effect for a moving average of piracy in both the fixed effects model and the pooled model.
In Models 5 and 6, we include additional controls on the right-hand side. Model 5 includes a measure for GDP per capita since previous research has shown a consistent effect on conflict. While we lose 375 observations because of missing data (including important conflict countries such as Somalia), our results for piracy remain robust. In Model 6, we substitute control of corruption for relative extractive capacity as an alternative measure of state strength using data from the World Bank (Kaufmann, Kraay & Mastruzzi, 2009). Control of corruption captures the perception that government power is used for private interests and we use the percentile rank that goes from 0 (no control of corruption) to 100 (high control of corruption). With corruption in the model, we lose 303 observations, including conflicts in Algeria, Angola, Egypt, Sierra Leone, and the Philippines. Our main findings remain robust in this model, and the coefficient for control of corruption has the expected negative effect on conflict events.
We also examine different types of piracy. Presumably, our argument implies that more difficult, complex, and/or violent incidents, that is, those committed by more capable, armed pirates, should be more likely to affect conflict intensity than those involving petty criminals or the like. 29 Model 7 shows a positive and significant coefficient for piracy incidents occurring while ships are in transit, confirming our expectation. In additional tests not reported, we also specify models including only violent piracy incidents and separate models that limit our piracy incidents to those occurring within 12 and 200 nautical miles of the coast. Regardless of how piracy is measured, the results show that piracy increases conflict events.
Finally, in Model 8 we restrict the dependent variable to conflict events occurring within 50 km of the coast. Using ArcGIS, we identify the distance between each conflict event and the nearest location along the coast. Events farther than 50 km are excluded from this model. This measurement strategy makes intuitive sense, since insurgencies far removed from the coast are less likely to rely on piracy as a means of revenue generation. Again, the results remain consistent with earlier specifications, showing a positive effect of piracy on conflict events within 50 km of the coast. In fact, Model 8 has the lowest AIC and BIC values. The robustness of the results presented here increases our confidence that piracy is connected to insurgent activity and plausibly represents a fund-raising tactic of rebel forces.
Predictive analyses
Research has demonstrated that regression estimates are of limited help in forecasting phenomena of interest. Ward, Greenhill & Bakke (2010: 373) argue the following: ‘If we base policy on models that are constructed on the basis of pruning that is undertaken with the shears of statistical significance, it is quite possible that we are winnowing our models away from predictive accuracy.’ Further, Ward, Greenhill and Bakke emphasize the importance of out-of-sample testing to ensure valid and generalizable inferences (see Böhmelt & Bove, 2014; Daxecker & Prins, 2015; Colaresi & Mahmood, 2017 for recent applications). We consider the predictive performance of our models in-sample and out-of-sample. Models presented in Table I were limited to the years 1993–2010, reserving the years 2011–14 for out-of-sample forecasting. Reserving observations for prediction allows for more efficient and effective model assessment. Empirical models built on one set of data will of course demonstrate fairly precise predictions for those same observations. Indeed, the model chosen was ultimately selected based on its ability to closely capture a certain data generating process. Retaining observations for out-of-sample forecasting enables researchers to assess both the explanatory power of a model (are the results consistent in both samples) as well as the precision of a model’s predictions (how successfully a model forecasts specific values of Y several months or years ahead). Depending on performance, expectations and models can then be revised to improve our predictive accuracy and ultimately our understanding of the data generating process (see Colaresi & Mahmood, 2017).
Following Böhmelt & Bove (2014: 3) and Brandt, Freeman & Schrodt (2014), we use Theil’s U, mean squared prediction error (MSPE), and the rank probability score (RPS) as methodical tests of model predictive accuracy. Theil’s U is simply the square root of the ratio of sum of the squared prediction errors (Y–Ŷ)2 from a fully-specified model (in our case, Models 1 and 2) and the errors from a very simple model that includes just a lag of Y (Yt–Yt–1)2. A Theil’s U value lower than 1 confirms that model predictions are better than a naïve estimate, and the closer an MSPE value gets to 0, the more accurate are the predictive values (Böhmelt & Bove, 2014). We also incorporate RPS, an extension of the Brier score for multicategory forecasts, because recent research questions the usefulness of point forecasting metrics, such as root mean square prediction error (Brandt, Freeman & Schrodt, 2014; also see Blair, Blattman & Hartman, 2017). They argue that RMSE remains ‘sensitive to outliers and lack[s] construct validity’ (Brandt, Freeman & Schrodt, 2014: 944). The ranked probability score measures the squared difference between the forecast probability for each category and the actual observed category (where 1 indicates the category and 0 for all other categories). Lower RPS values indicate better predictive performance (Weigel, Liniger & Appenzeller, 2007). In Table II we compare Theil’s U, MSPE, and RPS values from models with and without piracy (using Model 1 with fixed effects and Model 2 with pooled observations from Table I). This is meant to demonstrate that including a measure of piracy helps forecast values of conflict events and is therefore more accurate than a model that excludes piracy. We find that our models with and without piracy produce predictions that are more accurate than a simple null model that only includes a lag of Y. The Theil’s U in each model is less than 1. We also see that the Theil’s U and MSPE values for both models that include piracy are lower than the values for the models without piracy, which confirms our basic expectation that models with piracy mostly outperform models without piracy in terms of predictive accuracy. The rank probability scores reinforce this conclusion. In-sample, then, our results confirm the importance of piracy in predicting conflict events.
In-sample forecasting power using FE and pooled NBRM model (Models 1 and 2 in Table I)
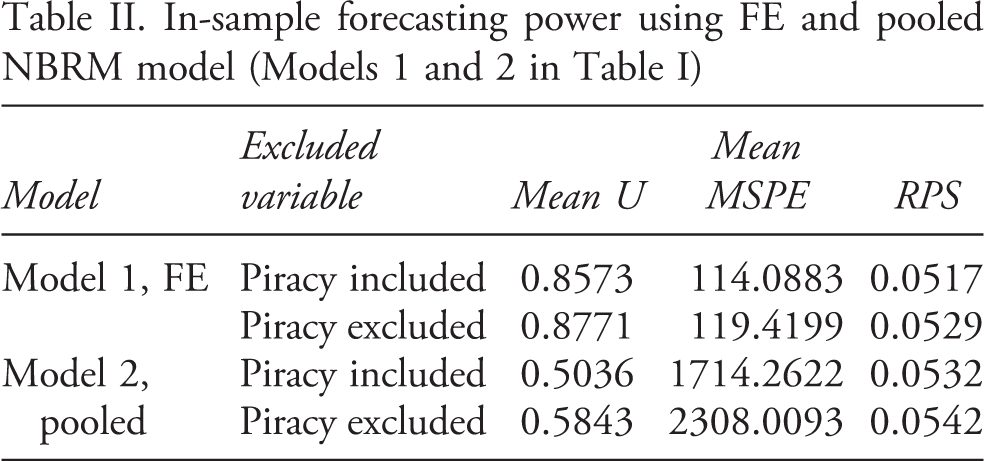
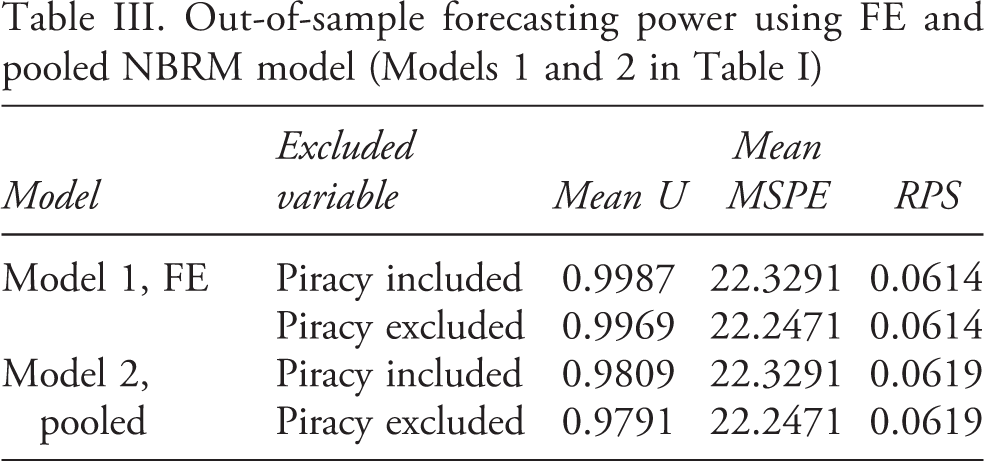
Table III illustrates the more difficult test of model accuracy using observations not utilized in model construction. We reserved conflict-months from 2011 to 2014 in Southeast Asia for out-of-sample predictions and compare predicted values based on the variables in Models 1 and 2 to predicted values from a model that includes only a lag of Y. We see that our models (fixed effects and pooled with clustered errors) with a one-month lag of piracy actually perform slightly worse than a simple lag model out-of-sample. Partly this is because we have a very limited set of observations and countries in our 2011–14 sample. The rank probability scores also show that out-of-sample predictions do not improve much with the inclusion of piracy.
Out-of-sample forecasting power using FE and pooled NBRM model (Models 1 and 2 in Table I)
Yet, a one-month lag of piracy may simply be too short a window for effects to show up. As already discussed briefly above, it makes sense that gains from piracy are not immediately fungible but rather accrue over a longer time frame. In Table IV we once again calculate Theil’s U, MSPE, and RPS using six-month moving averages of piracy. We see that this small change in the temporal window of piracy improves model performance out of sample. Not only do these models perform better than simple lag models, but our models with piracy consistently outperform models without piracy in terms of predictive accuracy. The rank probability scores also show that a six-month moving average measure of piracy improves predictive accuracy, even if only by a small amount. Based on these findings, we revise our in-sample estimations, which show consistent effects from a six-month moving average measure of piracy in Models 3 and 4, Table I.
Out-of-sample forecasting power using FE and pooled NBRM with piracy six-month MA (Models 3 and 4 in Table I)
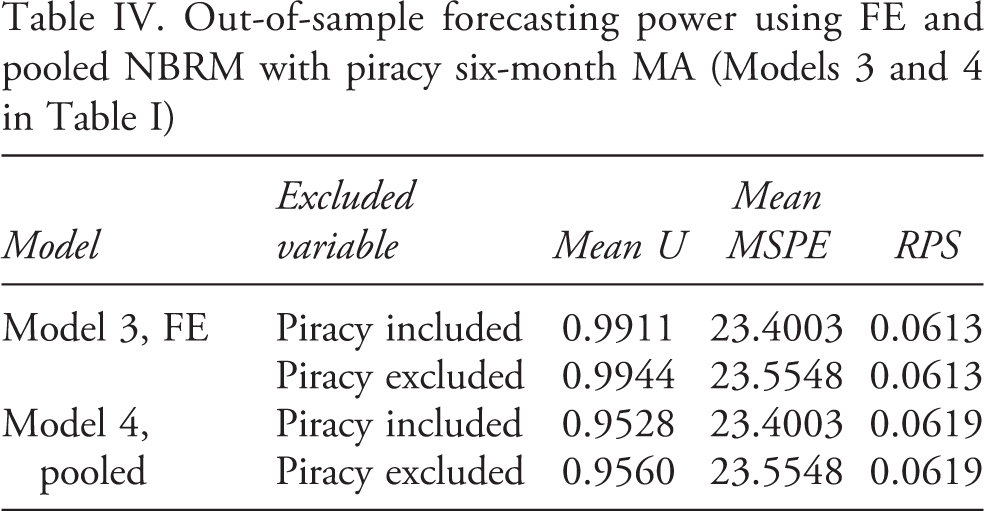
Figure 2 illustrates model performance both in-sample and out-of-sample. How precise are our predictions of conflict events using Model 2? We choose the pooled model for these illustrations since they allow us to compare predictions from a model with piracy to one with natural resources (and also to a null model with the lagged dependent variable). Given that our models are developed using actual observations of Y, we expect a relatively close association in-sample. The figure shows a close fit to the data. The model overpredicts somewhat at the beginning and towards the end of the series, but otherwise accurately captures the trends in conflict events in sample. Out-of-sample predictions from all three models appear to change only slightly. All three capture the basic trend in the conflict series from 2011 to 2014.
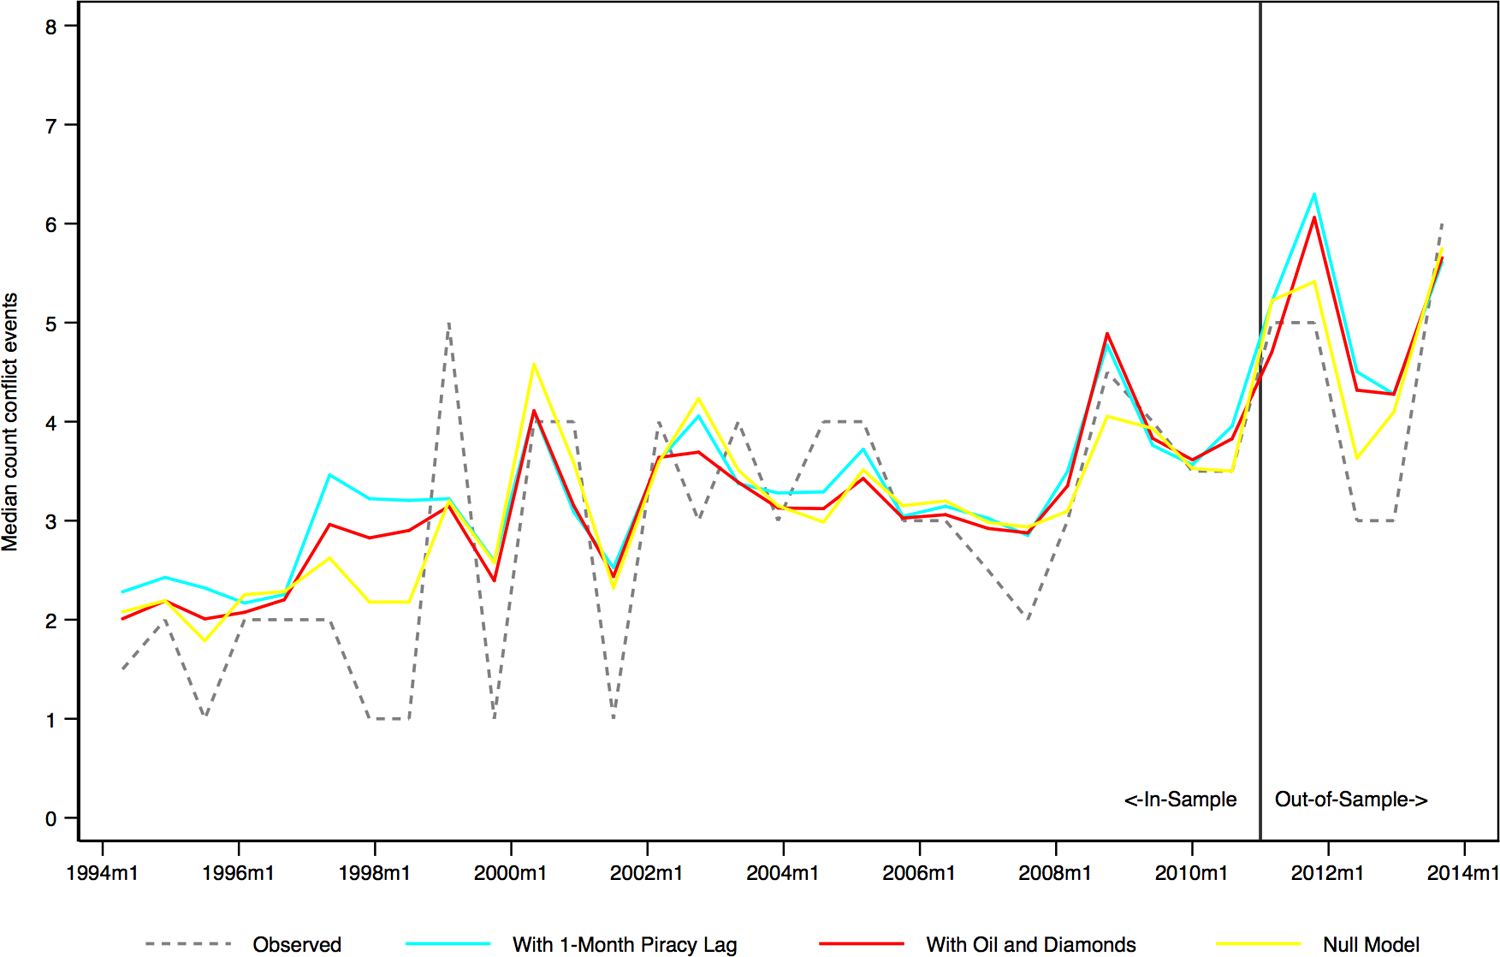
Median levels conflict events using one-month piracy lag (Model 2), natural resource measures, and a null model, in- and out-of-sample
However, since our Theil’s U and MPSE calculations from Table IV showed that a pooled model with a six-month moving average of piracy outperforms a pooled model without piracy, we create an additional figure in which we contrast the predictive performance of a model with a simple lag to a model with the six-month average. As Figure 3 shows, our predictions improve with the moving average specifications, albeit only slightly.
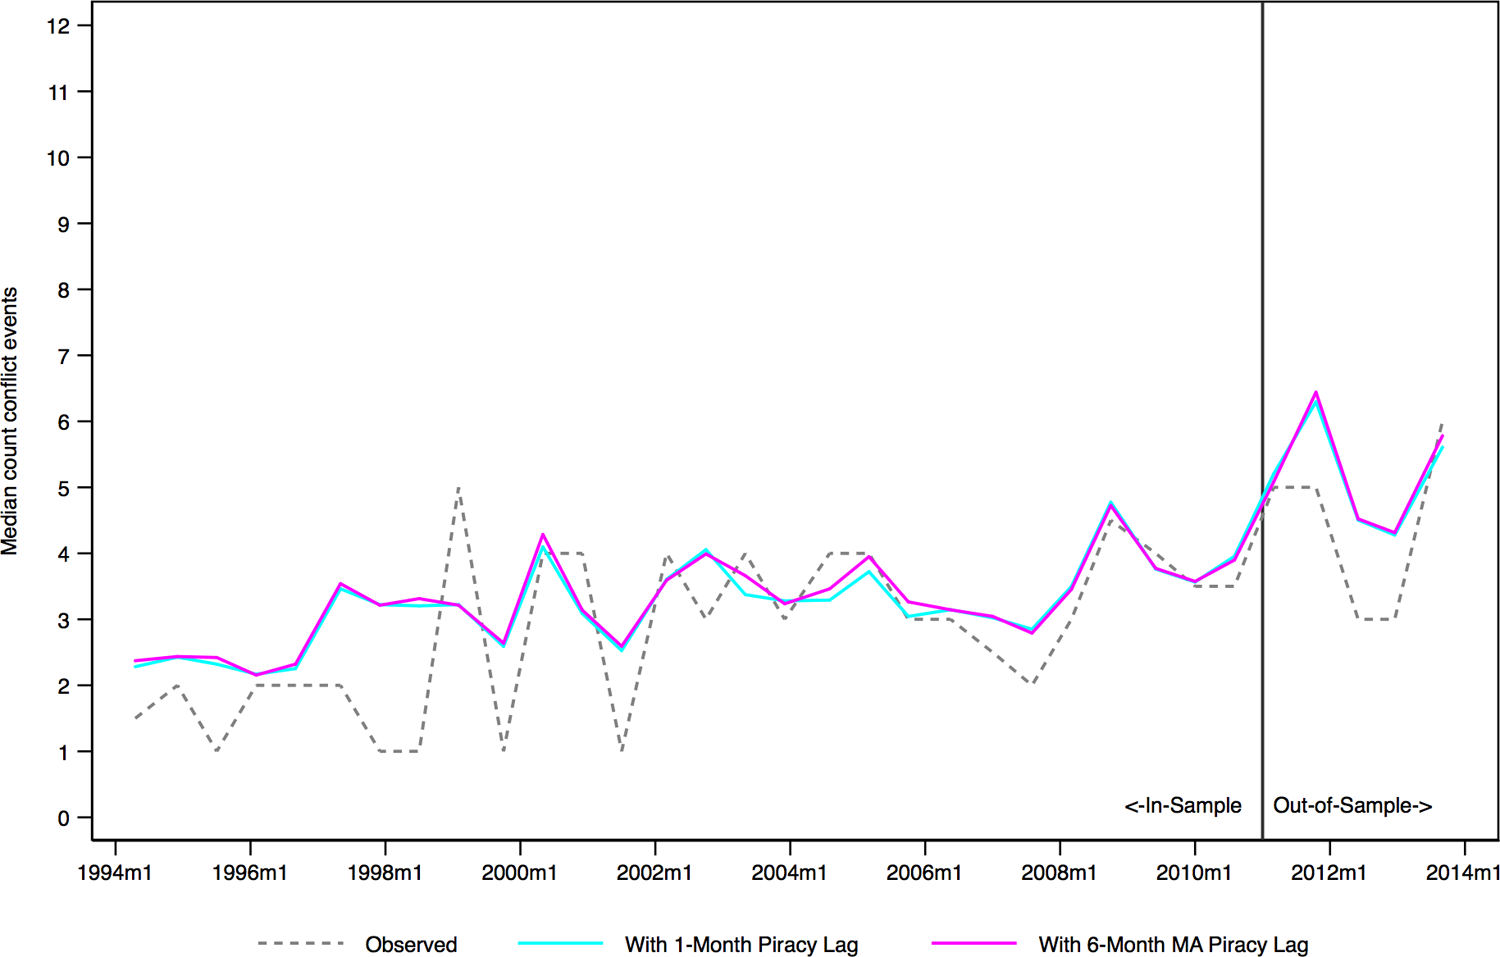
Median levels conflict events using one-month piracy lag (Model 2) and six-month moving average of piracy (Model 4), in- and out-of-sample
In sum, we conclude that information on maritime pirate attacks provides leverage in forecasting armed conflict, and predictive analyses helped improve our empirical expectations by demonstrating that a six-month moving average window of piracy improves predictive accuracy.
Conclusion
Evidence at cross-national and subnational levels appears to support the idea that natural resources affect intrastate political violence. However, one significant weakness with such research is that measures of resources remain temporally invariant. Since we know that conflict intensity fluctuates over time, a dummy variable for the presence or absence of resources can explain variation across units but not over time. Our theories, however, imply that rebel groups loot natural resources at certain times and later use the proceeds from black market trading to support insurgent activities. We argue that maritime piracy offers a funding source for rebels that has been overlooked by researchers. Not only might piracy represent a focused funding strategy of insurgents, but it is also a form of resource appropriation that varies temporally and geographically and can thus presumably provide greater leverage in explaining rebel group activity.
Using a variety of modeling strategies, we find consistent evidence that maritime pirate attacks associate with increased rebel group activity in terms of the number of conflict events in a given month. Further, we show that the inclusion of dynamic variables improves the predictive performance of empirical models (see Chiba & Gleditsch, 2017). 30 Importantly, our findings could suggest that counter-piracy efforts may have additional benefits, such as reducing conflict violence by eliminating a funding source for insurgents, although substitution effects for forms of resource appropriation not included in our model (e.g. petty crime) remain possible. Further, our results also imply that sustained pirate activity can lengthen civil war. Effective conflict resolution strategies must therefore recognize the resource bases of fighting to achieve lasting political solutions to violent conflicts.
Footnotes
Replication data
All analyses were conducted in Stata 14. Replication data, do files, and supplemental appendices can be found at https://www.prio.org/JPR/Datasets/ and ![]() .
.
Acknowledgements
Previous versions of this article were presented at the European Political Science Association, 25–27 June 2015, Vienna and at the Annual Convention of the International Studies Association, 18–21 February, New Orleans, LA. We thank Ashly Townsen, Deniz Aksoy, and conference participants for comments. Jessica Di Salvatore and Samantha Okowita provided excellent research assistance.
Funding
Funding for this project was provided by the US Department of Defense, Office of Naval Research, through the Minerva Initiative no. N00014-14-1-0050.
Notes
Appendix
Summary statistics of variables
| Variable | Mean | Standard dev. | Minimum | Maximum | Obs. |
|---|---|---|---|---|---|
| GED Conflict events | 5.523 | 7.589 | 0 | 67 | 1,678 |
| GED Conflict events (<50 km) | 3.247 | 5.496 | 0 | 51 | 1,678 |
| Piracy all incidents | 0.607 | 2.048 | 0 | 21 | 1,678 |
| Piracy six-month MA | 1.235 | 3.790 | 0 | 25.33 | 1,678 |
| Piracy sea incidents | 0.324 | 1.187 | 0 | 18 | 1,678 |
| Piracy violent incidents | 0.320 | 1.164 | 0 | 11 | 1,678 |
| Piracy 12nm | 0.393 | 1.474 | 0 | 16 | 1,678 |
| Piracy 200nm | 0.588 | 2.050 | 0 | 21 | 1,678 |
| Onshore oil | 8.030 | 8.455 | 0 | 30 | 1,678 |
| Diamonds | 8.379 | 13.700 | 0 | 52 | 1,678 |
| Extractive capacity | 0.775 | 0.448 | 0.151 | 1.968 | 1,678 |
| Population (ln) | 10.401 | 1.045 | 6.464 | 12.307 | 1,678 |
| Corruption | 5.542 | 7.633 | 0 | 67 | 1,375 |
| GDP per capita WB (ln) | 6.904 | 0.750 | 5.124 | 8.060 | 1,307 |
| Polity | −0.219 | 5.820 | −8 | 9 | 1,678 |
References
Supplementary Material
Please find the following supplemental material available below.
For Open Access articles published under a Creative Commons License, all supplemental material carries the same license as the article it is associated with.
For non-Open Access articles published, all supplemental material carries a non-exclusive license, and permission requests for re-use of supplemental material or any part of supplemental material shall be sent directly to the copyright owner as specified in the copyright notice associated with the article.