
Abstract
Objectives: The current study examines the relationship between immigration, school punishment, and place in schools near the U.S.-Mexico border using a racial threat framework. Given the consequences of the immigration-crime link and the growing perception of the U.S.-Mexico border as a crime-ridden place, this study explores how immigration within certain places may differentially impact outcomes of school punishment. Methods: Using Generalized Linear Modeling (GLM) with a logistic link function, we examine the relationship between immigration and school violence by probing variation in school punishment and juvenile justice referrals across Texas schools given their proximity to the U.S.-Mexico border. Results: First, we find that Texas schools located near the U.S.-Mexico border have lower juvenile justice and school discipline rates net other variables in comparison to Texas schools away from the border. Second, we observe a negative relationship between a rise in the immigrant student population and punishment in Texas schools far from the U.S.-Mexico border and no relationship in Texas schools near the U.S.-Mexico border net of other factors. Conclusion: The current study highlights that the local context, such as proximity to the U.S.-Mexico border, is significant when examining the racial threat perspective in school punishment and warrants further attention in future research.
Introduction
The connection between racial threat and school punishment is a part of a growing body of research that is often linked to the so-called “school-to-prison pipeline”—the disproportionate funneling of people of color out of schools and into the criminal justice system (Hughes et al. 2017; Kupchik 2016). By applying the racial threat hypothesis to schools, scholars suggest that access to educational resources and opportunities is threatened by the rise in the number of students of color (Olzak et al. 1994; Renzulli and Evans 2005). As the population increases, fears are stoked because of the perception that educational resources and opportunities are a zero-sum game. Recent studies have demonstrated correlations between large populations of students of color and increases in school security, surveillance, punishment, and referrals (Peguero et al. 2018; Rios 2011, 2017; Welch and Payne 2010, 2012, 2018). However, little is known about the role of immigration in relation to the racial threat hypothesis in U.S. public schools.
The immigration and crime link is a complex social and political issue. Often discussed in public forums, some political leaders have contributed to the growing misperception that the U.S.–Mexico border is an entry point for “immigrant criminals” who are “invading” the U.S. and therefore, warrants heightened security and surveillance (Durán 2018; Durán and Posadas 2016; Slack et al. 2017). Despite extant scholarly literature demonstrating that immigrants are less likely to be involved in crime and delinquency (Desmond and Kubrin 2009; Kubrin and Desmond 2015; Portes and Rumbaut 2014), the widespread belief that immigrants are “criminals” persists across the U.S. and dominates the public's perceptions of Hispanic 1 student populations regardless of their immigrant status. As one of the fastest growing student populations in many school districts, this narrative influences how teachers, administrators, and staff perceive immigrant students as delinquent, misbehaving, disrespectful, and problematic (Bondy 2011; Ngo 2012; Peguero 2019; Peguero and Bondy 2015). While several studies demonstrate that immigrant students are less likely to engage in school misbehavior, immigrant students remain vulnerable as they are disproportionately punished in school (DiPietro et al. 2015; Peguero 2011; Peguero et al. 2017). We build from these studies by investigating the relationship between immigration, school punishment, and juvenile justice referrals across different spaces. Specifically, this study aims to fill a gap in the literature by examining the variation in this relationship in Texas schools based on their proximity to the U.S.-Mexico border.
To this end, we first review relevant research to develop the link between racial threat and school punishment. Next, we discuss the significance of the U.S.-Mexico border and immigrant students to help us better understand the link between immigrant threat and school punishment. We then describe the data for this study drawn from the Texas Education Agency's (TEA) Public Education Information Management System (PEIMS) to examine the relationship between immigration, school punishment, and juvenile justice referrals in Texas schools. Guided by a racial threat framework, we expect that school discipline and juvenile justice referral rates will be higher in Texas schools near the U.S.-Mexico border in comparison to other Texas schools. We test for these effects while statistically controlling for known factors associated with school discipline and juvenile justice referral rates. We further expand the literature on racial threat and school punishment by examining how the proportion of children of immigrants within a school moderates school discipline and juvenile justice referral rates in Texas schools near the U.S.-Mexico border in comparison to other Texas schools. The findings highlight the complexities between racial and ethnic threat, immigration, and the importance of place given the widespread misperceptions of Hispanic immigrants along the U.S.-Mexico border. Finally, the important nuances in the relationship between threat, school punishment practices, inequality, and school context are also highlighted.
Racial Threat Within Schools
The racial threat framework explains the disproportionate involvement of people of color within the criminal justice system at every stage including arrests, sentencing, punishment, and incarceration (Jacobs et al. 2012; Johnson et al. 2011; Stewart et al. 2015; Wang and Mears 2010). Racial threat theory holds that increases in the number of people of color within a community threatens Whites, who in turn, take action (Liska 1992). Blalock (1967) argues that the source of perceived threat amongst Whites can manifest in two different ways—economic and political threat. First, competition for scarce resources like jobs causes Whites to perceive that their economic dominance is threatened. Second, as people of color gain political power, Whites feel that their political hegemony is at risk and respond with stringent justice policies like increasing policing, arrests, convictions, and severe prison sentences as a means of exerting control over the growing number of people of color.
While the link between racial threat and punishment is well established, there is a recent surge in research examining this link within schools. Earlier studies have examined some of the unintended consequences, such as antibusing activity and punitive school responses, following desegregation efforts that helped to increase the number students of color in predominantly White schools in the U.S. during the 1960s and 1970s (Olzak et al. 1994; Renzulli and Evans 2005). More recently, studies have discovered that predominantly minority schools are less likely to refer students with behavioral issues to the counselor but rather focus on severe punishment. For example, Welch and Payne (2010, 2012) found that schools with a larger proportion of students of color are more likely to adhere to zero tolerance policies and use extreme measures such as involving the police for minor offenses like fighting in school. Rios (2011, 2017) also found evidence that schools with more people of color are run like “prisons” because of their high police presence, security measures, surveillance, and stringent punishment policies. However, racial threat research generally focuses on the implications following an increase in Black/African Americans. And even when this research focuses on the Hispanic community in relation to criminal justice and school policies, there are a limited number of studies examining the significance of the location of the school and “immigrant threat.”
The Significance of Place and Potential Relevance of the Border
The inequality associated to resources that are allocated by school location (e.g., urban, rural, and suburban) is historic and persistent. Research shows that divisions and inequalities associated with school location are found to be synonymous with racial/ethnic inequality and segregation (Johnson 2014; Lewis and Diamond 2015; Roscigno et al. 2006; Shedd 2015). The implications of school climate and racial/ethnic school disparities are complex. According to Wilson (1987), these patterns of school and community inequality contribute to social isolation. While residents of heavily poor (and often racial/ethnic minority) communities have limited interactions with mainstream individuals and institutions, their main contact is with those of similarly impoverished status within their communities. As a result, Zubrinsky-Charles (2003) notes that restricted interactions with and segregation from mainstream society inside one's own community often limits knowledge and access to resources, especially for schools.
Several studies argue that increased levels of social control and stringent use of school punishment are negatively affecting school climate and exacerbating racial/ethnic educational inequalities, especially in urban communities (Peguero 2012; Peguero et al. 2021; Rios 2011; Shedd 2015). Schools convey information to students in both subtle and overt ways in terms of what race/ethnicity and place mean; who holds power in society; and whose knowledge and beliefs are valued and respected, including in relation to equitable treatment and punishment practices. Often, such information is conveyed through the power structure within schools and the use of racially/ethnically coded words by school administrators, faculty, and parents such as “dangerous” (Rios 2017). Because the location of schools has been linked to inequality, disproportionate treatment, and punishment, there is some evidence that schools located near the U.S.–Mexico border may be associated to different outcomes in school punishment. For example, Durán and Posadas (2016) found that Hispanic youth were more likely to be arrested than White students in New Mexico communities along the U.S.-Mexico border.
Due to the widespread belief that the U.S.–Mexico border is a place where “immigrant criminals” are entering, the social, political, and criminal justice responses have been to increase social control along the border (Durán 2018; Durán and Posadas 2016; Slack et al. 2017). The U.S. Border Patrol has utilized a “militarized logic” that emphasizes control, punishment, and trauma as deterrents to migration along the border. Similarly, local law enforcement agencies have adopted an approach that focuses on the criminalization and incarceration of migrants along the border. These approaches have been shown to impact the experiences of youth of color in association with violence and treatment within their schools and communities. Indeed, evidence indicates that Hispanic youth are experiencing greater levels of fear and trauma, overrepresented in the juvenile justice system, treated unfairly by school resource officers (SRO), and disproportionately punished (Chaudry et al. 2010; Welch and Payne 2018; Zatz and Rodriguez 2015). What remains uncertain, however, is how Texas schools near the U.S.-Mexico border compare to other Texas schools in relation to the link between racial threat and punishment given the disparity in school punishment across different places. Our first hypothesis, therefore, is guided by a racial threat framework whereby we expect that school discipline and juvenile justice referral rates will be higher in Texas schools near the U.S.-Mexico border in comparison to other Texas schools.
The Potential Threat of Immigrant Students
Many scholars argue that the “immigrant criminal” is a myth and stereotype that has real and detrimental effects on immigrants and their families (Chavez 2013; Kubrin et al. 2012; Portes and Rumbaut 2014; Sampson 2008). It is a global phenomenon that many of society's problems are blamed on immigrants. For instance, immigrants and their families have been accused of stealing jobs from hard working natives as well as draining resources associated with public services (e.g., healthcare and education). Kubrin and colleagues (2012) argue that there has been a significant increase in creating, implementing, and enforcing stringent criminal justice policies that are controlling immigrants and their children. Some scholars suggest that the growing population of immigrants, especially in a “post-9/11 society,” has resulted in a social, political, economic, and criminal justice “war” on immigration and immigrants (Chavez 2013; Slack et al. 2017; Zatz and Rodriguez 2015). On the one hand, the federal government enforces policies that target immigrants and their children with increased employment raids, detentions, deportations, and rhetoric establishing phenomena of “illegal immigrants” (Chaudry et al. 2010). On the other hand, state governments such as Arizona, California, and Texas create, implement, and enforce policies that deny basic health and social services to immigrants and their children (Chavez and Provine 2009).
At the same time, local policies that address the threat on immigration and immigrant families are extending into the school system. Filindra and colleagues (2011) argue that the effects of political ideology and policies are marginalizing immigrants and have detrimental consequences for their children's overall well-being, school experiences, and educational progress. For instance, there is a positive relationship between access to the welfare system and graduation rates of children of immigrants, to which restricting access to social programs from immigrants and their families can hinder the educational progress for the children of immigrants (Filindra et al. 2011). In addition, there is evidence of a growing concern among school faculty, administrators, security personnel, and law enforcement who argue that immigrant students are affiliated with gang activity in their schools. As a result, schools perceive that immigrant students are more likely to engage in violence, illicit substance sales, and other criminal activity (Durán 2013, 2018; Rios 2011, 2017). Immigrant students may join gangs to obtain resources that are otherwise unavailable to them. The intensification of violence, from this point of view, would attribute to increased competition for resources between individuals and groups. This can be exemplified with immigrant youth who, due to their positions in the social structure, may have limited access to legitimate sources that can help to raise their social status. In other words, immigrant youth may join gangs to access sources in their quest for said prestige (Martinez 2014; Ousey and Kubrin 2009, 2018).
While a handful of studies have examined the association between immigrant youth and school discipline, it is important to make distinctions among immigrant youth, such as generational differences, and their experiences within the school. For example, first-generation immigrant students have strong relationships with teachers in comparison to second-generation immigrant students (Peguero et al. 2021). Several studies have shown that this relationship steadily deteriorates over the following generations as they are more likely to experience a “downward” assimilation (Kao et al. 2013; Portes and Rumbaut 2014). Zhou (1997, 2009) highlights the possibility of a “downward” assimilation process that could facilitate the increased risk of educational failure as immigrant youth and their families undergo the assimilation process or, in other words, become “Americanized.” Thus, it is important to distinguish between immigrant youth across different generations to better understand their association to school punishment. Given the criminalization of immigrants, particularly along the U.S.-Mexico border, and the fact that they represent the fastest-growing segment of the U.S. student population, it is important to explore whether there is a link between school punishment and first-/second-generation immigrant students and how this varies between schools based on their proximity to the U.S.-Mexico border. For our second hypothesis, guided by a racial threat framework, we expect that as the proportion of first-generation and second-generation immigrant students increase, school discipline and juvenile justice referral rates will be higher in Texas schools near the U.S.-Mexico border in comparison to other Texas schools.
Method
Data
We utilize a new dataset for the analyses reported here that includes the first-grade cohorts from the 2000–2001 and 2001–2002 school years in the state of Texas. These students are then followed through the 2016–2017 school year when students graduated, even those with multiple grade retentions. The dataset includes 618,307 students from these cohorts (14 percent non-Hispanic Black/African American, 45 percent Hispanic, 38 percent non-Hispanic White, and 3 percent other race/ethnicity).
To compile the dataset, we worked with the following three separate sources: the Texas Education Agency's (TEA) Academic Excellence Indicator System (AEIS), TEA's Public Education Information Management System (PEIMS) database, and the Texas Juvenile Justice Department (TJJD) CASEWORKER system. First, each encounter with the Texas juvenile justice system is recorded in the CASEWORKER system. The system also collects the corresponding actions taken (e.g., prosecutorial referral, probation, or confinement in a secure facility). Next, PEIMS represents TEA's individual-level data system for all students in public schools, which includes students’ academic experience (e.g., grade progression, disciplinary encounters, and demographics). Finally, the AEIS dataset, provides aggregate measures of the school climate in each public school and district in Texas (e.g., district wealth, aggregate demographics in terms of student and faculty).
To gain access to the CASEWORKER data, a data-sharing agreement was negotiated with TJJD. To access the TEA data, the project required approval from the following: the Education Research Centers Advisory Board, a Texas government body that oversees access to data from TEA; the Texas Higher Education Coordinating Board; and the Texas Workforce Commission. There are three Texas Education Research Centers through which access to the data are tightly controlled. The research team accessed the data through the University of Texas Education Research Center. As part of the data-sharing agreement with TJJD, TEA matched PEIMS data to the CASEWORKER data and provided the research team with de-identified records. Approximately 90 percent of the juvenile justice records matched to a student in the PEIMS data. This match is quite high when one considers that students who are home-schooled, in private school, or moved to Texas without enrolling in school are eligible for juvenile justice contact but are not found in the PEIMS data. When considering juveniles who moved to Texas, one must be mindful of Hurricane Katrina in 2005. One year after the storm, over 18 percent of the pre-hurricane population of New Orleans resided in Texas (Sastry and Gregory 2014).
Dependent Variables
This paper focuses on the following two dependent variables for each school/year: (1) the proportion of students who received exclusionary discipline during the school year and (2) the proportion of students referred to juvenile justice. We include all school/years that are not elementary (grade 6 and below) and where a school teaches at least 10 students in the study cohort during any school year between 2000–2001 and 2016–2017. Additionally, any student that attends two or more schools in a school year is associated with the school they were linked to for the longest period.
The first dependent variable is the proportion of students that received exclusionary discipline during the year. We consider exclusionary discipline to include any of the following: in-school suspension; out-of-school suspension; expulsion; or placement in an alternative education program (run by either the school district or the county juvenile justice system). The number of cohort students for a school/year are divided into the total of cohort students with at least one referral.
The second dependent variable is the juvenile justice rate for the school/year. A student is noted as having a juvenile justice referral if there is a formalized referral on record with TJJD for the school year. A formalized referral by a TJJD staff indicates that they feel there is reasonable belief that a violation exists. This method removes any cases where the referrals made were judged to be without substance. The total number of cohort students in a school/year are divided into the number of cohort students with at least one discipline encounter.
For the unit of analysis, we focus on the school/year as both dependent variables are calculated on an annual basis. Because we are using cohorts of students, many schools would not be present for multiple years; as such, we do not employ changes in discipline/juvenile justice rates across years. Furthermore, the study is examining the link between the proportion of children of immigrants, school discipline, and juvenile justice referral rates and therefore, is more cross-sectional in nature. In total, there are 3,522 schools represented in 15,892 school/years. The median number of years a school is present is four.
Independent Variables
We examine the effect of immigrant populations on the level of school discipline and juvenile justice referrals for a school by using two distinct measures for immigrant status. As mentioned earlier, it is important to make a distinction between first- and second-generation immigrant youth given differences in other school outcomes to better understand their association to school punishment. First, we look at the percentage of students who have been classified by TEA as immigrants, which indicates that they were not born in the U.S., at least once in their academic careers. We employ a dummy variable indicating if the child was ever classified as an immigrant in the PEIMS data and refer to this as the percentage of first-generation immigrant students. The PEIMS records indicates they were born outside of the U.S. and have not attended a U.S. school for more than three years. This definition is used by the Texas Education Agency and the No Child Left Behind Act of 2001 (TEA 2022). Since we possess records from the students’ first grade school year, we can capture an immigrant flag before they attend school for over three years. Next, we look at the percentage of individuals who have been classified at one point in their academic careers as being of limited English proficiency and have never been classified as an immigrant. We refer to this as the percentage of second-generation immigrant students. Research demonstrates that many U.S.-born children of immigrants (i.e., second-generation immigrant youth) are identified as having limited English proficiency. Guided by this research, we subtracted the number of immigrant students from the students identified as limited English proficient in order to categorize the second-generation variable in this study (Kao et al. 2013; Olsen 2008; Peguero 2011; Peguero et al. 2021; Rong & Preissle 2008). With that noted, there are limitations with using these measures. To be able to adequately measure the immigrant status of students, parents’ immigration information would be needed; however, these data are not usually collected by schools. While this measure has limitations, prior research has incorporated this measure as a proxy to first- and second-generation immigrants (Kao et al. 2013; Peguero 2011). We believe that the value of this measure in the analysis outweighs the clear limitations.
Another factor we explore is the interplay between school racial/ethnic composition, school discipline, and juvenile justice. Previous scholarship indicates these distributions are associated with rates of grade retention, dropout, and juvenile justice referrals (Peguero et al. 2018). School-level proportions of non-Hispanic Black/African Americans, Hispanic, and other race/ethnic minorities are placed into the model to provide an examination of the link between each racial/ethnic group populations within schools, school discipline, and juvenile justice rates.
Finally, given the significance of examining Texas schools near the U.S.-Mexico border in the relationship between immigrant youth and school punishment, we use a dummy variable for border status. The Texas-Mexico border is over 1,200 miles. A Texas school is identified near the border if the county the school lies in either borders the U.S.-Mexico border or is adjacent to a county that borders Mexico. We employ the Texas Department of State Health Services’ (2021) definition of border counties from the Office of Border Public Health. This definition classifies all counties within 100 km of the Mexico border as border counties. In all but one case, the counties either border Mexico directly or are adjacent to a county that borders Mexico. Collectively, these border counties represent a total of 67,557 mi2, which is greater than the state of Florida (Texas Department of State Health Services 2021). Furthermore, we include an interaction term between border and percentage of students that are first-generation immigrants and another interaction term between border and the percentage of students that are second-generation immigrants to allow for variation in the effect of immigration by border status. As discussed earlier, there are important and nuanced distinctions between and across immigrant generations regarding punishment for the children of immigrants. Considering that this study is investigating the intersection of immigrant generation, place, punishment, and the potential significance of threat, utilizing an interaction between immigration generation and place is warranted and needed for this study's analysis in order test the second hypothesis.
Control Variables
Prior research has identified several school characteristics linked to negative outcomes such as school discipline and juvenile justice contact (Bejarano 2005; Flores 2016; Gottfredson 2001; Hughes et al. 2017; Johnson et al. 2019; Kao et al. 2013; Kupchik 2010, 2016; Lopez-Aguado 2018; Peguero 2011, 2019; Peguero and Bondy 2015; Peguero et al. 2018; Rios 2011, 2017; Shedd 2015; Skiba et al. 2011; Welch and Payne 2010). Thus, we include these control measures in our analysis.
Percent of students who are male. The percentage of students from our cohorts at the school who are male.
Percent of students who receive free or reduced lunch. The percentage of students from our cohorts provided free or reduced-price lunches at the school is used as a measure of poverty.
Size. Schools with larger student bodies are less likely to have administrators and support staff interact with students, which is a possible predictor of future outcomes. As such, we include the number of students at the school as reported by the AEIS database.
Student/teacher ratio. Large class sizes prevent teachers from spending as much time with students and makes forming strong relationships with students more difficult. These relationships could provide the students with a trusted confidant when they face struggles—which can help them both socially and academically. We control for class size by utilizing the student/teacher ratio contained in the AEIS data.
Teacher diversity. Students who attend schools with greater teacher diversity likely have different experiences than those who attend more homogeneous schools. This differing experience likely has some relationship on discipline outcomes. To account for teacher diversity, we employ a modified Greenberg diversity measure. The value is calculated as [1- (% TeachersBlack/African American/100)2 - (% TeachersHispanic/100)2 - (% TeachersWhite/100)2 - (% TeachersOther race/ethnicity 2/100)]. While initially developed as a measure of a region's linguistic diversity (Greenberg 1956), it works well for racial/ethnic diversity. Fully diverse schools receive a value of 0.75, while fully homogenous schools receive a 0.
Student-teacher racial/ethnic incongruence
Classification. The collection of grades that a school serves likely leads to differing challenges for administrators. We classify schools as pure high school (serving grades 9–12, base category), junior high school (serving grades 6–8), combination of junior and senior high school, elementary (serving grades K-5) through junior high school, and elementary through high school.
Urbanicity. The urbanicity of the school has been shown to be related to school discipline (Peguero and Bondy 2020). We control for the urbanicity of the district the school is in using dummy variables based on TEA's definition of urban (base category), suburban, rural, or other. For those districts that are not coded by TEA, we utilize the modal value for the county the school is located in.
County Felonies Per 10,000 Population. As a proxy for crime/delinquency, we used the number of felony court cases filed per 10,000 population in the county in 2016 using data collected from the Texas Indigent Defense Commission, a commission within the Texas Office of Court Administration. While other measures such as school climate would strengthen our analyses, Texas does not collect such data.
Analysis Plan
There are multiple steps to the analyses. Table 1 shows summary statistics for all included measures. Table 1 also displays the descriptive characteristics for border and non-border schools. Table 2 explores the school discipline rates of schools. School discipline is regressed on immigration, border, race/ethnicity, and school characteristics in the baseline Model 1. Border and the proportion of children of immigrants are added to the analysis in Model 2. The interaction of border and the children of immigrants is analyzed in Model 3. Table 3, as well as the respective Models 4, 5, and 6, reflect the same analytical plan but for juvenile justice referral rates. Generalized Linear Modeling (GLM) with a logistic link function using Stata 16 with standard errors clustered on the school is used for each analysis (Franzese 2005). We also explored clustering at the county-level for the juvenile justice referral model since referrals occur at that unit. However, results remained consistent regardless of the approach. Given the focus of the analyses on the school, we utilize the clustered standard errors at that level. GLM is selected over OLS regression given it does not assume normality in the error term as OLS does. As Hardin and Hilbe (2011) state, the …. traditional linear model is not appropriate when assuming that data are normally distributed is unreasonable or if the response variable has a limited outcome set. Furthermore, in many instances in which homoscedasticity is an untenable requirement, the linear model is again inappropriate. The GLM allows these extensions to the linear model (17).
Descriptive Statistics.
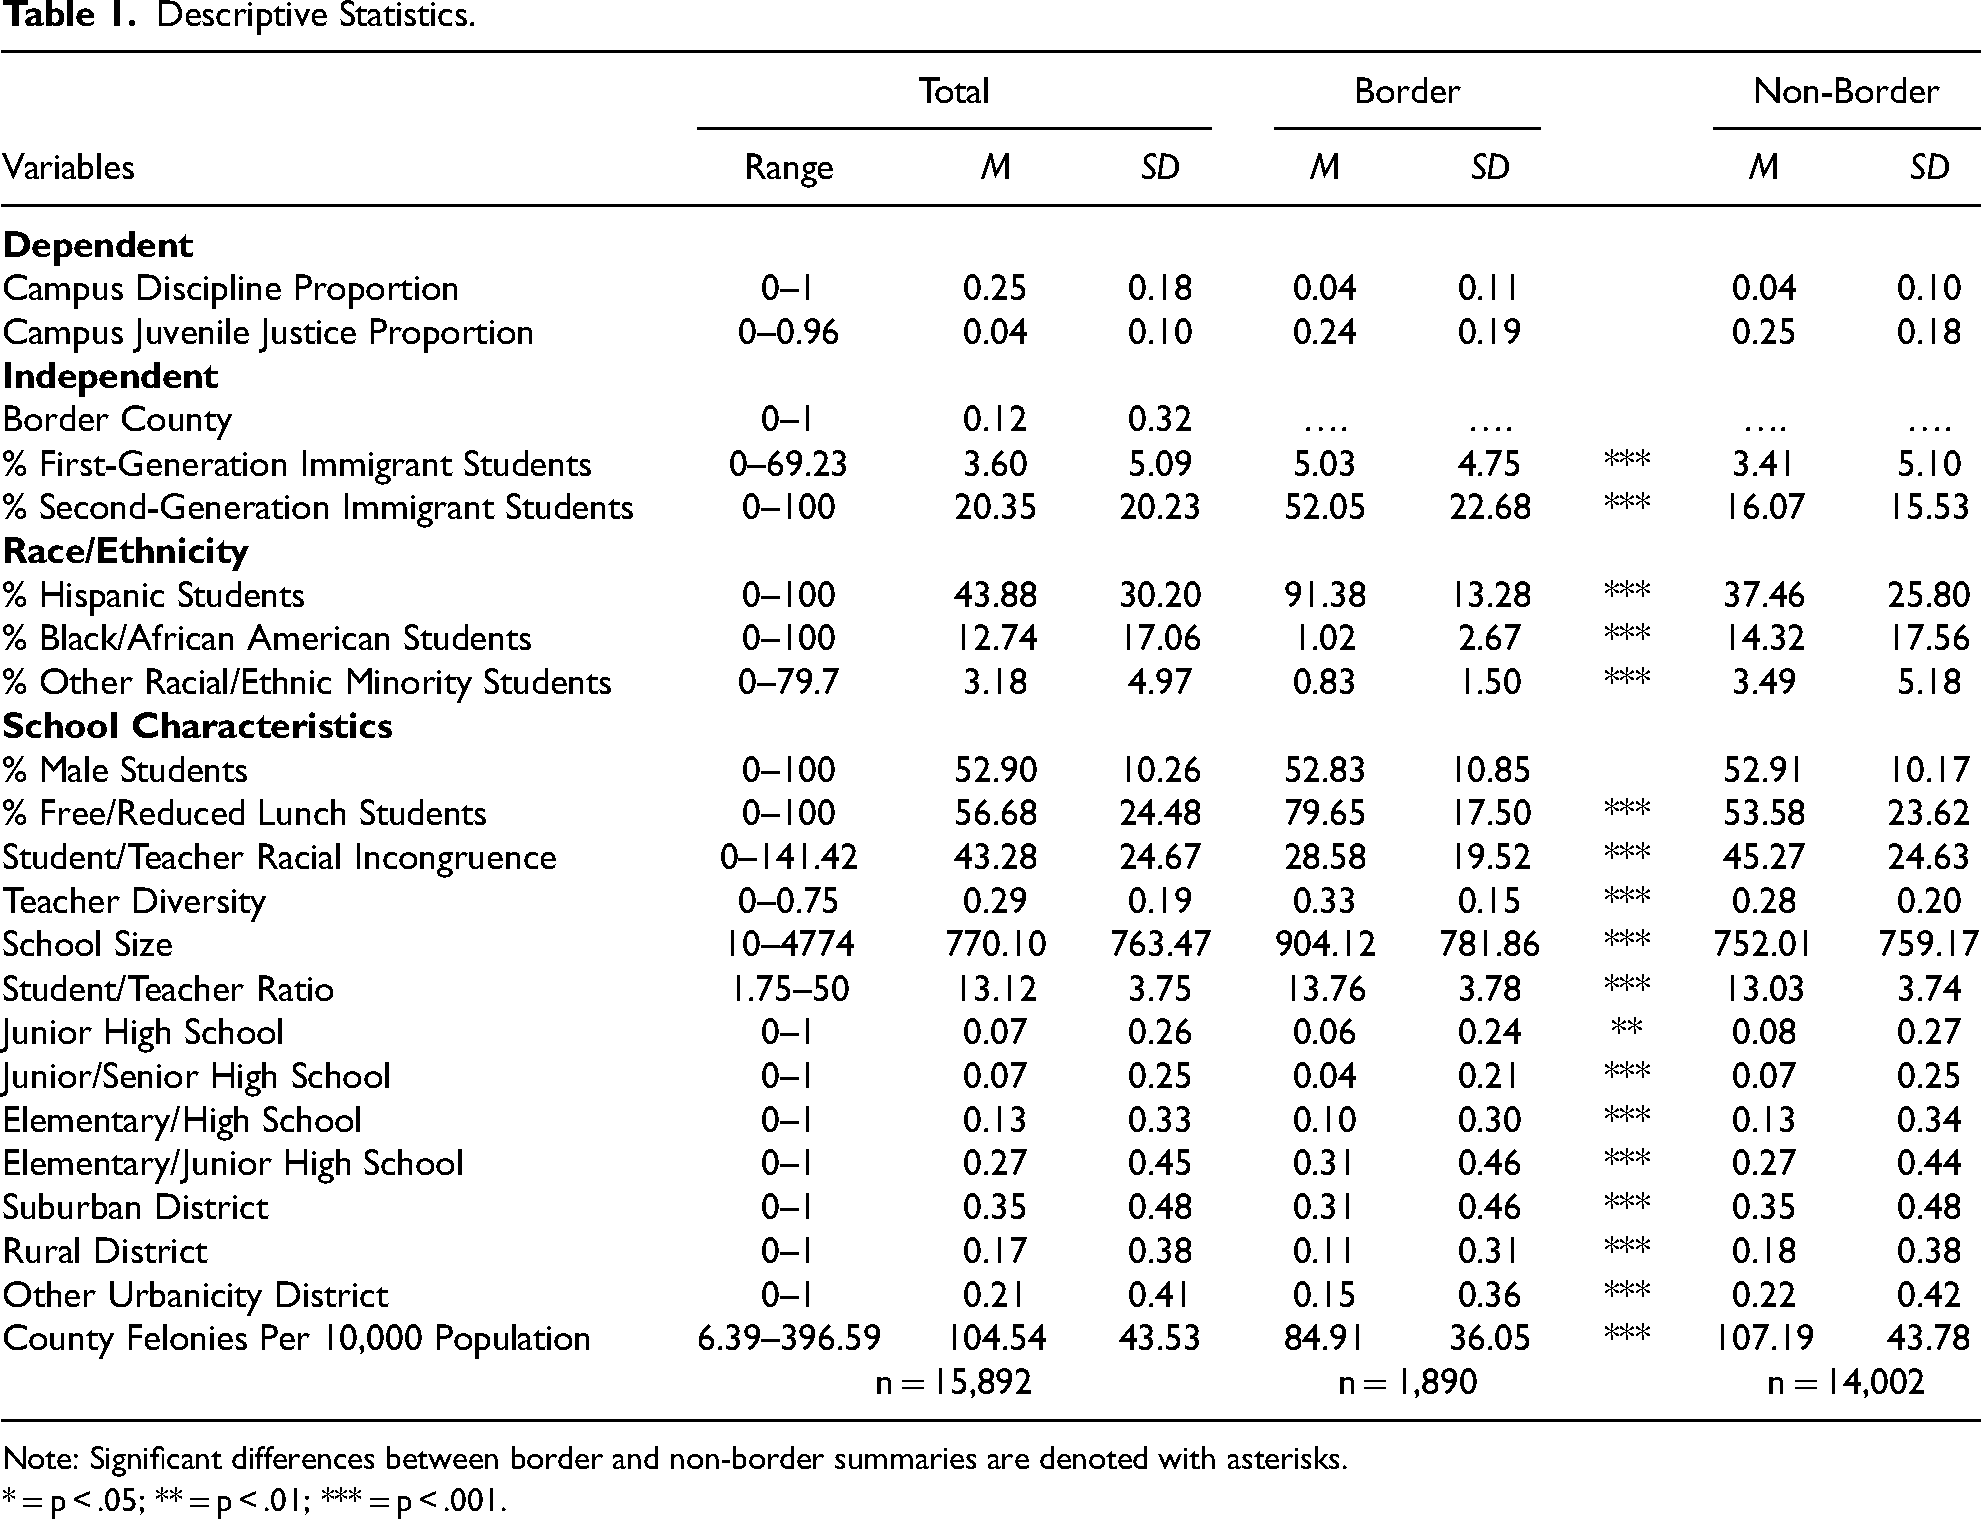
Note: Significant differences between border and non-border summaries are denoted with asterisks.
* = p < .05; ** = p < .01; *** = p < .001.
Campus School Discipline Rate.

Note: 1 Δ = Change in Proportion from a One-Unit Change in Independent Variable; SE = Standard Error, * = p < .05; ** = p < .01; *** = p < .001.
n = 15,892; Standard Errors Clustered on School.
Campus Juvenile Justice Referral Rate.
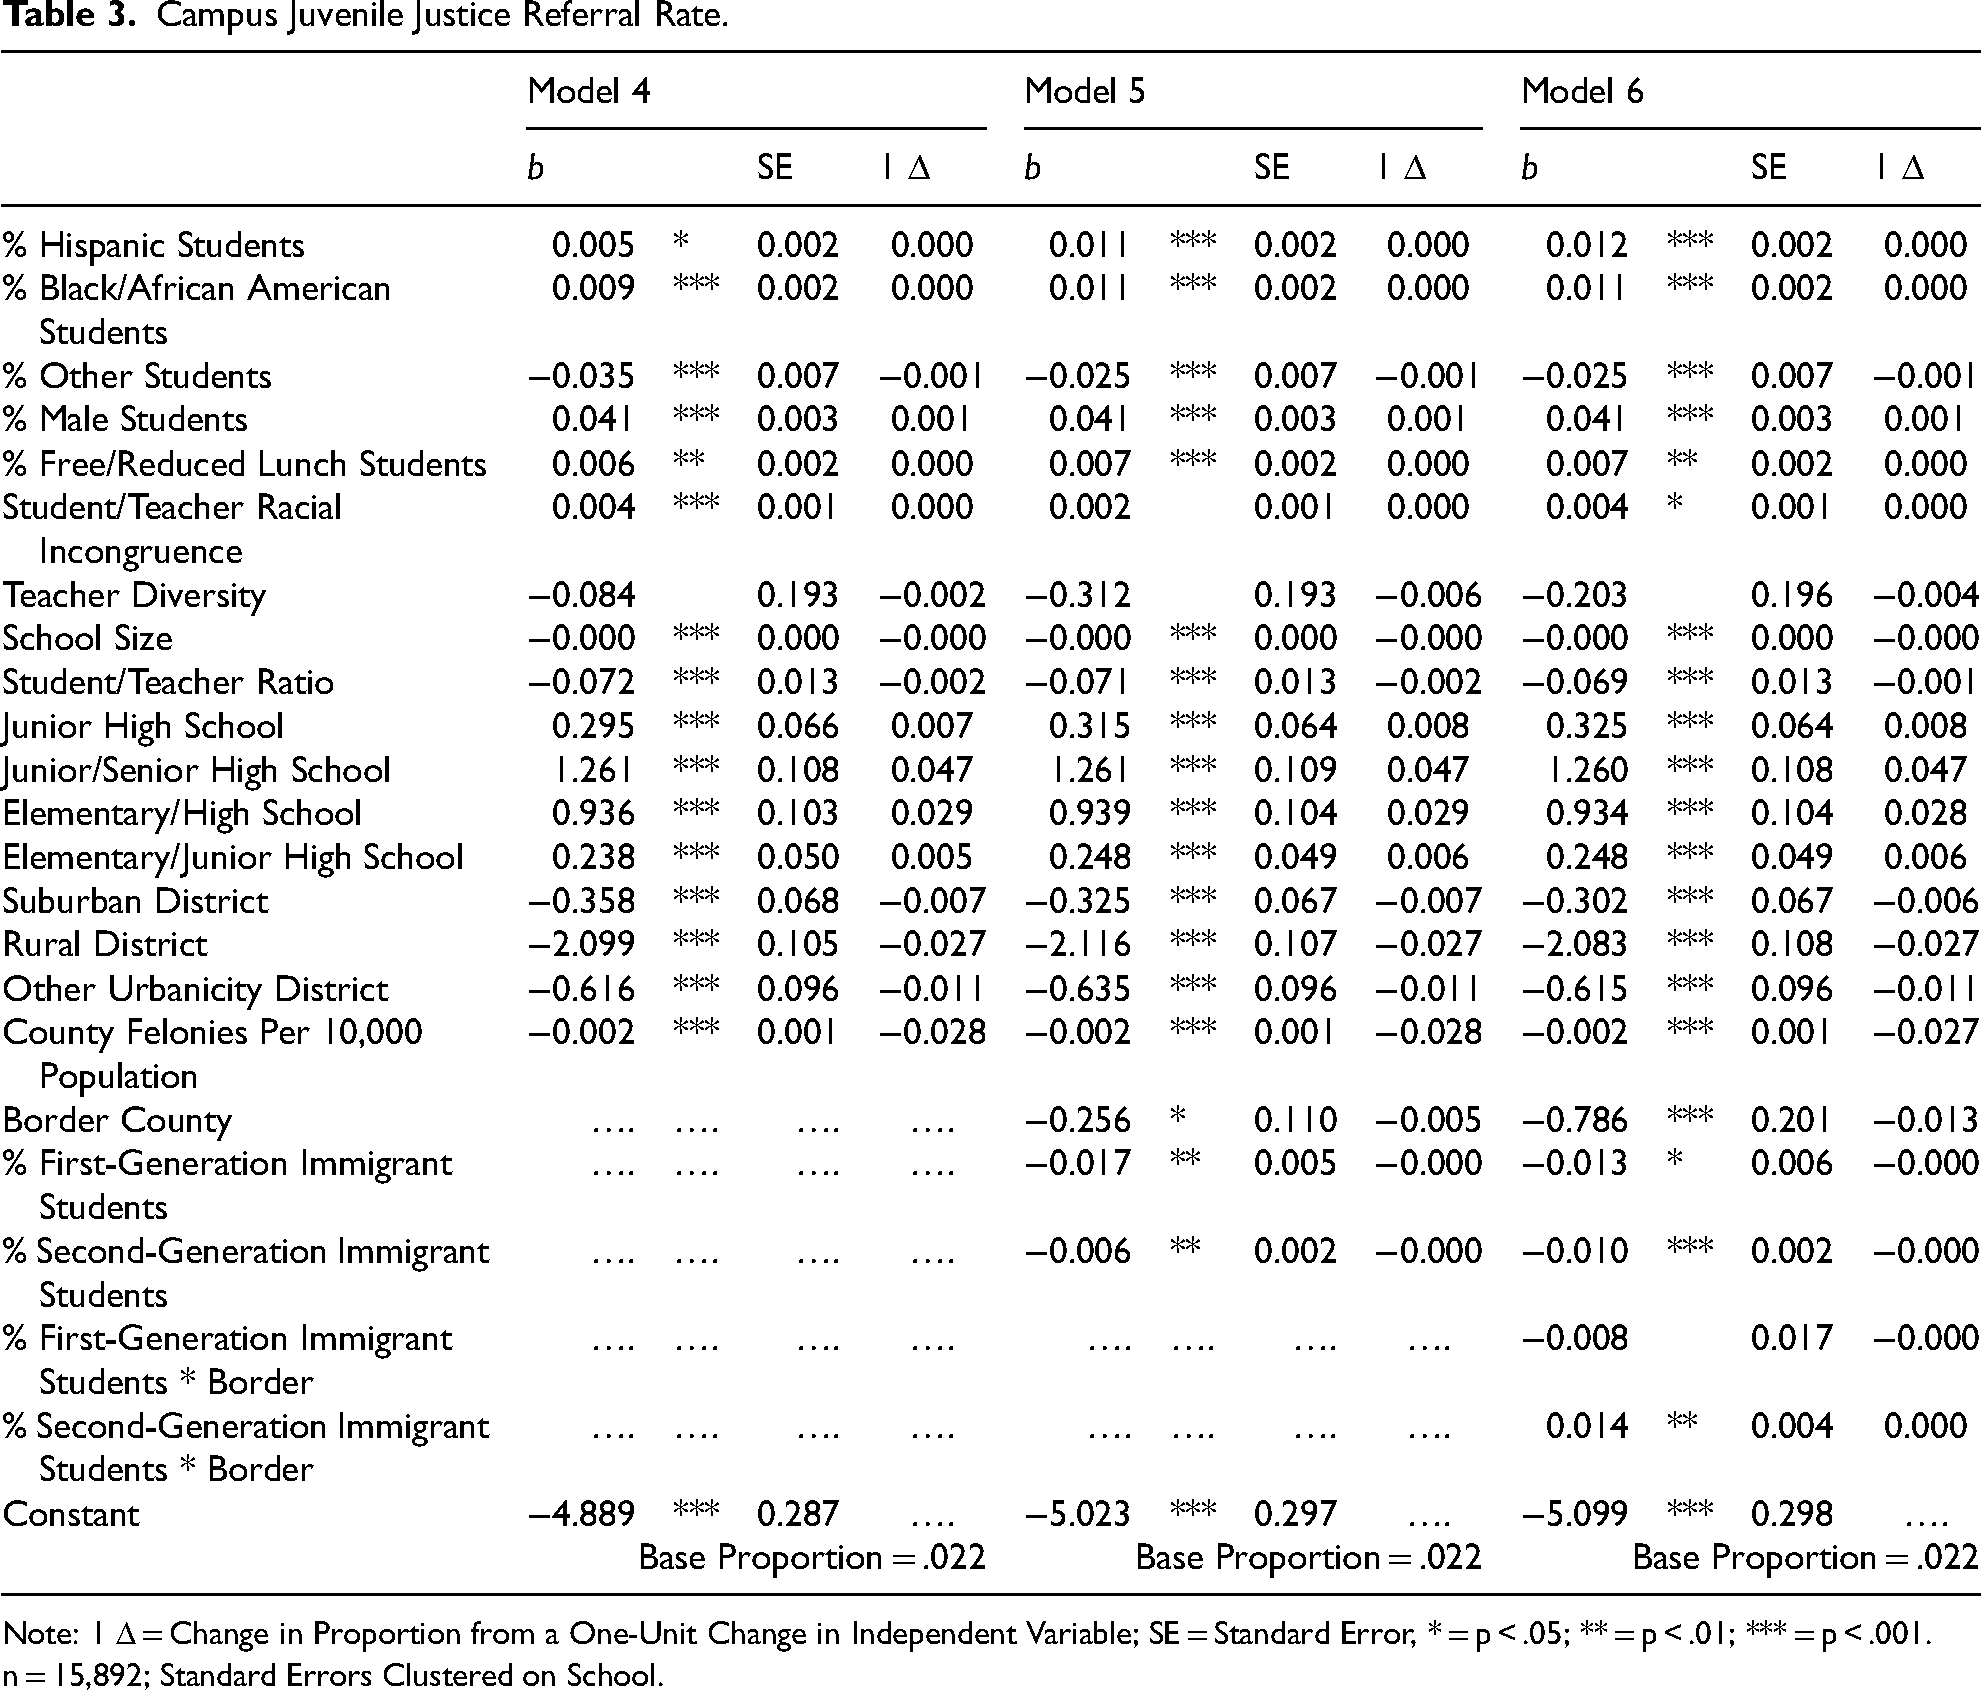
Note: 1 Δ = Change in Proportion from a One-Unit Change in Independent Variable; SE = Standard Error, * = p < .05; ** = p < .01; *** = p < .001.
n = 15,892; Standard Errors Clustered on School.
We began with 23,731 school/years. Schools with fewer than 10 students from our cohorts present in the year are eliminated from the analyses to prevent small numbers of students from skewing the results. These schools normally are the result of children who are either held back or are advanced beyond their scheduled year. As such, very few cohort members are in school with them. In total, 7,653 student/years fall into this category. An additional seven school/years are eliminated due to TEA reporting that less than 10 students are attending the school that year. Finally, 13 school/years where every student in the school has juvenile justice contact in the year are removed. These schools were exclusively disciplinary alternative education facilities. Of the remaining 16,058, 166 student/years were missing data included in the models. Because this amount made up less than 1 percent of the sample and the data are agency data, we utilized listwise deletion. Worth noting, when multiple imputation was utilized, no appreciable change was found in the results.
Findings
Table 1 presents descriptive values of all variables used in the analyses. On average, 25 percent of the students are being disciplined across Texas schools. As for juvenile justice referrals, approximately 4 percent of the students are being referred across Texas schools. Also, approximately 12 percent of the schools are located near the U.S.-Mexico border. It is also evident that on average 3.6 percent of students are first-generation immigrants and 20.4 percent are second-generation immigrants across Texas schools. As for race/ethnicity, 43.9 percent are Hispanic, 12.7 percent are non-Hispanic Black/African American, and 3.2 percent are identified as other race/ethnicity. Because this study focuses on exploring the significance of the border in the relationship between immigration and rates of school discipline and juvenile justice referrals, Table 1 presents the descriptive statistics for border and non-border Texas schools, with 1,890 border school/years and 14,002 non-border schools using basic t-tests. Although there are no significant distinctions in school discipline and juvenile justice referral rates between border and non-border Texas schools, the proportion of first- and second-generation immigrant students, as well as the proportion of Hispanic students, are greater in border schools than non-border schools across Texas as expected given their proximity to Mexico. Another notable difference between border and non-border schools is school poverty as measured by the percentage of students provided free/reduced lunch. Nearly 80 percent of the students in border schools qualify for free/reduced lunch while only 53.6 percent of the students in non-border schools qualify for free-reduced lunch. These findings are not surprising given the large concentrations of poverty in communities along the U.S.-Mexico border (Lee et al. 2013).
Discipline Rates
Table 2 presents the results examining the relationship between school discipline rates and race/ethnicity, relevant school factors, and school immigrant student composition. In addition to basic coefficients, standard errors and markers of statistical significance, a column is added to indicate the effect of a one-unit change in the independent variable on the expected proportion of discipline rates at a school. Due to the non-linear nature of GLM with a logistic link function, traditional coefficients provide a measure of the directional relationship, but not an immediate summary of the magnitude of the relationship. The one-unit change presented is based upon holding all other variables in the model at their mean in keeping with recommendations by Long (1997). However, a one-unit change can understate its true effect at first glance. For continuous independent variables, a one-unit change may not be substantive—for instance, the percent of the students at a school who are second-generation immigrants ranges from 0 percent to 100 percent with a standard deviation of 20.2. A one-unit change in this case is small relative to the normal variation. Conversely, the number of felonies per 10,000 population in a county range from 0.001 to 0.04, making a one-unit change implausibly large. Finally, one must consider how large a one-unit change is in relation to the base proportion for school discipline, in this case 0.237. While an effect of 0.024 appears small, it is over 10 percent of the base proportion. This last distinction is especially important when looking at juvenile justice referral rates whose base proportion is 0.022, which is much smaller.
A significant relationship between race/ethnicity composition and discipline rates at school is evident in Model 1. The findings reveal that the percentages of Hispanic and other racial/ethnic minority students are negatively associated with discipline rates (β = −0.006, p ≤ .001 and β = −0.021, p ≤ .001) while controlling for other variables. For instance, a one-unit change in the percentage of Hispanic and other race/ethnicity students results in substantial reductions in the proportion of discipline events, −0.06 and −0.04, respectively, among students at a school. Conversely, the percentage of non-Hispanic Black/African American students is positively associated with discipline rates (β = 0.005, p ≤ .001) while controlling for other variables. The percentage of male students is also related to higher levels of discipline (β = 0.021, p ≤ .001). Therefore, the percentages of non-Hispanic Black/African American (0.03) and male students (0.08) have noteworthy increases in the expected proportion of students experiencing school discipline.
Regarding control variables in Model 1, the percentage of free/reduced lunch (β = 0.013, p ≤ .001), which is used as a proxy for school poverty, the faculty looking different from their students, (β = 0.004, p ≤ .001), faculty diversity (β = 0.412, p ≤ .001), and school size (β = 0.000, p ≤ .001) are all positively associated with school discipline rates. The student/teacher ratio, on the other hand, is negatively associated with school discipline rates (β = −0.052, p ≤ .001). The type of school is also significantly related to school discipline rates. Compared to pure high schools, the schools classified as junior high schools (β = 0.613, p ≤ .001), junior/senior high schools (β = 0.241, p ≤ .001) and elementary/junior high schools (β = 0.439, p ≤ .001) are all associated with higher school discipline rates. Schools that combine elementary, junior, and high school grades have lower school discipline rates compared to pure high schools (β = −0.114, p ≤ .05). Location also plays a role in discipline rate disparities. Schools in rural districts (β = −0.414, p ≤ .001) have lower school discipline rates in comparison to those in urban districts. Counties with felonies per 10,000 population see lower school discipline rates (β = −0.001, p ≤ .01). In general, these associations between the control variables and school discipline rates are similar across Models 2 and 3.
Model 2 examines the border status of school location and the percentages of first- and second-generation immigrant students. Discipline rates in schools located in border counties are not statistically different than those schools in non-border counties. The percentages of first-generation (β = −0.008, p ≤ .01) or second-generation (β = −0.004, p ≤ .001) immigrant students are negatively associated with discipline rates. For instance, a one-unit increase in the percentage of the school made up of first- or second-generation immigrants leads to a reduction in a school's expected discipline rate by 0.014 and 0.028, respectively. Because the base proportion is 0.237, these decreases are substantive. Consistent with the findings in Model 1, the relationship between the racial and gender compositions of schools and their discipline rates remains consistent. The relationships between the control variables and discipline rates also stay consistent across the two models, except for suburban school districts, which now have a significant relationship (β = 0.065, p ≤ .05).
In Model 3, the interaction of schools’ border status and immigrant student percentage is considered. The findings reveal that schools along the border (β = −0.208, p ≤ .05) are negatively associated with discipline rates and therefore, schools along the border are associated with a 0.036 reduction in a school's expected discipline rate. Consistent with Model 2, the percentage of students who are first-generation (β = −0.008, p ≤ .01) or second-generation immigrant students (β = −0.005, p ≤ .001) are associated with lower proportions of school discipline. When looking at the interactions, however, we find that the results between immigrants and school discipline only apply to non-border schools. Looking at the interaction term for first-generation immigrant students and border status, it is found to be insignificant. A Wald test looking at the joint significance of first-generation immigrant students and its interaction with border also shows no significance. While the interaction term for second-generation immigrant students and border status is significant (β = 0.004, p ≤ .001), this effect is essentially eliminated in the model and a Wald test confirms that the effect is statistically removed. In other words, for schools on the border, there is no statistical relationship between the percentage of immigrants (first- or second-generation) and the expected proportion of school discipline at a school. However, a one standard deviation increase in the percentage of first-generation immigrant students at a non-border school results in a decrease of 0.02 in the expected proportion of disciplined. On the other hand, a one standard deviation increase in second-generation immigrant students is linked to a 0.04 reduction in the proportion of school discipline at a non-border school. Looking at the race/ethnicity and control variables in Model 3, the variables maintain consistent relationships with school discipline rates as shown in Model 2.
Juvenile Justice Referrals
Table 3 highlights the findings predicting the proportion of students at a school who receive a juvenile justice referral in any given year. Model 4 focuses on racial/ethnic composition with control variables considered. The percentages of Hispanic (β = 0.005, p ≤ .05), non-Hispanic Black/African American (β = 0.009, p ≤ .001), and male (β = 0.041, p ≤ .001) students are positively associated with juvenile justice rates while the percentage of other race/ethnicity students is negatively associated with levels of juvenile justice contact (β = −0.035, p ≤ .001). In terms of a standard deviation change in these percentages, we see a change of 0.006, 0.007, and 0.007 in the school juvenile justice referral rates associated with Hispanic, non-Hispanic Black/African American, and other race/ethnicity students, respectively. There was also a much larger increase of 0.018 in the school juvenile justice referral rate associated with a one standard deviation increase in the percentage of students who are male. While each of these effects appear small, these effects quite sizable with a base proportion of only 0.022 and nearly doubling the expected proportion for a one standard deviation increase in the percentage of male students.
The control variables in Model 4 show that higher levels of poverty (β = 0.006, p ≤ .01) and an incongruence between the student and faculty race/ethnicity (β = 0.004, p ≤ .001), are associated with higher juvenile justice rates, while school size (β = −0.000, p ≤ .001) and higher student/teacher ratios (β = −0.072, p ≤ .001) are associated with lower levels of juvenile justice contact. Compared to pure high schools, schools classified as junior high schools (β = 0.295, p ≤ .001), junior/senior high schools (β = 1.261, p ≤ .001), and elementary/high schools (β = 0.936, p ≤ .001) are linked to higher rates of juvenile justice contact. This is likely because students who are at least 17 are criminally an adult in Texas, which typically occurs during a student's junior year of high school. As a result, a substantial portion of high school students are ineligible for juvenile justice contact. Compared to urban schools, all other types have lower juvenile justice rates—rural districts see the largest effect (β = −2.099, p ≤ .001), followed by other urbanicity districts (β = −0.616, p ≤ .001) and suburban districts (β = −0.358, p ≤ .001). Counties with higher rates of felony cases filed per 10,000 population saw lower juvenile justice referral rates (β = −0.002, p ≤ .001). In general, these associations between control variables and school discipline rates are similar across Models 5 and 6.
Model 5 depicts findings that include border status and the percentages of first- and second-generation immigrant students. Border schools (β = −0.256, p ≤ .05) are associated with lower juvenile justice referral rates as are the percentages of first-generation (β = −0.017, p ≤ .01) and second-generation (β = −0.006, p ≤ .01) immigrant students. In terms of a substantive impact, border schools have expected juvenile justice referral proportions that are 0.005 lower, a 22 percent reduction of the 0.022 base proportion. Standard deviation increases in the percent of students that are first-generation or second-generation immigrants are associated with reductions in expected juvenile justice referral proportions of 0.004 and 0.005, respectively.
Model 6 includes the interaction terms between the percentage of first- and second-generation immigrant students and border status. Similar to the findings for school discipline shown in Model 3, border status remains protective although its effect on juvenile justice referral rates is greater (β = −0.786, p ≤ .001). Changing from a border to non-border school reduces the expected proportion of juvenile justice referral schools by 0.013. While the effect of first-generation immigrant students declines slightly (β = −0.013, p ≤ .05), the effect of second-generation immigrant students nearly doubles (β = −0.010, p ≤ .001). The interaction between border status and the percentage of first-generation students is not significant. When combined with the main effect, however, the Wald test of joint significance also indicates that there is no significant relationship between the percentage of first-generation immigrant students at a border school and predicted proportion of juvenile justice referrals. The protective nature of second-generation immigrant students at a border school is lower (β = 0.014, p ≤ .05) much like our findings for school discipline, but in this case, the reduction exceeds the main effect. When a joint Wald test is employed for schools on the border, however, the percentage of second-generation immigrant students has no relationship with juvenile justice referral rates. In summary, non-border schools see a 0.003 and 0.009 reduction in the proportion of students referred to the juvenile justice system for one standard deviation increase in the percentage of first- and second-generation immigrant students, respectively, while border schools see no relationship between immigrant students and juvenile justice referral rates.
Overall, place matters for school discipline and juvenile justice referral rates. In other words, we find that proximity to the U.S.-Mexico border matters. As shown in Tables 2 and 3, Texas schools located near the U.S.-Mexico border have lower juvenile justice and school discipline rates net other variables in comparison to other Texas schools. Border status leads to differences in school discipline and juvenile justice referral rates, but contrary to our first hypothesis, school discipline and juvenile justice referral rates are lower in Texas schools near the U.S.-Mexico border in comparison to other Texas schools. Findings also indicate that the percentage of immigrant students is only a factor in non-border schools, with the presence of both first- and second-generation students being linked to lower school discipline and juvenile justice rates. In border communities, however, we find a null relationship between immigrant students and school punishment and therefore, we find no support for our second hypothesis. We discuss these findings in more detail below, but it is evident that the immigration-crime link is a complex issue when we consider the significance of place, particularly along the U.S.-Mexico border.
Discussion and Conclusion
Earlier studies have shown that schools reflect the communities that they serve and therefore, school location is significant in terms of the disproportionate treatment and punishment of youth (Gottfredson 2001; Peguero and Bondy 2015; Shedd 2015). Because local law enforcement agencies at the border utilize strategies that emphasize control, punishment, and trauma as deterrents to migration, this increased social control and criminalization of immigrants can impact youths’ experiences associated with violence and treatment within their schools and communities (Durán 2018; Durán and Posadas 2016; Slack et al. 2017). Using a racial threat framework, this study set out to explore the relationship between immigration and school punishment by examining discipline and juvenile justice referral rates in Texas schools located near the U.S.-Mexico border in comparison to other Texas schools. Not only do these findings contribute to the literature on racial/ethnic inequalities and school punishment, but they also address a gap in the literature when it comes to examining the role of immigration in schools.
First, we examined the variability in school discipline and juvenile justice referral rates in Texas schools near the U.S.-Mexico border in comparison to other Texas schools. According to the racial threat perspective, we hypothesized that Texas schools located near the U.S.-Mexico border would have higher school discipline and juvenile justice referral rates than other Texas schools. Yet, counter to the racial threat perspective, our findings indicate that school discipline and juvenile justice referral rates are lower in Texas schools near the U.S.-Mexico border in comparison to other Texas schools after controlling for a variety of factors. Our findings also indicate that Texas schools located closer to the U.S.-Mexico border have a greater proportion of Hispanic students and students who qualify for free/reduced-price lunch. Therefore, school discipline and juvenile justice referral rates are lower in Texas schools closer to the U.S.-Mexico border, where Hispanic students account for a majority of the student population, in comparison to other Texas schools, where Hispanic students account for less than one-half of the student population, which suggests a curvilinear relationship. Some researchers examining the racial threat framework suggest the possibility of a curvilinear relationship whereby the minority population is positively associated to punitiveness until it surpasses the white population and then negatively associated to punitiveness (Hughes et al. 2017; Irwin et al. 2013; Welch and Payne 2010). At the same time, other studies suggest that schools located along the U.S.-Mexico border have personnel, who identify as Hispanic themselves and have a long history of working with both Hispanic, immigrant, and poor youth. Therefore, these school personnel may be better prepared to ameliorate educational inequities, social and cultural biases, and understand the root causes of violence that impacts these communities. For example, Durán and Posadas (2016) found a significant difference in punishment-oriented strategies between school personnel and law enforcement in border communities that resulted in divergent outcomes for youth when it comes to the criminalization and punishment of youth to create “safer” communities. More importantly, it is clear that local context, such as proximity to the U.S.-Mexico border, is significant when examining the racial threat perspective in school punishment.
Second, we examined whether the proportion of children of immigrants within a school moderate school discipline and juvenile justice referral rates in Texas schools near the U.S.-Mexico border in comparison to other Texas schools. According to the racial threat framework, a growing population of children of immigrants in schools would lead to increased school punishment rates. While we find that the proportion of immigrant students (either first- or second-generation) within a school leads to lower punishment rates in Texas schools, we find no relationship between the rise in the percentage of immigrant students and punishment, whether school discipline or juvenile justice referral, at the border. Non-border schools, on the other hand, are associated to lower rates of school punishment following an increase in the immigrant student population. These findings are consistent with research that indicates that immigrant populations, both young and old, are less likely to engage in crime and delinquency. Yet, segmented assimilation theory suggests that immigrant youth learn or assimilate deviant behavior in later generations, such as third-generation, because deviant behavior is arguably more normative and expected in the U.S. (Ousey and Kubrin 2009, 2018; Peguero et al. 2021; Sampson 2008; Portes and Rumbaut 2014). While our study includes measures for first- and second-generation immigrant students, other studies that find Hispanic youth are associated with more punitive responses in school may be capturing some of the later generations of Hispanic immigrants (e.g., third-generation) in school. It is essential to capture the nuanced experiences of different generations of immigrant youth to understand the relationship between immigration and school punishment.
Overall, the findings generated from this analysis highlight the relationship between immigration, border, and school punishment. Evidence suggests the immigrant-criminal myth—despite being debunked—has entered local schools. More stringent school punishment practices have disproportionately punished students of color (Peguero 2011; Peguero and Bondy 2015; Peguero et al. 2018; Welch and Payne 2010). Because the U.S.-Mexico border is painted as a violent and crime-ridden place, the public and the criminal justice system respond to such a narrative by increasing social control along the border. The role of the U.S.-Mexico border thus becomes significant in exploring disparities in punishment rates (Peguero et al. 2018; Skiba et al. 2011). The results from this study, however, support a curvilinear approach when examining school punishment in different contexts, such as schools along the U.S.-Mexico border. This finding also highlights the importance of considering the local context, such as the U.S.-Mexico border region, in understanding immigrant threat in different schools. The current literature on threat and school punishment places much emphasis on racial/ethnic threat, but little is known about the relationship between immigration and school punishment. Given the immigration-crime link and the growing perception of the U.S.-Mexico border as dangerous and crime-ridden place, it is essential that we pay more attention to the significance of the border as a place or a situational context. This study illuminates that research on threat and school punishment should develop a better understanding of how immigration within certain places may differentially impact outcomes of school punishment.
Policy Implications
The findings from this study have important implications for criminal justice, school safety, and immigration policies. While racial threat and school punishment research focuses on the link between increases in the number of students of color, specifically non-Hispanic Black/African Americans, and exclusionary disciplinary policies, it is important to examine the association between immigration and school punishment given the local context. For example, the criminalization and punishment of immigrants across the U.S., particularly in areas surrounding the U.S.-Mexico border, influences how immigrant children and their families are perceived by members of their local community. Yet, there is limited research on the immigrant population in relation to school punishment despite the inequities they face and the treatment by local law enforcement agencies in some communities. Punitive school policies may cause more harm to students by marginalizing and derailing them from making educational progress, having positive school experiences, and impacting their overall well-being. Rather than serving as a deterrent factor, these punitive measures can place students on the school-to-prison pipeline, which already affects a disproportionate number of youth of color, and places youth in institutions that foster criminal behavior (Hughes et al. 2017; Peguero et al. 2018; Rios 2011, 2017). In order to implement school safety policies that do not negatively impact students of color and immigrant youth, educational institutions and their communities need to engage in a discussion with students of color, the children of immigrants, and their families. Schools need to focus on developing school safety policies that meet the needs of their students, parents, and local community members and steer clear of overly punitive school policies, such as zero-tolerance policies, which are ineffective, problematic, and discriminatory. Moreover, our study contributes to the literature on “immigrant threat” and the policy implications in local institutions such as educational settings. Specifically, it helps to create a better understanding on how perceived threat differentially impacts students in different places when considering the local context.
Limitations and Future Research
Future research may use several limitations of the current study to advance the research in new directions. First and foremost, we need to consider contextualizing how we utilize racial threat within schools in understanding the relationship between immigration and school punishment. While previous studies have shown that racial threat framework can predict rates of punishment and criminal justice contact within schools that have increasing populations of racial/ethnic minority students (Hughes et al. 2017; Irwin et al. 2013; Welch and Payne 2010), we find that context and place matter when drawing from this framework to understand and predict the punishment of immigrant students. Thus, there may be other informal mechanisms of control that can be used to examine the association between increasing immigrant student populations and school punishment in different places. This conceptual nuance warrants further investigation because the increasing population of racial/ethnic minority students in U.S. schools is primarily being driven by immigration patterns (Peguero and Bondy 2020; Peguero et al. 2021). As schools in other parts of the country, particularly new immigrant destinations, began to experience significant changes to their student population following immigration patterns, it is important to examine whether these schools are prepared to address the challenges associated with educational inequality and biased treatment to help reduce the criminalization and punishment of students of color (Durán 2018; Durán and Posadas 2016; Valenzuela 2010).
Second, research should closely examine how immigrant groups from different pan-ethnic categories influence the relationship between immigration, place, and punishment. Much variation exists within these groups in terms of country of origin (e.g., Mexico), generation (e.g., first-generation), documentation status (e.g., unauthorized), socio-economic status, and skin tone which can differentially shape school experiences (Chou and Feagin 2008; Feliciano 2009; Feliciano and Lanuza 2017). There is also significant variation in immigrant experiences across place. Like Texas, three other states – California, Florida, and New York – have more than 4 million immigrants each. In contrast to Texas, some of the local law enforcement practices in these states vary with some local communities helping federal immigration enforcement efforts while other communities threaten to impede these efforts (Martinez-Schuldt and Martinez 2021). While some of these communities enacted policies that contributed to a historical pattern of punishing immigrants, other communities have enacted policies that sought to help integrate immigrants into their communities. It is essential to understand the history and diversity of immigrant groups and their experiences to understand how punishment is associated to these groups and how this is tied to different places given the local context such as communities along the U.S.-Mexico border.
Third, the intersectionality of race and gender affects school punishment patterns. Research demonstrates that Black/African American and Hispanic boys are disproportionately impacted by criminalization, zero-tolerance policies, and over-policing in schools (Kupchik 2010, 2016; Rios 2011, 2017). At the same time, other studies show that Black/African American and Hispanic girls also experience disproportionate punishment and surveillance in relation to their White peers (Bettie 2014; Crenshaw et al. 2015; Morris 2016). For example, Black/African American and Hispanic girls are more likely than White girls to be sanctioned for disciplinary infractions, such as dress code violations, be labeled as “loud” or “defiant,” and be suspended or expelled from school (Bettie 2014; Crenshaw et al. 2015; Morris 2016). Because non-Hispanic Black/African American boys and girls experience the school-to-prison pipeline differently, future research should consider the intersections of race/ethnicity, gender, immigrant generation, ESL status, and SES in relation to school punishments while also considering the role of place in these relationships.
Conclusion
In summary, our study makes an important contribution to the racial threat framework in schools following the increasing immigrant student population in different places. Our findings are consistent with other research that indicates immigrant populations are less likely to engage in crime and delinquency and, more importantly, highlights the importance of place by examining the relationship between immigration and school punishment in Texas schools based on their proximity to the U.S.-Mexico border. While we find no relationship between the rise in the percentage of immigrant students and punishment in Texas schools located near the border and a negative relationship in Texas schools far from the border, this relationship deserves continued and urgent attention given the widespread narrative of immigration and crime. Although there is evidence that some institutions and communities may be more receptive and responsive to the needs of immigrant groups, immigrant students may be disproportionately punished in other U.S. schools because of the perception and belief that the U.S.–Mexico border is a place where “immigrant criminals” are entering ( DiPietro 1956; Peguero 2011; Peguero and Bondy 2015). Furthermore, the rapidly growing immigrant population warrants our attention to immigrant students’ experiences in schools, especially during a time when the immigrant-criminal myth is ubiquitous and blatant. Thus, it is important to consider the impact it has on immigrant students’ experiences and whether youth are being disproportionally punished following changes to school and immigration policies.
Footnotes
Acknowledgments
Gratitude is extended for the helpful comments and constructive suggestions from the editor and blind reviewers throughout the development of this research manuscript. Portions of this project were supported by Grant # (2016-CK-BX-0015) awarded by the National Institute of Justice, Office of Justice Programs, United States Department of Justice. The research presented here utilizes confidential data from the State of Texas supplied by the Texas Education Research Center at The University of Texas at Austin. The authors gratefully acknowledge the use of these data. The opinions, findings, and conclusions or recommendations expressed in this publication/program/exhibition are those of the authors and do not necessarily reflect those of the Department of Justice and are not endorsed by the Texas Education Agency, the Texas Higher Education Coordinating Board, or the State of Texas.
Declaration of Conflicting Interests
The author(s) declared no potential conflicts of interest with respect to the research, authorship, and/or publication of this article.
Funding
The author(s) disclosed receipt of the following financial support for the research, authorship, and/or publication of this article: This work was supported by the National Institute of Justice, (grant number 2016-CK-BX-0015).