
Abstract
A persistent concern in music performance assessments is the quality of ratings assigned by judges. Differences in rater judgment are most concerning in cases when student performances are scored by different raters (i.e., disconnected rating designs)—bringing into question the comparability of scores between raters and students. We used data from a formal solo music performance assessment to demonstrate and explore the impact of different data collection designs and a statistical adjustment procedure on the estimates and rank-ordering of student performances. Our results indicated notable discrepancies in conclusions about individual student performances between conditions where all raters scored all students, designs with no common performances between raters, designs that included overlapping performances between raters, and the results from a post hoc adjustment procedure for disconnected designs. We discuss the implications of our results for the design and interpretation of music performance assessments.
Formal music performance assessments are a central component of the secondary-level school music experience. These assessments come in the form of many types of events in a student’s musical career, including but not limited to large ensemble performance evaluations, solo and ensemble evaluations, all-state auditions, or organized festival auditions, for example. In this study, a formal music performance assessment is defined as a structured evaluation where participants, such as soloists or ensembles, perform for a panel of qualified adjudicators who systematically assess their performances based on predefined criteria (Boyle & Radocy, 1987; Johnson & Johnson, 2002). Research suggests that student involvement in formal music performance assessments may lead to improved student motivation, increased self-confidence, and higher developed musicianship skills (Austin, 1988; Banister, 1992; Franklin, 1979; K. K. Howard, 1994; Hurst, 1994; Sweeney, 1998). Yearly repertoire selections and supporting curricular content are commonly tailored and prepared specifically for these assessments (Crochet, 2006), and the outcomes often serve as a foundation for setting classroom performance objectives and long-term goals as well as the initiation of curricular reforms (Abeles et al., 1994; R. L. Howard, 2002).
Over 50 years ago, Colwell (1970) highlighted the significance of feedback from judges during these formal performance assessments, suggesting they “can be the most meaningful evaluation of performance the student receives” (p. 105). Colwell’s observation remains relevant today: Both music educators and their students often measure student achievements and program success, in part, by the outcomes of these adjudicated events (Moura et al., 2024; Sivill, 2004). Furthermore, the finalized scores and subsequent student and/or ensemble rankings can significantly influence community and administrative perceptions of teacher effectiveness and overall quality of the music program (Boyle, 1992; Burnsed et al., 1985). Kirchhoff (1988) specifically emphasized the significance of these events, stating that formal music performance assessments have become a primary tool for administrators to gauge the effectiveness of instrumental music programs. He suggested that these events have become the means of assessment most often used by administrators to evaluate the effectiveness of an instrumental music program. In some school districts the rating achieved . . . is used by administration and by the community as a barometer of their educational success or failure. (p. 274)
More recent examinations into music performance evaluations highlight important challenges and concerns with the validity of formal music performance assessments, including lack of objective grounding (Giombini, 2025), limitations to assessing artistry (Allsup, 2016; Hash & McCart, 2024), and treatment of raw scoring procedures (Wesolowski, 2018). In consideration of these viewpoints and the overall importance of formal music performance assessments to students, educators, schools, communities, and related stakeholders, there is a continued need to examine assessment practices and how their intricacies may affect the overall validity, reliability, and fairness outcomes and related unintended consequences (American Educational Research Association [AERA] et al., 2014).
Psychometric Considerations of Rater-Mediated Assessment Systems
Formal music performance assessments are rooted in rater-mediated assessment systems (Wesolowski & Wind, 2019). Rater-mediated assessments are defined as “assessments in which raters evaluate test-taker performances and use rating scale categories to describe the level of performance on one or more domains” (Engelhard & Wind, 2019, p. 475). A prominent challenge in these systems is overcoming variability in human judgment, which can directly affect the validity, reliability, and fairness of the assessment process (Wang & Engelhard, 2019). In particular, human judgment is a common source of construct-irrelevant variability (Messick, 1995). The presence of construct-irrelevant variability, or variation in scores not attributed to the construct being measured, can complicate interpretations of (a) the measurement instrument itself (i.e., construct validity), (b) the observed scores (i.e., predictive validity), and (c) the overall extent to which the observed scores accurately reflect the true performance of students (i.e., internal validity; Linacre, 2004; Messick, 1989). An important source of construct-irrelevant variability to be considered is the use of raters’ raw, observed scores in a rater-mediated assessment system. In these instances, the outcomes are more often attributable to the characteristics of the raters than the achievement of the students (Wind, 2018). When construct-irrelevant variability is prominent in high-stakes assessment systems, the consequences may include threats to validity, decreased reliability, inequity, misclassification of students, and inflated/deflated outcome scores (AERA et al., 2014; Haladyna & Downing, 2004; Zumbo, 2007). In the context of music assessment systems specifically, the presence of construct-irrelevant variability has been shown to contribute to biases based on instrument (Wesolowski, 2019a), grade level (Wesolowski et al., 2015), and deflated outcome scores over time (Wesolowski et al., 2018; Wind & Wesolowski, 2018), for example.
A fruitful method for overcoming the effect of construct-irrelevant variability in a rater-mediated music performance assessment system is the incorporation of modern measurement models. Item response theory models describe raw, observed scores as a function of latent, unobservable traits (Wesolowski, 2019b). One particular model, the many-facet Rasch model (MFRM), allows for the simultaneous and independent estimation of student achievement, item difficulty, and rater severity (Linacre, 1989, 1994), making it a suitable choice in the context of rater-mediated assessments. The benefit of using the Rasch family of models broadly and the MFRM specifically is that they are rooted in invariant measurement (Engelhard, 2013; Engelhard & Wind, 2018). “Invariant measurement” refers to the concept that measurement results should remain stable across different groups, conditions, or contexts, ensuring that the interpretations of scores are independent of the specific sample of students or items used. In the context of rater-mediated assessments specifically, invariant measurement is characterized by adherence to five requirements: (a) rater-invariant measurement of student achievement (i.e., the measurement of student achievement must be independent of the particular raters that happen to be used), (b) noncrossing student achievement response functions (i.e., a higher achieving student must always have a better chance of obtaining higher ratings from raters than a lesser achieving student), (c) person-invariant calibration of raters (i.e., the calibration of the raters must be independent of the particular students used for calibration), (d) noncrossing rater response functions (i.e., any student must have a better chance of obtaining a higher rating from lenient raters than from more severe raters), and (e) unidimensional mapping (i.e., student achievement and rater severity must be simultaneously located on a single, unidimensional underlying latent variable). When the data adequately fit the requirements of the Rasch model, invariant measurement is possible (Engelhard, 2013; Wind, 2018). In the field of music, the MFRM has been deployed to help detect and control for rater effects in several targeted contexts, including rater errors (Wesolowski et al., 2016a), precision related to rating scale category use (Wesolowski et al., 2016b), systematic bias related to students’ grade level and performing instrument (Wesolowski, 2019a; Wesolowski et al., 2015), and raters’ cognitive attributes (Wesolowski, 2017, 2019a), for example.
Rater Connectedness
An important factor in the MFRM’s ability to identify and reduce construct-irrelevant variability by controlling for rater effects in rater-mediated performance assessments is the design of the data collection process. Specifically, adjustments for rater effects require individual raters to be sufficiently connected with one another through common observations (i.e., student performances; Wind et al., 2016). Figure 1 illustrates different levels of rater connectedness using an example of a music performance assessment with 30 student performances and three raters. Complete designs, in which all raters (e.g., adjudicators) score all student performances (see Figure 1a), are not practical in most music performance assessment settings. For example, in large states, such as Texas, over 70,000 high school students audition for All-State across multiple designated regions where different sets of raters are assigned to varying audition sites (Texas Music Educators Association [TMEA], 2025). In these instances, facilitators of formal performance assessments commonly rely on disconnected designs, where raters do not score performances in common with other raters (see Figure 1b). Disconnected designs occur when raters score unique subsets of student performances that do not overlap with other raters in the assessment system. Unless post hoc statistical adjustments are applied to such designs, it is not possible to statistically separate differences in rater severity from differences in student performance achievement levels, preventing meaningful comparisons between raters and students in performance assessments.
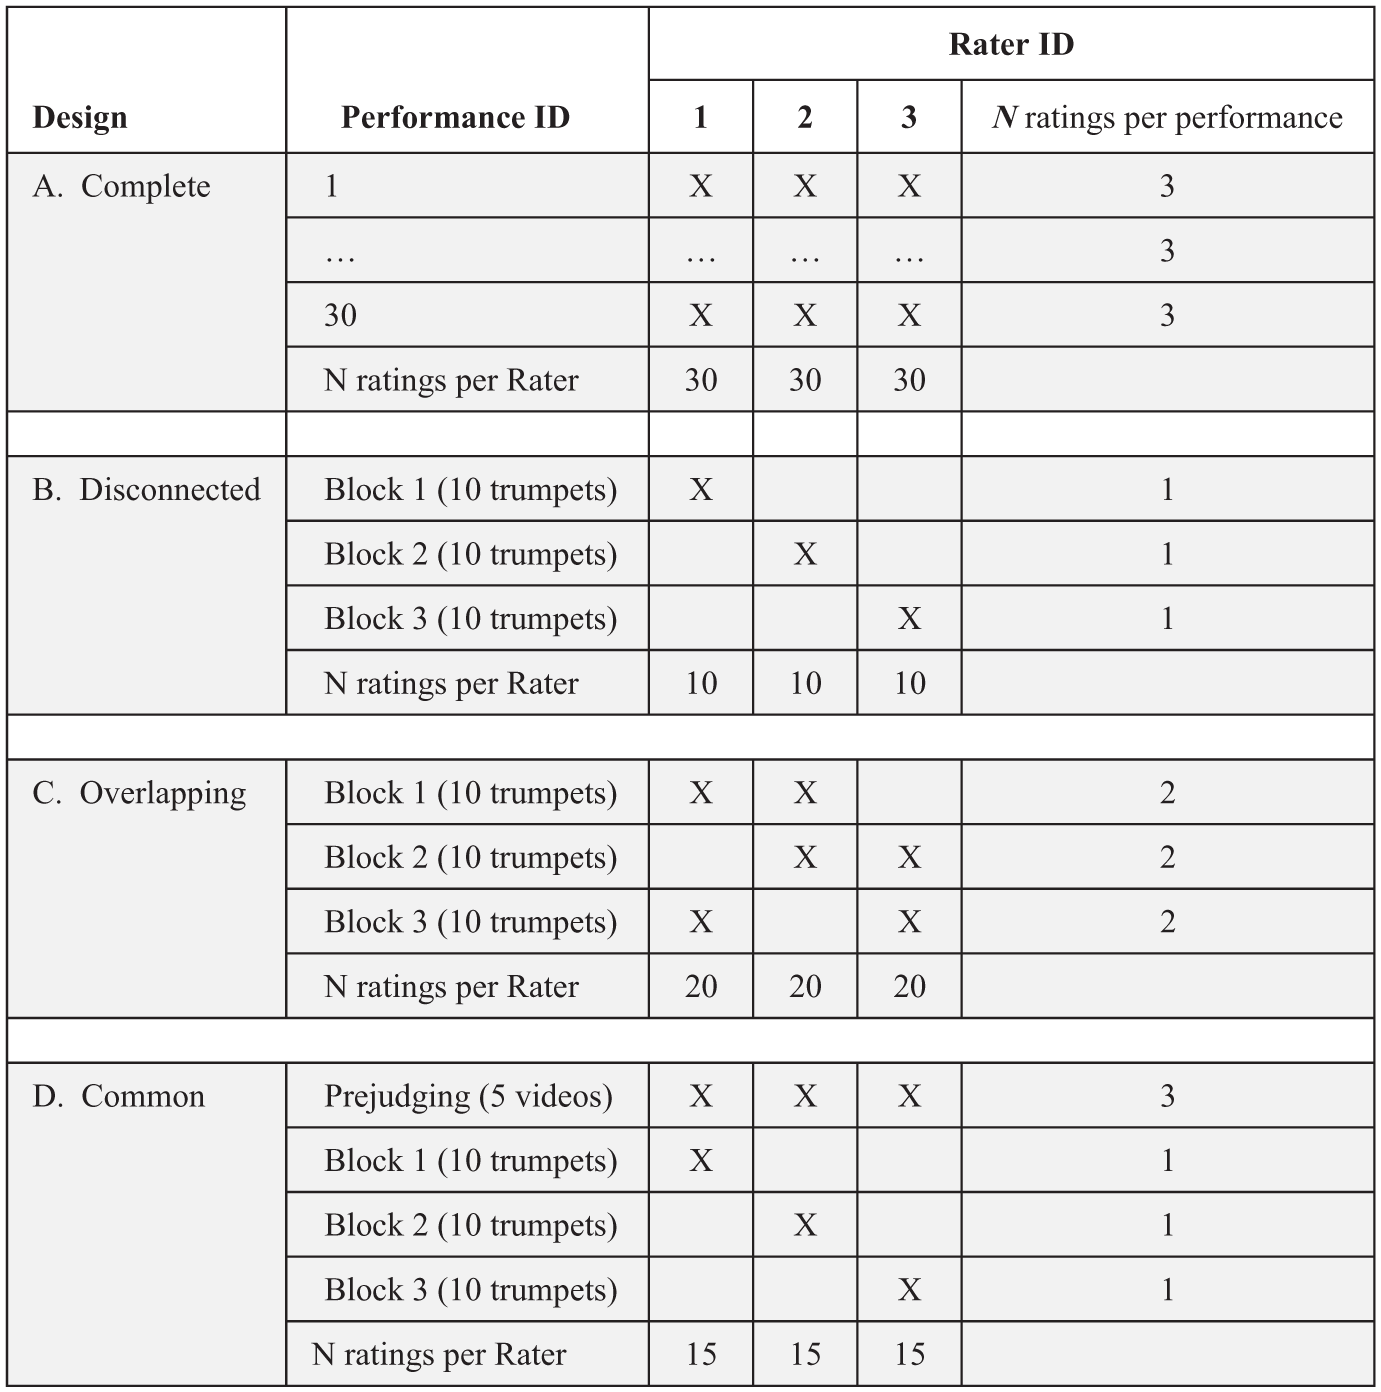
Illustrations of rating designs applied to formal performance assessment rating.
Recognizing the importance of connections between raters, researchers have identified several incomplete data collection designs that facilitate meaningful adjustments through methods such as the MFRM. For example, raters can score performances in common with other individual raters (see Figure 1c) in an overlapping performance design, all raters can score a common group of performances (i.e., an “anchor set”; see Figure 1c), a common rater can score all performances while the other raters are disconnected, or the design may include both common performances and common raters. When acceptable measurement properties are observed (i.e., adequate data-to-model fit for raters, students, and items), these incomplete but connected designs facilitate meaningful adjustments for differences in rater severity as part of the estimation process (Wind & Stager, 2019).
Linacre (2020) proposed group anchoring as a post hoc statistical adjustment technique to improve comparability in disconnected designs using the MFRM. Group anchoring is a post hoc analytic method that researchers can use when it is not possible to establish connections between raters during data collection. This method is essentially an equating technique (Angoff, 1971), but rather than adjusting for differences in item difficulty across different test forms, the focus is on maintaining a stable measurement framework by setting specific item parameters to fixed values (Kolen & Brennan, 2014). When applied to raters, group anchoring processes assume that raters have exchangeable severity levels across disconnected subsets. Researchers set the average severity level to a common value across raters and estimate student performance levels using a common rater severity level.
Although group anchoring is included in some software programs that implement the MFRM (e.g., Facets; Linacre, 2020) and is used in practice (Bonk & Ockey, 2003; Nakatsuhara et al., 2016; Zhang & Elder, 2014), there is limited research examining this technique from a methodological perspective. Only two studies (Sick, 2013; Wind & Stager, 2019) have specifically discussed the impact of group anchoring on measurement outcomes. Sick (2013) presented a practical guide to group anchoring for applied language assessment research and highlighted the importance of adequate sample sizes within disconnected subsets and taking into account prior information about the assessment context to inform group anchoring specifications. Specifically, Sick encouraged researchers to consider whether it would be defensible to assume approximately equal average rater severity levels between disconnected subsets before implementing group anchoring on the rater facet given background information about the assessment context. Wind and Stager (2019) used a simulation study to document the importance of ensuring acceptable measurement properties within disconnected subsets to obtain accurate results from group anchoring.
Given that rater connectedness and group anchoring methodologies are shown to affect student achievement estimates in applied language assessment research, the examination of its effect on student achievement in formal solo music performance assessments, a similar rater-mediated assessment context, is warranted. As highlighted earlier, the outcomes of formal music performance assessments greatly affect the local school music experience in several meaningful ways. Furthermore, the outcomes of formal performance assessments even more notably serve as a gateway for students to participate in important musical experiences, including All-State or other festival opportunities (Henry, 2015), collegiate programs with access to scholarships (Payne & Ward, 2020; Ward & Payne, 2018), or professional performing ensembles (Kegelaers et al., 2023), for example. When scores may determine placement, it is particularly important that the student achievement estimates and, even more importantly, the final ordering and ranking of students are rooted in strong validity, reliability, and fairness arguments with an eye toward reducing construct-irrelevant variability stemming from rater effects.
The purpose of this study is to examine the effect of rater connectedness on student achievement estimates and ordered rankings in the context of a formal solo music performance assessment. The following research questions guided this study: (1) To what extent do group anchoring analyses and different data collection designs result in similar conclusions about student achievement estimates in the context of a formal solo music performance assessment? and (2) To what extent do group anchoring analyses and different data collection designs impact the rank-ordering of student performances in the context of a formal solo music performance assessment?
Method
We used an analysis of high school solo music performance assessment data gleaned from a formal concert band festival audition to demonstrate the impact of disconnected subsets and group anchoring on student achievement estimates and related ordered rankings.
Measurement Instrument
The measurement instrument was a 30-item rubric consisting of rating scale categories ranging from two to four performance criteria (Wesolowski et al., 2017). The 30 items were embedded within eight domains: (a) technique (n = 2), (b) tone (n = 2), (c) articulation (n = 1), (d) intonation (n = 1), (e) visual (n = 11), (f) air support (n = 3), (g) melody (n = 4), and (h) expressive devices (n = 6).
Data Source
In the data collection design, 13 raters scored high school musical performances using a scoring rubric with 30 rating scale items and a four-category rating scale structure ranging from two to four performance criteria. All 13 raters scored all performances—reflecting a complete design (see Figure 1). The assessment context was an audition for a concert band festival ensemble. The raters were all active, state-level Music Education Association certified adjudicators. The data set included rater scores on performances that included five instrument types: (a) flute, (b) clarinet, (c) saxophone, (d) trumpet, and (e) trombone. To provide succinct and parsimonious results for this study, we chose to examine scores for the trumpet (n = 14) and trombone (n = 16) performances, with a total of N = 30 performances in our analysis. For the outcome of this particular auditioned event, there were a total of six available trumpet seats and four available trombone seats.
For our sample of performances, the original data collection design resulted in 390 unique observations of the musical performances on each of the 30 rating scale items, resulting in a total of 11,310 ratings. Although research is limited related to specific minimum sample size requirements for Rasch analyses, extant guidance suggests that samples of at least 30 participants are sufficient for interpreting Rasch model estimates (Azizan et al., 2020; Linacre, 1994). Accordingly, the sample size included in our analysis is sufficient for interpreting results from our analysis.
Modified Rating Designs
After analyzing the complete design where all 13 raters evaluated all musical performances, we removed observations from the original complete data to simulate five new assessment contexts of the data with different rating designs. First, we created a disconnected version of the data by constructing three disconnected subsets of students and raters between whom there were no common observations. The disconnected design was created to simulate a large state where different student performances are evaluated by different raters within county or district boundaries (Florida Bandmasters Association [FBA], 2017; TMEA, 2025). We created three unique subsets of raters and students. Each subset included either three or four raters and 10 unique students.
The remaining designs included varying rater connection design considerations between raters as prescribed by Wind et al. (2016). In the second version, two randomly selected raters scored each performance. In the third version, all of the raters scored three common performances. Fourth, we created a data set in which one common rater scored all performances and the remaining raters scored no performances in common with other raters. Finally, we created a data set in which all of the raters scored three common performances, one rater scored all of the performances, and the remaining performances were scored by only one rater.
Data Analysis
The first step in our data analysis procedure was to examine the performance assessment items for evidence of adequate psychometric properties using simple item analysis techniques. Specifically, we examined the mean and standard deviation of the ratings associated with each item to ensure that the items varied with respect to difficulty and variance. We also examined corrected item-total correlations (i.e., point-biserial correlations; rpbis) using the correlation between student scores on each item and their total score calculated with the remaining items; moderate and positive correlations provide basic evidence of internal consistency. Finally, we examined the proportion of ratings within each scale category for each item to ensure that raters used the full range of scores when evaluating the performances in our sample.
After verifying adequate item properties, we conducted measurement modeling analyses using a rating scale model (Andrich, 2018) formulation of the MFRM (RS-MFRM; Linacre, 1989) with facets for examinees, raters, and items:

where θ n is the location estimate (i.e., student achievement) for student performance n, λ r is the location estimate (i.e., rater severity) for rater r, δ i is the location estimate (i.e., item difficulty) for item i, and τ k is the location of the threshold between rating scale categories k and k – 1. We applied the MFRM using the test analysis modules (TAM) package for R (Robitzsch et al., 2020).
We analyzed the original data and each modified version of the data set using the RS-MFRM shown earlier. For the disconnected data, we applied the model without and with group anchoring on the rater parameter. When group anchoring is performed on the rater facet, the process involves three major steps. We describe these briefly here and refer readers to Linacre (2020) for additional details. First, the researcher analyzes the entire response matrix using the measurement model. The purpose of this step is to obtain threshold estimates (τ k ) for use in subsequent steps. Second, the model is applied separately to the responses within each disconnected subset (in our case, three separate subsets). In this step, the rating scale threshold parameters are fixed (i.e., “anchored”) to their values from the first analysis. From Step 2, the researcher saves subset-specific rater location estimates. These values should be scaled such that the mean is equal to zero within each subset. In Step 3, the researcher applies the measurement model to the entire response matrix as in Step 1 but with rating scale thresholds anchored to their values from Step 1 and the rater severity parameters anchored to their values from Step 2. The resulting student and location parameters have been adjusted for differences in rater severity between disconnected subsets. For the connected designs, we applied the RS-MFRM without any post hoc adjustments.
Model Results
After we applied the model to each data set, we focused on the following results for student performances, raters, and items: (a) location estimates and standard errors, (b) model-data fit statistics, and (c) reliability of separation statistics.
Location estimates
First, location estimates are the estimated values for each individual element within the student performance, rater, and item facets on the log-odds (“logit”) scale that reflects the music performance achievement construct. For ease in interpretation, we followed the conventional approach of scaling the logit values for these estimates such that the average rater and item location was equal to zero logits. Student locations (θ) reflect the level of achievement for individual students based on the assessment procedure. Assuming adequate connectivity in the data collection design and when there is acceptable model-data fit (discussed later), these values are adjusted for differences in rater severity and item difficulty. Higher values indicate higher levels of achievement, and lower values indicate lower levels of achievement. Rater locations (λ) indicate the overall severity level for individual raters. Higher rater locations indicate ratings that are more severe (i.e., the rater tends to give scores in the lower rating scale categories), and lower rater locations indicate ratings that are more lenient (i.e., the rater tends to give scores in the higher rating scale categories). Item locations on the logit scale (δ) reflect the difficulty associated with individual items in the music assessment rubric. Items with higher locations were more difficult (i.e., students tended to receive lower ratings), and items with lower locations were easier (i.e., students tended to receive higher ratings).
Model-data fit statistics
Second, we examined model-data fit statistics for each facet in our model. The purpose of this step was to evaluate whether the location estimates from the model were reasonable given the response patterns in our data. Evidence of acceptable model-data fit provides support for meaningful interpretation of the location estimates as indicators of student, rater, and item locations on the logit scale. In Rasch measurement applications, researchers typically examine two forms of fit statistics for each element: outfit statistics and infit statistics (Engelhard & Wang, 2020). These statistics are summaries of the residuals, or discrepancies between the observed data and model-expected responses, associated with each element. Using the mean square error form, outfit mean square error statistics are the average of the squared standardized residuals associated with an element. To minimize the influence of outliers, infit mean square error statistics are weighted averages of standardized residuals, where the average is weighted by the variance in the response vector for a given element.
In general, researchers agree that values of outfit and infit mean square error close to 1.00 indicate adequate fit to the Rasch model, with lower and higher values indicating less or more variation in observed responses than expected, respectively (Smith, 2004; Wu & Adams, 2013). Numerous critical values and analytic approaches appear in the Rasch measurement literature with which to classify outfit and infit mean square error statistics as evidence of fit and misfit (e.g., Bond et al., 2020; Engelhard & Wang, 2020; Wolfe, 2013). In our analysis, we interpreted these statistics as continuous variables with reference to the generally accepted value of 1.00 as evidence of acceptable fit.
Reliability of separation
Finally, we examined reliability of separation statistics (Rel) for each facet. These statistics provide evidence of the degree to which the individual elements of a facet (in our case, individual students, raters, and items) would be expected to maintain a consistent ordering over replications of the measurement procedure. These statistics have a theoretical range from 0 to 1, where values closer to 1 are interpreted as evidence of stronger reliability, assuming adequate model-data fit (Andrich, 1982).
Comparisons Between Designs
Using correlation analyses and rank-ordering comparisons, we compared results from each analysis to those from the original complete data. We interpreted the results with reference to the impact of the different data collection designs and group anchoring on estimates of student achievement based on the MFRM and the corresponding ranks derived from those estimates. We considered the results for the complete sample of student musicians and separately within instrument groups (trombones and trumpets). We examined visualizations of correlations and changes in rank ordering and effect sizes from nonparametric Wilcox signed-rank comparison tests to examine the practical impact of changes in ranks between rating designs and analytic approaches. To emphasize practical implications, we also examined the proportion of student musicians who were classified consistently based on rank cut-scores between the complete rating design and each of the modified rating designs or analytic approaches (Crocker & Algina, 1986). Using this approach, the proportion of consistent classifications could range from c = 0 if all student classifications changed to c = 1 if all student classifications remained consistent.
Results
The results are organized as follows. First, we summarize the results from our MFRM analysis of the original (complete) data from the music performance assessment. This analysis provides support for further exploration of the data using group anchoring and different data collection designs. Then, we present correlation results to demonstrate the impact of the group anchoring procedure and different data collection designs on student achievement estimates (Research Question 1). Finally, we examine the impact of the group anchoring procedure and different data collection designs on student rank-ordering based on achievement estimates (Research Question 2).
Basic Item Properties
Table S1 in the supplemental document included with the online version of this article provides basic item statistics for analytic sample of 30 performances using the original (complete) data collection design. These results indicate variation in item difficulty, with average ratings ranging from 2.11 ≤ M ≤ 3.85 across items, and evidence of variance in rater judgments for individual items, with standard deviation values ranging from 0.46 ≤ SD ≤ 1.10. There was evidence of internal consistency at the item level, with positive and moderate corrected item-total correlations for all items (.24 ≤ rpbis ≤ .71). Moreover, ratings were observed in all categories for all items. Together, these results suggest adequate basic psychometric properties that support further analysis of the item ratings using a measurement modeling approach.
MFRM Results for Complete Data
Table S2 in the supplemental document included with the online version of this article summarizes the overall results from the analysis as they relate to students, items, and raters. The average location estimate for student performances was notably higher (M = 1.83, SD = 0.64) compared to the average item location (M = 0.00, SD = 0.81) and rater location (M = 0.00, SD = 0.46). Standard errors for the location estimates were small, with average values ranging from 0.04 to 0.08 across the three facets. These results suggest that the students had generally high levels of achievement in this music performance assessment. Model-data fit results indicated overall acceptable fit to the MFRM, with average values of both outfit mean square error and infit mean square error near 1.00 for all three facets. Reliability of separation statistics were also high (Rel ≥ 0.98) for all three facets, suggesting a precise ordering of individual students, items, and raters on the linear scale that represents the construct. Together, these results indicate adequate alignment between the music performance assessment ratings and the model requirements. Accordingly, we proceeded with our analyses to examine impacts of connectivity and group anchoring in this music assessment context.
Research Question 1: Impact of Group Anchoring and Rating Designs on Performance Estimates
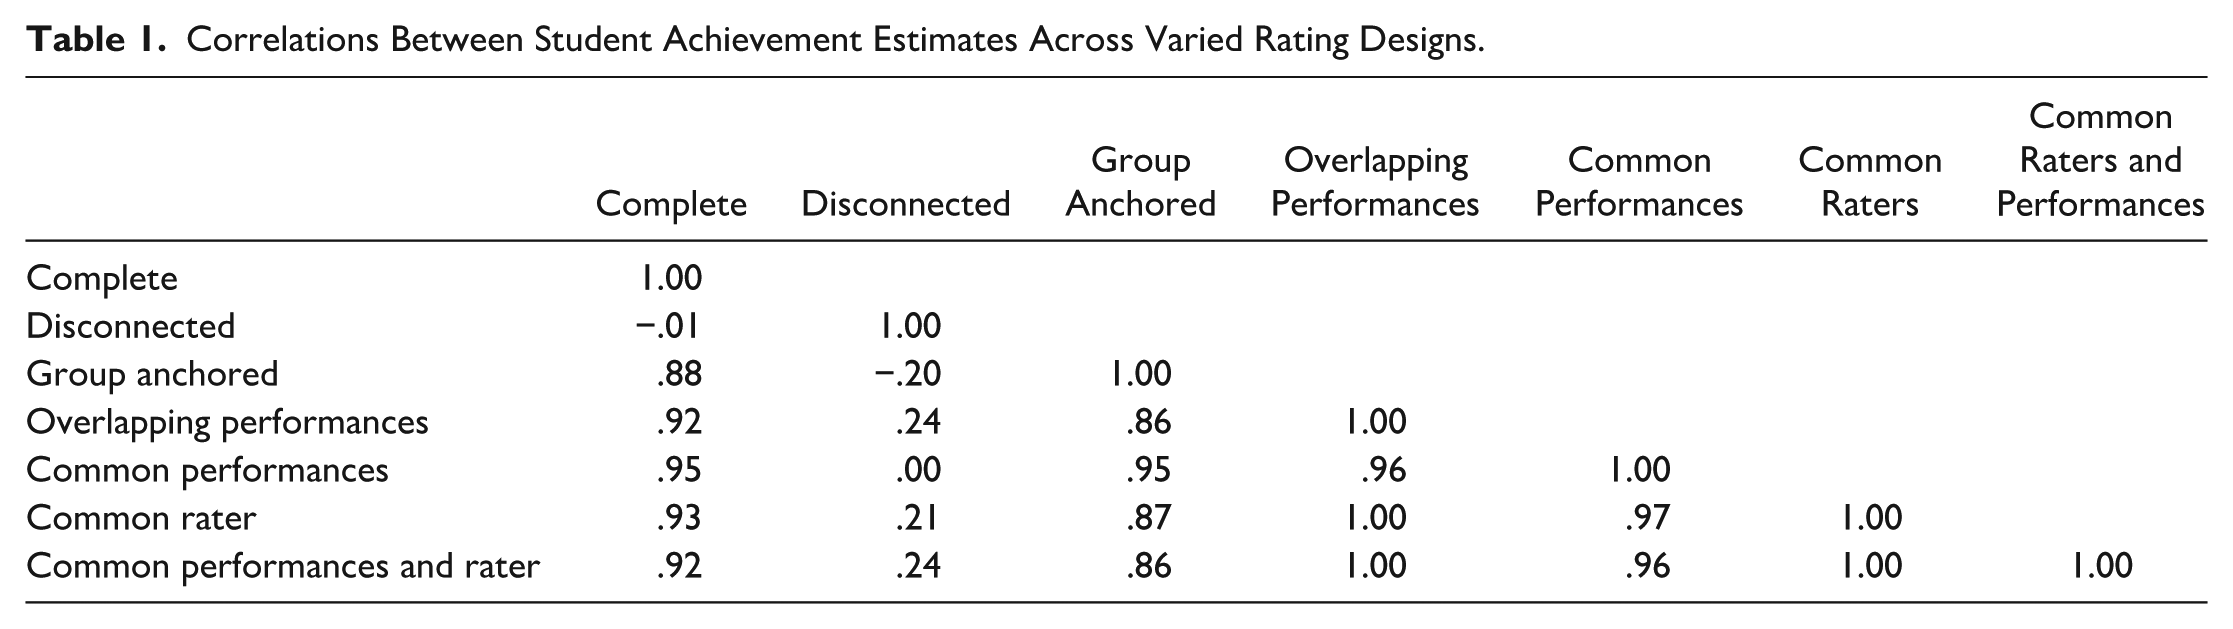
Table 1 summarizes the correlations between performance estimates from the complete (original) data and each of the modified versions. The correlation between performance estimates from the complete data and disconnected data was near zero (r = −.01). However, the correlation was positive and quite strong between the complete data and the disconnected data after applying group anchoring (r = .88). Likewise, estimates from each of the connected designs had strong and positive correlations with those from the original data (.92 ≤ r ≤ .95). These results suggest that the group anchoring procedure and connected rating designs provided generally consistent information about student rank-ordering compared to the complete design.
Correlations Between Student Achievement Estimates Across Varied Rating Designs.
Research Question 2: Impact of Group Anchoring and Rating Designs on Student Performance Rank-Ordering
Figure 2 highlights the practical implications of connectivity for individual student performances. We plotted the ranks for the performances with the five highest ranks (Ranks 1–5) or lowest ranks (Ranks 25–30) based on estimates with the complete data. The vertical axis shows the student performance rank order from 1 (highest achievement) to 30 (lowest achievement) based on estimates from the RS-MFRM in each version of the data. Separate lines with plotting symbols represent individual student performances. The x-axis shows the different rating designs or analytic approaches. Below each label, we indicated the proportion of student performances that were consistently classified as within the bottom five ranks, middle ranks, or top five ranks compared to the complete design; we indicated this proportion using c.
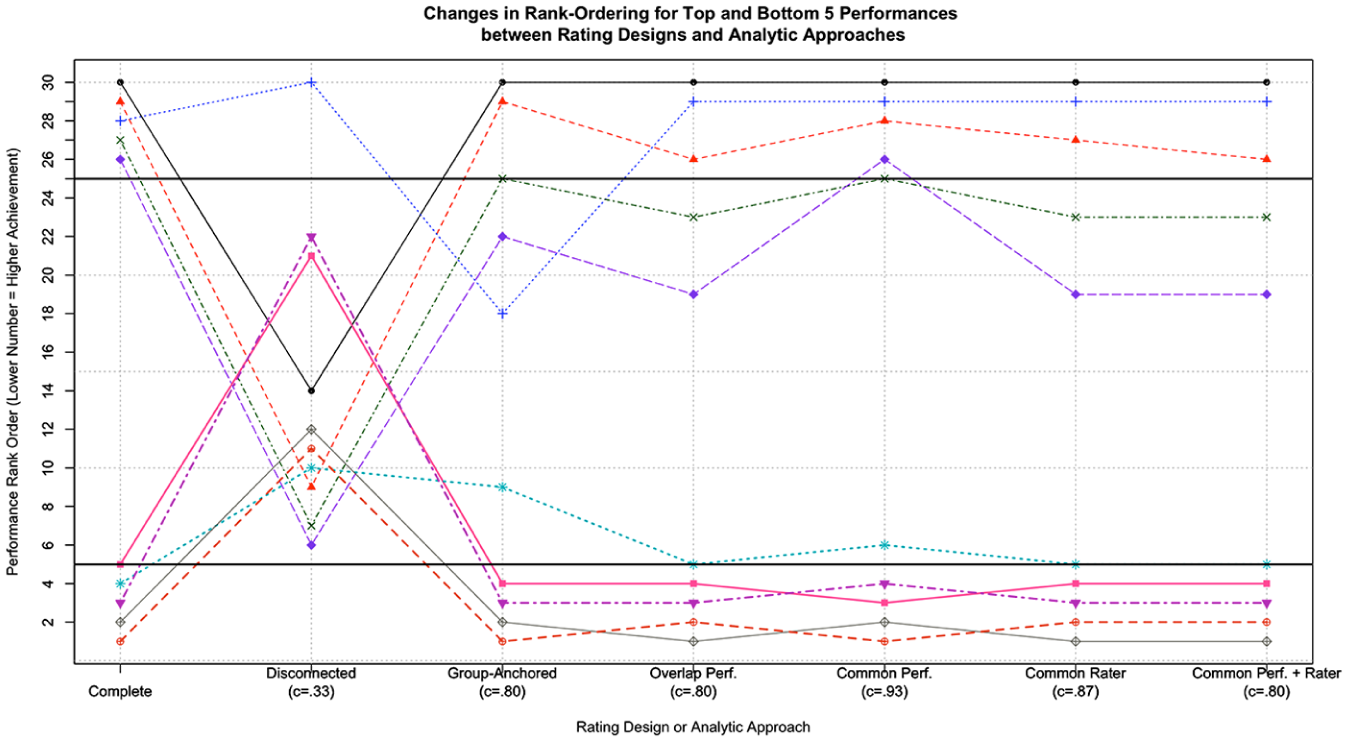
Rank-order for the top and bottom five performances across rating designs.
The rank order changed notably between the complete and modified rating designs for student performances with both low and high original ranks. Focusing first on the disconnected design, only one of our selected student performances (original rank = 28) remained within the same classification of top five or bottom five when raters were not connected. All of the other student performances shifted to notably lower or higher ranks. The proportion of performances with consistent classifications with the complete design was lowest for the disconnected design (c = .33), where only 10 of the 30 student musicians retained their original classifications. When we applied group anchoring to the disconnected design, four out of the five top-ranked student performances remained within the top positions. Among the lowest ranked student performances, two remained in the bottom five positions. The proportion of consistent classifications was equal to c = 0.80, with 24 out of the 30 musicians retaining their original classifications when we implemented the group anchoring procedure. When we used the connected rating designs, the top-ranked student performances generally remained within the five highest positions. However, for the lowest ranked student performances, the ranks were less consistent across the connected rating designs. The proportion of consistent classifications ranged from c = 0.80 for the overlapping performances and common performances and rater designs (corresponding to consistent classifications for 24 of the 30 student musicians) to c = 0.93 for the common performances design (corresponding to consistent classifications for 28 of the 30 student musicians).
To demonstrate the practical impact of these rank-ordering shifts, we examined the results specific to the trombone and trumpet student performances separately with respect to the number of seats available for each instrument. For trombones (see Figure S1a in the supplemental document included with the online version of this article), where four seats were available, only one of the top four-ranked trombone students identified in the complete design remained within the top four ranks when the disconnected design was used; the Wilcoxon signed-rank test for the difference in ranks between the connected and disconnected design resulted in a moderate effect size (r = .44). This result suggests a notable difference in rank-ordering for individual students between the complete and disconnected designs. In terms of classification consistency, 63% (n = 10) of the trombone performances were consistently classified between the complete and disconnected designs using the rank cut-score of 4. In the comparison between the complete design and the group-anchored analysis or connected designs, three of the original four top-ranked students retained their classifications. These designs or analyses resulted in a classification consistency of c = 0.88, such that 14 of the 16 students retained their classifications with respect to the rank cut-score of 4. The Wilcoxon signed-rank test effect size from these comparisons was largest for the comparison between the complete design and group-anchored analysis (r = .36) and for the comparison between the complete design and the common performances and raters design (r = .36). The effect size was smallest for the comparison between the complete design and the overlapping performances design (r < .01). Rank-difference effect sizes were also small for the difference between the complete design and the common performance design (r = .07) and common rater design (r = .07)—indicating small differences.
For trumpets (see Figure S1b in the supplemental document included with the online version of this article), where six seats were available, three students were consistently placed in the top six ranks between the complete and disconnected designs. The difference in ranks for trumpet students between the original connected design and the disconnected design was reflected by a moderate effect size (r = −.56)—indicating substantial differences in ranks for individual students. In terms of classification consistency, 57% (n = 8) of the trumpet performances were consistently classified between the complete and disconnected designs using the rank cut-score of 6. For trumpets, the group anchoring procedure retained five of the top six students’ classifications and resulted in a small effect for the difference in ranks compared to the connected design (r = −.15). Classification consistency between the complete design and group-anchored analysis was equal to c = 0.86, corresponding to 12 of the 14 trumpet students retaining their classifications with respect to the rank cut-score of 6.
All of the connected designs resulted in consistent student classifications within the top six ranks, with small to moderate effect sizes for the changes in rank-ordering when compared to the connected design. These effect sizes ranged from small (r = −.10) for the common performances design to moderate (r = −.37) for the common rater design—indicating some changes in rank-ordering but smaller impact compared to the difference with the disconnected design. Classification consistency values were equal to c = 1 for all of these connected designs, indicating that trumpet students were consistently classified with respect to the rank cut-score of 6 using all of the connected designs.
Discussion
Judging quality is an integral part of formal music performances. Because participating in judged performances can be highly impactful for student musicians (e.g., Austin, 1988; K. K. Howard, 1994; Sweeney, 1998) and because of the ubiquitousness of judging in practice, the quality of ratings should be a central concern for practitioners and researchers who use them. Numerous quality issues come into play for music ratings. One of the primary concerns is the potential for human error, which can be addressed through rater training and preparation but also through appropriate rating designs. In this study, we explored the impact of rating design choice on the outcomes for individual performances in a solo music performance setting. Specifically, we sought to examine the extent to which various common data collection designs resulted in similar conclusions about student achievement estimates. We also sought to evaluate the extent to which these design characteristics impacted the rank-ordering of student performances. When answering these questions, we considered the effectiveness of a post hoc analysis known as group anchoring to reduce the impact of rater variability on music performance estimates and rankings.
Our results suggest that rank-ordering and classifications of the performances were fairly consistent when some level of connectivity was present. The disconnected design performed more haphazardly than any of the other sparse designs in both correlation and rank order. On the other hand, all other designs showed very high correlation with the complete design. These findings highlight the importance of connection between raters and ratings to ensure more consistent estimates and rank-ordering of student performances in formal solo music performance assessment.
With respect to group anchoring, our results suggested that the post hoc adjustment procedure substantially improved the consistency of student achievement estimates and rank-ordering compared to the disconnected design without group anchoring. Although not achieving the level of consistency as the partially connected designs, the improvement in consistency after group anchoring supports its use with disconnected designs. Thus, our results suggest that when disconnected designs are unavoidable, group anchoring may help reduce the impact of differences in rater judgment between subsets of student performances.
No design performed as well as the fully connected design, and not all partially connected designs performed equally. Some partially connected designs still had a moderate effect on the rank-ordering of performances. Although the largest differences in rank-ordering appeared to be mostly in the middle ability range (i.e., the higher and lower rankings were more stable), our results do not imply that using a partially connected design or group anchoring will completely solve the issues encountered in these situations. However, the alternative of relying on a fully disconnected design seems, by comparison, so poor as to be indefensible as sound practice.
Implications for Research and Practice
Our results highlight the consequences associated with disconnected rating designs in assessments in which rank-ordering is used to inform decisions about individual musicians. It is common practice across many states to rank the performances based on judge scores, where student rank order is used to fill a limited number of positions in a regional or state honor band, orchestra, or choir. If, as is often the case, each student musician is rated by a single judge, the top scores may not always accurately represent the most proficient musicians. When performance rankings are used to determine student placement or establish a cutoff for participation in music ensembles, practitioners should be aware that significant bias may be present, leading to unstable rankings. Therefore, we recommend that disconnected designs be avoided in practice. Although it is common practice to compare music performance ratings between assessment sites without corrections or adjustments for differences in rater severity (e.g., FBA, 2017; Virginia Music Educators Association, 2013), our findings highlighted how such comparisons may yield inaccurate conclusions about the quality and rank-ordering of individual student performances.
If disconnected designs occur, our results support the use of group anchoring as a post hoc adjustment procedure. However, we recommend implementing some level of connectivity between judges to avoid the need for a post hoc adjustment. Recognizing that complete designs can be expensive and time-consuming, we suggest that modifying a disconnected design to include at least some overlap between raters may provide great benefit to the stability of ratings with minor additional requirements. Our results suggested that incorporating common observations between judges improves the comparability of student performance ratings between judges, thereby improving the accuracy of the assessment procedure. As an example, we provide the scenario of a formal music performance assessment audition with 30 student performances and three raters. In a disconnected design (Figure 1b), three judges would rate 10 performances each, with no common observations through which to link them. Reflecting our current findings, the disconnected design is likely to yield unstable and inaccurate conclusions about the quality and rank-ordering of student performances. An improvement would be to have each judge rate 20 performances, with each performance being rated by two raters (Figure 1c). In the overlapping design, each judge shares a block of ratings with a second judge with the order alternating, thereby improving the stability of rankings. Another option would be to include a block of “prejudging” calibration performances that all judges rate together. In this design (Figure 1d), each judge rates five prerecorded performances followed by their individual block of ratings. For this design to be effective, care must be taken to ensure that the recorded performances are of sufficient quality and also provide a range of abilities (Wind & Jones, 2019). Even if all other ratings are disconnected, the common performances in the prejudging block provide connections between raters that facilitate measurement model analyses to yield comparable scores between raters.
An important aspect to preplanning connected rater designs involves creating a structured, interconnected assessment system to foster more consistent and fair outcomes. In particular, a primary step to improve the effectiveness of group anchoring processes starts with implementing iterative feedback loops to refine scoring procedures (Wind, 2019). We suggest that festival organizers and raters start by engaging in prefestival calibration sessions, where they collectively review sample performances, discuss rationales for specific scoring considerations, and align their interpretations to an established scoring instrument. Research suggests that prefestival calibration sessions can minimize the subjectivity of scoring while improving the validity of feedback provided to student performers (Wesolowski et al., 2018; Wind & Jones, 2019). Additionally, the collected data can serve as a foundation to connecting raters. To close the feedback loop, postperformance discussions among raters and festival coordinators may allow for real-time adjustments to raters’ scoring tendencies, improving the overall reliability of scoring processes (Salas et al., 2012). The implementation of feedback loops broadly allows raters to compare scores, address outlier performances, view aggregated trends, and refine scoring alignment.
Our article demonstrates how carefully constructed data collection designs or statistical adjustment procedures such as group anchoring can help mitigate the impact of differences in rater severity on conclusions about individual students in music performance assessment compared to disconnected designs. When considering these approaches, we emphasize that data collection designs and procedures such as group anchoring do not in themselves guarantee accurate ratings. In addition to ensuring adequate data collection designs to facilitate comparisons between raters and students, evidence of psychometric quality, including but not limited to analyses investigating the presence of rater effects beyond severity differences (e.g., rater biases or differential rater functioning, halo effects, and appropriate rating scale use), are also necessary to support the meaningful interpretation and use of scores from music performance assessments.
Limitations and Directions for Future Research
Our study has limitations that warrant exploration in future research. First, we used a relatively small sample of student performances from a single music assessment context. This sample and assessment context facilitated a clear methodological demonstration. However, they do not reflect the full scope of music performance assessments in which rating design considerations are relevant. In future studies, researchers could consider the effects of group anchoring relative to other rating designs using data from music performance assessments with characteristics that are different from those reported here. In addition, our analyses focused primarily on the impacts of group anchoring on conclusions about student performances. We did not specifically consider the role of specific types of rater effects, such as severity/leniency, range restrictions, or rater biases (i.e., differential rater functioning), in combination with group anchoring or other designs. In future studies, researchers may consider the impacts of group anchoring with respect to rater parameter estimation or specific rater effects.
Supplemental Material
sj-docx-1-jrm-10.1177_00224294251363327 – Supplemental material for Rater Connectedness Affects Student Achievement Estimates and Ordered Rankings in Formal Music Performance Assessments
Supplemental material, sj-docx-1-jrm-10.1177_00224294251363327 for Rater Connectedness Affects Student Achievement Estimates and Ordered Rankings in Formal Music Performance Assessments by Stefanie A. Wind, Brian C. Wesolowski and Eli Jones in Journal of Research in Music Education
Footnotes
Declaration of Conflicting Interests
The authors declared no potential conflicts of interest with respect to the research, authorship, and/or publication of this article.
Funding
The authors received no financial support for the research, authorship, and/or publication of this article.
Supplemental Material
Author Biographies
References
Supplementary Material
Please find the following supplemental material available below.
For Open Access articles published under a Creative Commons License, all supplemental material carries the same license as the article it is associated with.
For non-Open Access articles published, all supplemental material carries a non-exclusive license, and permission requests for re-use of supplemental material or any part of supplemental material shall be sent directly to the copyright owner as specified in the copyright notice associated with the article.