
Abstract
Reporting standards and critical appraisal tools serve as beacons for researchers, reviewers, and research consumers. Parallel to existing guidelines for researchers to report and evaluate group-comparison studies, single-case experimental (SCE) researchers are in need of guidelines for reporting and evaluating SCE studies. A systematic search was conducted for quality standards (QSs) for reporting and/or evaluating SCE studies. In total, 11 unique QSs were retrieved. In this article, we discuss the extent to which there is agreement with regard to randomization and data analysis of SCE studies among the 11 proposed sets of QSs. We provide recommendations regarding the inclusion of a randomization and data-analysis standard.
Keywords
The popularity of single-case experimental (SCE) studies is growing in the field of special education. According to recent reviews (e.g., Shadish & Sullivan, 2011; J. D. Smith, 2012), SCE studies, for the most part, are published in special education and related research journals. Parallel to existing guidelines for researchers to report and evaluate group-comparison studies (e.g., Des Jarlais, Lyles, & Crepaz, 2004; Schulz, Altman, & Moher, 2010), SCE researchers are in need of guidelines for reporting and evaluating SCE studies. Reporting standards help researchers increase the accuracy, transparency, and completeness of their publications (Equator Network, n.d.). Unclear reporting of a study’s methodology and findings can limit effective dissemination and hinder critical appraisal of the study, while inadequate reporting can bring along the risk that flawed and misleading study results are used by special education practitioners and policy makers (Simera, Altman, Moher, Schulz, & Hoey, 2008). Critical appraisal tools help reviewers and practitioners distinguish sound from poor SCE studies and delineate what it takes for a treatment to be considered empirically supported (Schlosser, 2009).
Recently, reporting standards and critical appraisal tools for SCE studies have been developed, showing that SCE research is taken seriously, and that SCE research is seen as a valid source of scientific knowledge. Wendt and Miller (2012) discussed seven critical appraisal tools with regard to seven major design components: describing participants and setting, dependent variable, independent variable, baseline, experimental control and internal validity, external validity, and social validity. In this article, we discuss the extent to which there is agreement among proposed sets of quality standards (QSs) for SCE studies (i.e., reporting standards and critical appraisal tools) with regard to randomization and data analysis. Our focus on randomization and data analysis is inspired by (a) the increasing acknowledgment of the importance of randomization for drawing valid conclusion from SCE design research and (b) recent advances in data-analysis procedures for SCE designs.
Method
We systematically searched for papers published up to January 1, 2013, describing QSs for reporting and/or evaluating SCE studies, operationalized in the form of a comprehensive set of guidelines, a checklist, a scale, or an evaluation tool. If separate papers presented different versions of the same QS, we included the paper presenting the most recent and comprehensive version of the QS. If separate papers presented exactly the same QS, we only included the original paper.
Our systematic search process consisted of four steps: First, we searched the databases CINAHL, Embase, ERIC, Medline, PsycINFO, and Web of Science using the following search string: (“single subject” OR “n of 1” OR “single case” OR “single system” OR “single participant”) AND (“reporting guidelines” OR “reporting standards” OR “critical appraisal” OR “methodological quality” OR “quality rating” OR “quality evaluation” OR “quality assessment”) AND (“instrument” OR “scale” OR “checklist” OR “standards” OR “tool” OR “rating”). Second, the reference lists of all the papers that were identified as relevant in the first step were searched for other relevant references (i.e., “backward search”). Third, we retrieved more recent references through searching four citation databases: We traced which papers cited the papers that were already identified as relevant in steps 1 and 2 (i.e., “forward search”). We consulted three indices included in the Web of Science database: the Arts & Humanities Citation Index, the Science Citation Index Expanded (SCI), and the Social Sciences Citation Index (SSCI). In addition, we conducted a forward search by means of a fourth citation database: Google Scholar. Fourth, as a check for missing QSs we searched the engines Google Scholar and ScienceDirect.
Results
Retrieved QSs
In total, 11 unique QSs were retrieved. Table 1 provides an overview of the 11 QSs. The first QS was published in 2003, the second in 2005, and the nine other QSs were published between 2007 and 2011. Next to six QSs that can be used for all SCEs, two QSs were developed for evaluating specific designs (SCEs evaluating one treatment vs. two or more treatments; Schlosser, 2011; Schlosser, Sigafoos, & Belfiore, 2009) and three for evaluating SCEs published in a specific substantive research domain: for SCEs on psychosocial interventions for individuals with autism (T. Smith et al., 2007), for SCEs on young children with autism (Reichow, Volkmar, & Cicchetti, 2008), and for SCEs on social skill training of children with autism (Wang & Parrila, 2008). In the remainder of the article, we focus on randomization and data-analysis items included in the 11 QSs.
Characteristics of Quality Standards for SCE Studies.
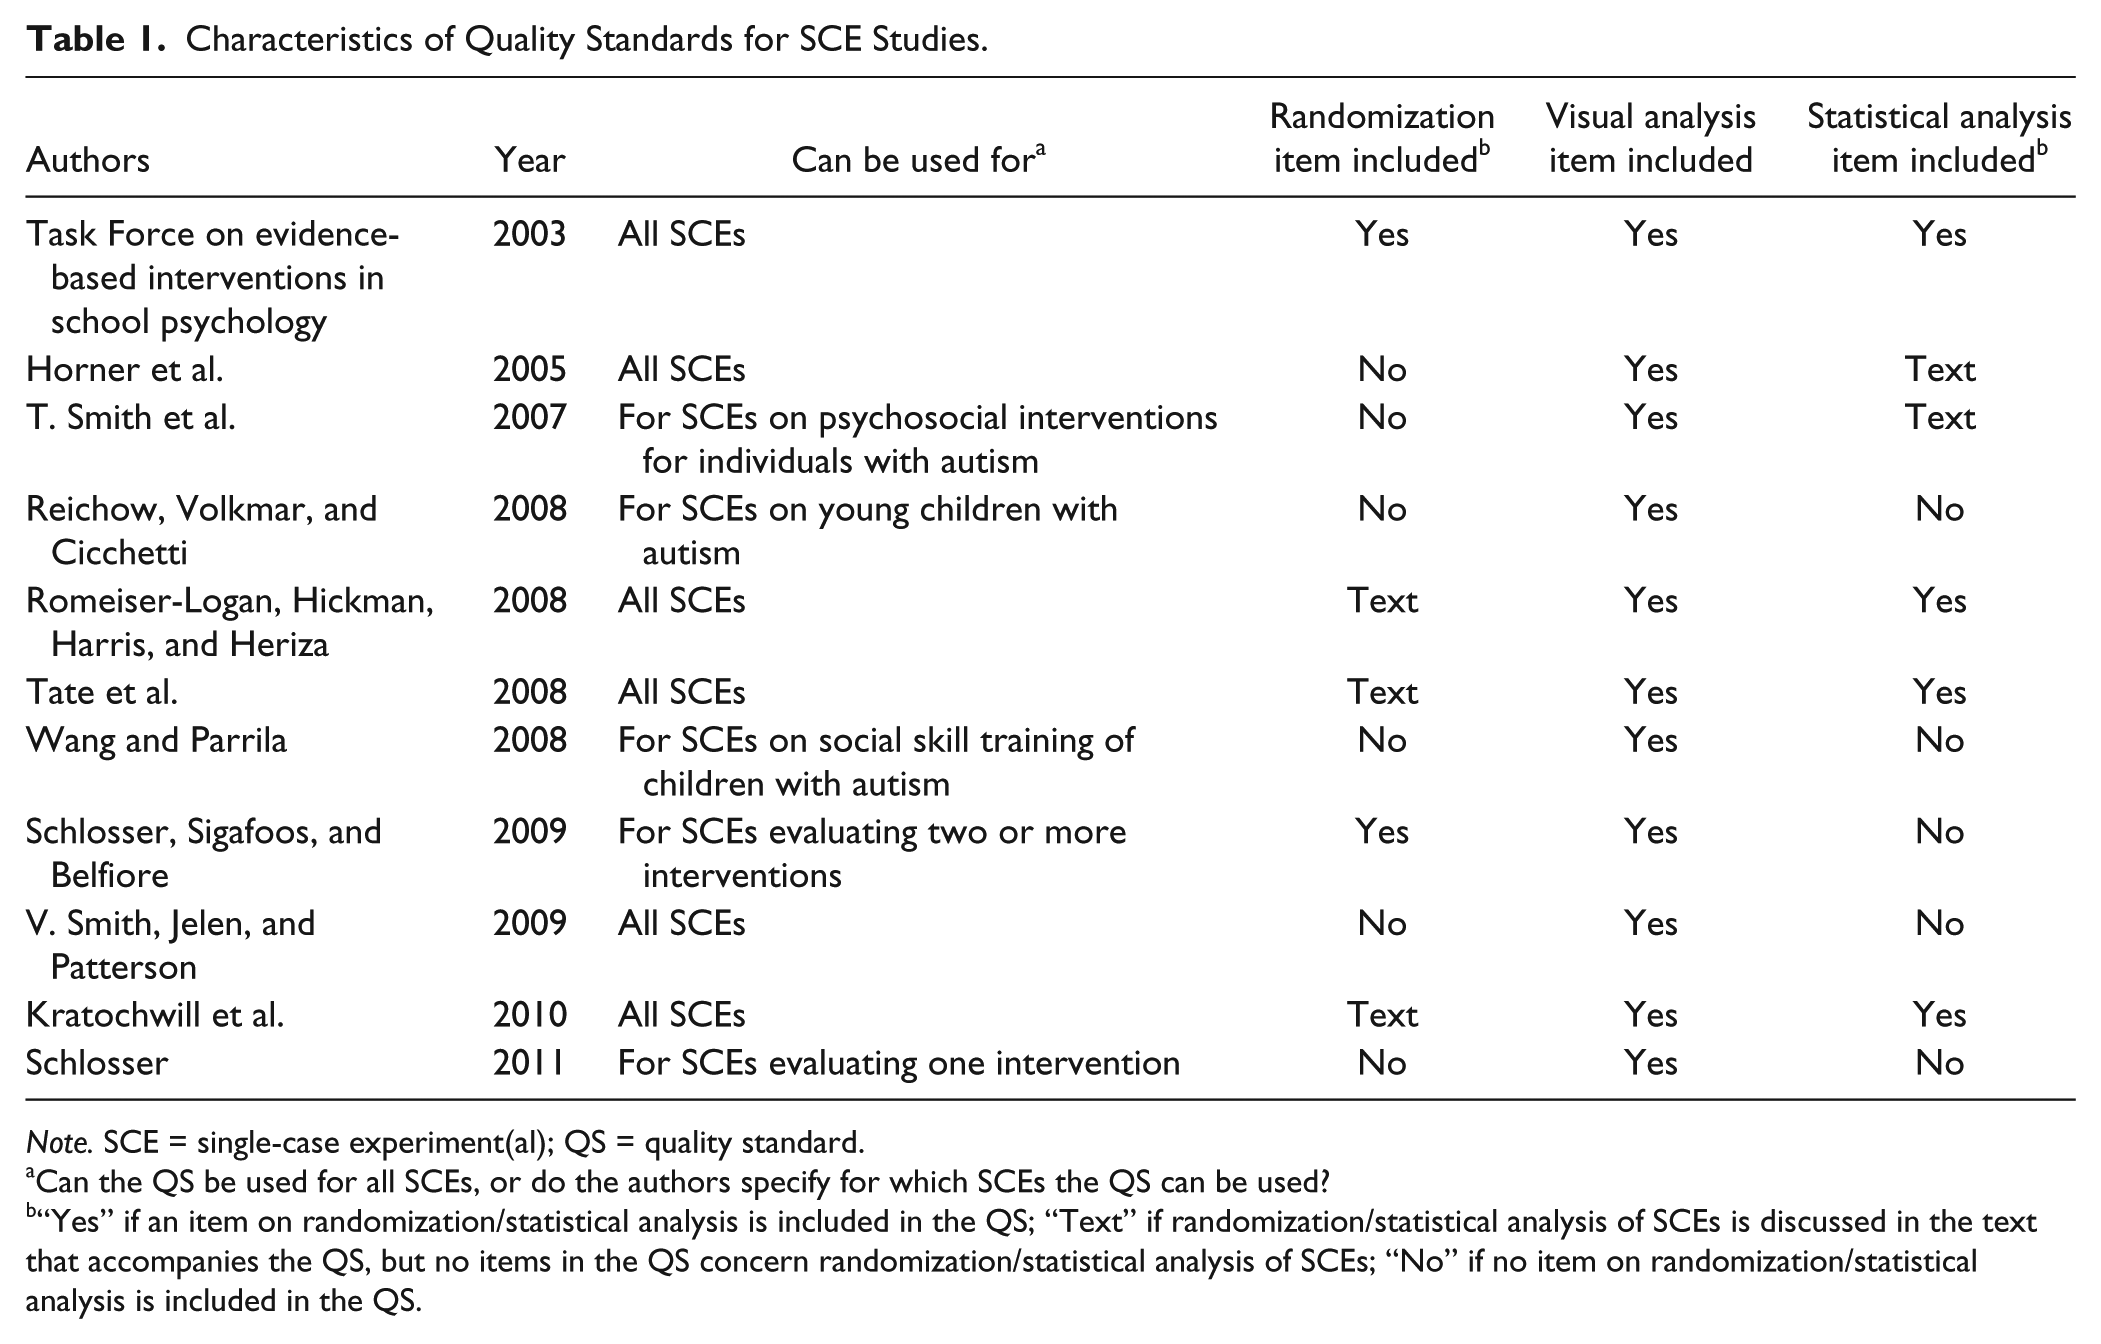
Note. SCE = single-case experiment(al); QS = quality standard.
Can the QS be used for all SCEs, or do the authors specify for which SCEs the QS can be used?
“Yes” if an item on randomization/statistical analysis is included in the QS; “Text” if randomization/statistical analysis of SCEs is discussed in the text that accompanies the QS, but no items in the QS concern randomization/statistical analysis of SCEs; “No” if no item on randomization/statistical analysis is included in the QS.
Randomization for SCE Studies
Shadish, Cook, and Campbell (2002) differentiate between experimental designs such as randomized experiments and quasi-experiments, and nonexperimental designs. Whereas in experimental studies an intervention is deliberately introduced to observe its effects, in nonexperimental or observational studies no manipulation is used by the researcher: The size and direction of relationships among variables are simply observed (Shadish et al., 2002). Within the group of experimental studies, in randomized experiments the units are assigned to conditions by a random process, whereas in quasi-experiments the units are not randomly assigned to conditions (Shadish et al., 2002). As such, although the manipulation of the independent variable(s) by the experimenter is an essential feature of experimental studies, the random assignment of units to conditions is not an essential feature. For group-comparison studies, randomization concerns the random assignment of the participants to the control and the experimental group(s) (cf. randomized controlled trials). For SCEs, randomization is applied within the participant: It involves the random assignment of the measurement occasions to the treatments.
In SCE studies where randomization is feasible and logical, it brings along important advantages. A first advantage is that it can be used to reduce or eliminate internal validity threats. Two major internal validity threats for SCE research are “history” and “maturation.” “History” refers to the influence of external events (e.g., weather change, big news event, holidays) that occur during the course of a SCE, which may influence the participant’s behavior in such a way as to make it appear that there was a treatment effect, and “maturation” deals with changes within the experimental participant (e.g., physical maturation, tiredness, boredom, hunger) during the course of the SCE (Edgington, 1996). In SCEs, random assignment of measurement occasions to treatments yields statistical control over these (known and unknown) confounding variables and facilitates causal inference (Kratochwill & Levin, 2010; Onghena & Edgington, 2005). Using randomization renders experimental control over the SCE design and as such enhances the methodological quality and scientific credibility of the SCE study.
In SCE studies where randomization is feasible and logical, it brings along a second advantage: the opportunity to apply a statistical test based on the randomization as it was implemented in the SCE design (see, for example, Edgington & Onghena, 2007; Koehler & Levin, 1998; Levin & Wampold, 1999; Todman & Dugard, 2001; Wampold & Worsham, 1986). The randomization test (RT) is the most direct and straightforward application of statistical tests to randomized SCE designs: Using a RT enhances the statistical conclusion validity of a SCE. Advantages of RTs are as follows: (a) the p value can be derived without making assumptions about population distributions (as would be needed for most parametric tests) and (b) without degrading the scores to ranks, as is done for other nonparametric tests such as the Kruskal-Wallis test and the Wilcoxon-Mann-Whitney test. However, limitations are (a) that the validity of RTs is only guaranteed when measurement occasions are randomly assigned to the experimental treatments before the start of the SCE and (b) that the SCE design might have too little statistical power. For example, it is easy to see that a .05 level RT has zero power if less than 20 assignments are possible (because the smallest possible p value in that case would be always larger than 1/20). Furthermore, with very few assignments the distribution of p values is highly discrete with a sparse number of possible values.
Because randomization requires the SCE researcher to randomly assign the measurement occasions to the treatments before the data are collected, it imposes several practical restrictions on the implementation of the SCE study. In some cases, randomization is feasible and logical. In other cases, randomization might jeopardize the basic logic of the SCE design. For instance, in response-guided designs the number of observations in each phase depends on the emerging data: The researcher can extend baseline phases when there is much variability, a trend, or a troubling outlier, and can extend treatment phases when there is much variability, the effect is delayed, the effect occurs gradually, or the effect is relatively small (Ferron & Jones, 2006). An in-between solution is restricted random assignment (Edgington, 1980) with, for instance, randomization being introduced after stability of the baseline is achieved.
Randomization can be incorporated in SCE reversal, alternating treatment, and multiple baseline designs (e.g., Kratochwill & Levin, 2010; Levin, Ferron, & Kratochwill, 2012; Onghena & Edgington, 2005). Special education researchers interested in designing and analyzing randomized SCEs can use one of the free software packages, such as the packages developed by Koehler and Levin (2000), Todman and Dugard (2001), and Bulté and Onghena (2008, 2009). Recently, researchers have explored ways to integrate RTs with visual analysis of SCE data and SCE effect sizes (cf. section below on Data Analysis for SCE Studies). For instance, Ferron and Jones (2006) worked on the integration of RTs and visual analysis of SCE data: The authors present a method that ensures control over the Type I error rate for researchers who visually analyze the data from response-guided multiple baseline designs. Heyvaert and Onghena (2014) worked on the integration of RTs and SCE effect sizes: To not only determine the (non)randomness of an intervention effect but also the magnitude of this effect, the authors propose to use an effect size index as a test statistic for the RT.
Randomization Items in the Retrieved QSs for SCE Studies
Only 2 of the 11 retrieved QSs include an item on randomization (Schlosser et al., 2009; Task Force on Evidence-Based Interventions in School Psychology [Task Force], 2003). However, the item on randomization included in the Task Force (2003) QS is problematic: Randomization is discussed with regard to “how participants (e.g., individuals, schools) were assigned to control and intervention conditions/groups.” The options for scoring this item are “Random after matching, stratification, blocking,” “Random, simple (includes systematic sampling),” “Nonrandom, post hoc matching,” “Nonrandom, other,” “Other,” “Unknown/insufficient information provided,” and “N/A (randomization not used).” However, in SCEs one participant is exposed to all levels of the independent variable. As such, each participant is exposed to control (e.g., A phases in an ABAB design) as well as treatment (e.g., B phases in an ABAB design) conditions in SCEs. The “units” that are randomly assigned to treatments or conditions for SCEs are “measurement occasions,” and not “participants” like in group-comparison studies.
In the Schlosser et al. (2009) QS, randomization is mentioned in the item “The design along with procedural safeguards minimizes threats to internal validity arising from sequence effects,” with the description “(. . . ) Mark ‘yes’ if sequence effects are controlled through simultaneous presentation of conditions within the same sessions combined with procedural safeguards such as counterbalancing or randomizing the order (. . . ).” The authors do not emphasize randomization for the benefit of later data analysis and statistical conclusion validity. They are only concerned with how to control for sequencing effects when the order of the alternating treatments is decided.
In Kratochwill et al. (2010); Romeiser-Logan, Hickman, Harris, and Heriza (2008); and Tate et al. (2008), the possibility to include randomization in SCEs is mentioned in the text that accompanies the QS, but no items in the QS concern randomization. Tate et al. report that “randomization of treatment sequences” was an item initially considered for inclusion in the QS, but subsequently excluded because the items included in their QS are the “minimum core set” criteria for SCEs. However, Tate et al. recognize that randomization permits causal inferences to be made, thereby elevating the SCE design from a quasi-experimental procedure to one using “true experimental methodology.” We will return to the idea of “minimum core set” criteria in the Discussion.
Romeiser-Logan et al. (2008) explicitly mention that the methodological quality of SCEs can be enhanced when randomization is introduced because this minimizes internal validity threats to drawing valid causal inferences. In a table with important study design elements for SCEs and group-comparison studies, they list the design element “random allocation” and operationalize this for SCEs as “random allocation of subjects, settings, or behaviors in multiple baseline design; random allocation of intervention in N-of-1 and alternating treatment designs.” However, no items in their final QS concern randomization.
Kratochwill et al. (2010) refer to the article by Kratochwill and Levin (2010) and say that randomization can improve the internal validity of SCEs, but that these applications are still rare. The authors recognize that randomization can be introduced in phase designs and alternation designs, as well as in replicated SCEs like multiple baseline designs. Of the 11 QSs, this is the only QS that explicitly mentions the possibility of using RTs as statistical significance tests when randomization is introduced in SCE designs.
The six other retrieved QSs do not mention the possibility to include randomization in SCEs: neither in the QS, nor in the text that accompanies the QS.
Data Analysis for SCE Studies
Two broad groups of methods are applied to analyze and interpret SCE data: visual analysis and statistical analysis. Traditionally, SCE researchers have been using visual analysis for evaluating behavior change. Visual analysis consists of the inspection of graphed SCE data for changes in level, variability, trend, latency to change, and overlap between phases to judge the reliability and consistency of treatment effects (Horner, Swaminathan, Sugai, & Smolkowski, 2012; Kazdin, 2011). When the changes in level and/or variability are in the desired direction and when they are immediate, readily discernible, and maintained over time, it is concluded that the changes in behavior across phases result from the implemented treatment and are indicative of improvement (Busse, Kratochwill, & Elliott, 1995). Demonstration of a functional relationship between the independent and dependent variable is compromised when there is a long latency between manipulation of the independent variable and change in the dependent variable, when level changes across conditions are small and/or similar to changes within conditions, and when trends do not conform to those predicted following introduction or manipulation of the independent variable (Horner et al., 2005; Kazdin, 2011).
Attractive features of using visual analysis methods are that they do justice to the richness of the data, are quick, easy, and inexpensive to use, and that they are widely accepted and understood. Another advantage lies in their “conservatism”: Only visually salient effects are detected (Parsonson & Baer, 1978). Visual inspection of graphed SCE data is straightforward when the treatment effects are large and when the baseline is stable. However, it is advisable to complement visual analysis with statistical analysis of the SCE data when there is a significant trend or variability in the baseline, in case of weak or ambiguous effects, when changes are small but important and reliable, and to control for extraneous factors (Kazdin, 2011). Although SCE researchers agree on the importance of visual analysis, a remaining challenge is the lack of consensus on the process and decision rules for visual analysis (Horner et al., 2012).
The second group of methods applied to analyze and interpret SCE data are statistical analysis methods. Statistical significance tests can be used to test hypotheses about treatment effects in SCEs. Parametric statistical significance tests traditionally used for analyzing group-comparison studies (e.g., t and F tests) are often not appropriate to analyze SCEs because assumptions of normality are frequently violated for SCE data, SCE data are often autocorrelated, and these tests are insensitive to trends that occur within a phase (Houle, 2009; J. D. Smith, 2012). Parametric analysis options that are more appropriate to analyze (and synthesize) SCE data are multilevel and structural equation modeling (see, for example, Shadish, Rindskopf, & Hedges, 2008; Van den Noortgate & Onghena, 2003). Also, interrupted time series analysis (ITSA; for example, Crosbie, 1993; Jones, Vaught, & Weinrott, 1977) methods (e.g., autoregressive integrated moving average models) are proposed for analyzing SCE data because of their ability to handle serial dependency. However, drawbacks are that ITSA requires a large number of measurement occasions per phase, and that several problems are reported with the process of identifying a suitable model to describe the nature of the autocorrelation in the data (Houle, 2009; Kazdin, 2011). Furthermore, because nonparametric tests are valid without making distributional assumptions, several of these tests have been recommended for analyzing SCEs (e.g., Kruskal-Wallis test, Wilcoxon-Mann-Whitney test, RTs; cf. supra).
Next to the use of inferential techniques for analyzing SCE data, such as statistical significance tests and confidence intervals, statistical analysis also includes descriptive statistics, such as effect size measures. One group of SCE effect size measures is closely related to visual analysis: the “nonoverlap statistics.” These measures are indices of data overlap between the phases in SCE studies. Examples of nonoverlap statistics are percent of nonoverlapping data (PND), percentage of zero data points (PZD), percent of data points exceeding the median (PEM), improvement rate difference (IRD), and percent of all nonoverlapping data (PAND; see, for example, Parker, Vannest, & Davis, 2011, for a review of several nonoverlap statistics). General advantages of nonoverlap statistics are their ease to calculate and interpret and their accordance with visual analysis. However, different advantages and disadvantages are noted for different nonoverlap statistics (e.g., deficient performance in the presence of data outliers in the baseline phase, insensitivity to data trends and variability in the data, insensitivity to differences in the magnitude of effect), and for now each available nonoverlap statistic is equipped to adequately address only a relatively narrow spectrum of SCE designs (see, for example, Maggin et al., 2011; J. D. Smith, 2012; Wolery, Busick, Reichow, & Barton, 2010). A second group of SCE effect size measures is based on the standardized mean difference (SMD) effect sizes used for group-comparison designs (e.g., Cohen’s d, Glass’s Δ, Hedges’s g). The difference between computing these SMDs for group-comparison and SCE designs is that for the former the variation between groups is used, and for the latter the within-case variation. Due to this computational difference, the obtained SCE effect sizes are not interpretively equivalent to SMDs for group-comparison designs. Advantages are their ease of use and their familiarity to applied researchers; drawbacks are that SMDs were not developed to contend with autocorrelated data (as is often the case for SCE data), that the interpretational SMD benchmarks for group-comparison designs cannot automatically be used for SCEs, and that SMDs are insensitive to trends (that are often present in SCE data; Maggin et al., 2011; J. D. Smith, 2012). However, Hedges, Pustejovsky, and Shadish (2012) recently developed a SMD effect size for SCEs, which is directly comparable with Cohen’s d. A third group are regression-based effect size measures: Regression techniques are used to estimate the effect size for a SCE by taking a trend into account. Examples are the piecewise regression approach of Center, Skiba, and Casey (1985-1986), the approach of White, Rusch, Kazdin, and Hartmann (1989), the approach of Allison and Gorman (1993), and multilevel models (e.g., Van den Noortgate & Onghena, 2003). Important advantages of regression-based effect size measures are their ability to account for linear or nonlinear trends in the data as well as for dependent error structures within the SCE data (Maggin et al., 2011; Van den Noortgate & Onghena, 2003). A possible limitation is that most applied researchers are not familiar with the calculation and interpretation of these SCE regression-based effect size measures, and that these approaches may be far more technically challenging than nonoverlap statistics and SMD effect sizes for SCEs. Recently, Monte Carlo simulation studies have been conducted to evaluate SCE effect size measures (e.g., Manolov & Solanas, 2008; Manolov, Solanas, Sierra, & Evans, 2011). One of the conclusions of the simulation study of Manolov et al. (2011) is that data features are important for choosing the appropriate SCE effect size measure: The authors provide a flowchart to guide the effect size measure selection according to the visual inspection of the SCE data.
Altogether, over the last decades, a substantial number of statistical methods for analyzing SCEs have been proposed and studied, but there is currently no clear consensus on which method is most appropriate for which kind of design and which data. Analyzing data from SCE designs using multilevel models seems to be one of the most promising statistical methods (cf. Shadish et al., 2008). Remaining challenges and directions for future research in this field concern statistical power, autocorrelation, applications to more complex SCE designs, extensions to other kinds of outcome variables and sampling distributions, and the valid parameter estimation (especially of variance components), given the very small number of observations that may be encountered in SCE research (see Shadish, Kyse, & Rindskopf, 2013; Shadish & Rindskopf, 2007). Also in the development of SCE effect size measures, there is much yet for the field to learn. As described by Horner and colleagues (2012), an ideal SCE effect size index would be comparable with Cohen’s d (making it easily interpreted and readily integrated into meta-analyses that also include group-comparison studies), would reflect the experimental effect under analysis (e.g., all phases of a SCE study are used to document experimental control), and would control for serial dependency (a challenge with parametric analyses) as well as score dependency (a challenge for analyses using chi-square models). The index proposed by Hedges et al. (2012) provides an answer to the first requirement (i.e., comparability with Cohen’s d), but there is still work to do (e.g., this index is not yet adapted for more complex situations). With regard to SCE data analysis in general, a remaining challenge is an accepted process for integrating visual and statistical analysis (Horner et al., 2012).
Data-Analysis Items in the Retrieved QSs for SCE Studies
The visual inspection of SCE data is—either implicitly or explicitly—included in all 11 retrieved QSs. This consistency among the 11 proposed sets of QSs may serve as an index of content validity. Unfortunately, most QSs do not include specific guidelines for visually analyzing the data. An exception is the QS of Kratochwill et al. (2010): Based on the work of Parsonson and Baer (1978), four steps and six variables (i.e., level, trend, variability, immediacy of effect, overlap/nonoverlap, and consistency of data across phases) of visual analysis are outlined. This results in the categorization of each outcome variable as demonstrating “Strong evidence,” “Moderate evidence,” or “No evidence.” Also Horner et al. (2005) discuss all six variables described by Parsonson and Baer (1978) for the visual analysis of SCE data. The nine other QSs refer to only some of these six variables (mostly level and trend). Another QS that includes specific guidelines for visually analyzing SCE data is the one developed by the Task Force (2003): Evaluating outcomes through visual analysis is based on five variables (i.e., change in levels, minimal score overlap, change in trend, adequate length, and stable data) and results in the ratings “Strong evidence,” “Promising evidence,” or “Weak evidence.”
Four QSs include items on statistical analysis. First, the Kratochwill et al. (2010) QS instructs that for studies categorized as demonstrating “Strong evidence’ or “Moderate evidence” based on the visual inspection of the data (cf. supra), effect size calculation should follow. To do so, several parametric and nonparametric statistical analysis methods are discussed. Subsequently, the following guidelines are provided (p. 24): (a) When the dependent variable is already in a common metric (e.g., proportions or rates), then this metric is preferred to standardized scales; (b) If only one standardized effect size estimate is to be chosen, a regression-based estimator is to be preferred; (c) It is recommended to do sensitivity analyses by reporting one or more nonparametric estimates (i.e., “nonoverlap statistics”) in addition to the regression estimator and afterward compare results over estimators; and (d) summaries across cases (e.g., mean and standard deviation of effect sizes) can be computed when the estimators are in a common metric, either by nature (e.g., proportions) or through standardization.
Second, Romeiser-Logan et al.’s (2008) QS includes the items “Did the authors report tests of statistical analysis?” and “Were all criteria met for the statistical analyses used?.” The authors provide in the text a nonexhaustive list with descriptive (e.g., measures of central tendency, variability, trend lines, slope of the trend lines) and inferential (e.g., χ2 and t tests, split-middle method, two- and three-SD band methods, C-statistic) statistical methods that can be used to analyze SCEs.
Third, the Task Force (2003) QS mentions that although statistical tests are rarely applied to analyze SCEs, in many cases the use of inferential statistics is a valuable option. In judging the SCE evidence, they advise to consider effect sizes and power of the outcomes, and to consider outcomes to be statistically significant if they reach an alpha level of .05 or less. For reporting effect sizes, the Task Force refers to the three approaches for calculating SMD effect sizes that were developed by Busk and Serlin (1992).
Fourth, the Tate et al. (2008) QS includes the item “Statistical analysis,” which is described as “Demonstrate the effectiveness of the treatment of interest by statistically comparing the results over the study phases.” As noted by the authors, this item does not require that “appropriate” statistical techniques are applied, merely that “some” statistical analysis is conducted. Also for QS group-comparison studies, it is not uncommon that an item merely states that “some” statistical analysis is conducted, without requiring that an “appropriate” statistical techniques are applied (e.g., Maher, Sherrington, Herbert, Moseley, & Elkins, 2003).
For two other QSs, the possibility to conduct statistical analyses is very briefly mentioned in the text that accompanies the QS, but not as an item in the QS. Horner et al. (2005) refer to Todman and Dugard’s (2001) book on RTs for SCEs. T. Smith et al. (2007) indicate that statistical methods for interpreting SCEs are available, but that the selection of the appropriate statistical method may be difficult. The five other retrieved QSs do not mention the possibility to conduct statistical analyses for SCE data.
Discussion
For the current study, a systematic search was conducted for standards for reporting and/or evaluating SCE studies. In total, 11 unique QSs were retrieved. We focused on randomization and data-analysis items included in these QSs. We found disagreement with respect to the inclusion of randomization of SCE studies among the 11 QSs. In the Task Force (2003) QS, the importance of randomization of SCE studies is stressed, but the randomization approach for SCE studies is confused with the randomization approach for group-comparison studies (cf. supra). In the Schlosser et al. (2009) QS, randomization is proposed to control for sequencing effects when the order of the alternating treatments is decided, but not for the benefit of later data analysis (e.g., using RTs). We agree with the QSs developed by Kratochwill et al. (2010), Romeiser-Logan et al. (2008), and Tate et al. (2008) that randomization should not be a “minimum core set” criterion for SCEs: Although the methodological quality of SCEs can be enhanced when randomization is introduced, randomization might simply not be desirable and feasible for certain SCE designs (e.g., response-guided designs). However, we think that randomization holds more promise than currently acknowledged in the retrieved QSs. In SCE studies where randomization is desirable and feasible, it brings along important advantages, such as the reduction of internal validity threats and the opportunity to use a RT.
There is agreement among the 11 QSs with regard to the importance of the visual inspection of SCE data: It appears of utmost importance to SCE researchers. However, there is disagreement about the features that should be visually inspected. The QSs developed by Kratochwill et al. (2010) and Horner et al. (2005) discuss the six variables described by Parsonson and Baer (1978) for the visual analysis of SCE data: level, trend, variability, immediacy of effect, overlap/nonoverlap, and consistency of data across phases. The nine other QSs refer to only some of these six variables (mostly level and trend).
Regarding the importance of statistical analysis of SCE data, there is still disagreement among the 11 QSs. Only four QSs include items on statistical analysis. The recently developed QS of Kratochwill et al. (2010) discusses in most depth effect sizes and parametric and nonparametric statistical analysis methods for SCEs, and provides the most thorough guidelines. Extensive work has been focused on effect size measures and statistical models for analysis of SCEs in the past years. Accordingly, it is not surprising that some of the older QSs advise SCE researchers to use statistical analysis methods and effect size measures that are “outdated.” For instance, the Task Force (2003) QS refers to the three approaches for calculating SMD effect sizes that were developed by Busk and Serlin (1992). However, meanwhile several weaknesses of these SMD effect sizes have been uncovered, and alternative SMD effect sizes have been developed for SCEs (cf. supra). Although it may not be feasible to prescribe the population of specific statistical techniques to adequately cover the diversity of data and every situation likely to be encountered (cf. Tate et al., 2008), we believe that it is appropriate for a QS to suggest some valuable statistical analysis options with the accompanying references.
With regard to data analysis, it is very likely that we will move toward QSs that advise to analyze SCEs both via visual and statistical methods. The visual inspection of SCE data offers a wealth of information. There is no statistical model currently proposed, which simultaneously incorporates the information from all visual analysis variables. However, it is advised to complement visual analysis with statistical analysis of the SCE data when there is a significant trend or variability in the baseline, in case of weak or ambiguous effects, when changes are small but important and reliable, and to control for extraneous factors (cf. Kazdin, 2011). Moreover, when a SCE study is evaluated both via visual and statistical analyses, the visual inspection of the SCE data can help specifying the statistical model and checking the model assumptions.
We are proponents of including “essential” and “additional” criteria in QSs for SCE studies. “Essential criteria” are the set of criteria that should minimally be addressed for a SCE. For instance, (a) addressing a relevant research question, (b) the internal validity of the investigation (i.e., the degree to which study design, conduct, analysis, and presentation are not distorted by methodological biases), (c) the external validity of the investigation (i.e., the extent to which study findings can be generalized beyond the participants and settings included in the study), (d) the proper analysis and presentation of findings, and (e) the ethical dimensions of the intervention under investigation (cf. Barlow, Nock, & Hersen, 2009; Gast, 2010; Jadad, 1998; Kazdin, 2011). “Additional criteria” are criteria that might enhance the methodological quality of a SCE study, but that are not essential to a SCE study. “Random assignment of measurement occasions to the levels of the independent variable(s),” “Use an appropriate statistical analysis,” and “Express the size of the effect” are examples of additional criteria. When a SCE study meets these additional criteria, the study should receive a higher methodological quality rating: Another layer of credibility and rigor is added. However, it might not always be desirable or possible to fulfill these criteria. For instance, sometimes the treatment scheduling will be entirely dependent on the data, and random assignment in the SCE design will be considered impossible or undesirable. Another possibility is that the treatment scheduling is partially dependent on the data, like in a SCE with randomization being introduced after stability of the baseline or, in a changing criterion design, after the criterion for reinforcement is met (“restricted random assignment”; Edgington, 1980).
Regarding the criterion “Express the size of the effect,” we recommend effect size reporting because of various reasons. First of all, several leading scientific organizations stress the importance of reporting effect sizes for primary outcomes in addition to reporting p values (see, for example, American Psychological Association, 2010). Effect sizes indicate the direction and magnitude of the effect of an intervention. Because effect sizes can serve as measures of the magnitude of an effect in the context of a single study as well as in a meta-analysis of multiple studies on one single topic, they are important for accumulating and synthesizing knowledge. In addition, they are also needed to guide the special education practitioner: Statistical significance tests only concern statistical significance and should not be used as indicators of clinical significance. Effect sizes can be more useful when assessing the clinical significance of behavior change. However, the construct of clinical significance exceeds calculating effect sizes: It refers to the improvement in the dependent variable as well as to the practical importance of the effect of an intervention: whether it makes a “real” difference to the person and/or to others with whom the person interacts in everyday life (Kazdin, 1999). We recommend special education researchers report effect sizes and additionally justify the choice of the metric (cf. supra for a discussion of nonoverlap effect sizes, SMD effect sizes, and regression-based effect sizes for SCEs). Researchers should also comment if underlying assumptions are met by their research designs and data. In addition, researchers should provide interpretational guidelines (e.g., metric X reveals 77% nonoverlap, accompanied by a statement whether this is medium or strong effect).
Implications for the Practice of Special Education
According to recent reviews (e.g., Heyvaert, Maes, Van den Noortgate, Kuppens, & Onghena, 2012; Heyvaert, Saenen, Maes, & Onghena, 2015; Shadish & Sullivan, 2011; J. D. Smith, 2012), a large amount of studies published in the field of special education are SCE studies. The popularity of the SCE design in this field may have several reasons. First of all, the focus of SCE research on the individual case parallels intervention and instruction in special education. SCEs render results that are easily understood by practitioners who work at the level of the individual student. In addition, a decision that is based on a sample of many students (i.e., a group-comparison study) may not be valid when applied to a specific student. Second, the limited availability of students may preclude the possibility of applying a group-comparison design. SCE research is one of the only viable options if rare or unique conditions are involved, which is often the case in the field of special education. A third reason for the growing interest in SCE research in special education is its feasibility and flexibility. A fourth reason is its small-scale design: Small-scale designs are less costly than large-scale designs and possible negative intervention effects are less harmful. For instance, it is indicated to first study the effects of a new educational curriculum, or of a new intervention for reducing challenging behavior, using a small-scale design. In several consecutive small-scale experiments, the researcher can adjust the curriculum or the intervention when it does not work in a satisfactory manner. Afterward, when the results of the small-scale experiments are promising, the curriculum or the intervention can be implemented and evaluated at a larger scale.
The current article is of primary interest for at least three groups of stakeholders in the field of special education. First, to enhance the quality of their studies and academic output, special education researchers are in need of accurate guidelines for reporting SCE studies. Second, special education practitioners are in need of critical appraisal QSs to distinguish sound from poor SCE studies and delineate what it takes for a treatment to be considered empirically supported (Schlosser, 2009). Third, special education policy makers need to minimize the risk that flawed and misleading study results are used on a large scale (Simera et al., 2008).
Summarizing our article, we formulate recommendations to the reader with regard to randomization and data analysis of SCEs. In SCE studies where randomization is feasible and logical (i.e., it is possible and appropriate to randomly assign the measurement occasions to the treatments before the data are collected), we advise special education researchers to include randomization into their SCE designs to reduce or eliminate internal validity threats (cf. supra). When complete randomization is not possible and/or desirable, it might be interesting for some SCE designs to make the treatment scheduling partially dependent on the data. When analyzing a randomized SCE design, one can use a RT to rule out the null hypothesis that there is no differential effect of the levels of the independent variable on the dependent variable.
Concerning data analysis, we advise special education researchers to engage in both visual and statistical analyses of the SCE data. All the retrieved QSs agree on the importance of visual inspection: It offers a wealth of information that is not covered by any statistical model. Particularly interesting for the special education researcher and practitioner are the QSs developed by Horner et al. (2005), Kratochwill et al. (2010), and Task Force (2003), because they offer concrete guidelines for visually analyzing SCE data. We advise special education researchers to complement the visual representation and analysis of the SCE data with the use of a statistical test or analysis, and to report an effect size estimate.
Footnotes
Declaration of Conflicting Interests
The author(s) declared no potential conflicts of interest with respect to the research, authorship, and/or publication of this article.
Funding
The author(s) disclosed receipt of the following financial support for the research, authorship, and/or publication of this article: This research was funded by the Research Foundation – Flanders (FWO).