
Abstract
We hypothesized that speakers adjust co-articulation in vowel–consonant (VC) sequences in order to provide listeners with enhanced perceptual cues to C, and that they do so specifically in those situations where primary cues to C place of articulation tend to be diminished. We tested this hypothesis in a speech production study of American English, measuring the duration and extent of VC formant transitions in five conditioning environments – consonant voicing, phrasal position, sentence accent, vowel quality, and consonant place – that modulate primary cues to C place in different ways. Results partially support our hypothesis. Although speakers did not exhibit greater temporal co-articulation in contexts that tend to diminish place cues, they did exhibit greater spatial co-articulation. This finding suggests that co-articulation serves specific communicative goals.
1 Introduction
Speech communication requires that listeners be able to interpret the signals that speakers produce. As such, “[a] desirable feature of any signaling system is the physical differentiability of the signals or ciphers it employs” (Ohala, 1996, p. 1719). Arguably, it is for this reason that the inventories of the world’s languages contain disproportionately more obstruents, compared to nasals, liquids, and glides: the idea is that obstruents sound very different from one another, so listeners can differentiate their place and manner features relatively easily (Ohala, 1996). However, the cues to obstruent identity do diminish in certain linguistic contexts, particularly for stops in syllable-final position, which are sometimes produced without the release burst that serves as the primary cue to their place of articulation (Malécot, 1958; for an overview, see Raphael, 2005). In these instances, listeners may rely on the secondary place cues present in the vowel to consonant (V to C) formant transitions (Lisker, 1999 and references cited therein).
The V to C formant transitions are the acoustic consequence of co-articulation during speech production, which occurs when two gestures overlap partially in time (Byrd, 1992; Lindblom, 1963). In the English word heap [hip], for example, the tongue gesture for [i] and the labial gesture for [p] can overlap in time; as a consequence, the formants of the vowel become lower, especially near the transition to the consonant, creating a hybrid stretch of speech that reflects both the intrinsic qualities of the vowel itself as well as the extended temporal reach of the consonant. In this paper, we will use “co-articulation” to refer specifically to this type of regressive, place-based influence of a consonant on a preceding vowel. In early work on the “articulatory undershoot model,” Lindblom (1963) showed that the co-articulatory effects on vowel formants in C1VC2 syllables vary systematically as a function of duration. Lindblom argued that the shorter the vowel, the less time speakers have to achieve the vowel target, and the greater the co-articulatory effect of adjacent consonants. So, all things being equal, shorter tokens of heap should exhibit more vowel formant lowering than longer tokens.
In later work, however, Lindblom took a different stance and argued that “
If co-articulation can enhance perceptual cues to C2 identity, and if speakers can modify the extent to which they co-articulate in order to meet communicative needs, then we predict that speakers will co-articulate more in those contexts where primary cues to C2 identity tend to be diminished. In this paper, we test this prediction in a speech production study of American English, by measuring acoustic correlates of co-articulation in C1VC2 sequences occurring in five different conditioning environments: voiceless versus voiced C2, phrase-final versus phrase-medial position, accented versus unaccented position, tense versus lax V, and alveolar versus labial C2.
For each of these environments, summarized in Table 1, previous speech production studies have reported that release burst cues to C2 place are less likely to occur in one context versus another. For example, speakers are less likely to release a voiced C2 stop (as in heed), compared to a voiceless one (as in heat), so primary place cues tend to be relatively diminished for voiced stops. Equivalent findings hold for all “Context B” examples in Table 1, compared to the analogous “Context A” examples. These previously established asymmetries in the distribution of release burst cues across contexts, reviewed in detail below, lay the groundwork for pursuing our hypothesis: in those contexts where release burst cues tend to be diminished, we predict greater co-articulation compared to analogous contexts where release burst cues tend to be preserved. In other words, to meet the needs of the communicative situation, speakers should increase co-articulation in those contexts where speakers may otherwise have the most difficulty differentiating C2 identities.
Five linguistic contexts that modulate primary release cues to C2 within a C1VC2 target word, shown in underline (capital letters indicate accent).
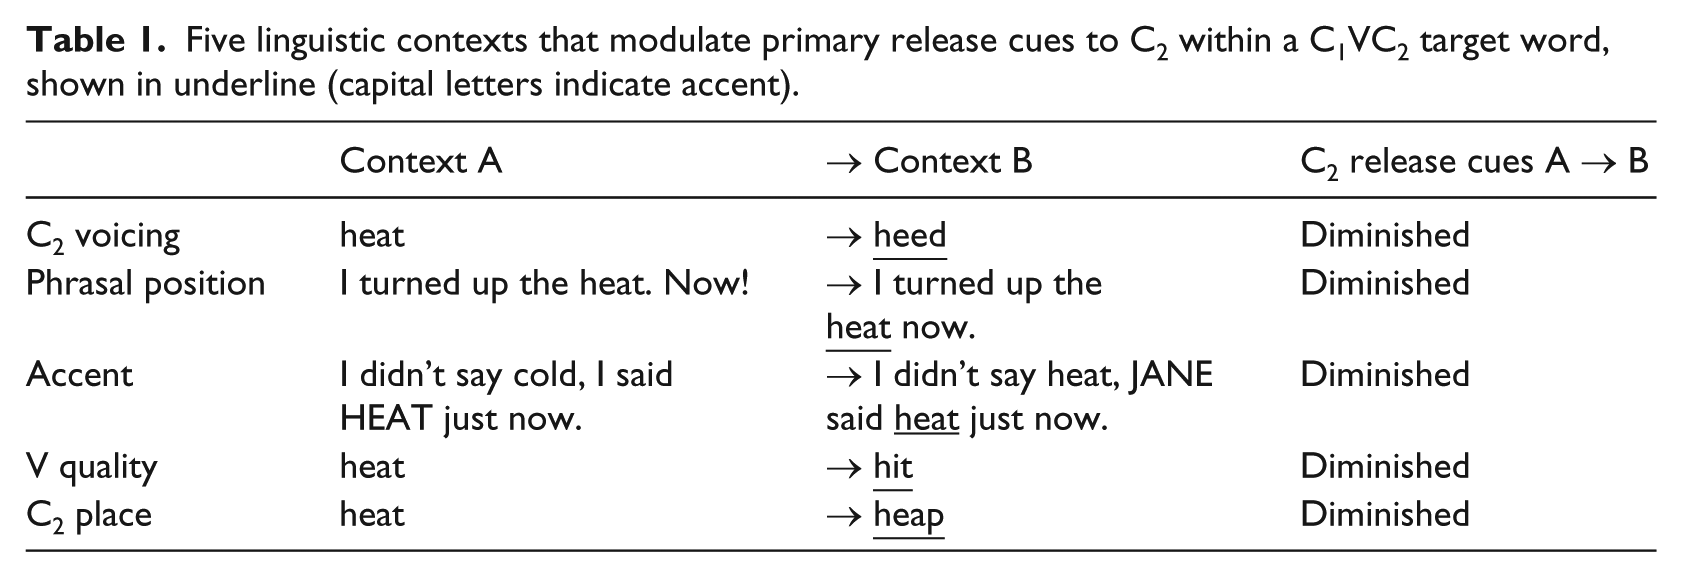
For the conditioning environment of C2 voicing, previous work shows that speakers tend to produce shorter and less intense bursts, and less frequent releases for voiced C2, compared to those for voiceless C2 (Byrd, 1993; Crystal & House, 1988a; Luce & Charles-Luce, 1985). For example, Crystal and House (1998a) report that voiced C2 is released 25.5% of the time, while voiceless C2 is released 48.5% of the time. Note that Ghosh and Narayanan (2009) report no difference in release rates for different voicing contexts, although their data were collapsed across instances in which the target C occurred word-internally and word-finally. Overall, these facts show that primary cues to C2 place tend to be diminished in voiced contexts compared to voiceless ones. On this basis, we hypothesize that co-articulation will be greater in voiced contexts compared to voiceless ones.
For phrasal lengthening, speakers tend to release stops in phrase-medial positions less frequently than in final positions. For example, Crystal and House (1988b) report that phrase-medial C2 is released 33% of the time, while phrase-final C2 is released 48% of the time. Note, however, that these overall values mask an interaction with place of articulation: alveolar consonants observe the stated pattern (medial C2: 28%, final C2: 42%), while labial consonants do not (medial C2: 23%, final C2: 0%). Similarly, Davidson (2011) reports that for North American English, phrase-medial C2 is released 33% of the time, while phase-final C2 is released 41% of the time. Again, these values mask an interaction, this time with the race of the speaker: white speakers observe the stated pattern, while black speakers exhibit similar rates of C2 release across different contexts. Note also that speakers tend to devoice segments in phrase-final positions (Haggard, 1978; Myers & Hansen, 2007 and references cited therein), so it is conceivable that a greater tendency to release in phrase-final position actually derives from a greater tendency to release voiceless stops, compared to voiced ones. Overall, then, these facts show that primary cues to C2 place tend to be diminished in medial contexts compared to final ones, although it seems likely that additional linguistic and/or social factors are at play. On this basis, we hypothesize that co-articulation will be greater in phrase-medial contexts compared to phrase-final ones.
For sentence accent, specific results for likelihood and/or quality of C2 release bursts are difficult to find. Note that accent is referred to by several different names in the literature, including “phrasal accent,” “emphatic stress,” “emphasis,” “focus,” and variations thereof, although an examination of the stimulus materials in the relevant papers shows that these generally refer to the same phenomenon, namely the placement of a target word in some sort of contrastive focus (I didn’t say string, I said BEAD.). What we do know is that accent tends, in general, to produce contrast-enhancing effects: hyper-articulated vowels, greater segmental duration and intensity, and pitch accents associated with prominence (Cole, 2015 and references cited therein). On these admittedly speculative grounds, we might expect that speakers would tend to produce shorter and less intense bursts, and less frequent releases, for unaccented C2 compared to those for accented C2. If that is the case, primary cues to C2 place would tend to be diminished in unaccented contexts compared to accented contexts. On this basis, we hypothesize that co-articulation will be greater in unaccented contexts compared to accented ones.
For vowel quality, speakers tend to release stops for lax V less frequently than for tense V. Parker and Walsh (1981) report that C2 stops after lax vowels are released 17% of the time, while C2 stops after tense vowels are released 83% of the time. Interestingly, these authors note that stop release and presence of a falling F1 transition appear to be in complementary distribution; although their focus is on cues for voice, rather than place of articulation, this finding fits with our general hypothesis that secondary cues to C2 identity are enhanced precisely whenever the primary cues diminish. These findings, adapted to our current focus, suggest that primary cues to C2 place tend to be diminished in lax vowel contexts compared to tense vowel ones. On this basis, we hypothesize that co-articulation will be greater in lax contexts compared to tense ones.
Finally, for C2 place of articulation, speakers tend to release stops for labial C2 less frequently than for alveolar C2. For example, Byrd (1993) reports that labial C2 is released 49.5% of the time, while alveolar C2 is released 57% of the time. Similarly, Ghosh and Narayan (2009) report that labial C2 is released 65% of the time, while alveolar C2 is released 78% of the time, although note again that their data collapses across word-internal and word-final positions. In addition, releases for labials tend to be shorter in duration than those for alveolars (Byrd, 1993). Note that Davidson (2011) reports an opposing pattern, in which labial C2 is released 38% of the time while alveolar C2 is released 14% of the time; as the author notes, the difference could be due to the fact that her study analyzes a speech corpus, whereas most previous studies analyze laboratory speech. Overall, these facts show that primary cues to C2 place tend to be diminished in labial contexts compared to alveolar ones. On this basis, we hypothesize that co-articulation will be greater in labial contexts compared to alveolar ones.
The five conditioning environments under investigation also correlate with changes in vowel duration, allowing us to evaluate strictly duration-based predictions. Vowels are shorter in voiceless C2 compared to voiced C2 contexts (e.g., Denes, 1955; Luce & Charles-Luce, 1985; Peterson & Lehiste, 1960), in phrase-medial compared to phrase-final contexts (Luce & Charles-Luce, 1985; Oller, 1973; Turk & Shattuck-Hufnagel, 2007), in unaccented contexts compared to accented contexts (Cho & Keating, 2009; De Jong, 2004; Turk & White, 1999), for lax vowels compared to tense vowels (Luce & Charles-Luce, 1985; Peterson & Lehiste, 1960), and for labial C2 compared to alveolar C2 contexts (Luce & Charles-Luce, 1985). These environments therefore provide us with the opportunity to evaluate our working hypothesis with respect to the articulatory undershoot model, which would predict greater co-articulation in those instances where V is shorter.
There are two semi-independent means by which speakers could modulate co-articulation in order to meet the communicative needs of a particular context: by increasing its temporal extent (i.e., elongating the hybrid stretch of co-articulatory speech), or by increasing its spatial extent (i.e., bringing the articulators closer to the target position for C2). Greater temporal co-articulation provides listeners with longer amounts of time to perceive cues associated with C2, so we predict that in contexts where primary cues to C2 place tend to be diminished, speakers will maintain overlap between V and C2 gestures for longer periods of time. To test this prediction in the acoustic record, we measured the duration of VC2 formant transitions, and their relationship to overall V duration. Meanwhile, greater spatial co-articulation provides listeners with more informative cues associated with C2, so we predict that in contexts where primary cues to C2 place are diminished, speakers will more closely approximate C2 target articulations during the V. To test this prediction in the acoustic record, we measured the formant values in VC2 transitions, and their relationship to inherent formant values for V. Note that the temporal and spatial extents of co-articulation are somewhat dependent on one another, in the sense that a given spatial change will require some minimum duration in which to be realized. Beyond this minimum, however, the temporal and spatial extents of co-articulation are independent of one another: a given stretch of co-articulatory speech can change duration without concomitant changes in formant values, or change formant values without concomitant changes in duration. For this reason, the current study analyzes both temporal and spatial variables, and reports them independently.
The idea that different linguistic contexts modulate co-articulation has been explored before, for neighborhood density (Scarborough, 2013) and also for sentence accent, where a number of studies have reported reduced co-articulation in accented positions compared to unaccented ones (Cole, Choi, & Kim, 2004; Duez, 1992; Krull, 1988, 1989; Lindblom et al., 2007; see also Lindblom, Sussman, & Agwuele, 2009; Moon & Lindblom, 1994). Although many of these studies invoke Lindblom’s (1990) general premise of listener-oriented outputs, their motivations and methodologies are otherwise quite different from those of the current study. To begin with, these studies essentially view co-articulation as a perceptual problem to be solved, rather than a perceptual benefit to be provided. This view originates from a focus on the effects of vowels on consonants, for example, in CV sequences, where co-articulation does indeed appear to be problematic because acoustic cues to C place, such as C-to-V formant transitions, differ notably across V contexts (Stevens & Blumstein, 1978). The methodology of locus equations solves this problem (Iskarous, Fowler, & Whalen, 2010; Lindblom & Sussman, 2012), and many previous studies explicitly compare locus equation slopes and intercepts across conditions.
By contrast, the current study views co-articulation as a perceptual benefit, a view that derives from our focus on the effects of consonants on vowels, rather than vice versa. Unlike consonants, vowels have acoustic cues that are readily identifiable, straightforwardly quantified as F1 and F2 values, and that vary comparatively little across C contexts. From a methodological perspective, this means that we can analyze vowel acoustics in simple terms of F1 and F2, without locus equations. Furthermore, because co-articulation in these contexts appears to have a neutral effect on the perception of vowels while helping, and not hindering, the perception of upcoming consonants (Ali et al., 1971 and previously cited works), we cast our hypotheses in very different terms. While other studies sought to define the conditions under which speakers deliberately separate C1 and V gestures so as to avoid changing the cues for C1, the current study seeks to define the conditions under which they deliberately co-articulate V and C2 gestures so as to spread and enhance the cues for C2.
2 Method
2.1 Stimuli
Stimulus sentences were designed to cross two of the key predictor variables of the study: phrasal position of the target word (final versus medial); and sentence accent of the target word (accented versus unaccented). This is depicted in Table 2, where the target words are underlined and the accented words are in capitals.
Design of stimulus sentences, crossing factors of phrase position (final vs. medial) and accent (accented vs. unaccented).
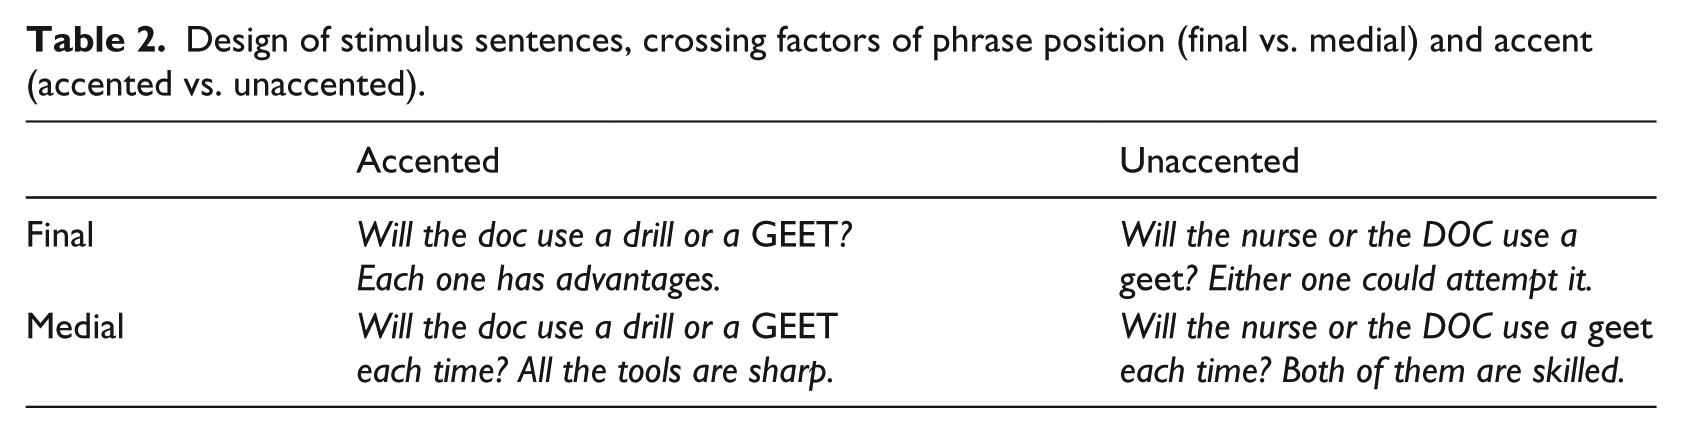
Eight nonsense words containing the measured V were embedded into each stimulus set, represented orthographically as geet, geed, geep, geeb, git, gid, gip, gib and phonetically as [git], [gid], [gip], [gib], [gɪt], [gɪd], [gɪp], [gɪb]. These words crossed the three additional predictor variables of the study, voicing for C2 (voiceless versus voiced), vowel quality for V (tense versus lax), and place-of-articulation for C2 (alveolar versus labial).
For the initial consonant, we used [g] because it produced a nonsense word in all eight positions; furthermore, the specific phonetic characteristics of initial consonants do not exhibit a significant effect on the duration of the following vowel (Port, 1981). The advantage of using nonsense words is that we avoided effects of word frequency or familiarity on phonetic variables (Gahl, 2008; Pierrehumbert, 2002). Disadvantages are that speakers may pronounce them somewhat differently than real words, and since only a single set of such C1VC2 nonsense words was constructed, our analysis runs the risk of being item-specific. For the vowel, we used [i] and [ɪ] because they have intrinsically high F2 values, allowing us to use lowered F2 values as a measure of the co-articulatory effects of a following consonant. For the sentences themselves, we used questions, rather than statements, as the first sentence in each pair in order to elicit high boundary tones and therefore higher F0 at the end of the phrase, which helps to prevent creaky voice in this position.
Because each nonsense word was embedded into four different stimulus sentences, this produced a total of 8 x 4 = 32 stimuli. Each stimulus sentence contained a total of 16 syllables. The target word was always the ninth syllable, and it was always preceded by the vowel [ə] (lexical item a) and followed by the vowel [i] (lexical items each and either). (Participants sometimes used the pronunciation [ajðə˞]. When they did so, the experimenter asked them to use [iðə˞] instead, which created a somewhat unnatural situation but nevertheless controlled for phonetic environment.)
Thirty-two filler stimuli were also constructed, in four sets of eight sentences. Each set crossed the factors of phrasal position and accent in the same way as the targets. The first filler set had identical sentence structures to the target, but with different target words (Will the doc use a drill or a VIP each time? All the tools are sharp). The second set had sentence structures with coordination instead of contrastive focus (Will the doc use a drill and a geet each time? Both tools are handy). The third set used contrastive focus in a statement, rather than in a question.(The doc won’t want a drill, but a GEET each time. It is much faster). The fourth used coordination in statements without contrastive focus (The doc will want a drill and a geet each time. Both items are new).
In all but the first set of filler stimuli, the sentence sets sometimes occurred with a target word and sometimes with a filler word. Four types of filler words were used: those that differed from the target in the initial consonant (vit, vid,…); those that differed in vowel quality (gut, gud,…); those that differed in the final consonant (gif, giv,…); and those which bore no resemblance to the targets (zal, zar,…). In all sets of filler stimuli, the nouns nurse and doc were used about one-fourth of the time, but replaced in a balanced fashion with the nouns guy and gal, vet and tech, and maid and man.
For each target and filler sentence, a prompt sentence was also constructed, to be read aloud by the experimenter. The prompt sentence was always a statement designed to elicit contrastive focus on the part of the participant, and appeared in curly brackets just above the participant’s sentence. For example:
{The doc will use a drill each time.}
Will the doc use a drill or a GEEP each time? All the tools are sharp.
{The nurse will use a gib}.
Will the nurse or the DOC use a gib? Either one could attempt it.
For those filler sentence sets that did not use contrastive focus, the generic prompts {Tell me something} and {Ask me a question} were used.
In pilot testing without prompt sentences, speakers often failed to place contrastive focus on the correct item, particularly toward the end of the session as their interest waned. Adding prompt sentences in a dialogue format remedied this problem. A potential disadvantage to this approach is that participants may have subtly adjusted their pronunciations to those of the experimenter (the phenomenon of “phonetic convergence,” Pardo, 2006). To our knowledge, however, no previous work has suggested that speakers converge in duration or extent of co-articulation; even if they do, it seems unlikely that convergence could account for differences in co-articulation across conditions, because the experimenter did not produce the full range of contrasts that the participants did (e.g., the experimenter produced no sentences in the accented condition).
2.2 Participants
The participants were 16 native speakers of North American English between the ages of 18 and 40, enrolled in undergraduate or graduate degree programs. Three participants were male, and 12 female. Five participants originated from the northeast area of the United States, and were recorded at the University of Massachusetts, Amherst. The remaining 11 participants originated from the Midwest, and were recorded at the University of Wisconsin, Milwaukee. All of the speakers were white. None had a strong regional accent, and none reported problems with hearing, speech, or language. Inspection of the data revealed no significant differences between speakers from the two different dialect regions, nor among speakers of different ages. Data from one female participant, age 21, were excluded because she was unable to produce the intended pattern of contrastive focus. Data from the remaining 15 speakers were included in the analysis.
2.3 Procedure
Four different printed lists were prepared. Each list contained a different order of the 64 sentence sets (32 targets plus 32 fillers). The order of sentence sets was random, except that the first and last sentence set to appear on each printed page was always filler. Participants were assigned to a list in a balanced fashion, so that each list was used (approximately) equally often.
Participants were run individually. Before recording, the experimenter introduced all of the nonsense words to the participant, and the participants practiced pronouncing them aloud. One of the 15 included subjects experienced some initial difficulty with these pronunciations, which was quickly remedied with another practice round. The remaining 14 subjects did not experience difficulty. The experimenter also introduced the various sentence types to each participant, and the participants practiced pronouncing them aloud in response to experimenter prompts. All participants quickly succeeded at this.
During recording, both the experimenter and the participant were seated at a comfortable speaking distance from one another. The participant wore a head-mounted, uni-directional microphone. Four recordings took place in a quiet room, and the remaining 11 took place in a sound-proof booth. After the first iteration of the list was completed, participants took a short break, and then produced a second iteration; thus, each participant produced two list repetitions. If a participant made an error, the experimenter initiated another trial; this ensured a proper recording of two repetitions of all stimuli and hence no missing cells for the analysis of variation (ANOVA). The audio recordings were digitized at a sampling rate of 44.1 kHz, and stored electronically as WAV files for further analysis.
2.4 Measurements
The vowel of interest was the V in the C1VC2 nonsense words, that is [i] in words like geet [git] and geed [gid] and [ɪ] in words like git [gɪt] and gid [gɪd]. Segmentation and measurement of vowels took place in Praat. The onset of the vowel was defined at the first glottal pulse showing evidence for F2. The offset of the vowel was defined at last cycle associated with last glottal pulse showing evidence for F2. Using procedures adapted from Summers (1987), we used a Praat script to divide each vowel into two components: steady state; and transition to the following consonant. First, the script identified the maximum F2 value between the vowel onset and the vowel offset. Then, it calculated the total difference between the maximum F2 and the offset F2. Next, it established a cut-off F2 value, which was defined as the offset F2 plus 80% of the total difference in F2. Finally, the script found the first time point in the vowel where the F2 value was less than the cut-off value, and used this time point to demarcate the steady state from the transition.
For example, in Figure 1A, which depicts formants from a tense vowel [i], the maximum F2 is 2379 Hz and the offset F2 is 1689 Hz. The difference between these values is 690 Hz, which is one way to represent the total amount of F2 change that occurs in the vowel. The cut-off value, calculated as offset F2 + 0.80(maximum F2 – offset F2), here is 1689+0.80(690) = 2241 Hz. This F2 value is 165.8 milliseconds into the vowel, and this time point therefore demarcates the steady state from the transition. In Figure 1B, which depicts formants from the lax vowel [ɪ], the same procedure produced a cut-off value of 2014 Hz, and a time point of 55.0 ms to demarcate the steady state from the transition.
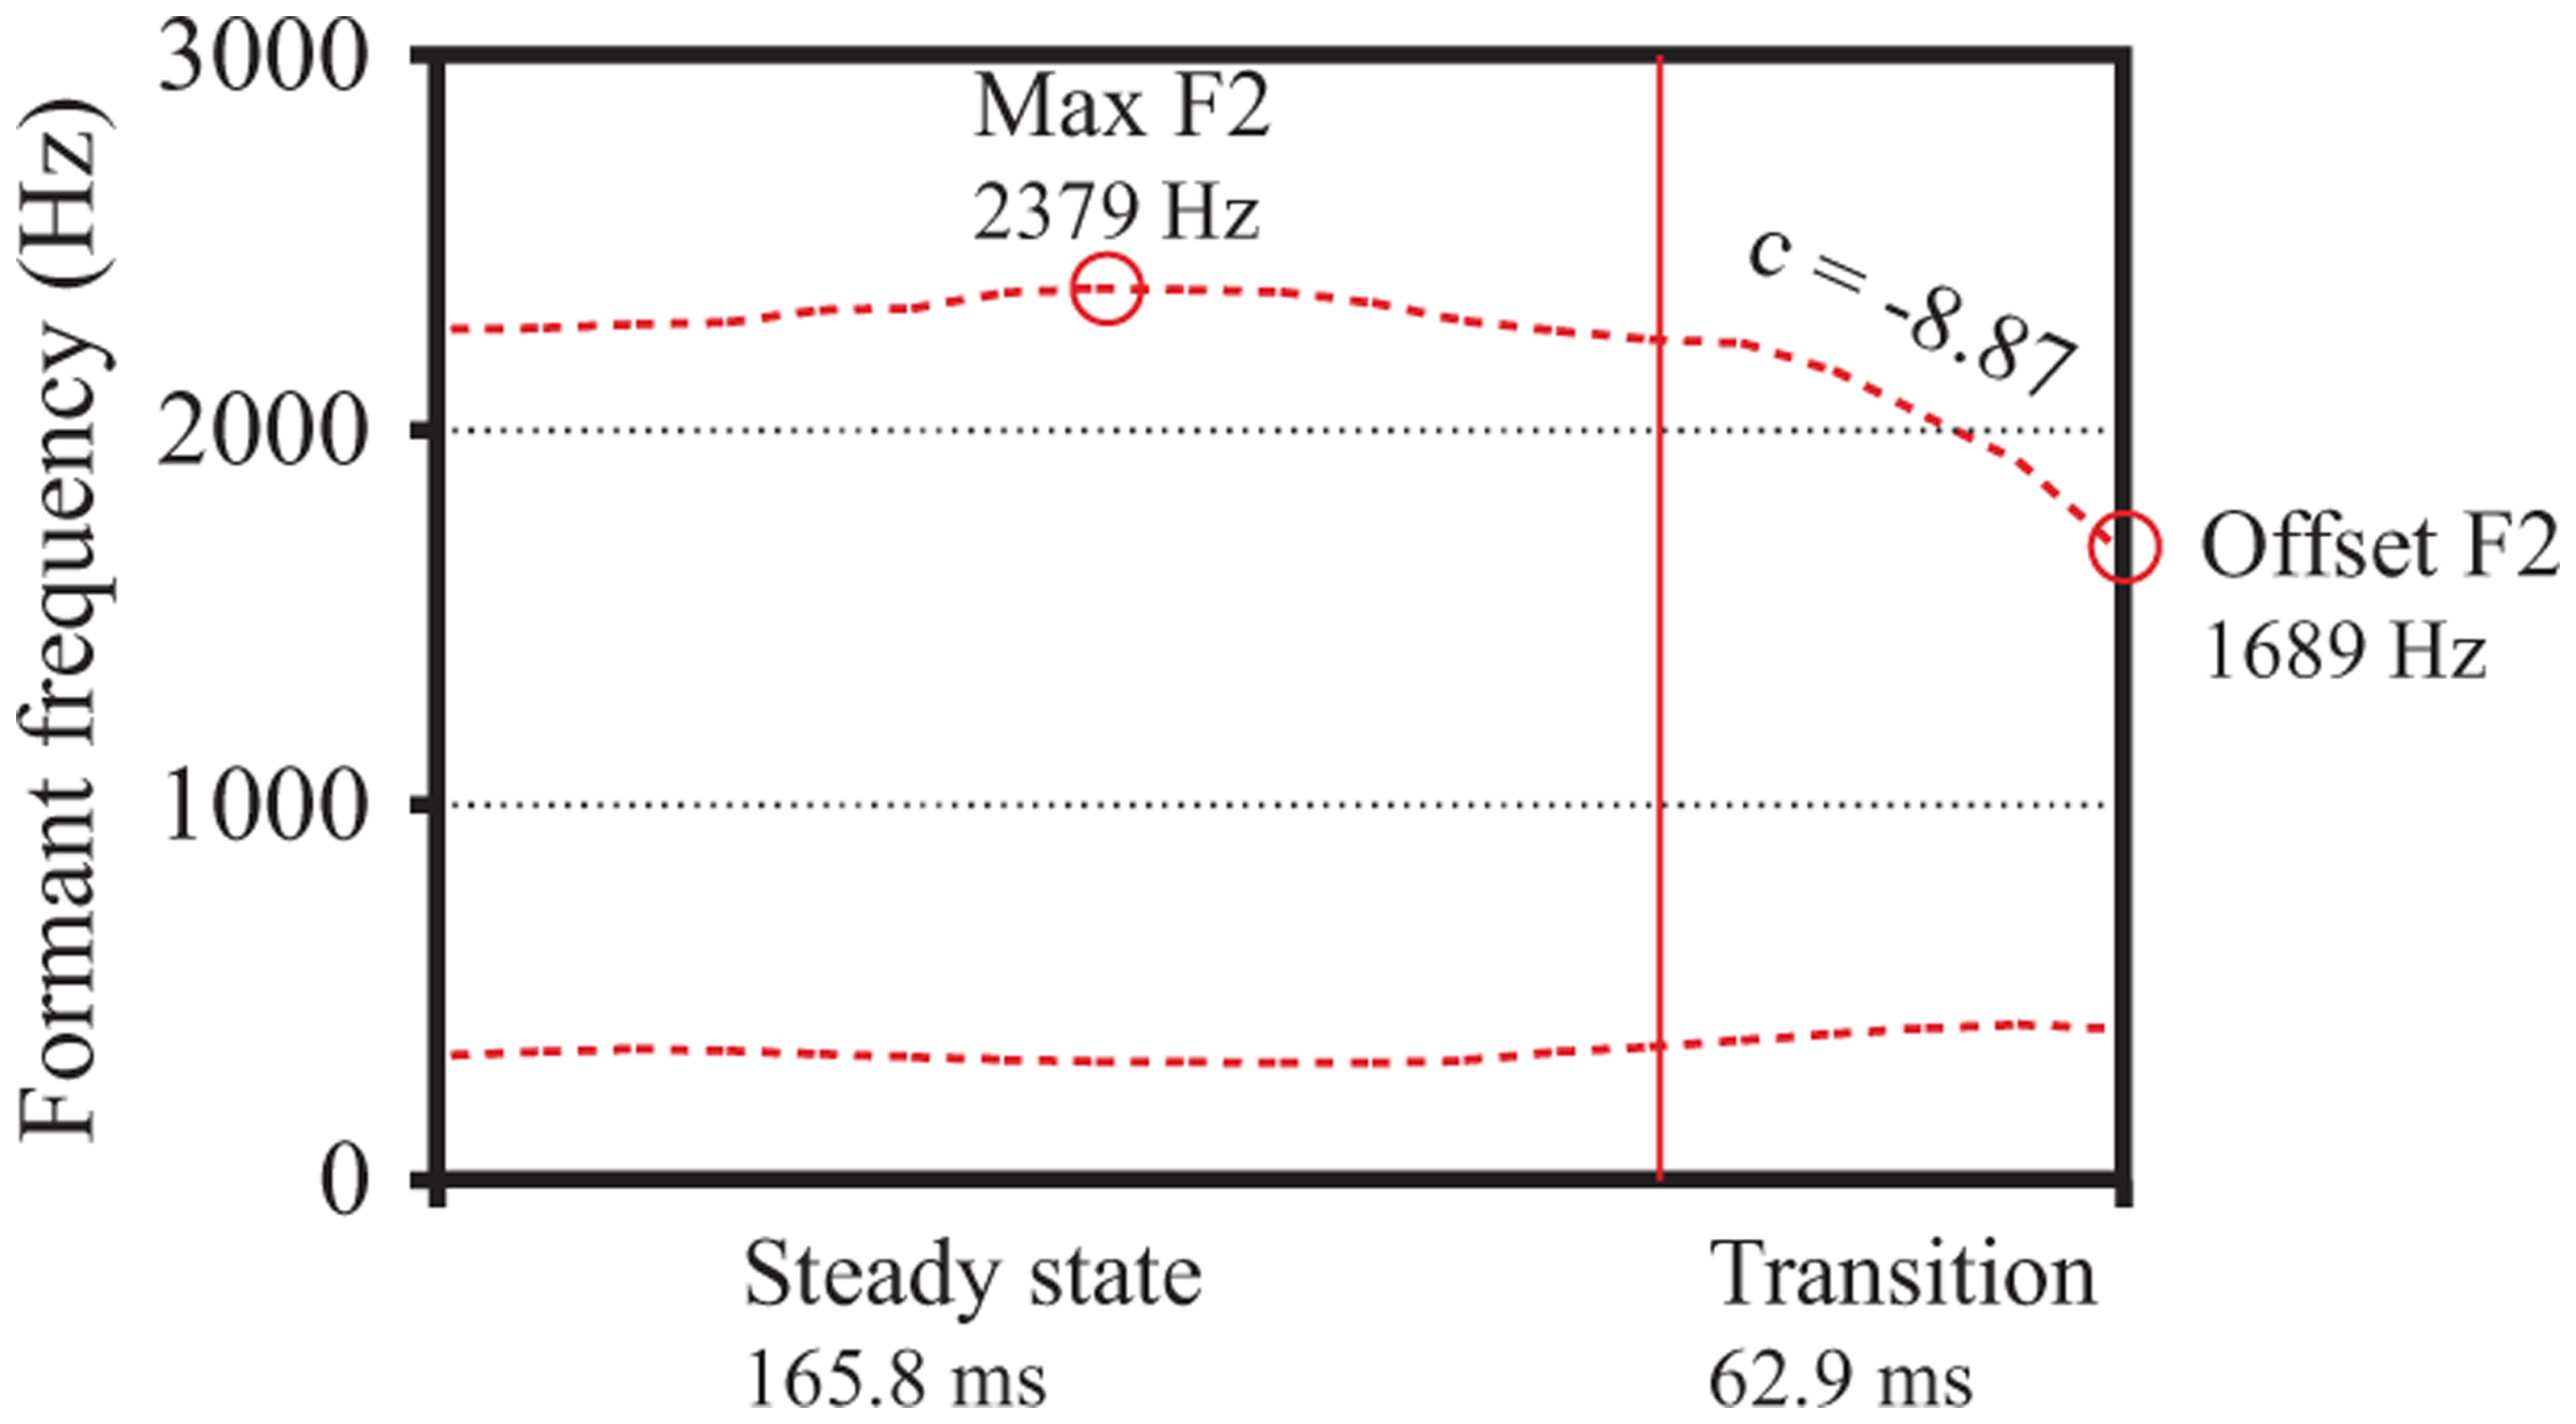
Acoustic landmarks for geeb [gib] in final position, unaccented.
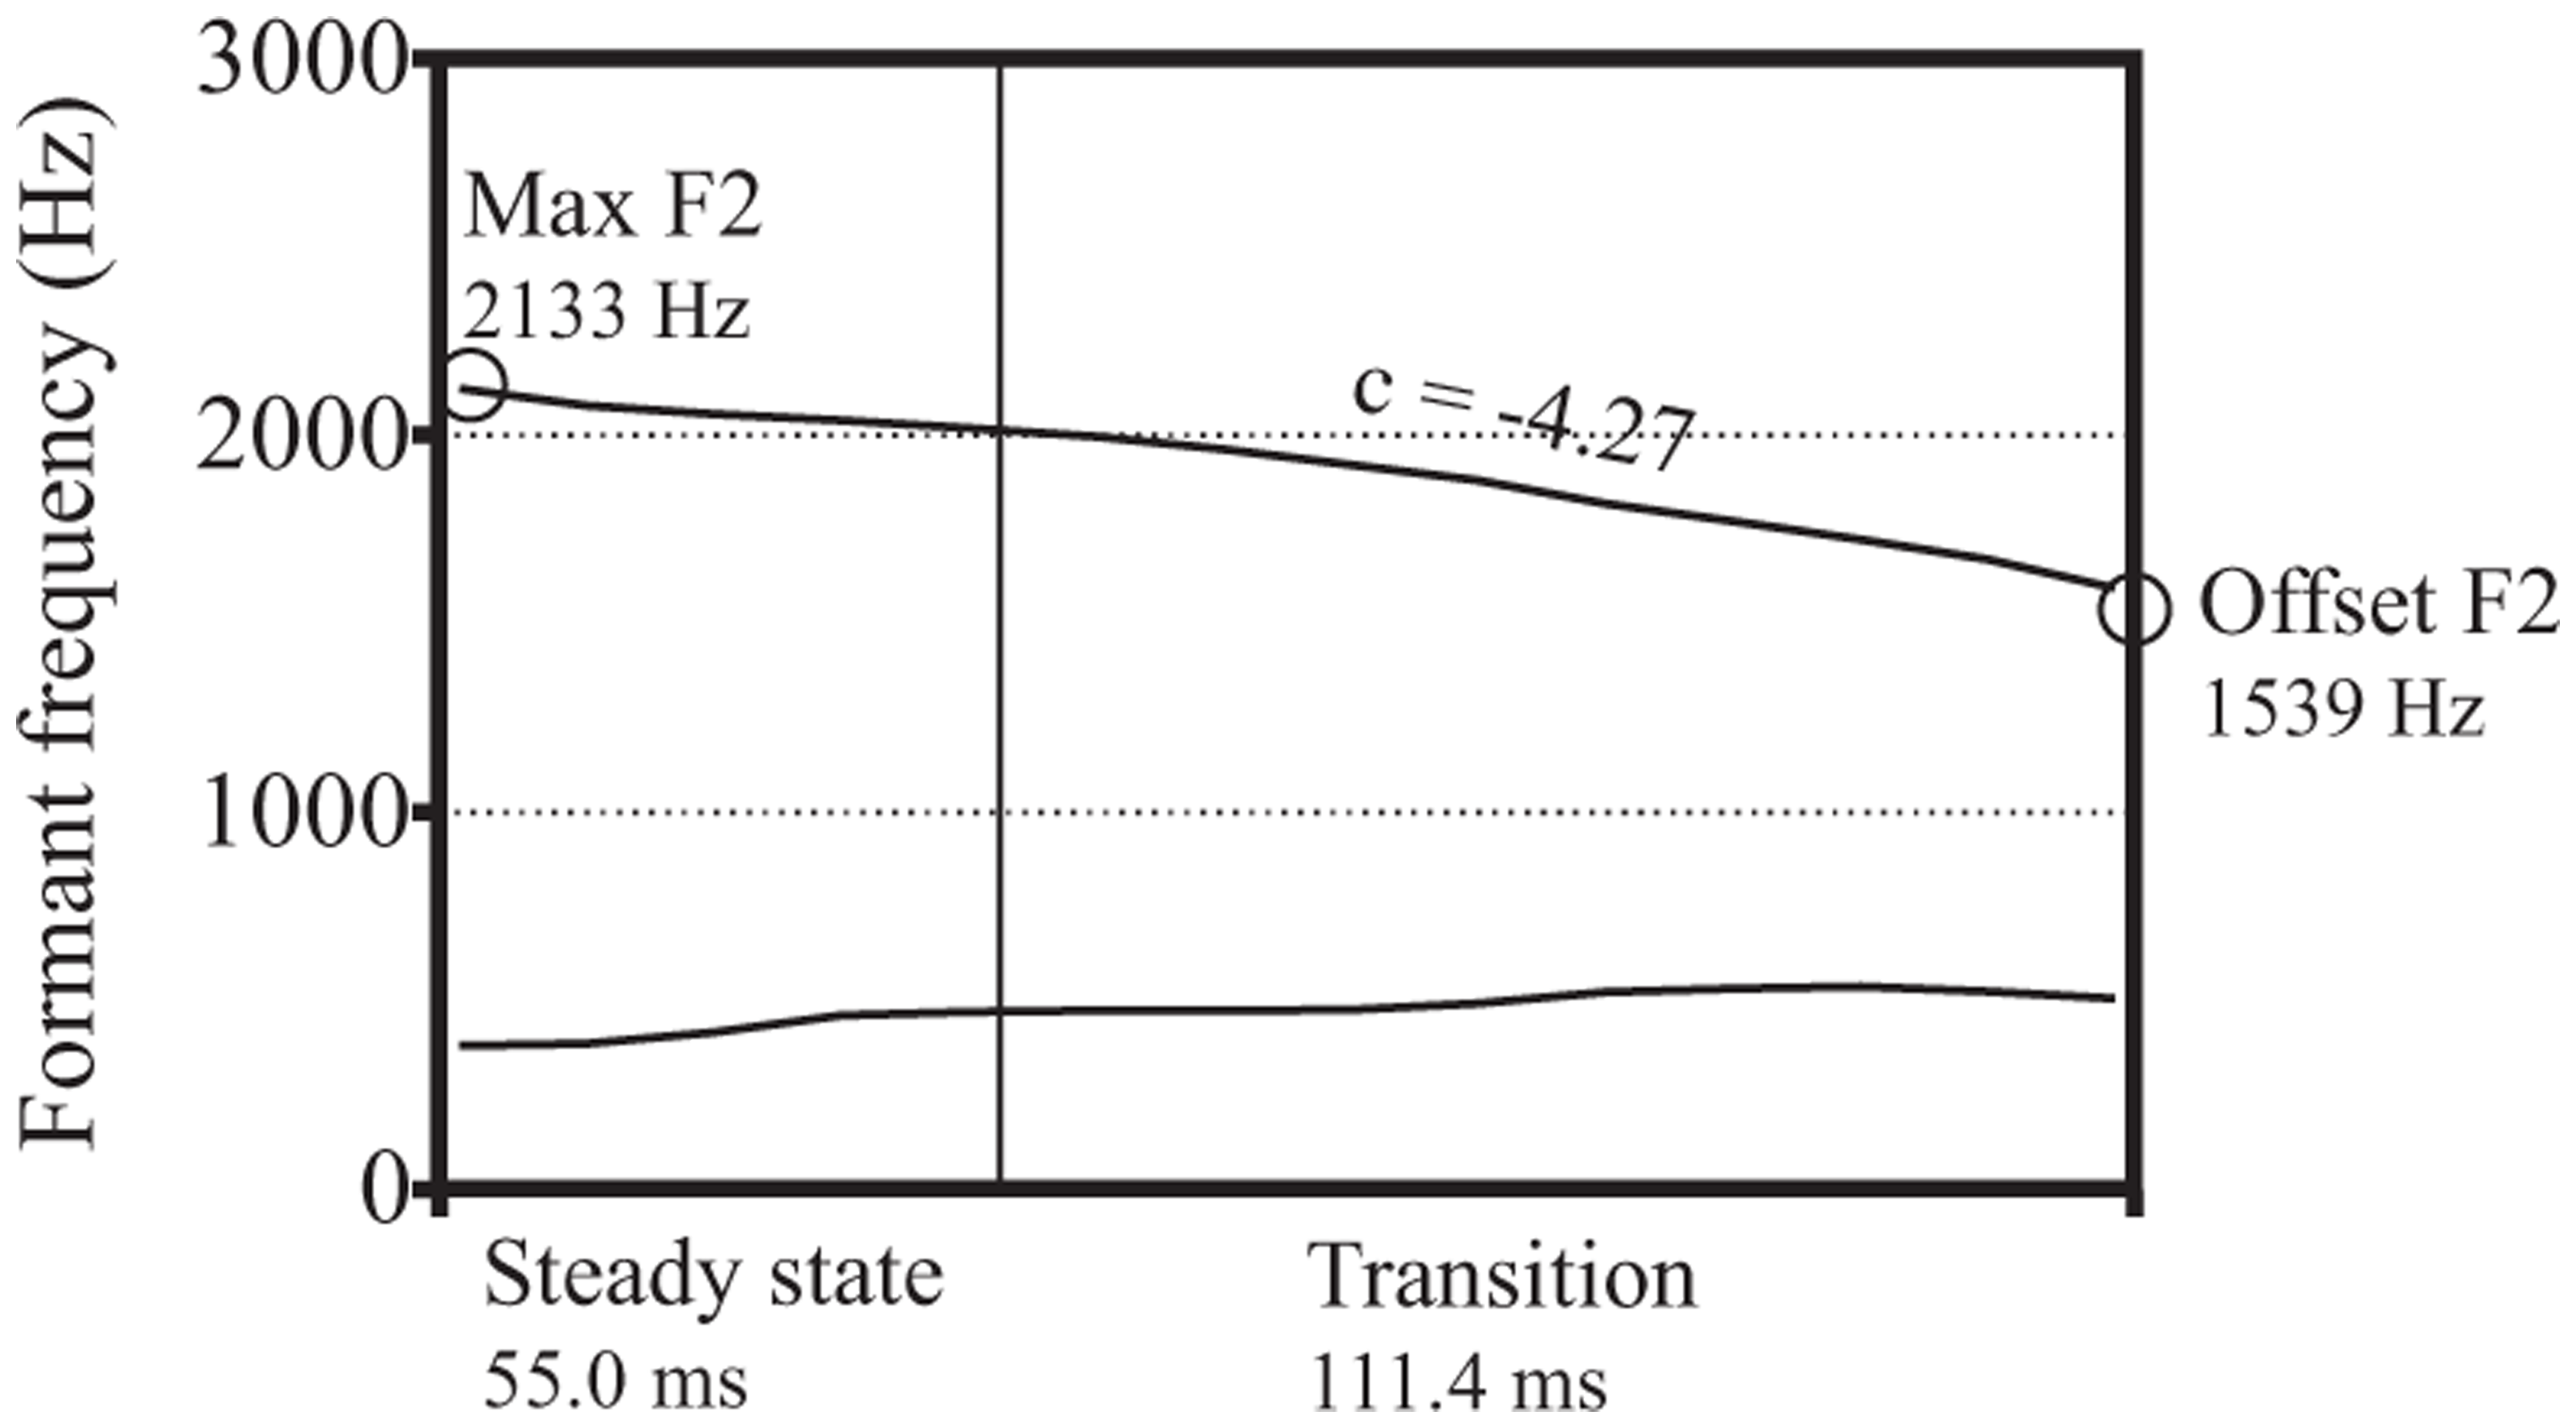
Acoustic landmarks for gib [gɪb] in final position, unaccented.
After the script had demarcated each vowel in this way, it calculated five measurements that were used as outcome variables. The first measurement, duration, quantified the amount of vowel lengthening that occurred in each process. The next two measurements, transition duration and transition proportion, quantified changes in temporal extent of co-articulation, indicating how much of the vowel’s duration shows evidence of co-articulation with the following consonant. Transition duration is simply the length, in milliseconds, of the transition period. Transition proportion is a normalized measure, indicating how much of the vowel’s total duration is occupied by the transition versus the steady state. The most straightforward way to calculate this value is to divide transition duration by total duration, but this produces a value that is bounded by 0 and 1, which is inappropriate to analyze with ANOVA (Jaeger, 2008). Therefore, we calculated a “stand-in” ratio, as follows:

Smaller values for transition proportion mean that relatively more of the vowel’s duration consists of steady-state F2, versus larger values which mean that more of the duration consists of transitioning F2. For example, the transition proportion for the vowel in Figure 1A is (62.9 ms / 165.8 ms) = 0.40, which is relatively small, while for Figure 1B the value is (111.4 ms / 55.0 ms) = 2.03, which is relatively large.
The final two measurements, offset F2 and F2 ratio, quantified changes in the spatial extent of co-articulation, indicating how much the vowel’s formant values were altered by co-articulation with the following consonant. Offset F2 is a measure of the extent to which the coda consonant’s target articulation is achieved during the vowel, independently of the vowel’s intrinsic F2 values. In Figure 1A, for example, the value for offset F2 is 1689 Hz, while in Figure 1B it is 1539 Hz. The presence of consonants flanking a vowel generally centralizes its F2 values (for the high vowels under examination in this study, this means that F2 lowers), and labial consonants do so relatively more than alveolar consonants. F2 ratio is a normalized measure, indicating the extent to which C2 changes the intrinsic F2 of the vowel, and we calculated it as follows:

Values for F2 ratio that are close to 1 indicate that the F2 of the vowel changes relatively little as the transition to the consonant occurs, while values greater than 1 indicate that the formants change relatively more. The vowel in Figure 1A has an F2 ratio of (2379 Hz/1689 Hz) = 1.41, while that in Figure 1B has an F2 ratio of (2133 Hz/1539 Hz) = 1.39.
2.5 Predictions
The predictions of this study are summarized in Table 3. Essentially, we predict that the temporal extent of co-articulation, as measured by transition proportions, will be greater in each Context B, compared to the analogous Context A. Likewise, we predict that the spatial extent of co-articulation, as measured by F2 ratios, will be greater in each Context B, compared to the analogous Context A. These predictions will be evaluated in the statistical analysis, which explicitly compares the values produced in Context B versus Context A, and assesses whether they differ significantly from one another.
Predicted outcomes of the study, as conditioned by five predictor variables.
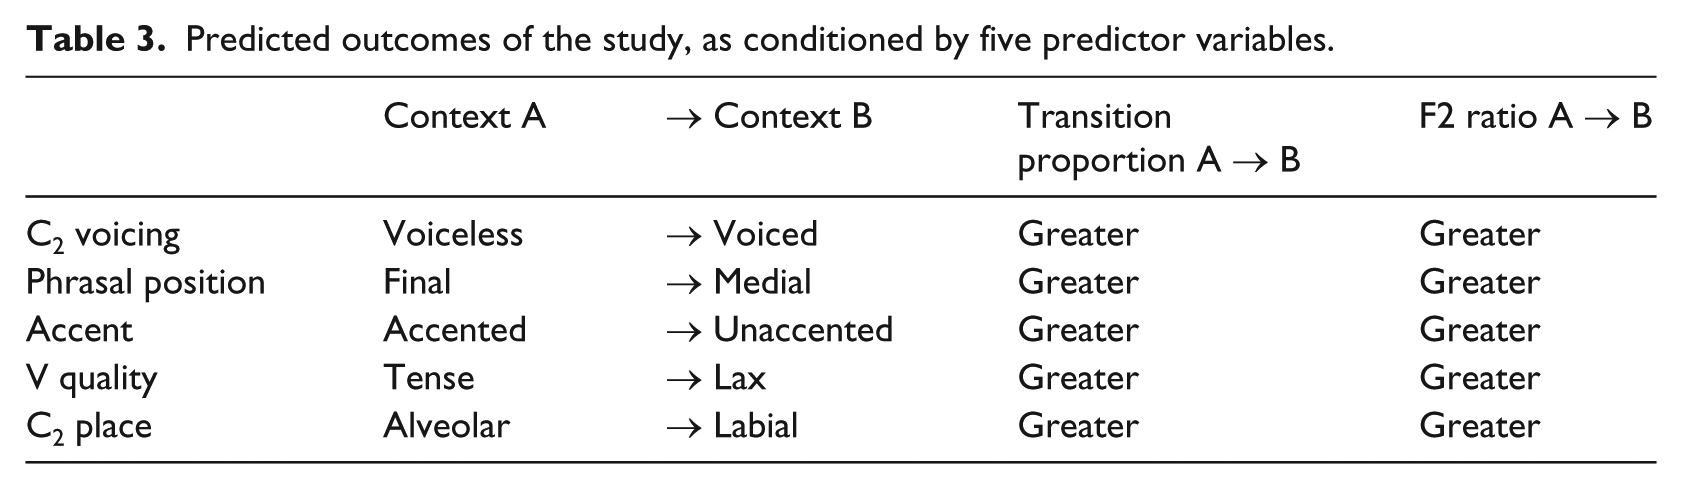
We have framed these predictions according to the two normalized measures that we employ, namely transition proportion and F2 ratio, specifically in order to facilitate comparisons across conditions (e.g., voiceless vs. voiced contexts). This is because we expect our absolute measures, namely transition duration and F2 offset, to vary across conditions in ways that are not directly relevant to our hypothesis. For example, absolute transition durations are likely to be shorter in voiceless C2 compared to voiced C2 contexts, simply because inherent V durations will be shorter in voiceless C2 compared to voiced C2 contexts. In a similar vein, absolute offset F2 values are likely to be lower in lax V compared to tense V contexts, simply because inherent F2 values will be lower in lax compared to tense contexts. Because we are predicting that the temporal and/or spatial extent of co-articulation will be greater in Context B compared to Context A regardless of these inherent differences, we state our key predictions in terms of normalized measures that, to the extent possible, filter out such differences. As we will see, however, a complete interpretation of these normalized measures sometimes requires reference to the absolute measures as well.
3 Results
3.1 Descriptive statistics
A total of 960 vowels were analyzed (= 32 stimuli x 15 participants x 2 repetitions). Figure 2 summarizes the descriptive statistics using schematized F2 trajectories for all five conditioning environments (cell means and standard deviations for each condition are in the Appendix). In each panel of Figure 2, the solid line represents the vowel in Context A, while the dotted line represents the vowel in Context B. Each trajectory depicts the mean values in our data for steady-state duration, transition duration, cutoff F2, and offset F2. In addition, the mean value for Maximum F2 and its time point is depicted with a dot.
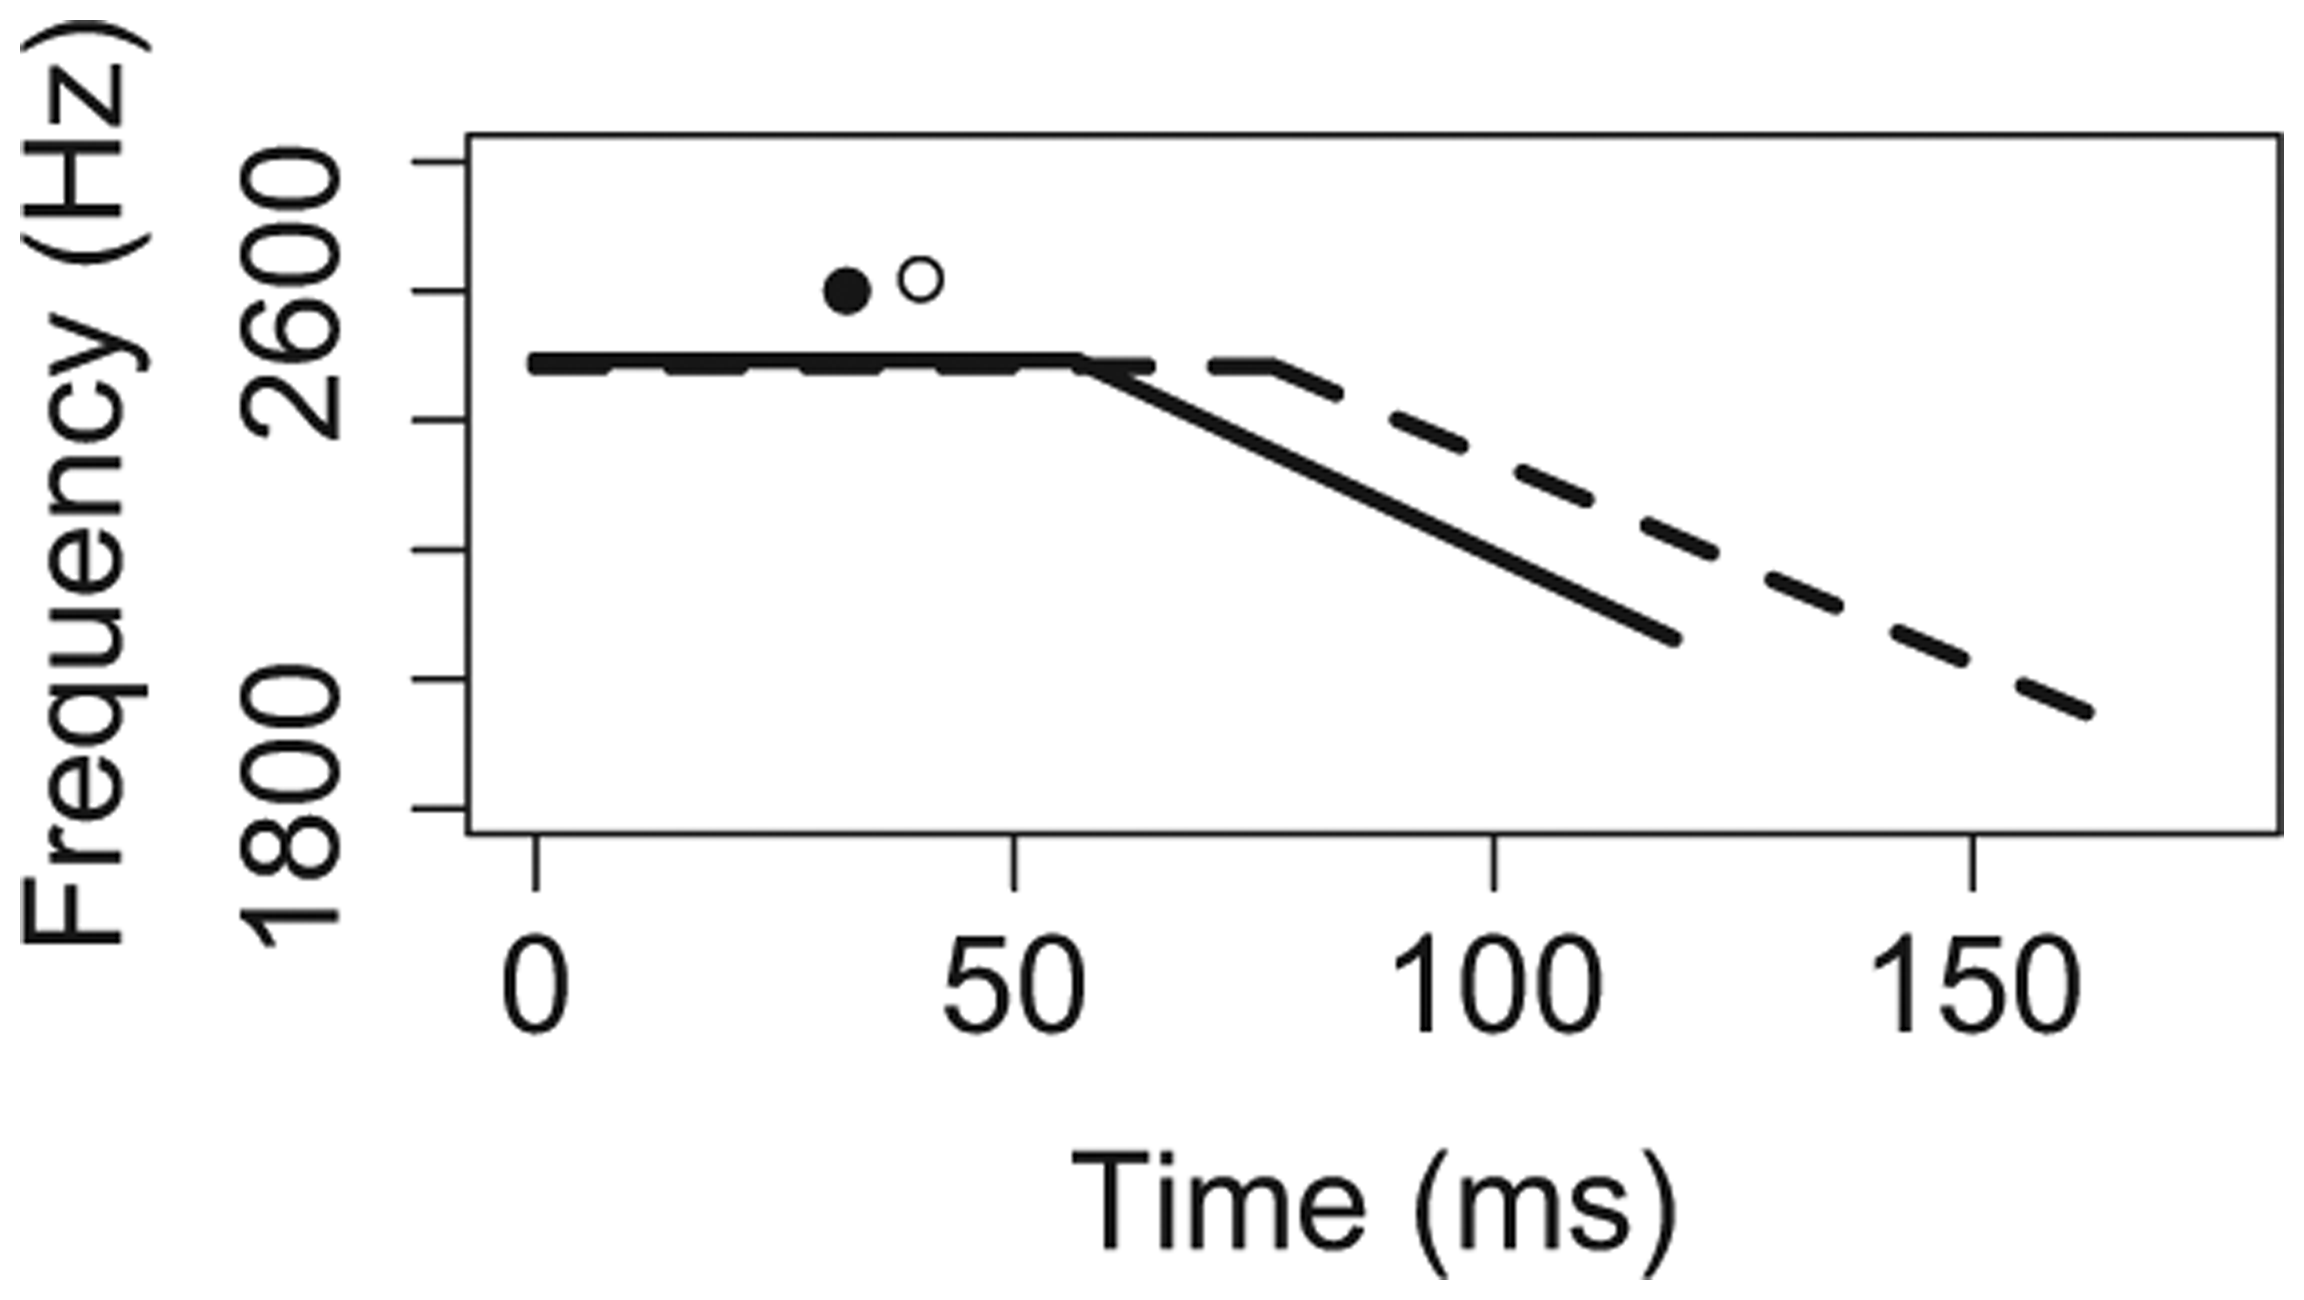
Consonant voicing.
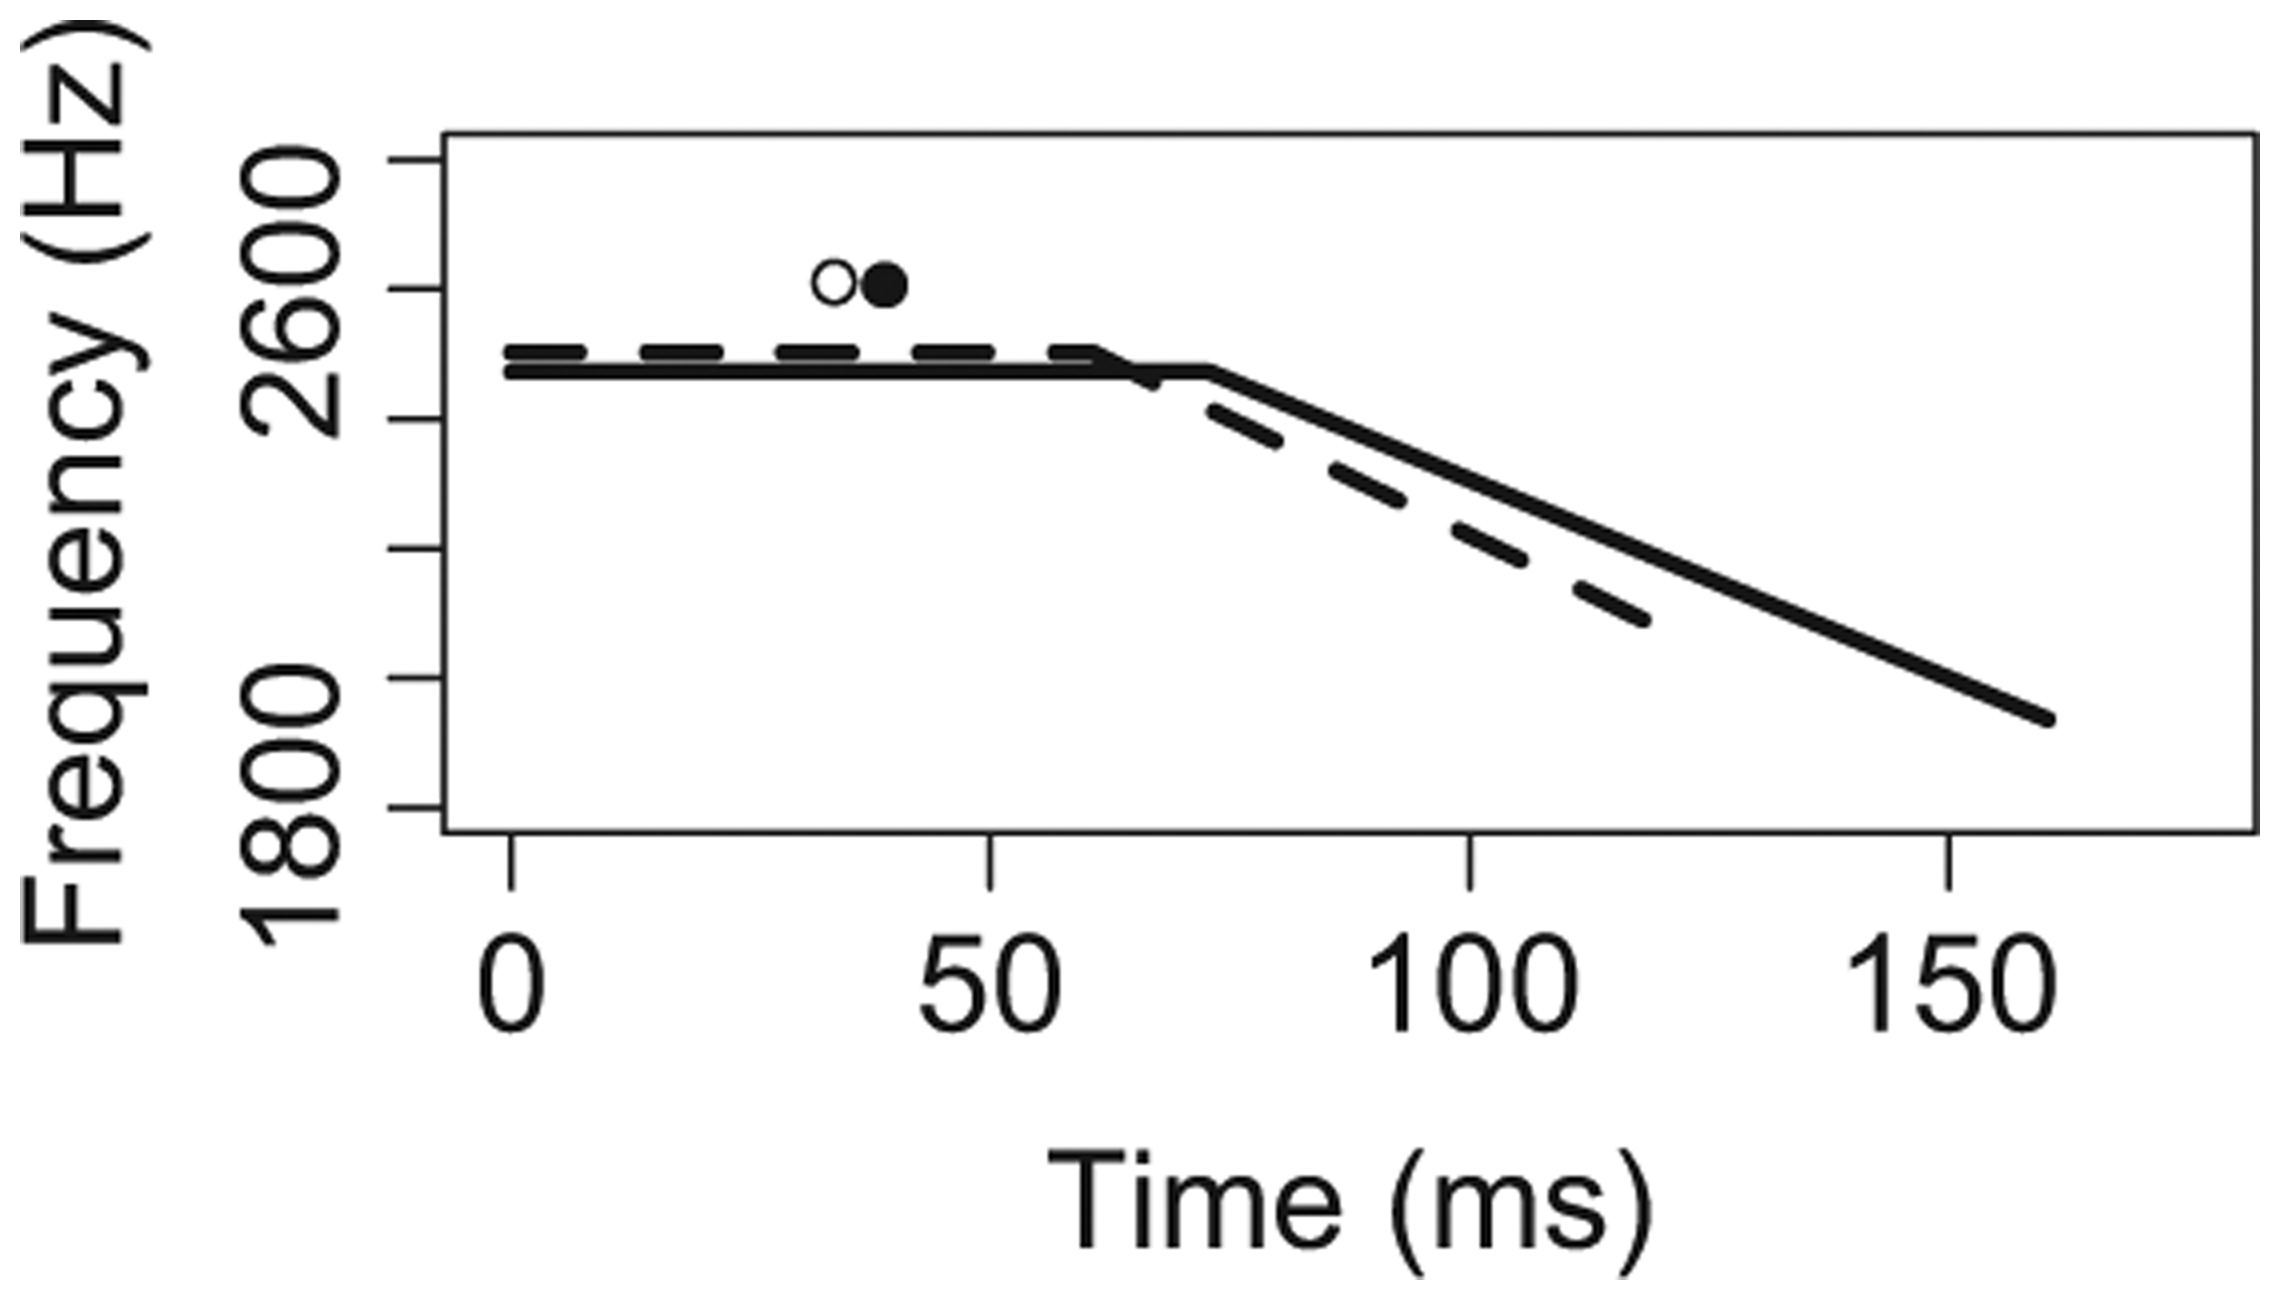
Phrasal position.
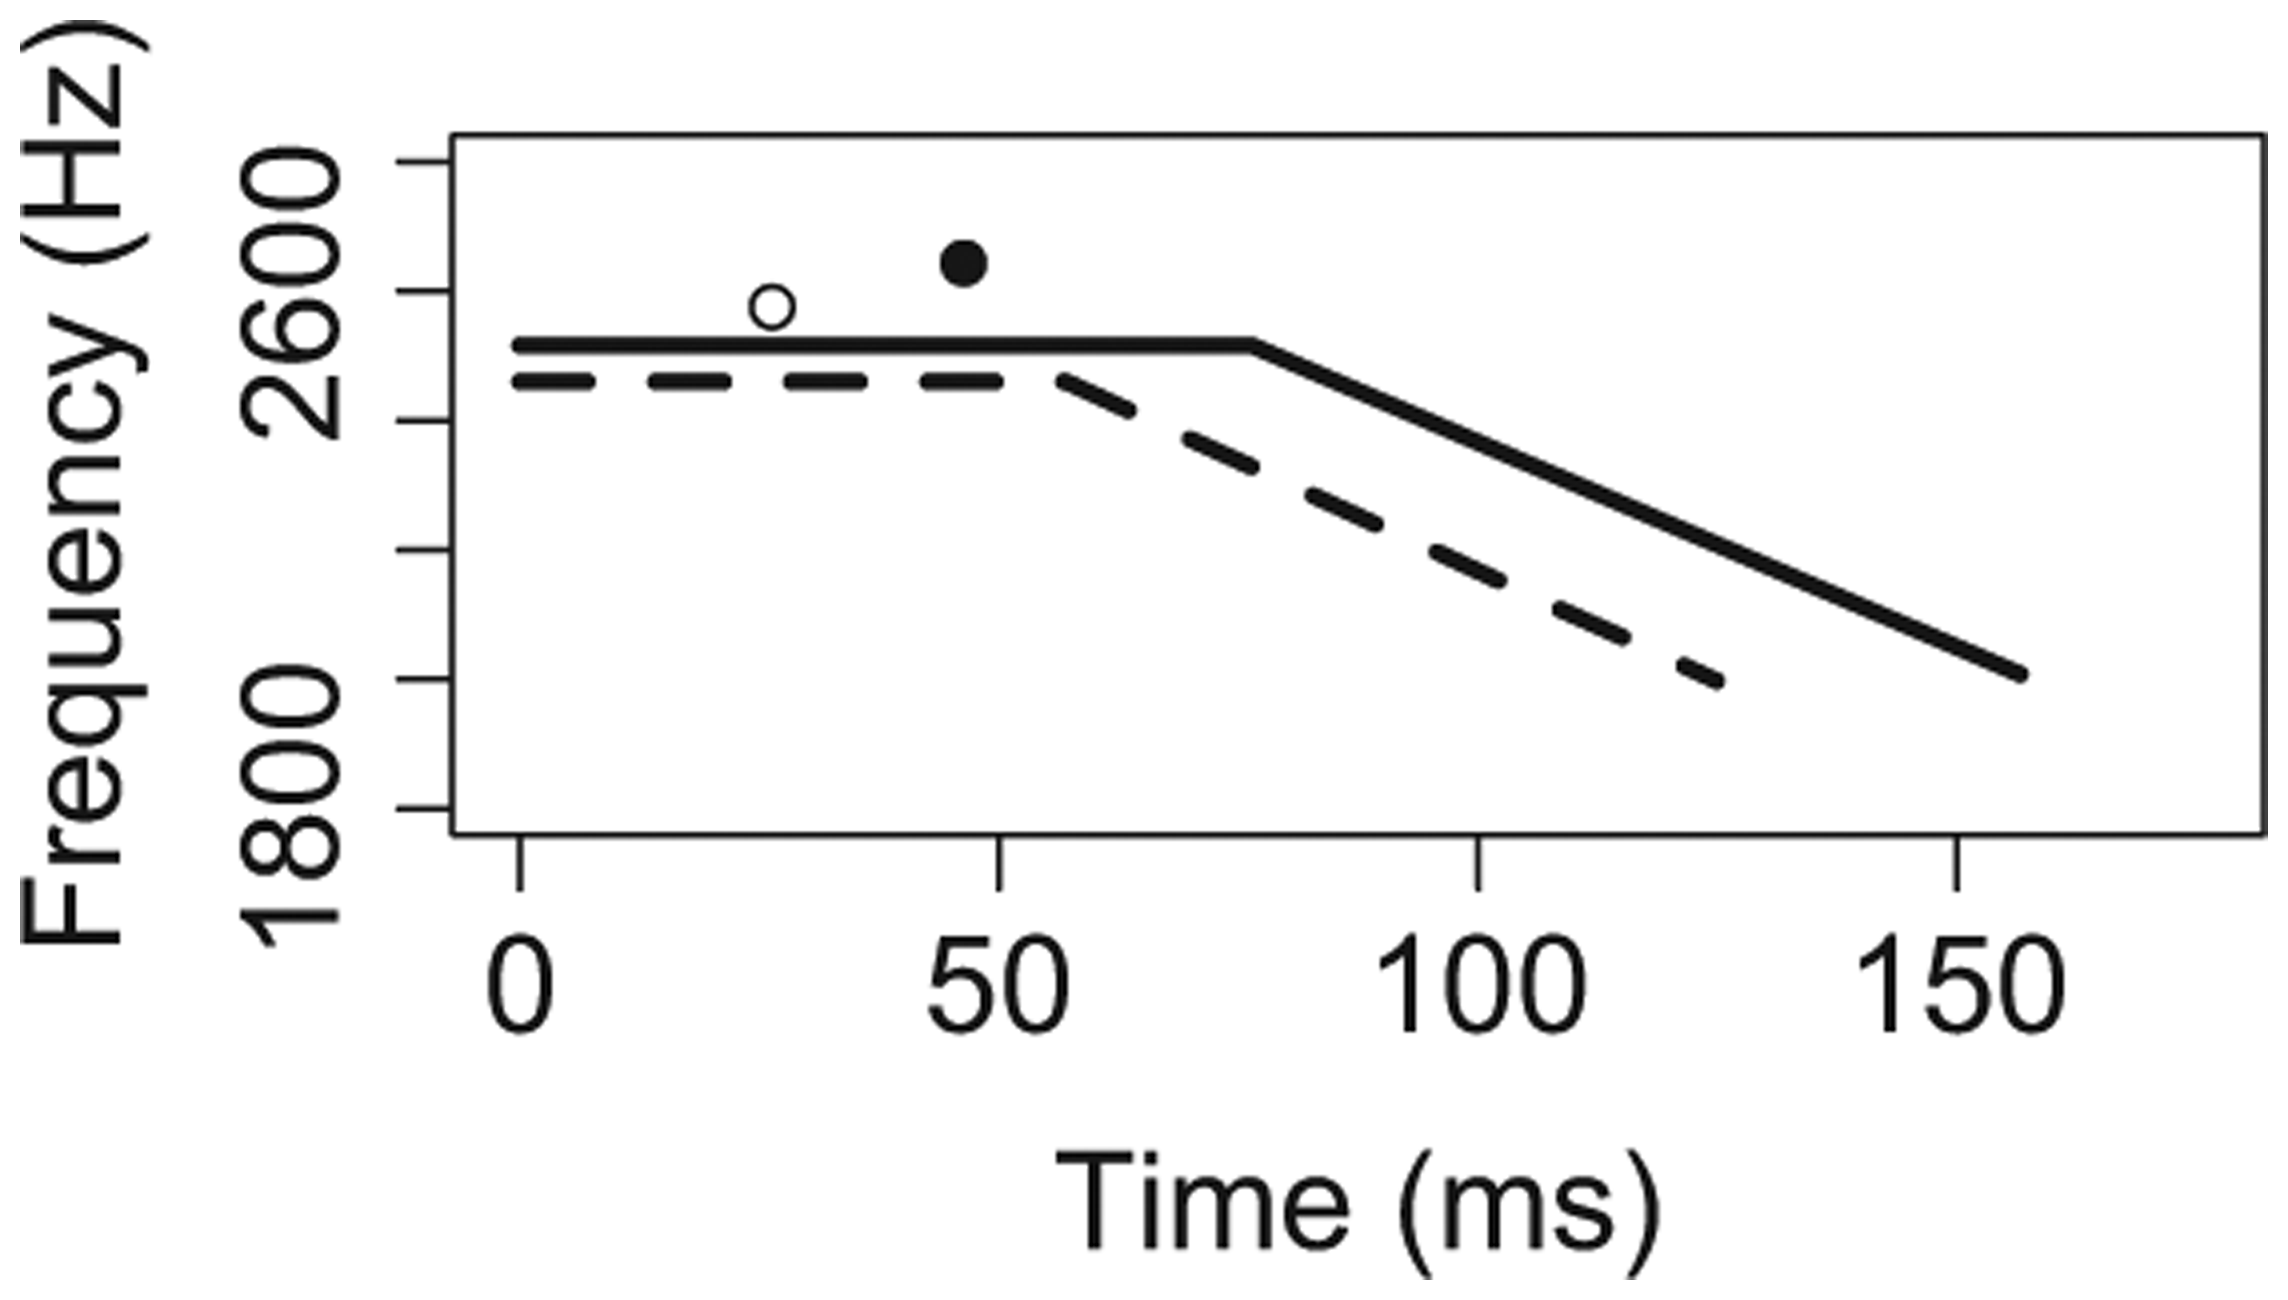
Accent.
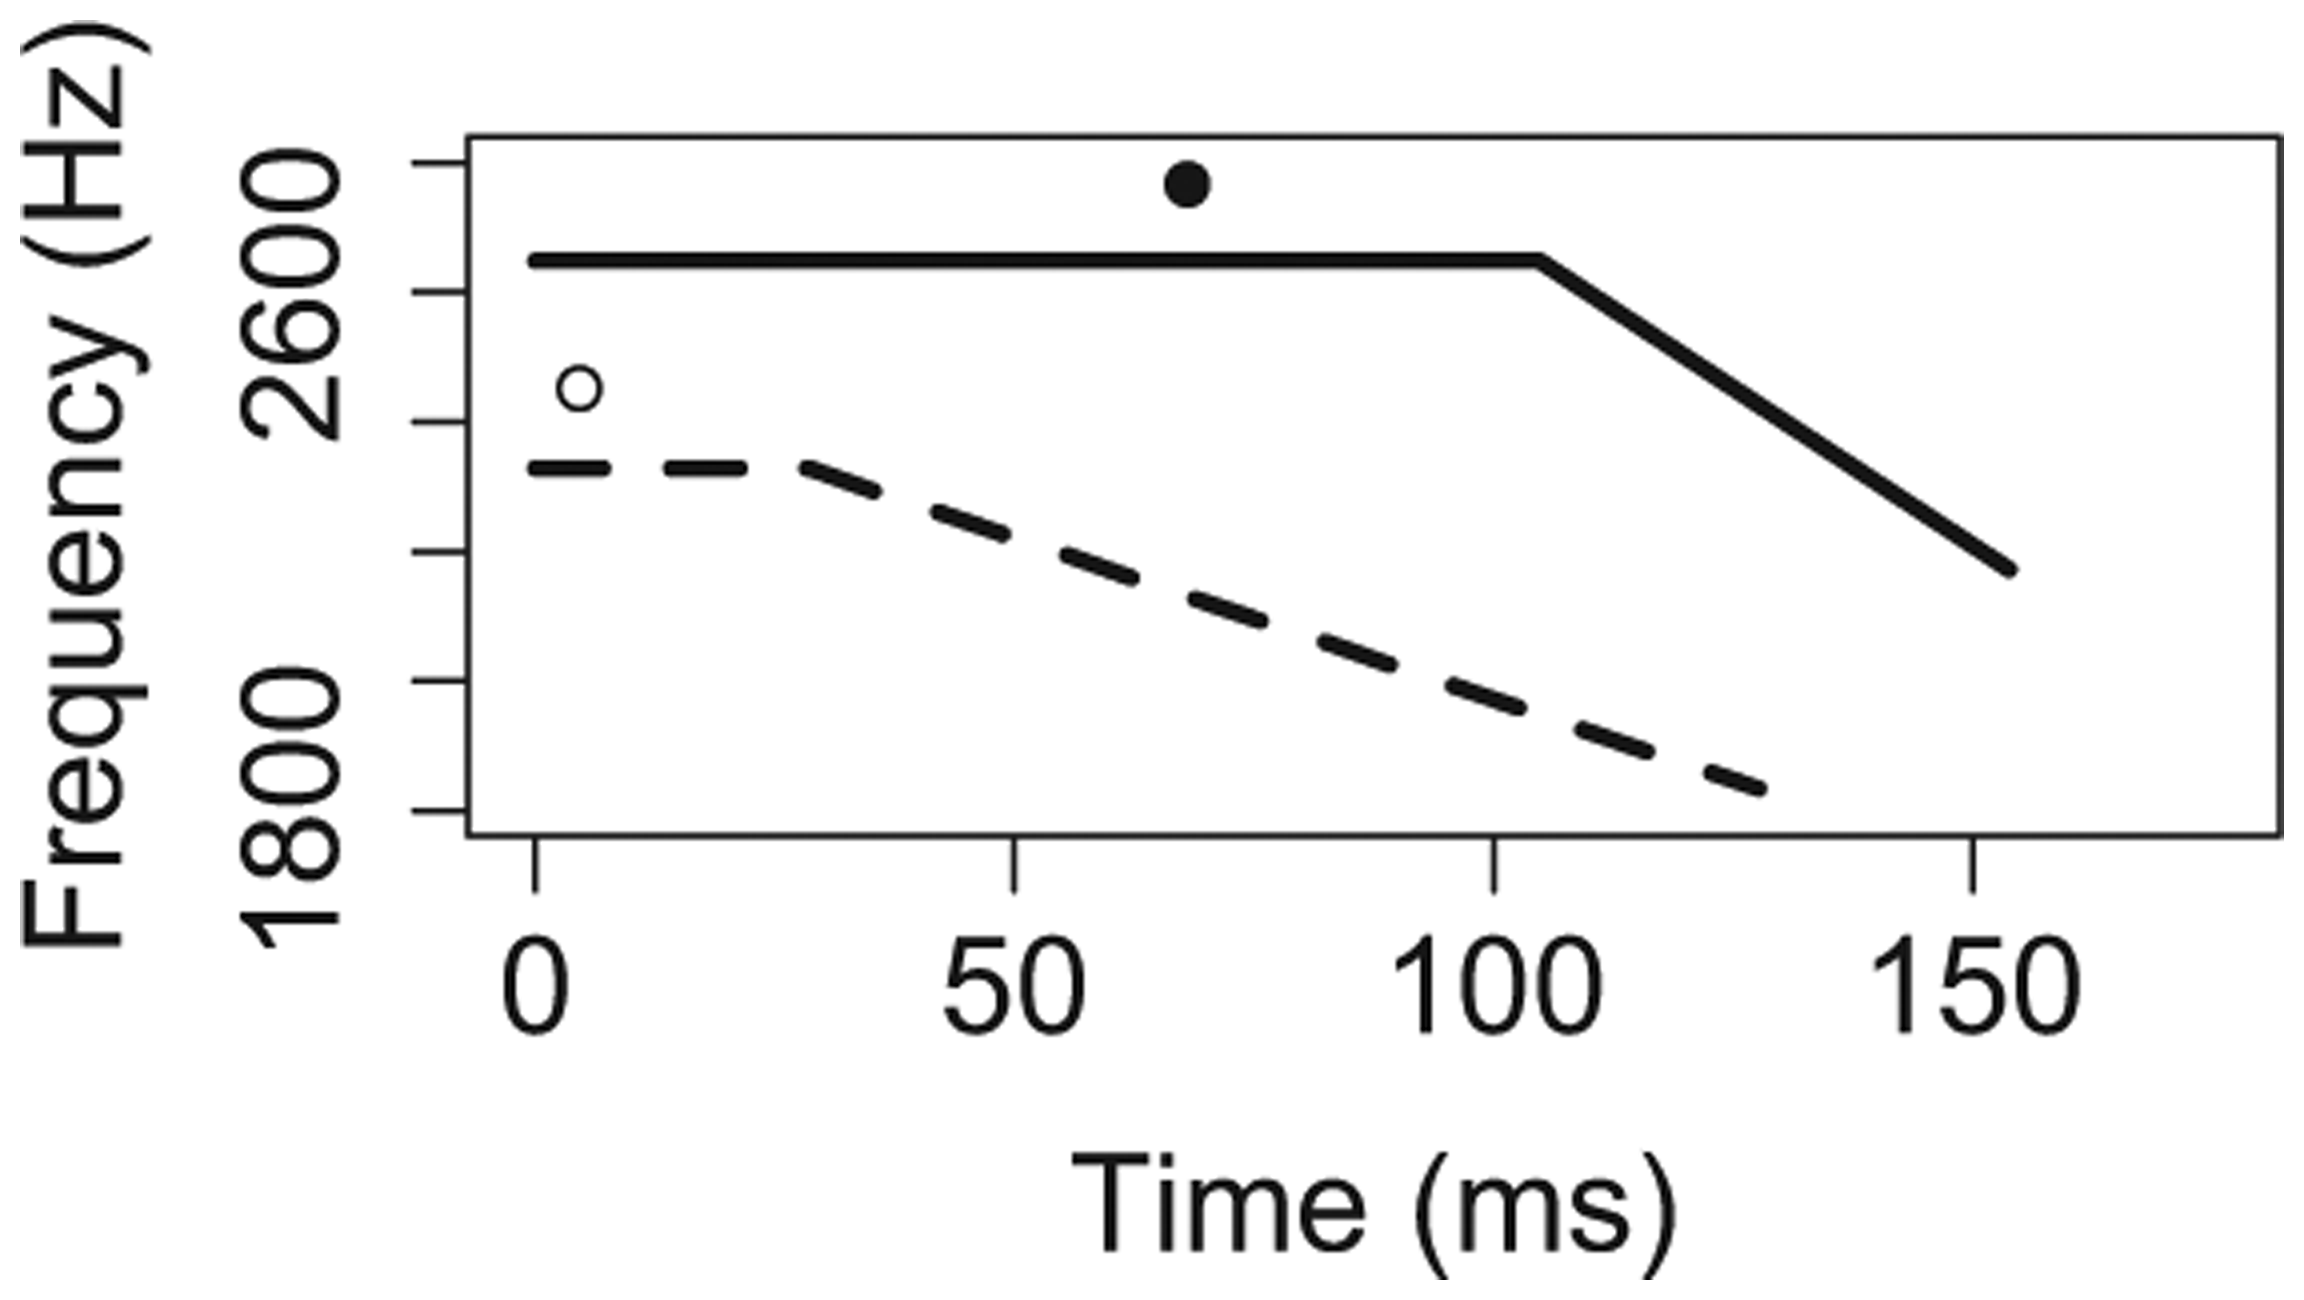
Vowel quality.
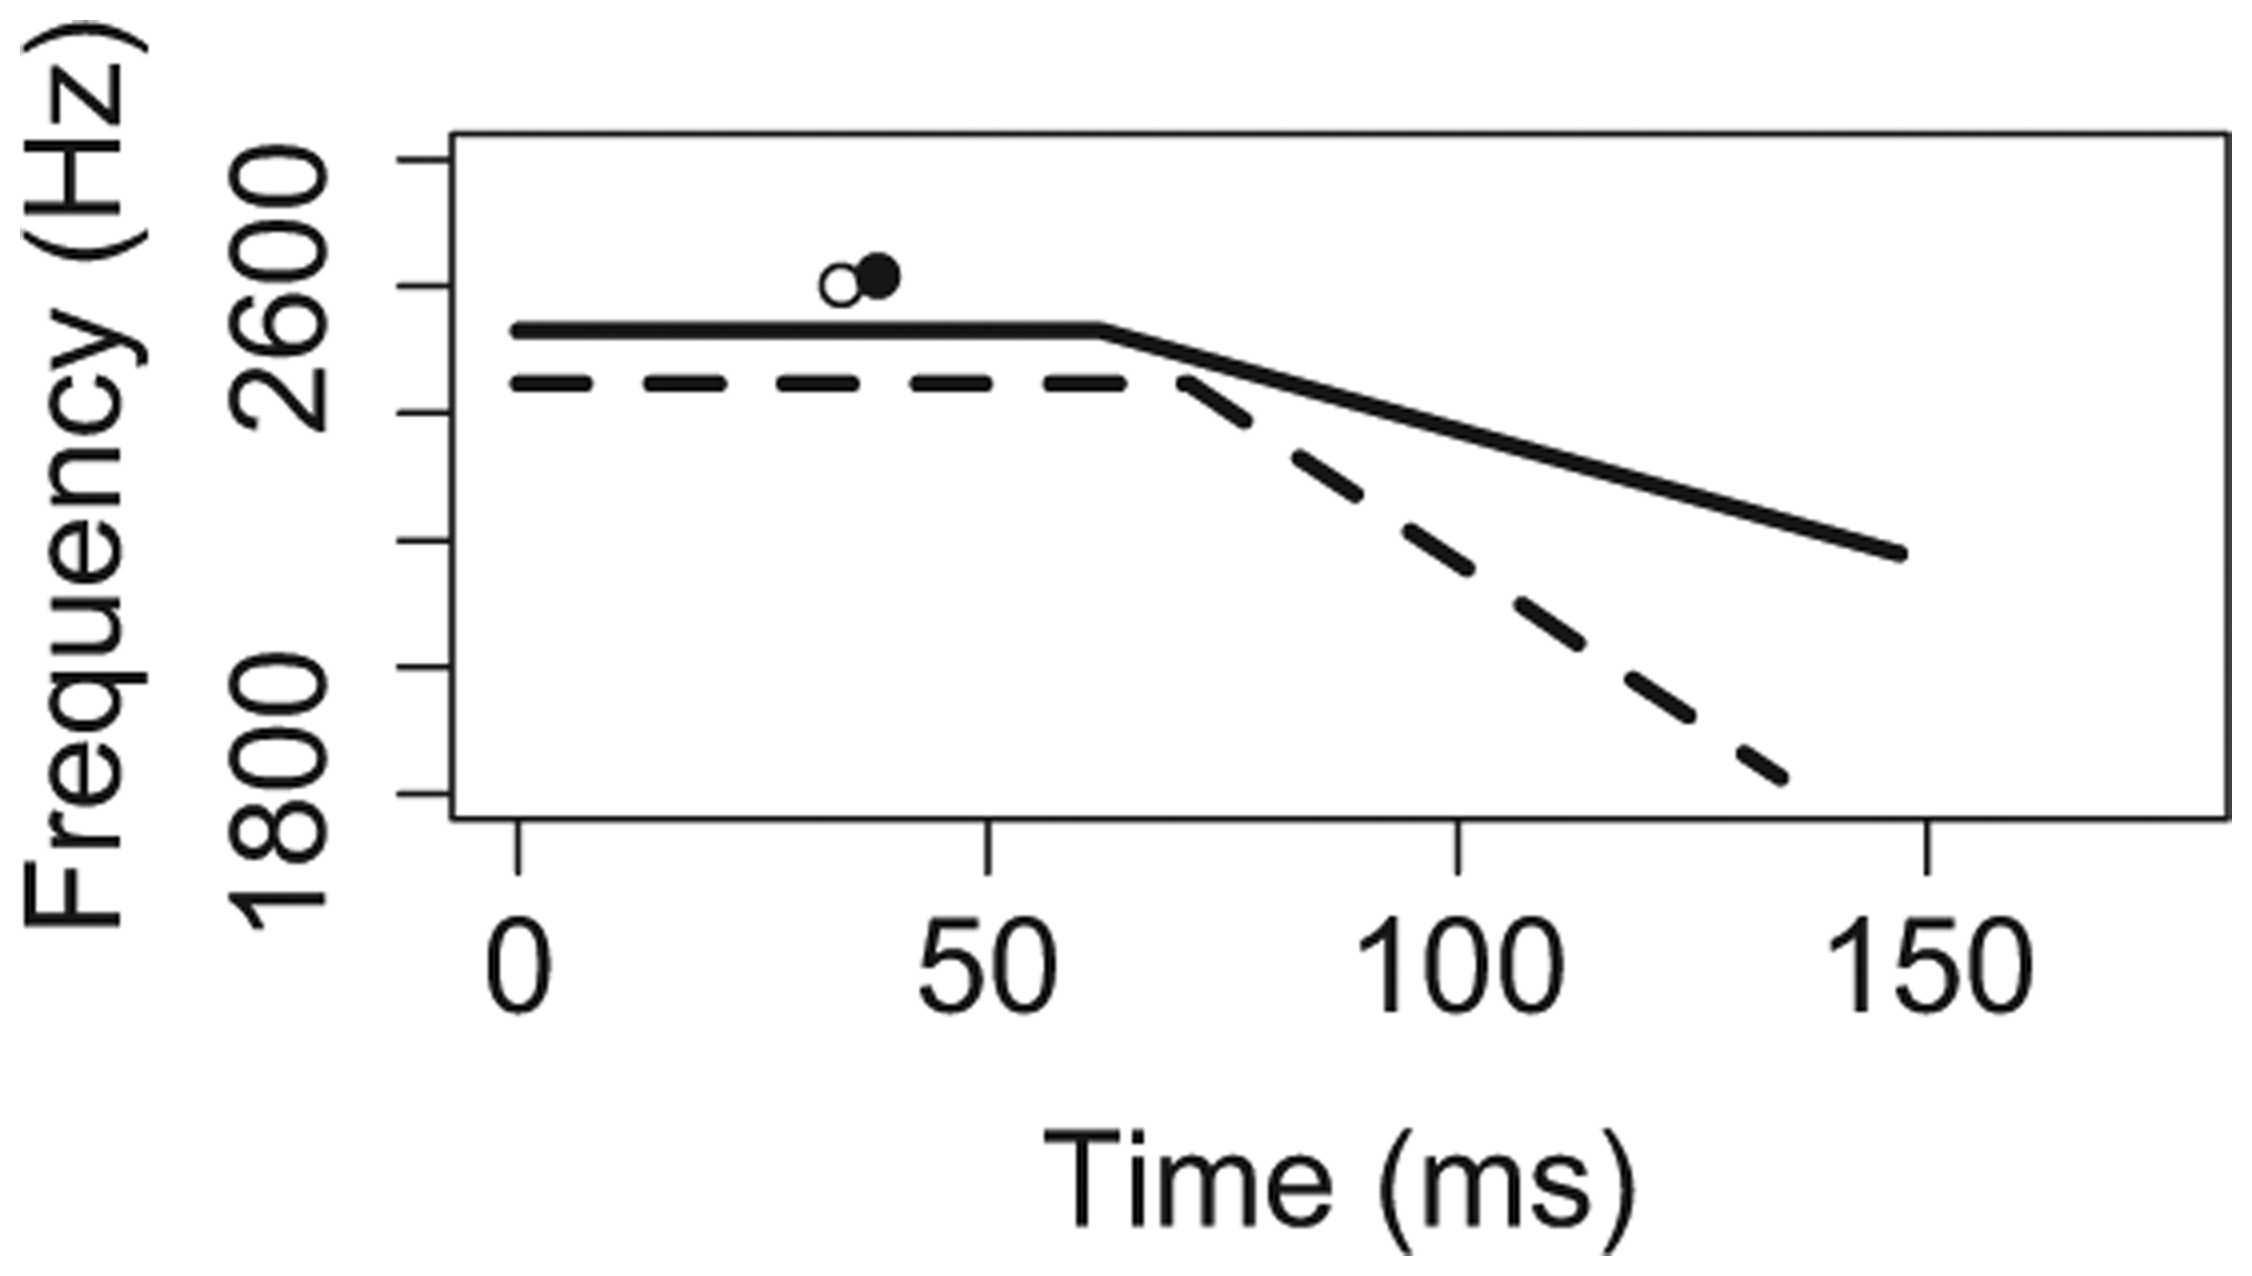
Consonant place.
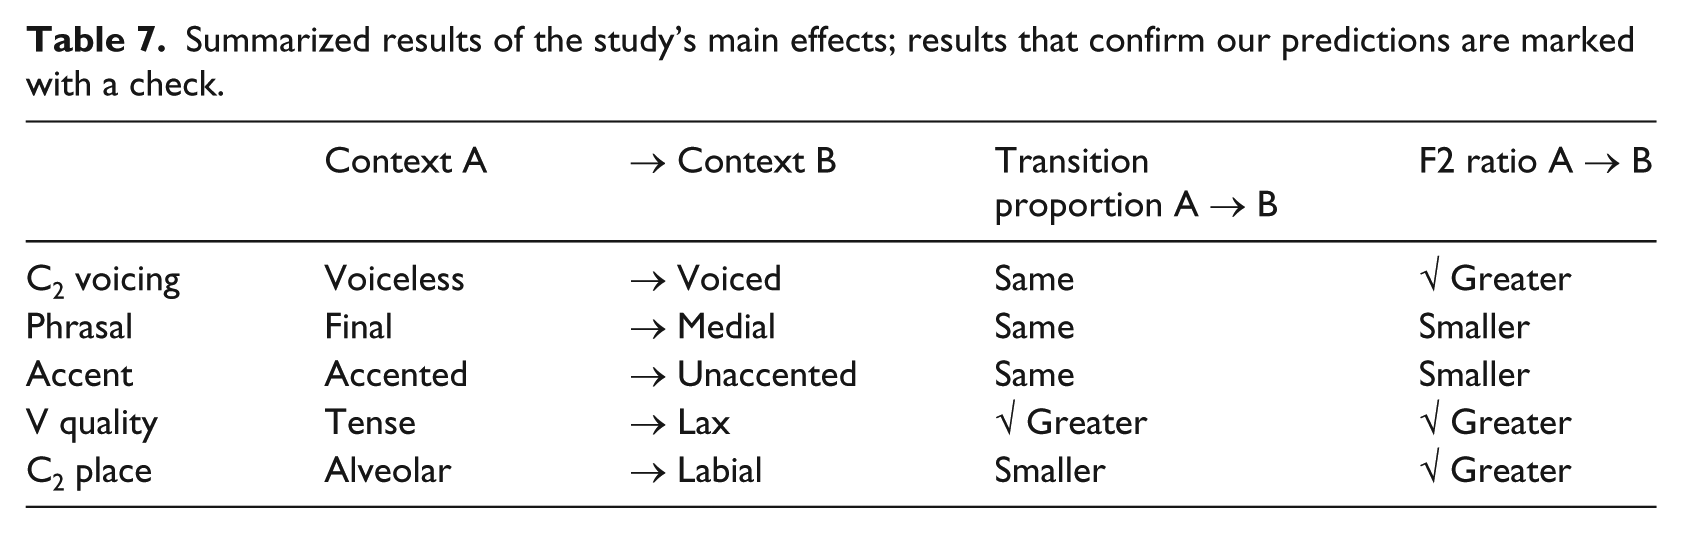
The key insights from Figure 2, which will be verified and elaborated when we turn to inferential statistics in the next section, are as follows. For temporal extent of co-articulation, results defied our predictions for four out of five conditioning environments. Transition proportion did not differ significantly across contexts for C2 voicing, phrasal position, or accent, and was actually smaller in labial compared to alveolar contexts. For V quality, however, transition proportion was greater in lax compared to tense contexts, as predicted. For spatial extent of co-articulation, on the other hand, results confirmed our predictions in three out of five conditioning environments. F2 ratio was greater in Context B compared to the analogous Context A for C2 voicing, V quality, and C2 place, as predicted. For phrasal position and accent, however, F2 ratio was actually smaller in Context B compared to Context A.
3.2 Inferential statistics
In order to test the significance of the patterns observed in Figure 2, five outcome variables – overall vowel duration, transition duration and transition proportion, offset F2 and F2 ratio – were analyzed, each with a separate ANOVA. Each analysis included the same five predictor variables: consonant voicing; phrasal position; accent; vowel quality; and consonant place of articulation. All analyses used Subject as the error term. We report all significant effects with an alpha level of 0.05.
3.2.1 Vowel duration
The analysis of vowel duration revealed main effects of all five predictor variables, as in Table 4. As expected, vowel duration changed significantly for all five environments, in the direction expected from previous research. Vowel duration was greater in voiced contexts compared to voiceless, greater in phrase-final positions compared to phrase-medial, greater in accented positions compared to unaccented, greater in tense vowels compared to lax, and greater in alveolar contexts compared to labial.
Means, standard deviations, and statistical values for main effects on vowel duration.
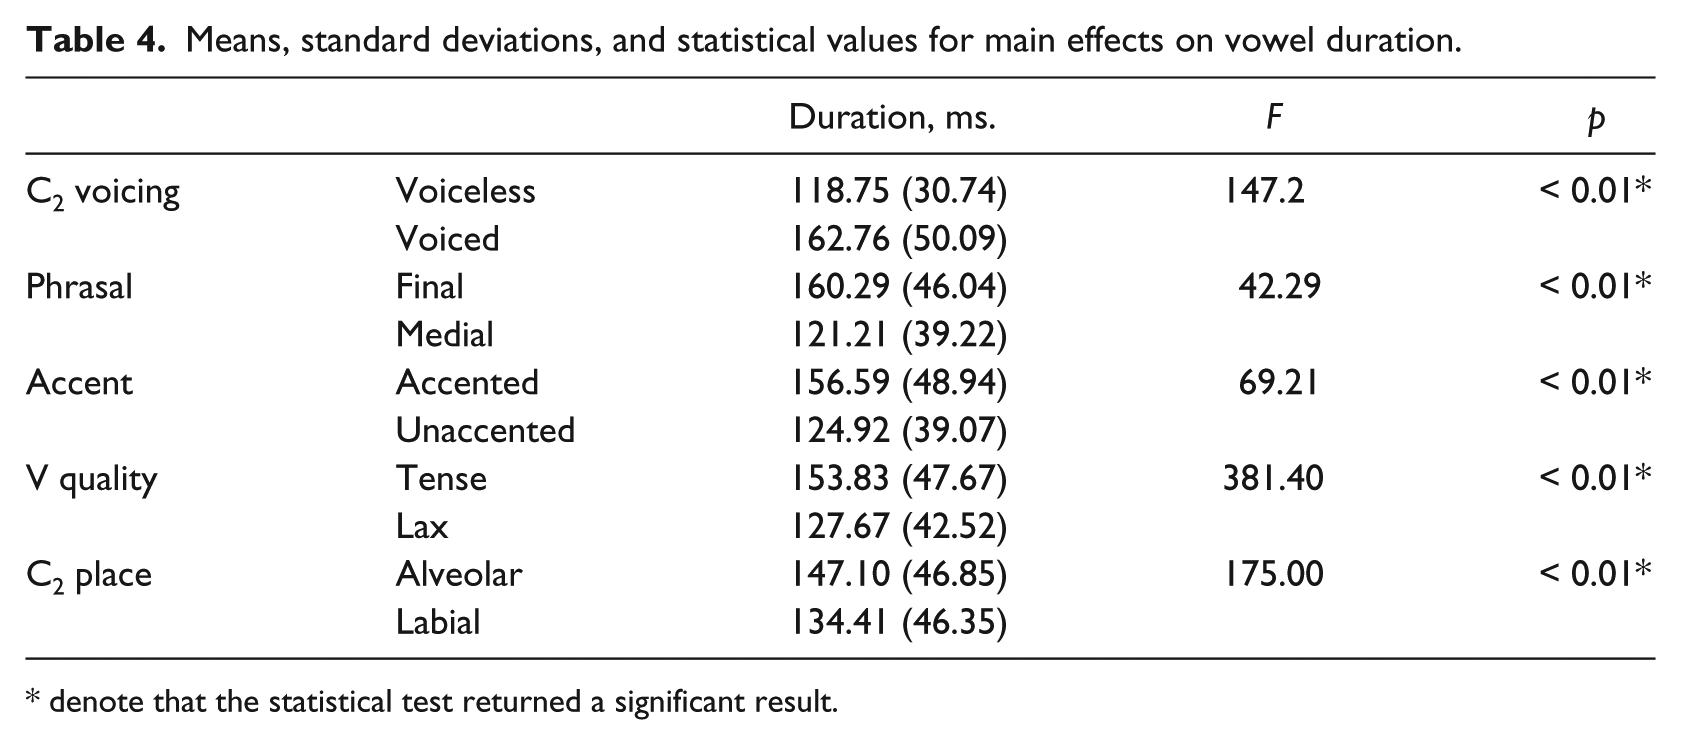
denote that the statistical test returned a significant result.
Significant two-way interactions occurred between C2 voicing and phrasal position (F=18.18, p < 0.01), C2 voicing and accent (F=38.37, p < 0.01) and C2 voicing and V quality (F=50.85, p < 0.01), V quality and phrasal position (F= 4.92, p < 0.05), and V quality and accent (F = 5.21,p < 0.05). Each of these interactions had magnifying effects. Thus, for example, vowel duration was greater in voiced C2 contexts compared to voiceless C2 contexts, and this voicing difference was even greater in phrase-final position compared to in phrase-medial position; other interactions behaved similarly. There were also significant three-way interactions among consonant voicing, accent, and consonant place (6.67, p < 0.05), consonant voicing, vowel quality, and consonant place (F = 4.84, p < 0.05), and among phrasal position, accent, and consonant place (F = 4.60, p < 0.05). No other interactions reached significance.
3.2.2 Transition duration and transition proportion
The analysis of transition duration revealed main effects for all five predictors (left panel of Table 5). Transition duration was greater in voiced contexts compared to voiceless, smaller in phrase-medial positions compared to phrase-final, smaller in unaccented positions compared to accented, greater in lax vowels compared to tense, and smaller in labial contexts compared to alveolar. The analysis of transition proportion revealed main effects only for the predictors of vowel quality and consonant place (right panel of Table 5). Transition proportion was greater in lax vowels compared to tense, and smaller in labial contexts compared to alveolar.
Means, standard deviations, and statistical values for main effects on transition duration and transition proportion.
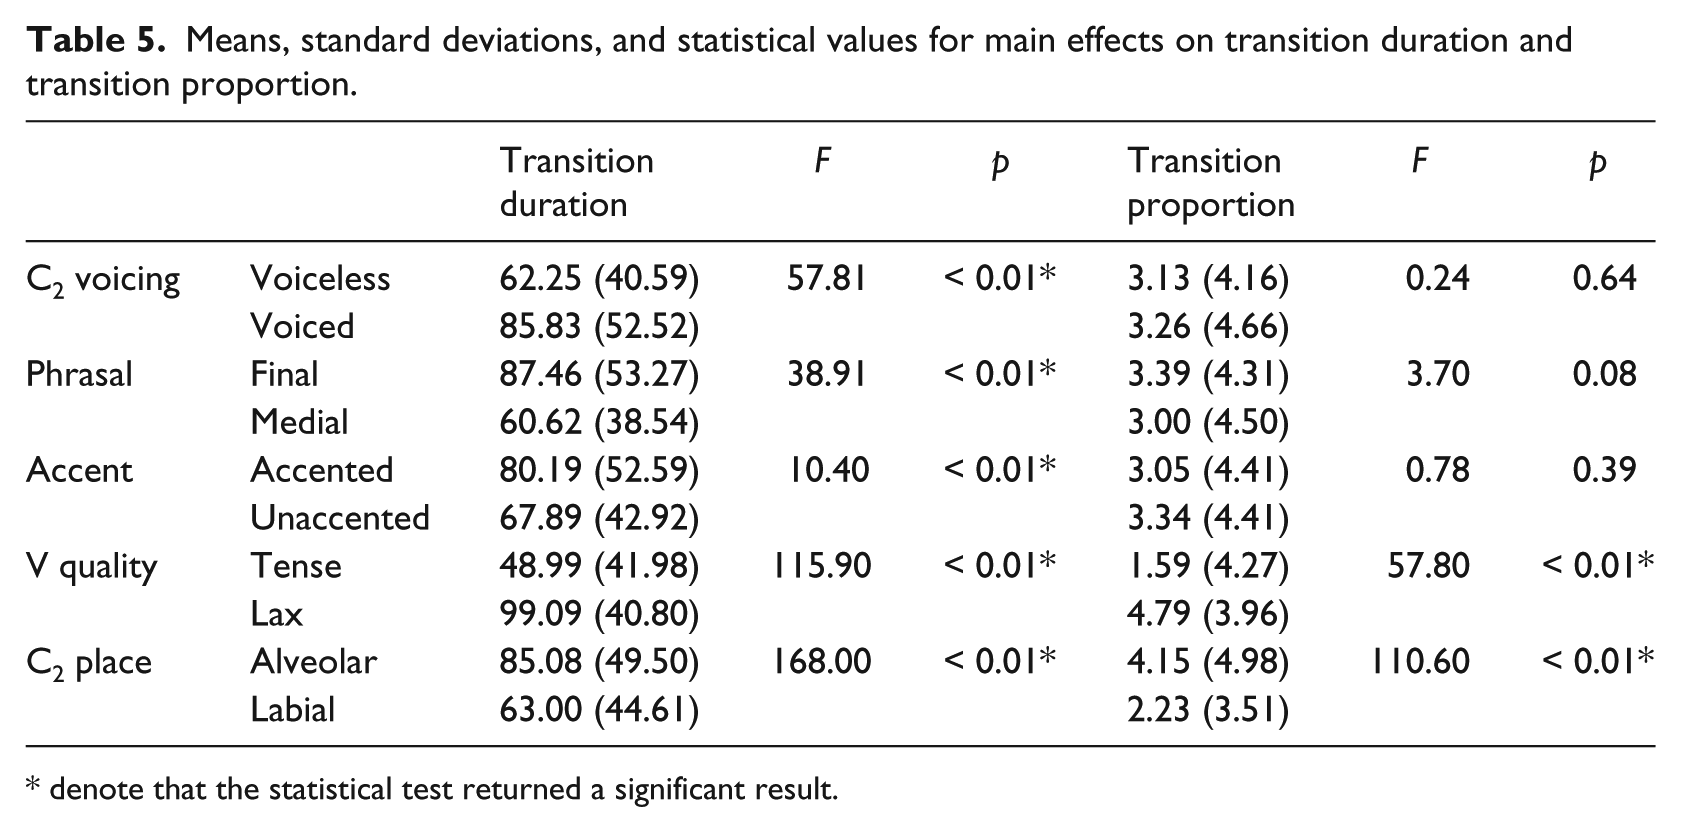
denote that the statistical test returned a significant result.
For transition durations, significant two-way interactions occurred between C2 voicing and phrasal position (F = 6.09, p < 0.05), C2 voicing and accent (F = 7.72, p < 0.05), C2 voicing and V quality (F = 4.86, p < 0.05), C2 voicing and C2 place (F = 4.65, p < 0.05), V quality and phrasal position (F = 18.86, p < 0.01), and V quality and accent (F = 10.98, p < 0.01). Each of these interactions had magnifying effects. No other interactions reached significance.
For transition proportions, significant two-way interactions occurred between C2 place and accent (F = 6.18, p < 0.05), C2 place and V quality (F = 25.43, p < 0.01), and phrasal position and V quality (F = 5.06, p < 0.05). As with transition duration, these interactions had magnifying effects. No other interactions reached significance.
3.2.3 Offset F2 and F2 ratio
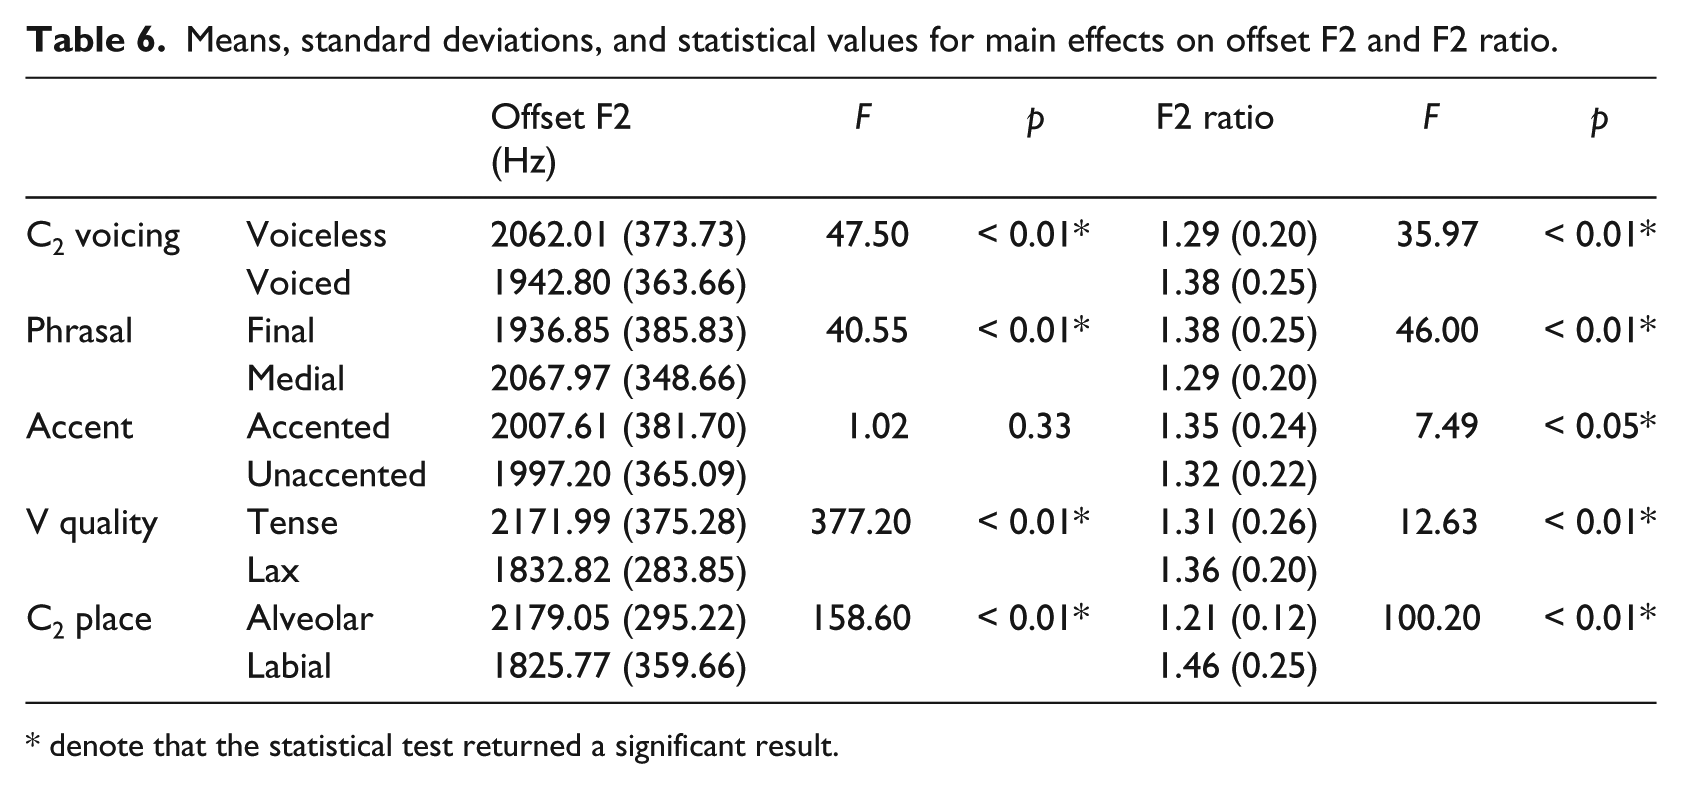
The analysis of offset F2 revealed main effects for all predictors except accent (left panel of Table 6). Offset F2 was smaller in voiced contexts compared to voiced, greater in phrase-medial positions compared to phrase-final, smaller in lax vowels compared to tense, and smaller in labial contexts compared to alveolar. The analysis of F2 ratio revealed main effects for all five predictors (right panel of Table 6). F2 ratio was greater in voiced contexts compared to voiceless, smaller in phrase-medial position compared to phrase-final, smaller in unaccented position compared to accented, greater in lax vowels compared to tense, and greater in labial contexts compared to alveolar.
Means, standard deviations, and statistical values for main effects on offset F2 and F2 ratio.
denote that the statistical test returned a significant result.
For offset F2, two-way interactions occurred between C2 voicing and phrasal position (F = 24.17, p < 0.01), C2 voicing and V quality (F = 17.24, p < 0.01), and C2 voicing and C2 place (F = 23.07, p < 0.01). Three-way interactions occurred between C2 voicing, phrasal position and V quality (F = 10.05, p < 0.01), C2 voicing, V quality and C2 place (F = 5.15, p < 0.05), and accent, vowel quality and C2 place (F = 11.06, p < 0.05). No other interactions reached significance.
For F2 ratio, two-way interactions occurred between consonant voicing and phrasal position (F = 24.43, p < 0.01), consonant voicing and vowel quality (F = 5.30, p < 0.05), consonant voicing and consonant place (F = 30.30, p < 0.01), and phrasal position and consonant place (F = 9.15, p < 0.05). Three-way interactions occurred between consonant voicing, phrasal position and vowel quality (F = 5.55, p < 0.05), consonant voicing, phrasal position and consonant place (F = 7.16, p < 0.05), consonant voicing, vowel quality and consonant place (F = 4.89, p < 0.05), and accent, vowel quality and consonant place (F = 6.40, p < 0.05).
3.3 Summary of results
Table 7 summarizes the main effects as indicated by statistical analyses for the two measures around which we based our predictions, transition proportion and F2 ratio.
Summarized results of the study’s main effects; results that confirm our predictions are marked with a check.
4 Discussion and conclusion
This study investigated whether speakers modulate co-articulation in order to meet the needs of communicative situations. We hypothesized that, in those contexts where primary cues to C2 tend to be diminished, speakers adjust the temporal and spatial extent of co-articulation in VC2 sequences in order to provide listeners with enhanced secondary cues to C2. We tested this hypothesis by measuring the duration and formant values of co-articulatory stretches of speech in five conditioning environments that modulate primary cues to C2 in different ways: final consonant voicing; phrasal position; sentence accent; vowel quality; and final consonant place of articulation. Our results show that speakers exhibited greater spatial co-articulation in the predicted direction for three out of the five conditioning environments, offering some modest support for our hypothesis. However, we must consider why speakers did not exhibit greater spatial co-articulation in the other two environments. Furthermore, we must also consider why speakers did not exhibit greater temporal co-articulation for any conditioning environment except vowel quality, and determined whether it is possible to reconcile these findings with the broader idea that speakers can modulate co-articulation to serve a communicative function.
To do this, we will complement our discussion of the relative measures that formed the basis of our initial predictions (transition proportion and F2 ratio) with a consideration of the absolute measures from which they are derived (transition duration and offset F2). We focus almost entirely on the main effects revealed by our statistical analysis, because we framed our predictions in these relatively simple terms (e.g., is the temporal extent of co-articulation greater in C2 voiced contexts, compared to C2 voiceless contexts: yes or no?). We do not consider the two- or three-way interactions in any detail, because we did not formulate any predictions about how the five conditioning environments under investigation should, or should not, produce cumulative effects.
4.1 Temporal extent of co-articulation
In our results for the temporal extent of co-articulation, C2 voicing, phrasal position, and accent patterned together, exhibiting no significant difference in transition proportion across Contexts A and B, and defying our predictions. The results for V quality showed that transition proportion was significantly greater in Context B (lax vowels) compared to Context A (tense vowels), supporting our prediction. Lastly, the results for C2 place showed that transition proportion was significantly smaller in Context B (labial codas) compared to Context B (alveolar codas), again defying our predictions. Although we discuss each of these environments in more detail below, the overall pattern of results leads us to conclude that diminishment of primary place cues does not typically correlate with longer co-articulatory durations.
We begin our discussion with the three environments that patterned together, C2 voicing, phrasal position, and accent. For all of these cases, the duration of formant transitions, relative to the overall duration of the vowel, remained constant across contexts where the primary cues to C2 place of articulation typically change. Because these results do not support our predictions, another factor may be at play. One possible factor is overall vowel duration. In all three of these conditioning environments, previous studies report that consistent changes in overall vowel duration occur across Contexts A and B: to recap, vowels are shorter in voiceless C2 compared to voiced C2 contexts, in phrase-medial compared to phrase-final contexts, and in unaccented contexts compared to accented contexts. These same patterns are present in our own data, as reported in Table 4.
Another way of stating our results for these three environments, then, would be to say that the duration of co-articulation, relative to the overall duration of the vowel, remains constant even when duration of the vowel changes. Our results for absolute transition duration, reported in Table 5, mirror this pattern. Like overall duration, absolute transition duration is shorter in voiceless C2, phrase-medial, and unaccented contexts, compared to their respective counterpart contexts. For the three environments in question, then, the absolute duration of formant transitions expands and contracts along with the absolute duration of the vowel itself, producing constant transition proportions.
These observations suggest that the temporal extent of co-articulation is not modulated by the communicative needs of listeners, but by the duration of the vowel in question, an old idea first proposed by Lindblom (1963). If duration does turn out to be the key factor, however, we would require a different model of it in order to account for the current results. Lindblom’s articulatory undershoot model proposed that vowel duration and absolute duration of co-articulation should be inversely correlated. But in our data, these variables are directly correlated, such that longer vowels occur with longer absolute transition durations. Our data also seem to contradict previous articulatory studies which showed that speakers implement vowel lengthening in accented contexts by separating adjacent V and C2 gestures from one another in time (e.g., Edwards, Beckman, & Fletcher, 1991); our acoustic data suggest that these gestures maintain a constant degree of overlap across a range of individual gesture durations, for accent as well as for C2 voicing and phrasal position. Further research is needed to integrate these divergent findings. Meanwhile, note that in principle, a duration-based pattern could still have its roots in communicative needs: it is conceivable, for example, that speakers maintain constant transition proportions across contexts in order to insure themselves against the absence of the stop release cue, which is inherently variable. Under such a scenario, however, speakers would appear to modulate their productions in a somewhat passive manner, not in the more active manner that we hypothesized for the current study.
For V quality, both transition proportions and absolute transition durations were significantly greater for lax contexts, compared to tense contexts. This result supports our predictions based on communicative needs, since primary release cues are diminished in lax contexts. Why is our prediction met here, but not in the other environments we examined? One way in which V quality stands out concerns phonotactic predictability. In English, lax vowels must be followed by a coda consonant (hit [hɪt], *[hɪ]), while tense vowels need not be (heat [hit], he [hi]). This fact may explain why speakers release stops after lax vowels so infrequently (17% of the time): listeners can already predict the presence of a coda consonant in this context, so there is no need to signal its presence further with a stop release (Parker & Walsh, 1981). Conversely, speakers release stops after tense vowels very frequently (83% of the time): listeners cannot predict the presence of a coda in this context, so a stop release helps signal this information. While the asymmetric distribution of primary place cues in the other four conditioning environments follows no immediately obvious principle, the asymmetric distribution of these cues in the V quality environment hews closely to the phonological grammar. Thus, unreleased stops after lax vowels, versus released stops after tense vowels, may constitute a particularly informative generalization for speakers and listeners to rely on, potentially explaining why speakers consistently used co-articulation as a compensatory strategy in this environment, while failing to do so in other environments where generalizations about primary place cues hold less strongly.
A different way in which V quality stands out from the other conditioning environments concerns the nature of the tense and lax vowels themselves. In our data, the formants for [i] are relatively stable up until their rapid transition into C2. However, the formants for [ɪ] exhibit only a brief steady-state period before they begin a slow, gradual transition into C2, a pattern reminiscent of the linear interpolation described in previous work arguing for phonetic underspecification (Pierrehumbert & Beckman 1988; Keating, 1988). Perhaps [i] could be distinct from [ɪ] not just in quality and inherent duration, but also in degree of specification. Although speculative, this idea finds some support in previous studies. Stevens and House (1963) report that F1 and F2 values for [i] remain nearly consonant across different consonant environments, while F2 for [ɪ] lowers in labial contexts; Stevens, House, and Paul (1966) report an equivalent pattern. In a similar vein, Hillenbrand, Clark, and Nearey (2001), report that initial labial or alveolar consonants significantly affect F2 values for both [i] and [ɪ], but initial velar consonants affect [ɪ] only. Note, however, that [ɪ] is consistently shorter in duration than [i], as shown by previous studies as well as our own data; thus, the greater temporal co-articulation in [ɪ] is also consistent with the predictions of Lindblom’s (1963) co-articulatory undershoot model. Future research could disentangle the different contributions of inherent duration versus primary cue diminishment to temporal co-articulation, and the seemingly different mechanisms by which tense versus lax provide place-of-articulation cues to listeners.
Finally, the results for C2 place show that transition proportions were significantly smaller in labial contexts, compared to alveolar contexts. Mirroring this, absolute transition durations were also smaller in labial contexts. These results defy our predictions: primary place cues tend to diminish in labial contexts, so we had expected greater transition proportions, but we found smaller ones. These results also defy the duration-based pattern exhibited by C2 voicing, phrasal position, and accent: vowels tend to be longer in labial contexts, so we might expect longer absolute transition durations there, but we found shorter ones. Why? One speculative answer concerns the spatial extent of co-articulation, which is considerably greater in labial contexts, compared to alveolar ones. In fact, the difference is somewhat extreme: Table 6 reveals that C2 place exerted a bigger effect on F2 ratios than any other environment did. Conceivably, then, a trading relation is at work. Labial co-articulation delivers a great deal of spectral information about C2 within a given amount of time. Alveolar co-articulation, by contrast, delivers less spectral information about C2 within the same amount of time, so speakers compensate by extending the temporal reach of co-articulation specifically in alveolar contexts.
In sum, our results suggests that the temporal extent of co-articulation does not typically correlate with diminishment of primary place cues, although the environment of lax versus tense vowels provides an interesting, and possibly principled, exception. Instead, a subset of our results suggests that temporal extent of co-articulation correlates with overall vowel duration, in a manner that previous duration-based models, such as articulatory undershoot, do not capture.
4.2 Spatial extent of co-articulation
In our results for the spatial extent of co-articulation, C2 voicing, V quality, and C2 place patterned together, such that F2 ratio was significantly greater in Context B compared to Context A, supporting our predictions. On the other hand, for phrasal position and accent, F2 ratio was significantly smaller in Context B compared to Context A, apparently contradicting our predictions – as we shall see, however, closer inspection of these results suggests that they can fit within the scope of our predictions, and that speakers’ compensatory adjustments may be even more fine-grained than we had initially expected. On this basis, we uphold the conclusion that the tendency to diminish primary place cues correlates with greater spatial co-articulation.
We begin by considering an alternative interpretation of our results for C2 place, which indicated greater F2 ratios for vowels in labial contexts, compared to alveolar contexts. A tube-based model of the vocal tract can also account for this finding. As is well-known, labial constrictions increase the overall length of the tract, which leads to lowering of all intrinsic formants (e.g., Lieberman & Blumstein, 1981); constrictions at other locations, such as at the alveolar ridge, do not have this effect. Given this model, the greater spatial extent of co-articulation in labial compared to alveolar contexts, as in our results, is predicted on an articulatory basis alone, with no reference to communicative needs. Yet it remains interesting to consider whether the primary cues to C2 place, such as frequency and/or amplitude of release bursts, diminish more in labial conditions precisely because of the comparatively rich cues provided by co-articulation. In other words, we need not adhere to the strict idea that primary cue diminishment specifically triggers co-articulation. Rather, we can maintain a more general hypothesis that there should exist a negative overall correlation between primary and co-articulatory cues to C2 place. In this way, the tube-based explanation for our labial results can fit within our framework.
We turn next to the environments that did not appear to support our predictions. Beginning with phrasal position, recall that while previous research shows that speakers generally tend to release stops in phrase-medial position less frequently than in final positions, these overall findings masked certain interactions. Race is one interacting factor: in production studies, white speakers exhibit the overall asymmetry, but black speakers are equally likely to release stops in either position (Davidson, 2011). Since the participants in the current study were white, the asymmetric distribution of place cues across phrasal positions is probably applicable to our data, so we do not discuss this issue further. But place of articulation is another interacting factor: in production studies, alveolar consonants exhibit the overall asymmetry (medial C2: released 28% of the time, final C2: 42%), while labial consonants exhibit an inverse asymmetry (medial C2: 23%, final C2: 0%) (Crystal & House, 1988b). This raises an important question for our results: if the distribution of primary place cues interacts with C2 place of articulation, does the spectral extent of co-articulation interact with C2 place of articulation in the same manner?
Our results indicate that the answer is yes. As reported in Section 3.2.3, the analysis of F2 ratio exhibited several two-way interactions, including an interaction between phrasal position and C2 place (F = 9.15, p < 0.05). Examining these data further, we see that for alveolar C2 contexts, the mean F2 ratio for medial positions was 1.18 (0.11), while the mean for final positions was 1.24 (0.13), a modest difference. For labial C2 contexts, on the other hand, the mean F2 ratio for medial positions was 1.39 (0.21), while the mean for final positions was 1.53 (0.29), a larger difference. These numbers indicate that the main effect of smaller F2 ratio values for medial positions, compared to final positions, is driven largely by the labial contexts – that is, driven precisely by those contexts where primary place cues are enhanced for medial position, but diminished for final position. Thus, the phrasal position results for labial contexts clearly support our predictions.
As for alveolar contexts, in previous studies, the distribution of stop releases across medial (28%) versus final (42%) positions was asymmetric, but not strongly so. Likewise, in the current study, the mean F2 ratios across medial (1.18) and final (1.24) positions were different, but not greatly so. Although these results do not technically support our hypothesis, it seems likely that for alveolar contexts, the differences in distribution of primary place cues may not be great enough to warrant principled differences in compensatory co-articulation.
Turning to accent, recall that previous production studies examining release cues were difficult to find, so we were obliged to speculate about the presence or absence of primary place cues in these contexts. Because accent generally tends to produce contrast-enhancing effects, we proposed that speakers might tend to produce shorter and less intense bursts, and less frequent releases, for unaccented C2 compared to accented C2. On this basis, we hypothesized that the spatial extent of co-articulation should be greater in unaccented compared to accented contexts. If we examine the F2 ratios alone, the results do not support this speculative hypothesis, because these values were smaller in unaccented contexts (mean 1.32, SD 0.22) compared to accented contexts (mean 1.35, SD 0.24). Assuming that our speculations about the occurrence of primary place cues are correct, why should this environment differ from the others we have examined? Accent may be special because it serves not just to signal linguistic information, but to enhance contrasts between one spoken element and another (I didn’t say cold, I said HEAT just now). It is therefore possible that speakers produce both primary and secondary cues for place in this environment, rather than compensating one for the other as they do in other environments.
If we include absolute F2 offset values in our discussion, however, the results suggest another possible interpretation. As reported in Table 6, absolute F2 offset values did not change significantly across unaccented (mean 1997.20 Hz, SD 365.09) versus accented contexts (mean 2007.61 Hz, SD 381.70). How can F2 ratios be significantly smaller, while absolute F2 offset values remain the same? The answer is that the quality of the vowels themselves changed under different accent contexts. Examining Figure 2C, we see that speakers produced more centralized F2 steady-state values for V in unaccented positions compared to accented positions, a finding that has also been reported in previous studies (Lindblom et al., 2007 and references therein). Thus, it is the lower F2 steady-state values (and not higher F2 offset values), which account for the smaller values for F2 ratio in the unaccented context, compared to the accented one. In other words, the smaller values for F2 ratio represent a more centralized target for the vowel itself, not a decrease in the spatial extent of co-articulation. The offset F2 values themselves are equivalent across contexts, and presumably provide equivalent amounts of information about the place of the following C2. On this logic, we could conclude that the speakers co-articulate to equivalent degrees in unaccented versus accented positions. This result would be compatible with our predictions if it turns out that the speakers produce primary place cues to equivalent degrees in these positions.
In sum, although the accent environment requires further research, our results are largely compatible with the hypothesis that the spatial extent of co-articulation correlates with diminishment of primary place cues.
4.3 Conclusion
The current results provide conflicting sets of evidence about our hypothesis that co-articulatory cues and primary cues trade off with one another in order to meet the communicative needs of listeners. While the temporal extent of co-articulation does not appear to correlate with the presence or absence of primary place cues, the spatial extent of co-articulation participates in a compensatory trade-off, as predicted. One way to resolve this conflict between the temporal and spatial results might be to say that increases in the duration of co-articulation simply do not enhance the perception of C2 place, while increases in spectral extent of co-articulation do. If this scenario holds, however, it raises a question as to why changes to co-articulatory duration occur at all. One possibility is that a single communicative requirement to enhance C2 place cues actually drives changes to both the temporal and spatial extent of co-articulation. Under this logic, listeners need to accurately identify C2 place, and speakers adapt by increasing co-articulatory durations just enough to permit more extreme formant excursions in V. Thus, an increase in co-articulatory duration plays no role in its own right, but merely allows the speaker time to provide C2 place cues without increasing the stiffness of the articulatory gesture (i.e., without having to move the tongue or lips too quickly towards the target). As the summarized results in Table 7 show, however, no principled relationship appears to hold between changes in transition proportion versus changes in F2 ratio, so this idea would require further research.
We began this study with the premise that speakers modulate their productions in order to provide listeners with clearly differentiable signals. We focused on co-articulation as a means of investigating whether, as Lindblom (1990) proposed, speakers have a choice. Our results suggest that they do. Speakers modulate co-articulation as the communicative situation requires, producing changes to the structure of speech that compensate for the potential loss of a primary cue with the enhancement of a secondary cue.
Footnotes
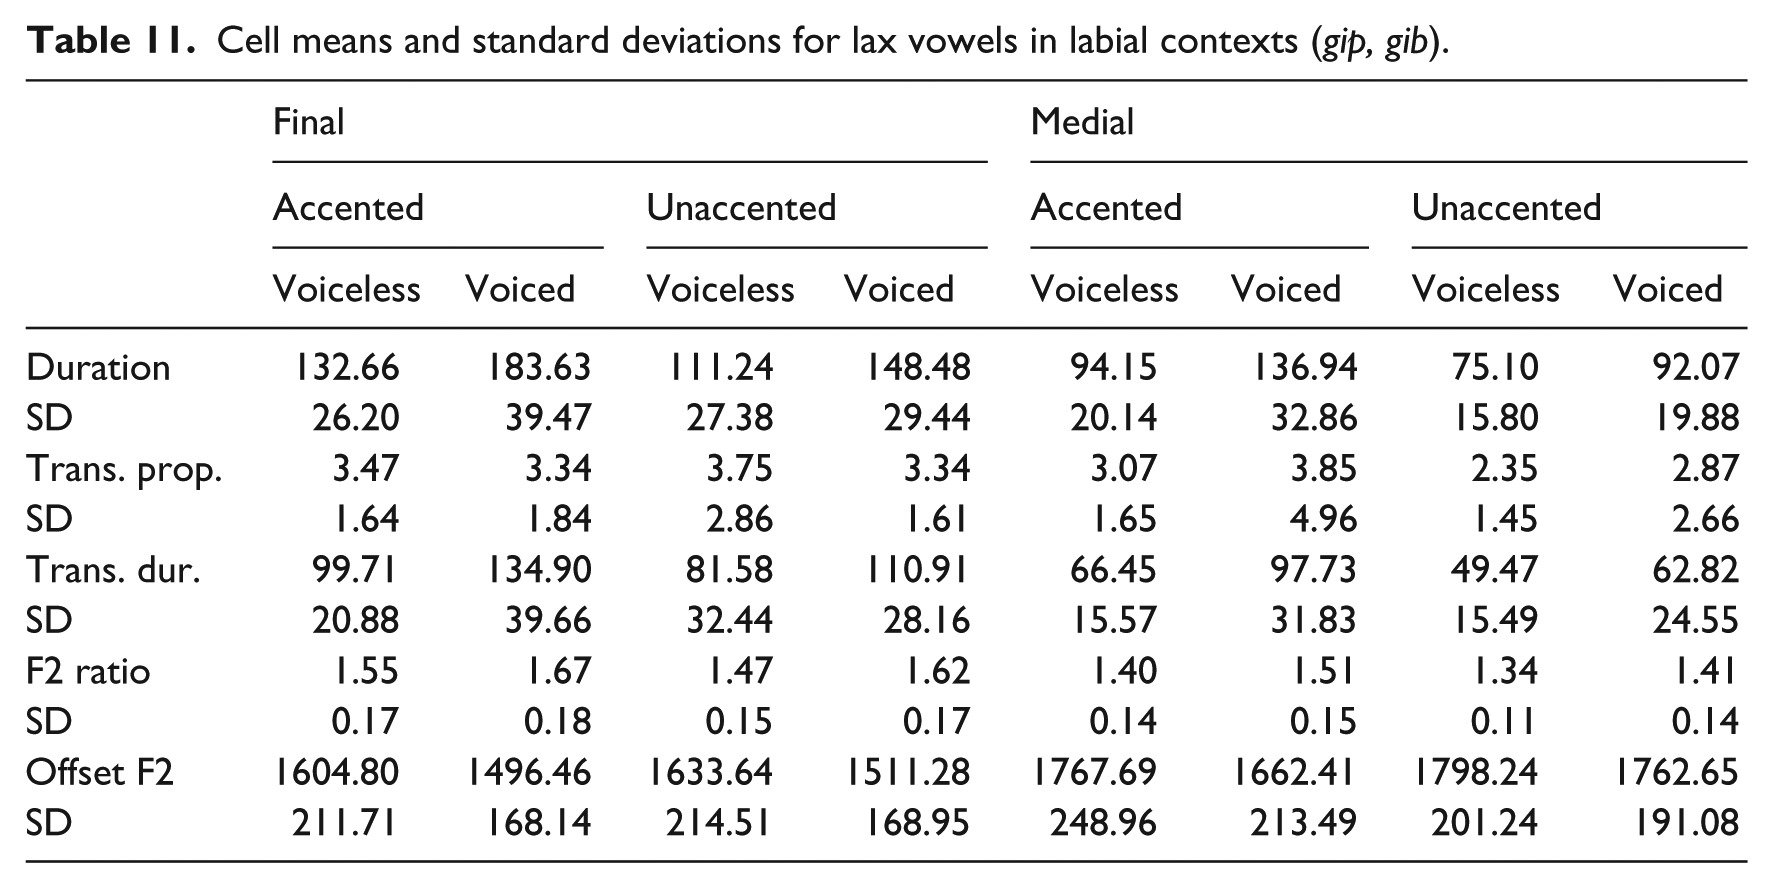
Appendix
Cell means and standard deviations for lax vowels in labial contexts (gip, gib).
| Final |
Medial |
|||||||
|---|---|---|---|---|---|---|---|---|
| Accented |
Unaccented |
Accented |
Unaccented |
|||||
| Voiceless | Voiced | Voiceless | Voiced | Voiceless | Voiced | Voiceless | Voiced | |
| Duration | 132.66 | 183.63 | 111.24 | 148.48 | 94.15 | 136.94 | 75.10 | 92.07 |
| SD | 26.20 | 39.47 | 27.38 | 29.44 | 20.14 | 32.86 | 15.80 | 19.88 |
| Trans. prop. | 3.47 | 3.34 | 3.75 | 3.34 | 3.07 | 3.85 | 2.35 | 2.87 |
| SD | 1.64 | 1.84 | 2.86 | 1.61 | 1.65 | 4.96 | 1.45 | 2.66 |
| Trans. dur. | 99.71 | 134.90 | 81.58 | 110.91 | 66.45 | 97.73 | 49.47 | 62.82 |
| SD | 20.88 | 39.66 | 32.44 | 28.16 | 15.57 | 31.83 | 15.49 | 24.55 |
| F2 ratio | 1.55 | 1.67 | 1.47 | 1.62 | 1.40 | 1.51 | 1.34 | 1.41 |
| SD | 0.17 | 0.18 | 0.15 | 0.17 | 0.14 | 0.15 | 0.11 | 0.14 |
| Offset F2 | 1604.80 | 1496.46 | 1633.64 | 1511.28 | 1767.69 | 1662.41 | 1798.24 | 1762.65 |
| SD | 211.71 | 168.14 | 214.51 | 168.95 | 248.96 | 213.49 | 201.24 | 191.08 |
Acknowledgements
I thank John Kingston for collaboration in the early stages of this project. I also thank Kenneth de Jong, Hanyong Park, Jae Yung Song, the audience at the Chicago Linguistic Society, three anonymous reviewers, and the editor Alexander Francis for very helpful comments. I take responsibility for any flaws and errors.
Funding
This research received no specific grant from any funding agency in the public, commercial, or not-for-profit sectors.