
Abstract
This study examined acoustic characteristics of the phoneme /l/ produced by young female and male adult speakers of Southern White Vernacular English (SWVE) from Louisiana. F1, F2, and F2-F1 values extracted at the /l/ midpoint were analyzed by word position (pre- vs. post-vocalic) and vowel contexts (/i, ɪ/ vs. /ɔ, a/). Descriptive analysis showed that SWVE /l/ exhibited characteristics of the dark /l/ variant. The formant patterns of /l/, however, differed significantly by word position and vowel context, with pre-vocalic /l/ showing significantly higher F2-F1 values than post-vocalic /l/, and /l/ in the high front vowel context showing significantly higher F2-F1 values than those in the low back vowel context. Individual variation in the effects of word position and vowel contexts on /l/ pattern was also observed. Overall, the findings of the current study showed a gradient nature of SWVE /l/ variants whose F2-F1 patterns generally fell into the range of the dark /l/ variant, while varying by word position and vowel context.
Keywords
1 Introduction
Patterns of English /l/ have been well-studied in the sociolinguistic literature. Many of these studies documented /l/ patterns of either British, Scottish, Australian, or New Zealand English /l/ (e.g., Hardcastle & Barry, 1989; Horvath & Horvath, 2001; Macdonald & Stuart-Smith, 2014; Wells, 1982). General findings of these studies are that characteristics of English /l/ vary, ranging from light/clear to dark /l/, depending on the surrounding phonetic context, social factors, or dialectal variations. There also have been studies that included American English (AE) /l/, most of which focused on documenting changes or differences (or similarities) between /l/ in African American Vernacular English (AAVE) and European American Southern English or those of other dialectal varieties of English (Received Pronunciation (RP), Manchester, and Essex) (e.g., Durian, 2008; Turton, 2014; Van Hofwegen, 2010). To the best of the author’s knowledge, there has not been a study that has systematically characterized /l/ patterns of one variety of AE that are produced by speakers in the Southern part of the U.S. This kind of data is important in understanding or documenting dialectal differences of AE /l/, as it would be useful in accurately assessing children’s /l/ sounds without dialectal bias, and also for providing dialectally sensitive guidance for second language learners.
The aim of the current study was to examine pre- and post-vocalic /l/ produced by female and male adult speakers of one variety of Southern White Vernacular English (SWVE) from Louisiana. This was to understand if patterns of SWVE /l/ conform with or show distinct patterns from the reported patterns of AE /l/.
1.1 Characteristics of American English /l/
The phoneme /l/ is one of the two liquid sounds (/l/ and /ɹ/) in English. There are two variants of /l/ in English: light (or clear) and dark /l/, which are transcribed with the International Phonetic Alphabet (IPA) symbols [l] and [ɬ], respectively. Light /l/ typically appears in the pre-vocalic position (e.g., /l/ as in lamp or lime) and is produced with an anterior constriction made with the tongue tip or blade contacting the alveolar ridge, while allowing air to escape on one or both sides of the tongue (e.g., Ying et al., 2017; Zhou et al., 2010). Dark /l/, on the other hand, typically appears in the post-vocalic position (e.g., /l/ as in ball or tall) and involves a lesser degree of anterior constriction along with a secondary articulation (post-dorsal or pharyngeal constriction) made with a more retracted tongue body (e.g., Giles & Moll, 1975; Sproat & Fujimura, 1993). Acoustically, the degree of tongue body lowering is associated with F1 values and the degree of pharyngealization with F2 values (e.g., Recasens, 2004; Recasens & Espinosa, 2005; Simonet, 2015). Thus, typically, dark /l/ shows higher F1 and lower F2 as compared to the formant patterns of light /l/ (e.g., Espy-Wilson, 1992; Lehiste, 1964; Narayanan et al., 1997).
An increasing number of studies, however, have shown evidence of /l/ allophonic variants being on a continuum of lighter to darker /l/ rather than a binary entity (e.g., Gick et al., 2006; Narayanan et al., 1997; Recasens, 2004, 2012; Recasens & Espinosa, 2005). Consistent with this claim, the degree of AE /l/ darkness has been shown to vary by several factors. For example, Sproat and Fujimura (1993) showed the existence of a gradient nature of AE /l/ darkness, which is conditioned by the characteristics of surrounding phonetic contexts. In addition, Turton (2014) showed a greater degree of tongue root retraction in word-final AE /l/ (as in the word heal) than those in other contexts (/l/ as in words such as leap, helix, healing, heal it, or heal followed by another consonant). The degree of AE /l/ darkness has also been shown to vary by sociophonetic factors. For example, Pratt (2018) studied patterns of /l/ produced by students in a public arts school in the San Francisco Bay area. This study showed that high school students engaged in “manual labor” to construct sets needed for school productions and events showed darker /l/ than those in art, design, or theater.
Although AE /l/ varies by several factors, overall, it has been reported to fall into the dark /l/ end of the continuum as compared to those of other dialects/languages (Recasens, 2004; Recasens & Espinosa, 2005; Recasens et al., 1995). For example, the F2 range of AE /l/ reported by Lehiste (1964) (1000 Hz) was lower than that of Eastern Catalan (1600 Hz), a language with the light /l/ variant (as cited in Recasens, 2004, p. 595; Recasens, 2012). In addition, a recent study on ultrasound imaging patterns of AE /l/ by Berkson et al. (2017) showed no evidence of anterior constriction in either pre- and post-vocalic /l/ produced by a speaker from Southern Indiana, supporting the idea that AE /l/ shows a darker quality than those of other dialects/languages.
1.2 Characteristics of SWVE /l/
For SWVE, reports on /l/ patterns have been variable. Some studies have shown patterns of light /l/ in both pre- and post-vocalic positions, as well as in intervocalic position (Recasens & Espinosa, 2005), while others reported dark /l/ or even a velar [ʟ] in word-final position (e.g., Wells, 1982, p. 550). In more recent sociolinguistic studies, ongoing changes in AE /l/ have been reported. For example, Van Hofwegen (2010) studied pre-vocalic /l/ produced by speakers of AAVE in comparison to those produced by European Americans (EA) in North Carolina. This study reported that /l/ produced by younger speakers of AAVE showed lower F2-F1 values than those of older AAVE speakers. This suggests that the quality of AAVE /l/ is becoming increasingly dark, similar to those of EA speakers of the same region. The findings of Van Hofwegen (2010), however, are based on word-initial /l/ from one Southern state in the USA, North Carolina. A study focused on both pre- and post-vocalic /l/ patterns from a different geographical region of the Southern USA, thus, would provide a more complete picture of SWVE /l/ patterns.
The current study focused on characterizing pre- and post-vocalic SWVE /l/ produced by young female and male speakers in Louisiana. In particular, acoustic patterns of SWVE /l/ were analyzed in relation to word position and vowel context. It is well-established that the degree of /l/ darkness is affected by neighboring vowels (e.g., Epsy-Wilson, 1992; Recasens, 2012; Recasens & Espinosa, 2005; Roussel & Oxley, 2010). Simonet (2015) reported that there exists a “linear relation between pharyngealization degree in /l/ and coarticulatory resistance” (p. 150), with a greater vowel effect found for light than dark /l/. According to this view, dialects/languages with light /l/ variants would show a greater effect of neighboring vowels than dark /l/ variants (Recasens, 2012; Simonet, 2015).
The current study chose to study AE /l/ produced by speakers from Louisiana, as Louisiana is unique in that there exist different varieties of English across the region. It ranges from Cajun English to dialects spoken in the New Orleans region, which share some patterns with those of AE spoken in New York (e.g., r-lessness or split-/æ/) (e.g., Labov et al., 2006). Traditionally, Louisiana dialect has been reported to show typical patterns of Southern dialects of AE (e.g., Labov et al., 2006). Recent studies on speech patterns of Louisiana, however, have suggested patterns that are different from what have typically been considered as “Southern” (Carmichael & Becker, 2018). That is, patterns of “linguistic de-Southernization” (e.g., Dodsworth & Kohn, 2012; Fridland, 2001; Koops, 2014), such as no acoustic reversal of tense-lax vowel pairs (/i/-/ɪ/ and /e/-/ɛ/), have been noted in younger generations (Chung, 2020a). This indicates that the Louisiana dialect, at least in vowel patterns produced by younger generations, is on the less-Southern end of the continuum. To the best of the author’s knowledge, whether or not /l/ patterns also conform with this trend has not been documented.
The specific research questions investigated in the current study include the following: (a) do pre- and post-vocalic SWVE /l/ produced by speakers in Louisiana show patterns similar to those reported for AE /l/ in previous studies, and (b) does the degree of /l/ darkness differ by word position (pre- vs. post-vocalic /l/) and by vowel context (high front /i, ɪ/ vs. low back /ɔ, ɑ/)? It was hypothesized that (a) SWVE /l/ would show characteristics of the dark /l/ variant, (b) with differences in the acoustic patterns by word position, but with a relatively minimal effect of the surrounding vowels on /l/, given the stronger coarticulatory resistance operating in darker /l/.
2 Methods
2.1 Participants
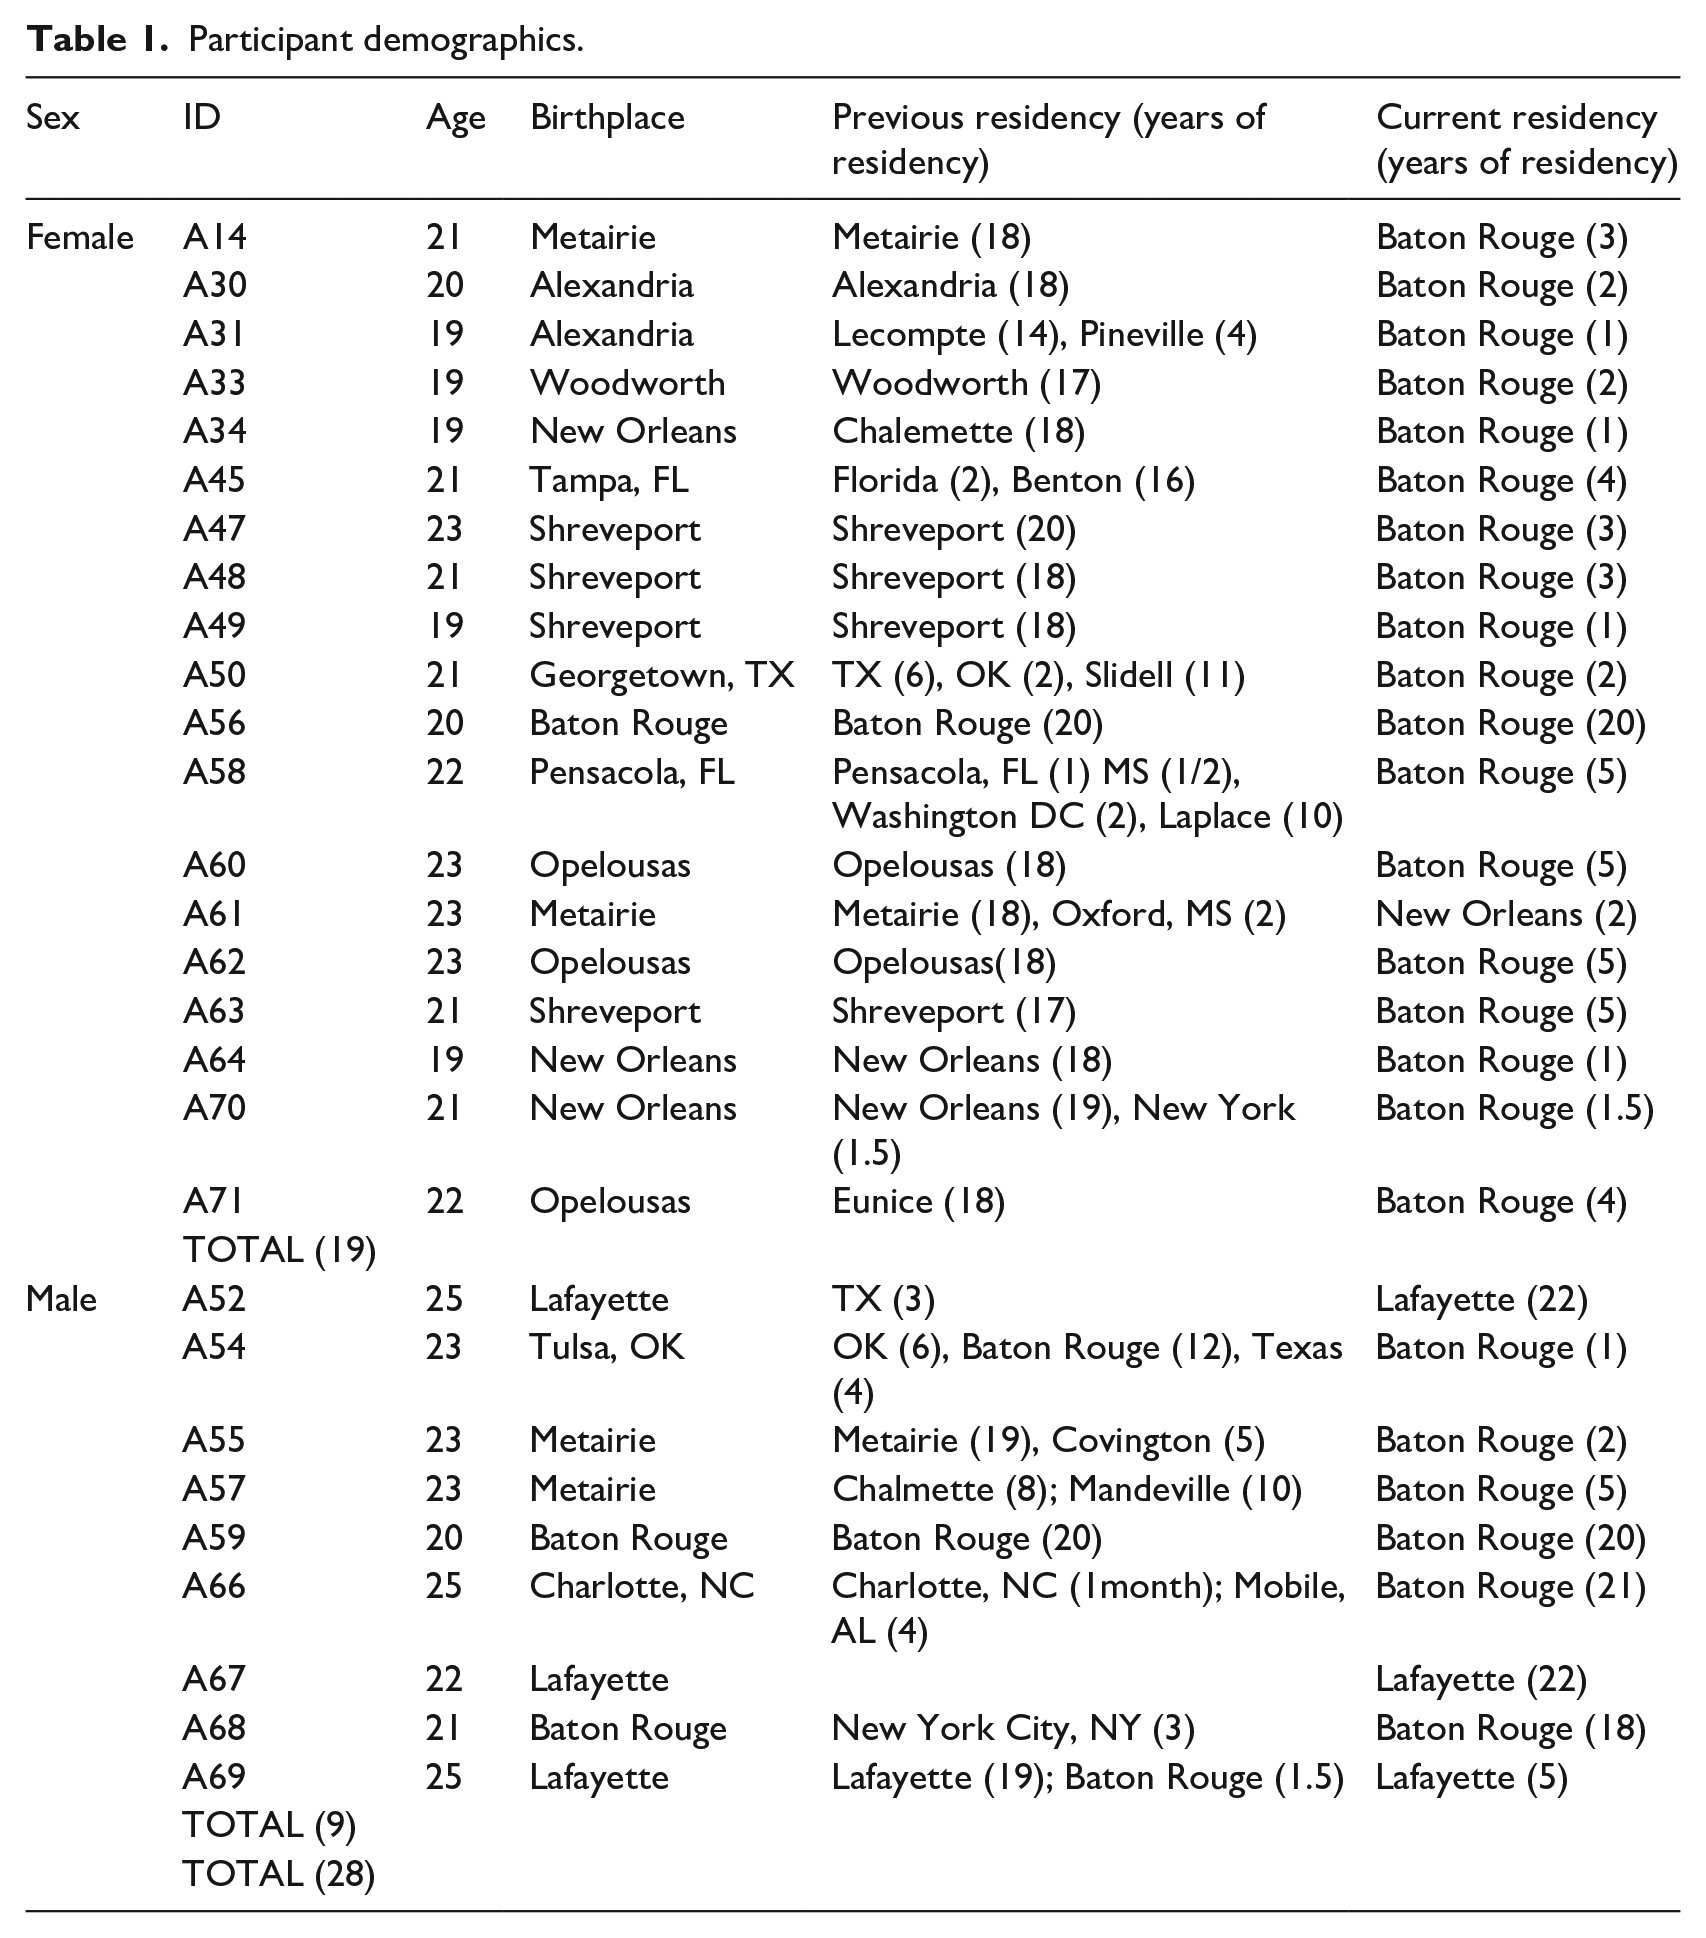
Participants in this study were part of a larger scale study on vowel and semivowel productions (Chung, 2020a; 2020b; Chung & Weismer, 2021). A total of 29 adult speakers, 20 female and nine male college students, aged between 19 and 25, participated in this study. All but three were monolingual speakers of SWVE, who were born and raised in Louisiana and were residing in Baton Rouge, Louisiana, at the time of testing. Three speakers who fall outside of this range included A54, A67, and A69. One speaker, A54, was born and lived in Oklahoma for a year before moving to Baton Rouge, LA (lived for 12 years in LA), and moved to Austin, Texas (lived for 4 years in TX). This subject then moved to Baton Rouge, LA, and had been residing in Baton Rouge for a year at the time of testing. For this reason, this subject was included in the data. For the other two male speakers, A67 was born and raised in Lafayette, LA, and A69 was born in Lafayette, and lived in Baton Rouge for one and a half years, but was residing in Lafayette at the time of testing. Based on a questionnaire each speaker was asked to fill out prior to the testing, all had no history of speech and language disorders, and reported no history of hearing difficulties, with one exception. This speaker’s data was not included in the study. This resulted in a total of 28 speakers, 19 female and nine male adults. In order to control for dialectal influences, participants were asked to complete two questionnaires, one on language background and the other on Cajun French and English background, prior to data collection. Speakers of AAVE or non-Southern AE dialects were also not included in the current study for the reason stated in the previous sentence. In addition, all participants indicated that they either had no Cajun background and did not speak Cajun French, or that they had a Cajun background but did not speak Cajun French. The participant information is summarized in Table 1.
Participant demographics.
2.2 Stimuli
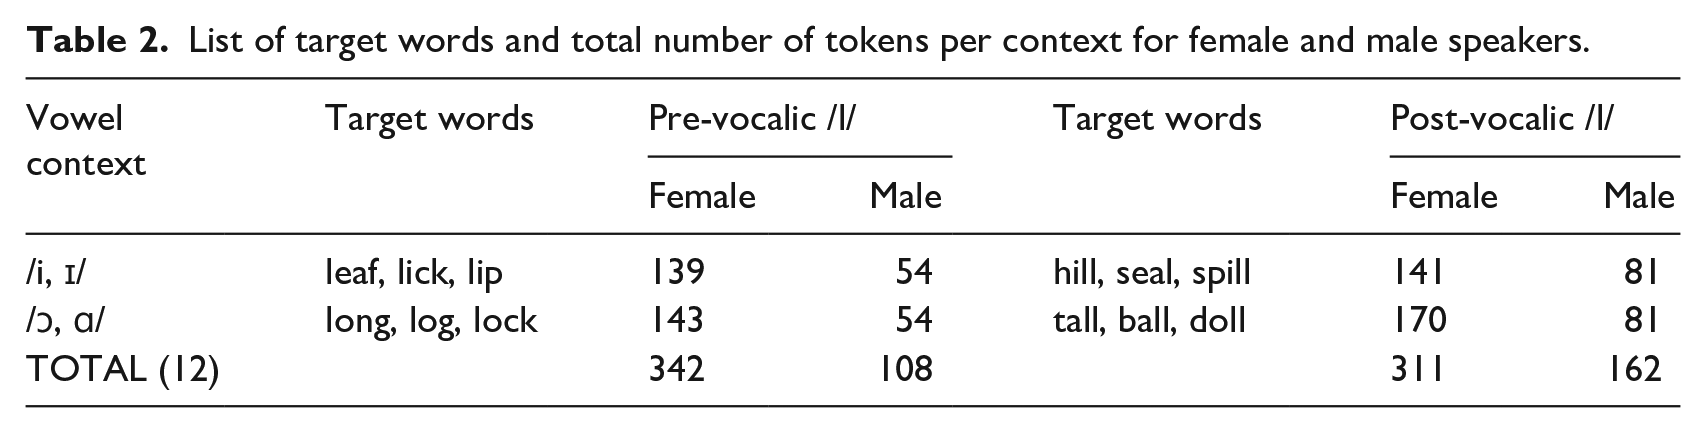
Stimuli included 12 monosyllabic English words including pre- and post-vocalic /l/ in two vowel contexts (high front /i, ɪ/ and low back /ɔ, ɑ/). Each word was elicited three times for each speaker. A list of target words, including the total number of tokens per word, is summarized in Table 2. The total number of tokens included in the analysis differed across participants. This was due to mispronunciations by some speakers, non-analyzable tokens (e.g., clipped tokens or those with background noises), and mistakes during testing.
List of target words and total number of tokens per context for female and male speakers.
2.3 Procedures
For the first 10 female speakers (A14–A50), recordings took place inside a sound booth in a university laboratory. Participants were first asked to complete a short practice session designed to familiarize them with the testing procedures. They were then asked to produce each target word that appeared on a laptop. All target words were elicited in isolation. Filler words were also randomized with target words in the list. All productions were recorded at 44.1 kHz sampling rate using a Shure SM58 microphone connected to a Marantz Professional recorder. For the other nine female and nine male speakers, recordings took place in a quiet place, either in the speaker’s home or any other quiet places with minimal background noise. This was to accommodate COVID-19 precautionary procedures that required social distancing. For speakers who agreed to participate in the study after the COVID-19 outbreak (March 2020), detailed instructions regarding the recording procedures, along with a consent form, questionnaires, and a list of stimuli, were sent to each speaker via email. Upon completing the consent form and questionnaires, each speaker was asked to produce each target word displayed on each slide of a Microsoft PowerPoint file and was asked to record their productions using their cell phone recorder. The default sampling rate for audio recording in iPhone and android phones is 44.1 kHz. All of the recruitment and data analysis procedures have been approved by the university Institutional Review Board.
2.4 Analysis
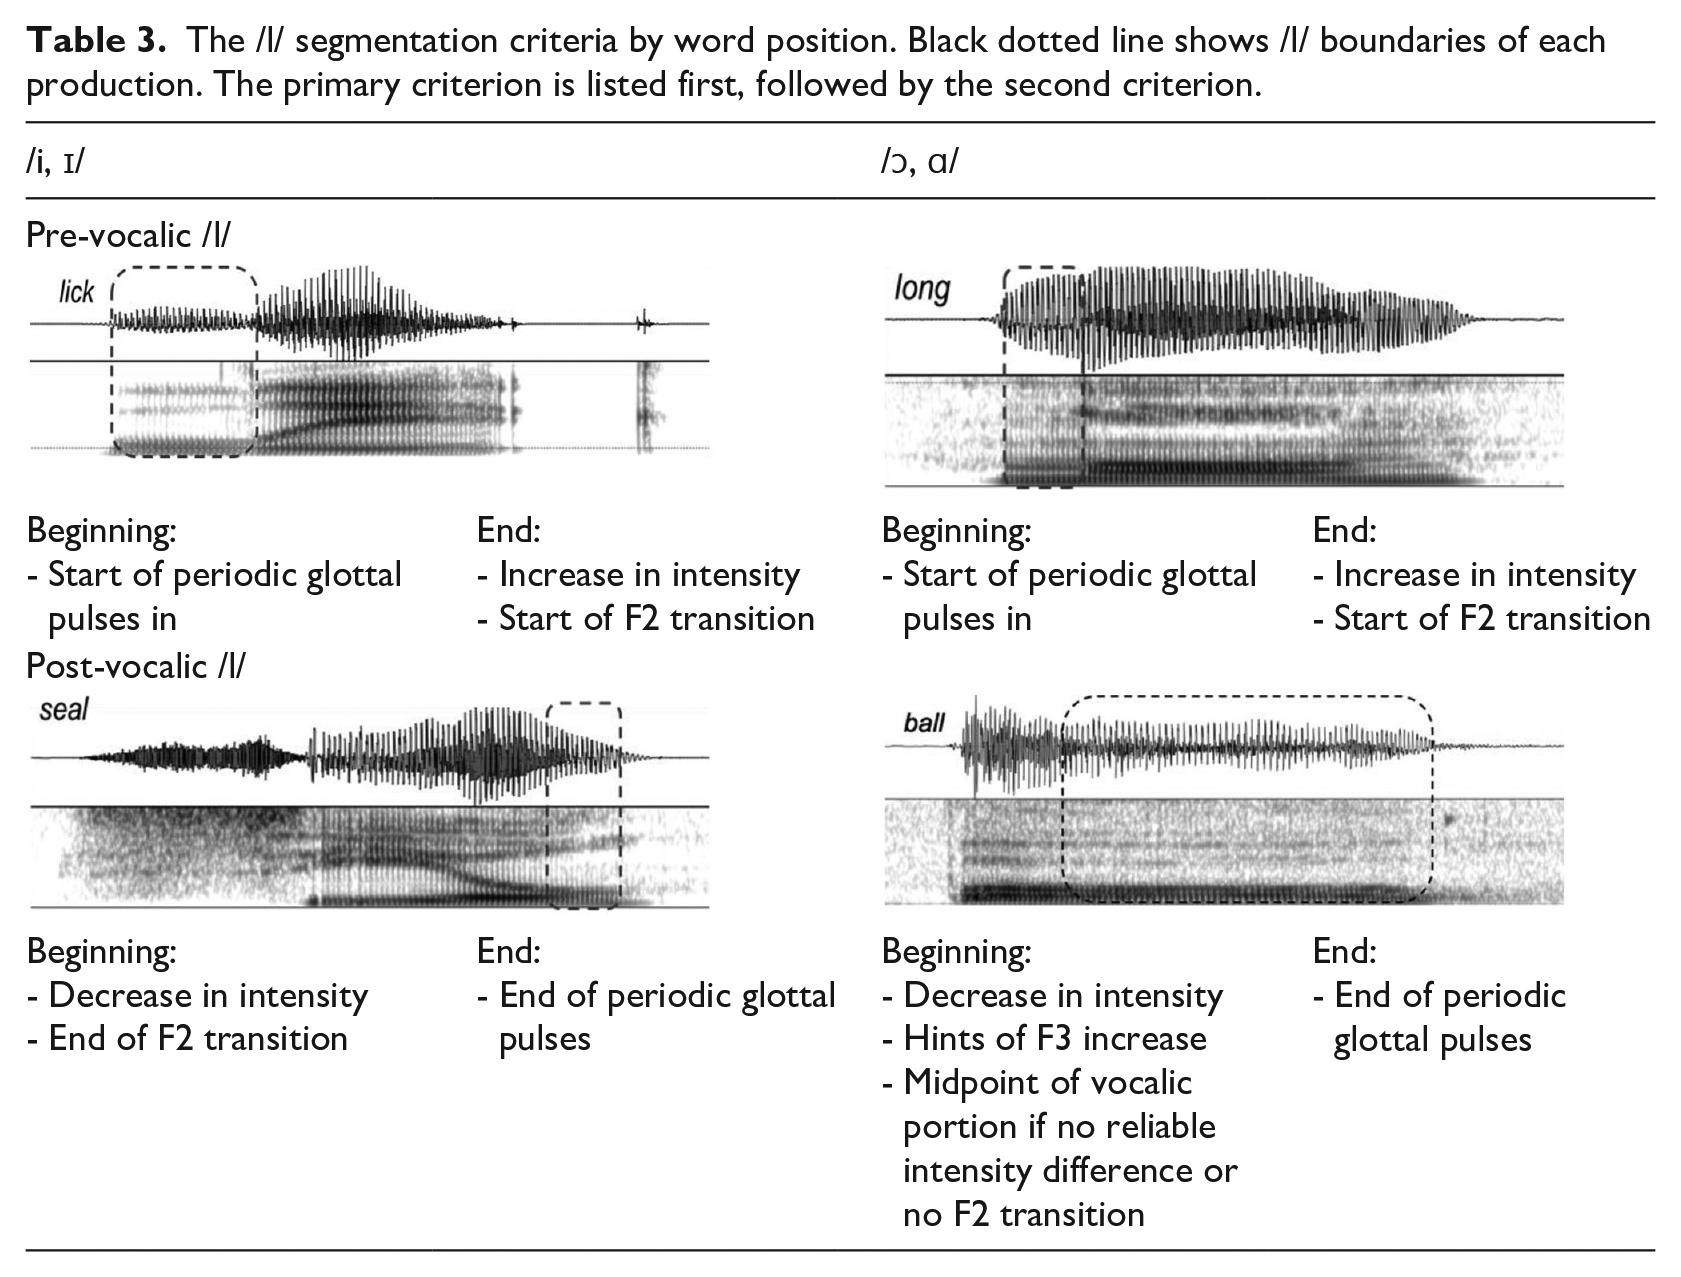
For each production, the /l/ portion corresponding to the duration of the constriction interval was segmented manually using Praat (version 6.0.21; Boersma & Weenick, 2016), following the criteria summarized in Table 3. For pre-vocalic /l/, the onset of the /l/ segment was marked at the point where periodic glottal pulses started to occur, and the offset was marked at the point where intensity started to drop and F2 began to fade out on the spectrogram. For post-vocalic /l/, the onset was marked at the point where the F2 transition from the vowel to the /l/ began to stabilize and intensity started to decrease on the spectrogram. The offset of post-vocalic /l/ was marked at the point where the periodic vibrations ended. These criteria were adapted from previous studies that included acoustic characterization of /l/ (Hawkins & Nguyen, 2004; Recasens, 2012; Simonet, 2015; Zhou, 2009, Figure 5.2; Zhou et al., 2010, Fig 1 (b)). The F1 and F2 values were then extracted at the temporal midpoint of the /l/ segment, using a customized Praat script. Before extracting values, each file was double checked for any formant mistrackings. If any additional mistrackings in formant values were noted after extraction, each was reviewed and corrected manually.
The /l/ segmentation criteria by word position. Black dotted line shows /l/ boundaries of each production. The primary criterion is listed first, followed by the second criterion.
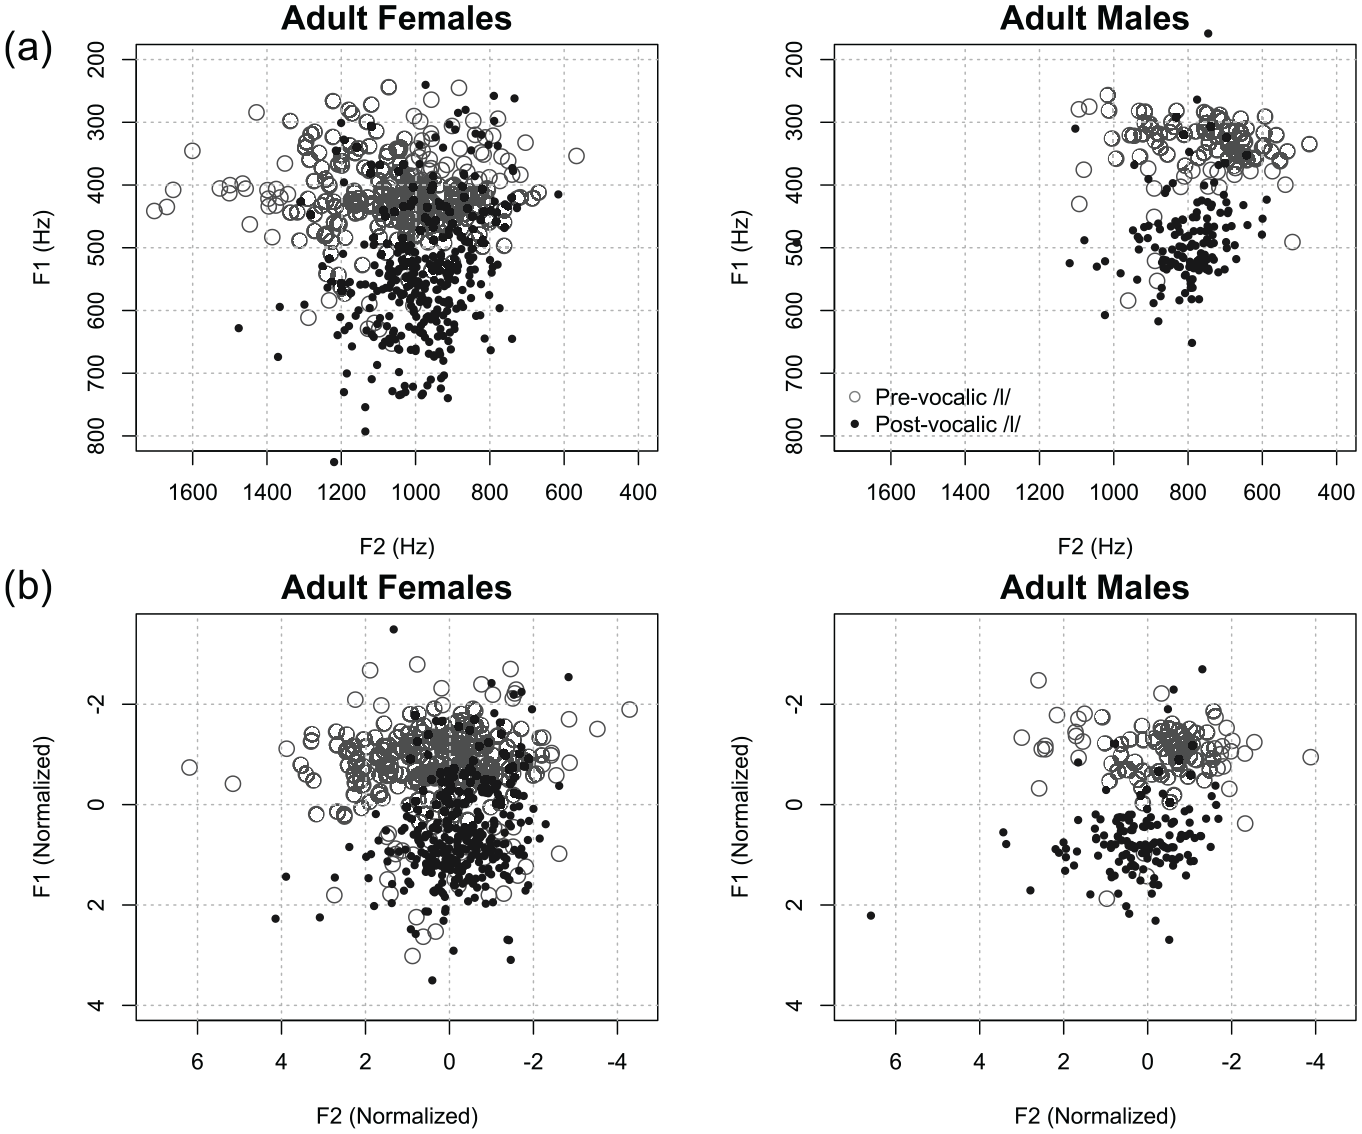
(a) Scatter plots of raw F1 and F2 values (Hz) of /l/ produced by adult female (left) and male (right) and (b) in Lobanov normalized values. Light grey empty circles represent patterns of pre-vocalic /l/ and dark filled circles represent those of post-vocalic /l/.
It has to be acknowledged that acoustic analysis for post-vocalic /l/, especially in the low back vowel context, was challenging, as noted by Hall-Lew and Fix (2012). To document reliable measurements, inter-measurer reliability was obtained. A student trained in acoustic analysis re-measured 20% of the data (three out of 19 female speakers and three out of nine male speakers). The mean differences between the two measurers for the female data were 38 Hz (SD: 52 Hz) for F1 and 62 Hz (SD: 104 Hz) for F2 values. For male data, the differences were 46 Hz (SD: 61 Hz) for F1 and 71 Hz (SD: 126 Hz) for F2 values. A Spearman’s rank correlation was also performed. This analysis was used to accommodate the non-parametric nature of the data, based on the Shapiro–Wilk test of normality. The result showed that the correlation coefficients for female data were r =.83, p < .0001 for F1 and r =.84, p < .0001 for F2, and for male adult data, r =.78, p < .0001 for F1 and r =.75, p < .0001 for F2.
In this study, F1, F2, and F2-F1 values were used to characterize SWVE /l/. The F1 value, which is associated with the degree of tongue body lowering, typically shows lower values for light /l/ and higher values for dark /l/. On the other hand, the F2 value, which is associated with pharyngeal constriction (Stevens, 2000) or front-backness of the tongue, typically shows higher F2 values for light /l/, but lower values for dark /l/ (Dalston, 1975; Espy-Wilson, 1992; Sproat & Fujimura, 1993). To understand a combination of these features associated with F1 and F2 values, especially for the production of dark /l/ that involves both of these features, F2-F1 values were also included in the analyses. F2-F1 values were obtained by subtracting F1 values from F2 values for each production. In fact, F2-F1 values have been used in many previous studies to characterize the degree of /l/ darkness, for which values are higher for light /l/ but lower for dark /l/ (e.g., Recasens, 2012; Simonet, 2015; Van Hofwegen, 2010). After formant values were extracted and corrected (if necessary), the raw F1 (and F2 values) (Hz) were converted to z-scores to allow more direct comparison of acoustic patterns of /l/ across different speakers (females vs. males). The conversion was performed by subtracting the mean F1 (or F2) values of all /l/ sounds produced by each speaker (MEANn) from the raw F1 (or F2) of each production (Fn[V]N), and dividing the value by the standard deviation of F1 (or F2 values) of /l/ of each speaker (Sn) (Fn[V]N = (Fn[V] – MEANn) / Sn) (Thomas & Kendall, 2007). This conversion was performed by using the norm.lobanov () function in the Vowels package (Kendall & Thomas, 2010) for R (R Core Team, 2018). After F1 and F2 (Hz) values were converted to z-scores, normalized F2-F1 values were calculated by subtracting normalized F1 values from normalized F2 values for each /l/ production.
For the statistical analysis, a series of linear mixed-effects models were performed to examine the effects of word-position (WP, word-initial and word-final /l/) and vowel context (Vowel, /i, ɪ/ and /ɔ, ɑ/) on normalized F1, F2, or F2-F1 values. A word position by vowel context interaction was also included in the model. To account for variance associated with individual differences and target words, random intercepts for speaker (ID) and word (word) were included in the model. The model with random intercept for speaker (ID) was attempted, but it resulted in a singular fit (overfit of the data). For this reason, a model with random intercept for speaker (ID) and word (word) were used in the current study. These analyses 1 were performed using the lme() function in the nlme package (Pinheiro et al., 2021). This resulted in a total of six models, one for each of F1, F2, or F2-F1 values for each of female (three models) and male (three models) speaker groups. Post-hoc analysis 2 was conducted by using Tukey pairwise comparisons, using the lsmeans() function in the lsmeans package (Lenth, 2016). The data and R code used for this study are available on OSF (https://osf.io/6nwve/?view_only=8476cfbc24ae43fdb84c787e8c856d4d).
3 Results
3.1 Acoustic patterns of SWVE /l/
Figure 1 illustrates (a) the raw (top) and (b) normalized (bottom) F1 and F2 values of SWVE pre- and post-vocalic /l/ produced by female (left) and male (right) adult speakers. Visual inspection of the data showed that for female speakers, F1 values of pre-vocalic /l/ (mean: 422 Hz) were lower than those of the post-vocalic /l/ (mean: 541 Hz). The same pattern was observed for /l/ produced by male speakers (pre-vocalic /l/ (mean: 339 Hz) < post-vocalic /l/ (mean: 483 Hz)). For F2 values, for female speakers, F2 values of pre-vocalic /l/ (mean: 1040 Hz) were higher than those of the post-vocalic /l/ (mean: 969 Hz), while for male speakers, F2 values of pre-vocalic /l/ (mean: 759 Hz) showed very similar values to those of the post-vocalic /l/ (mean: 807 Hz).
There were three outliers, 1747 Hz for leaf, 1707 Hz for lick (second repetition), and 2084 Hz for lick (third repetition), which were all from one speaker (A50). This could be an individual variation in how the /l/ is being produced. The statistical analysis with and without these three outliers resulted in different effects of phonetic context. In order to report data that better represents the whole group, these three outliers were excluded in the subsequent analyses. Overall, formant data of SWVE /l/, especially the mean F2 values of pre- and post-vocalic /l/, were lower than 1100 (Hz) for both females and males, which is comparable to those of dialects/languages categorized as having dark /l/ variants, F2 < 1100 (Hz) (Lehiste, 1964, as adopted by Recasens, 2012, Table 1).
3.2 Effects of word position and vowel contexts on SWVE /l/
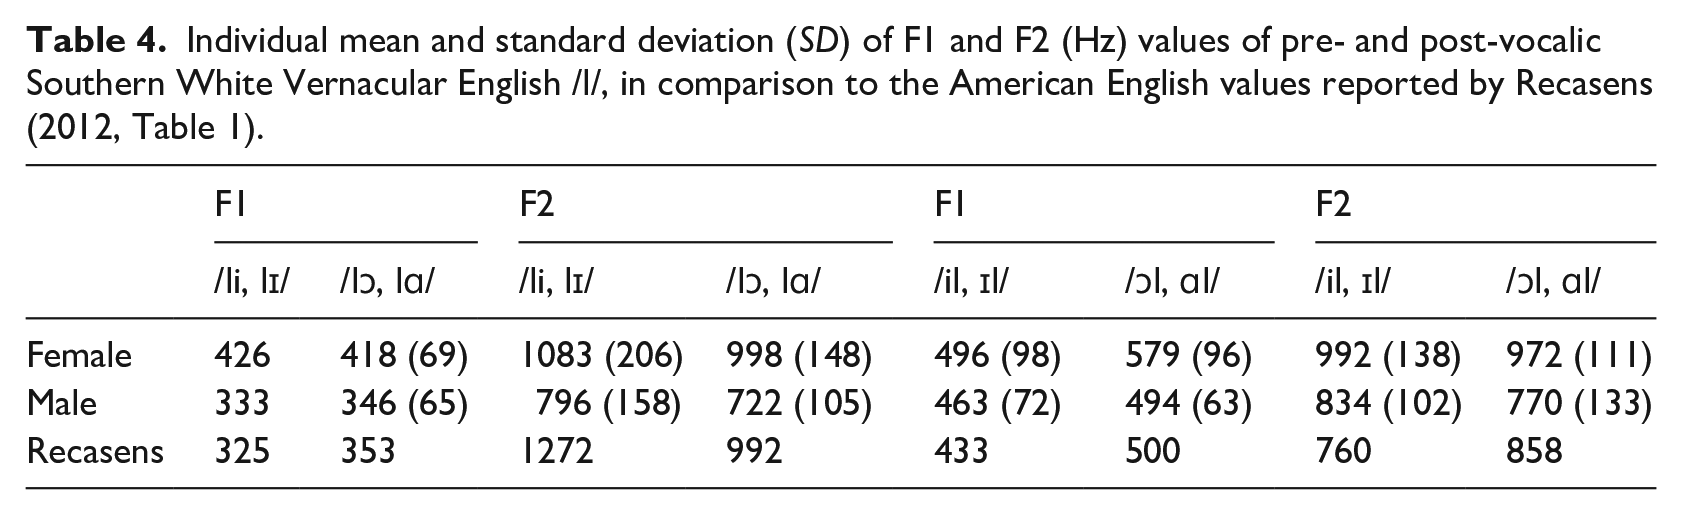
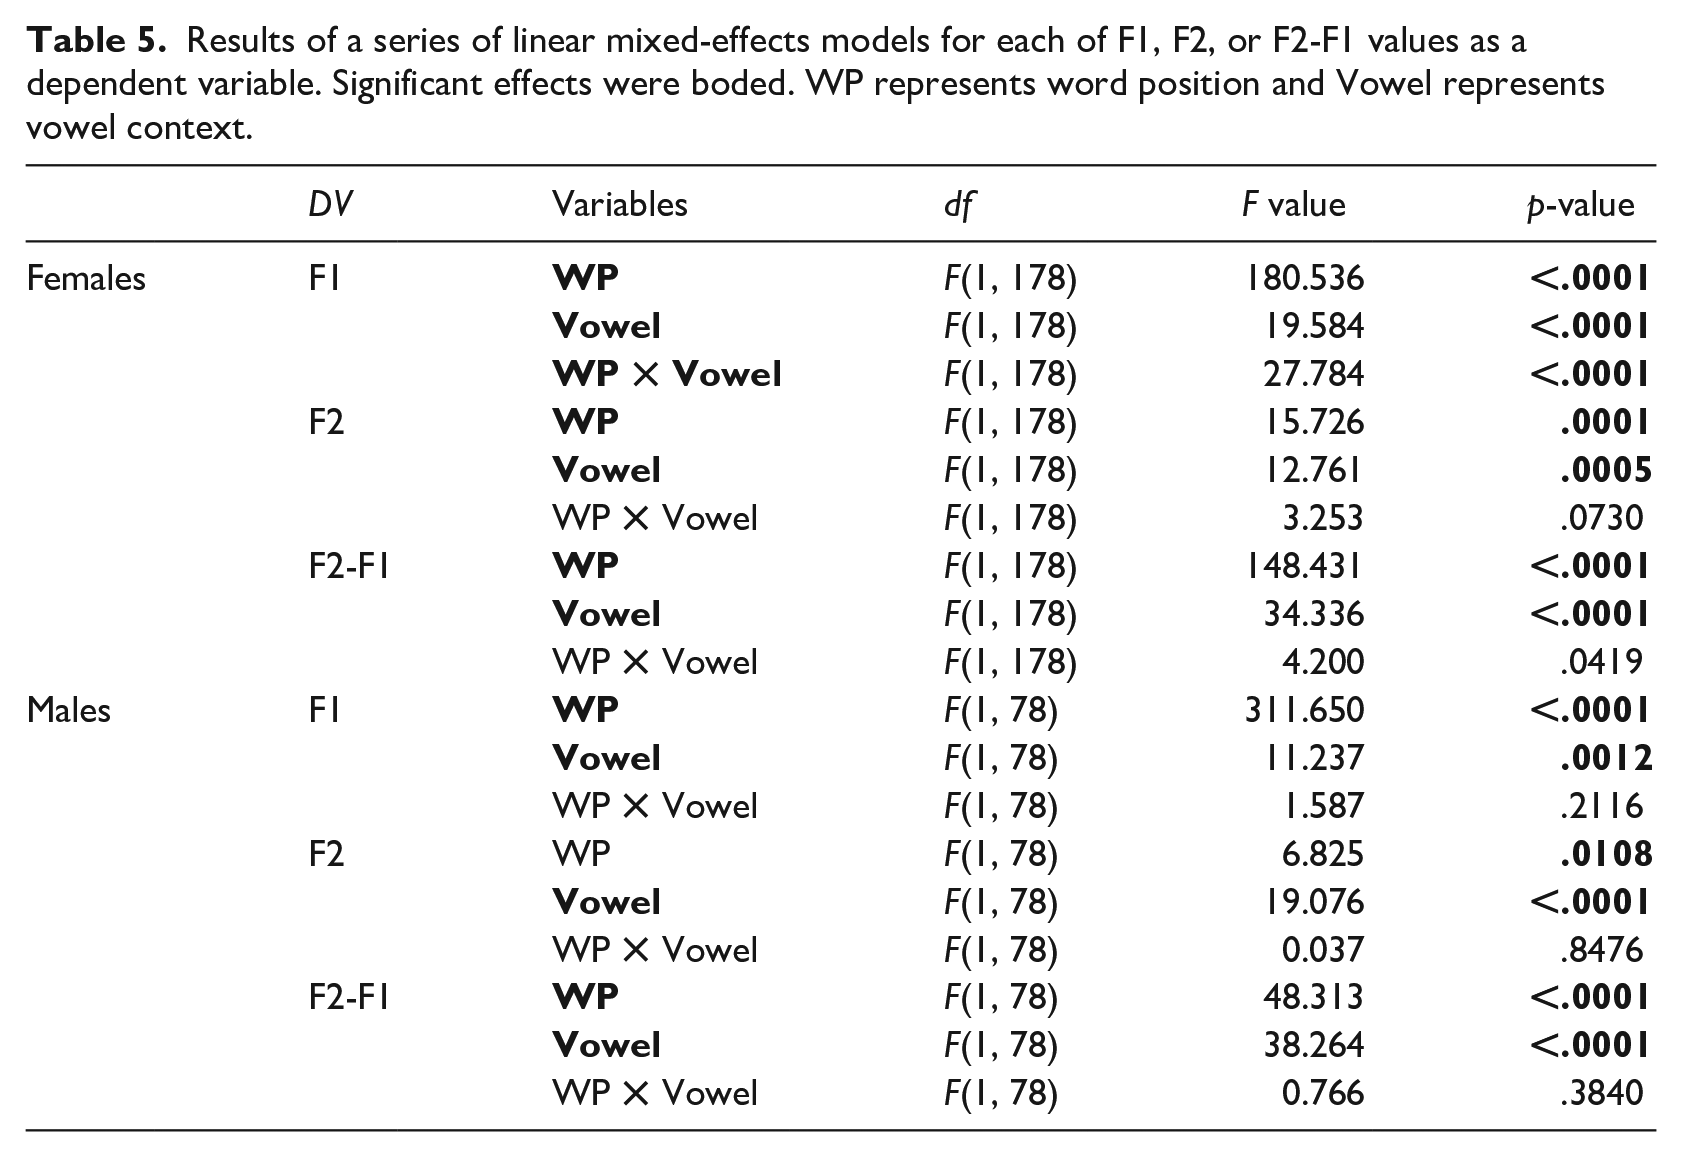
To systematically examine if the patterns of SWVE /l/ were affected by the word position and vowel contexts, F1, F2, and F2-F1 patterns of /l/ were analyzed by word position and vowel contexts. These patterns are displayed in Figure 2 and the mean F1, F2, and F2-F1 (Hz) values for each group are summarized in Table 4, in comparison to the AE data reported by Recasens (2012). The output of the statistical models for each of F1, F2, or F2-F1 as a dependent variable is summarized in Table 5 and the output of the post-hoc tests is summarized in Table 6.
Individual mean and standard deviation (SD) of F1 and F2 (Hz) values of pre- and post-vocalic Southern White Vernacular English /l/, in comparison to the American English values reported by Recasens (2012, Table 1).
Results of a series of linear mixed-effects models for each of F1, F2, or F2-F1 values as a dependent variable. Significant effects were boded. WP represents word position and Vowel represents vowel context.
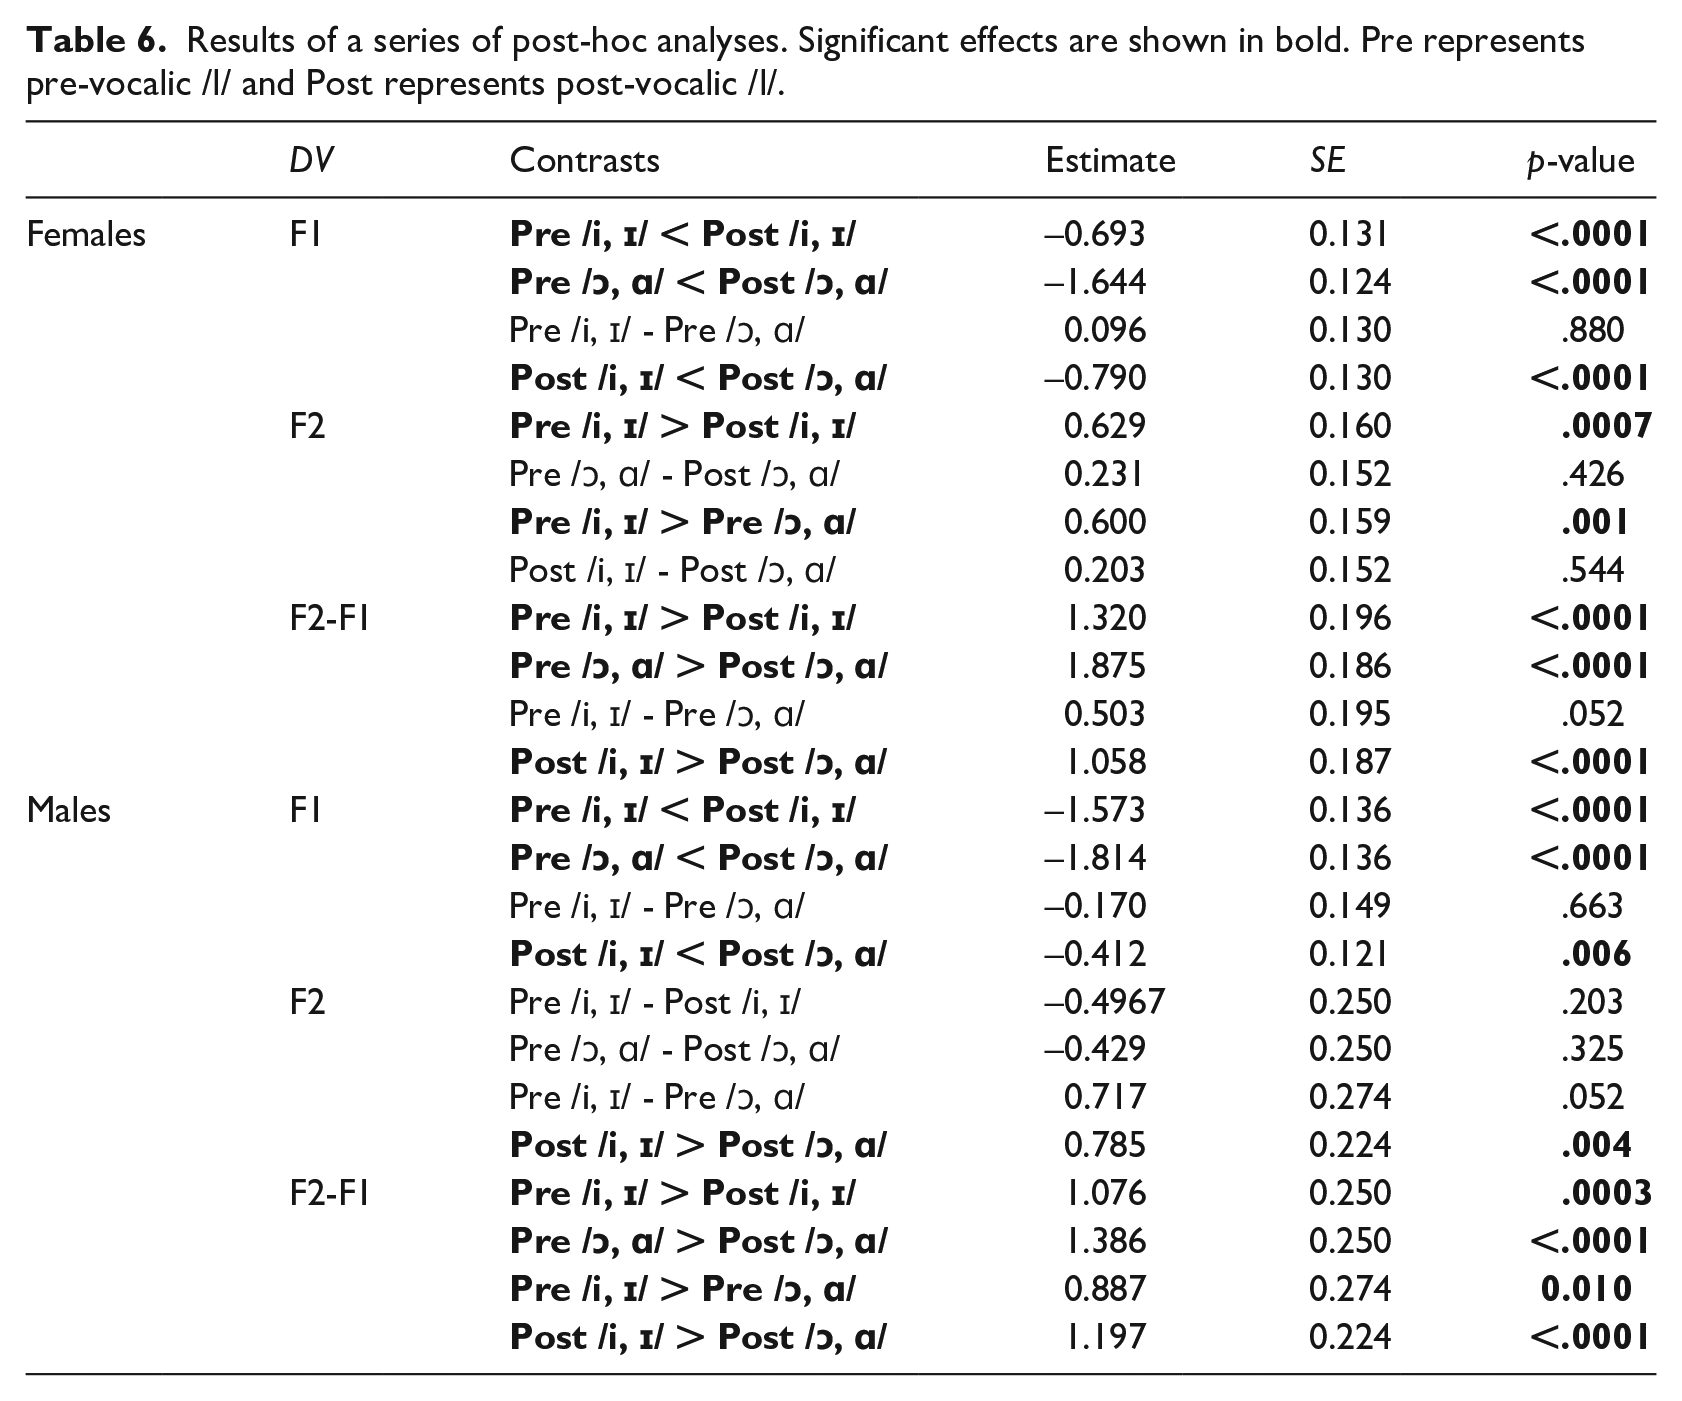
Results of a series of post-hoc analyses. Significant effects are shown in bold. Pre represents pre-vocalic /l/ and Post represents post-vocalic /l/.
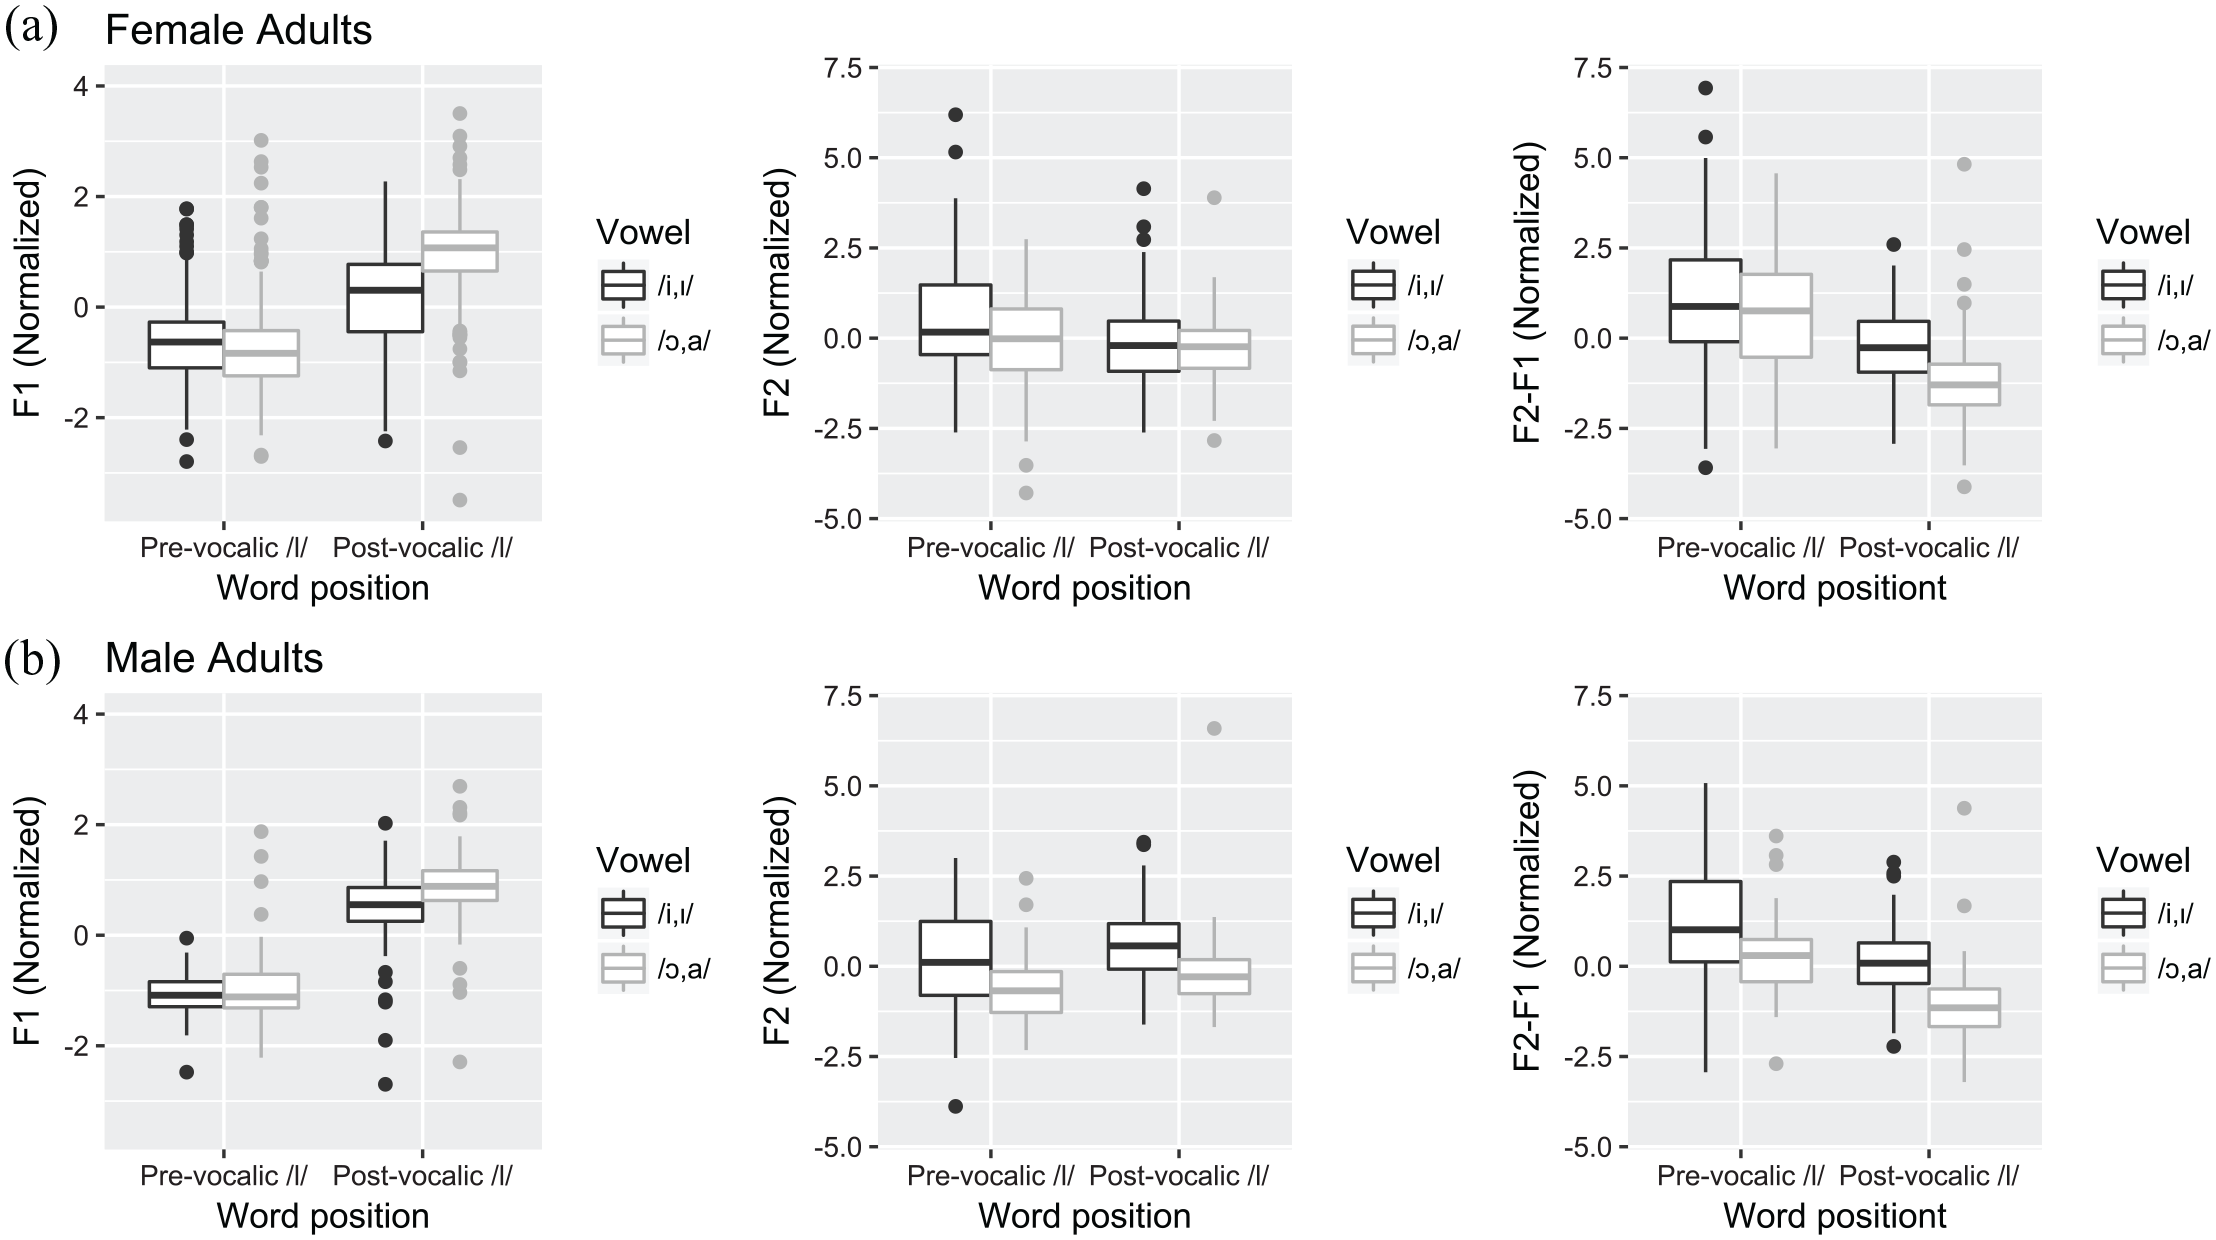
Box plots of normalized F1 (left), F2 (middle), and F2-F1 (right) of /l/ by word position and vowel contexts for productions of female (a) and male (b) speakers.
For female adult speakers, consistent with what was observed in Figure 2, F2-F1 values of /l/ differed significantly by word position (p < 0.001) and vowel context (p < 0.001). The interaction between word position and vowel context was not significant. The same significant effects were found for male speakers for both word position (p < 0.001) and vowel context (p < 0.001). The results of the post-hoc analyses showed that F2-F1 values of pre-vocalic /l/ were significantly higher than those of post-vocalic /l/ in both vowel contexts for both female and male speakers. For the vowel context effect, /l/ in the high front vowel context showed significantly higher F2-F1 values than those in the low back vowel context for both pre- and post-vocalic /l/ for male adult speakers. For female speakers, the vowel effect was significant only for post-vocalic /l/.
In order to see if the word position and vowel effect on /l/ differed by individual, F1 and F2 patterns of /l/ were examined for each participant. The /l/ patterns of each individual, predicted from the linear mixed-effects model, are displayed in Figure 3 (female speakers) and Figure 4 (male speakers). As can be observed in Figures 3 and 4, although the patterns slightly varied by individual speaker, overall, both female and male speakers showed higher F2-F1 values for pre-vocalic than post-vocalic /l/ in both vowel contexts. These patterns are consistent with those displayed in Figure 2. In addition, /l/ patterns in the high front vowel context showed higher F2-F1 values than those in the low back vowel context for both female and male speakers, with some speakers showing more apparent vowel effect for post-vocalic /l/ than pre-vocalic /l/.
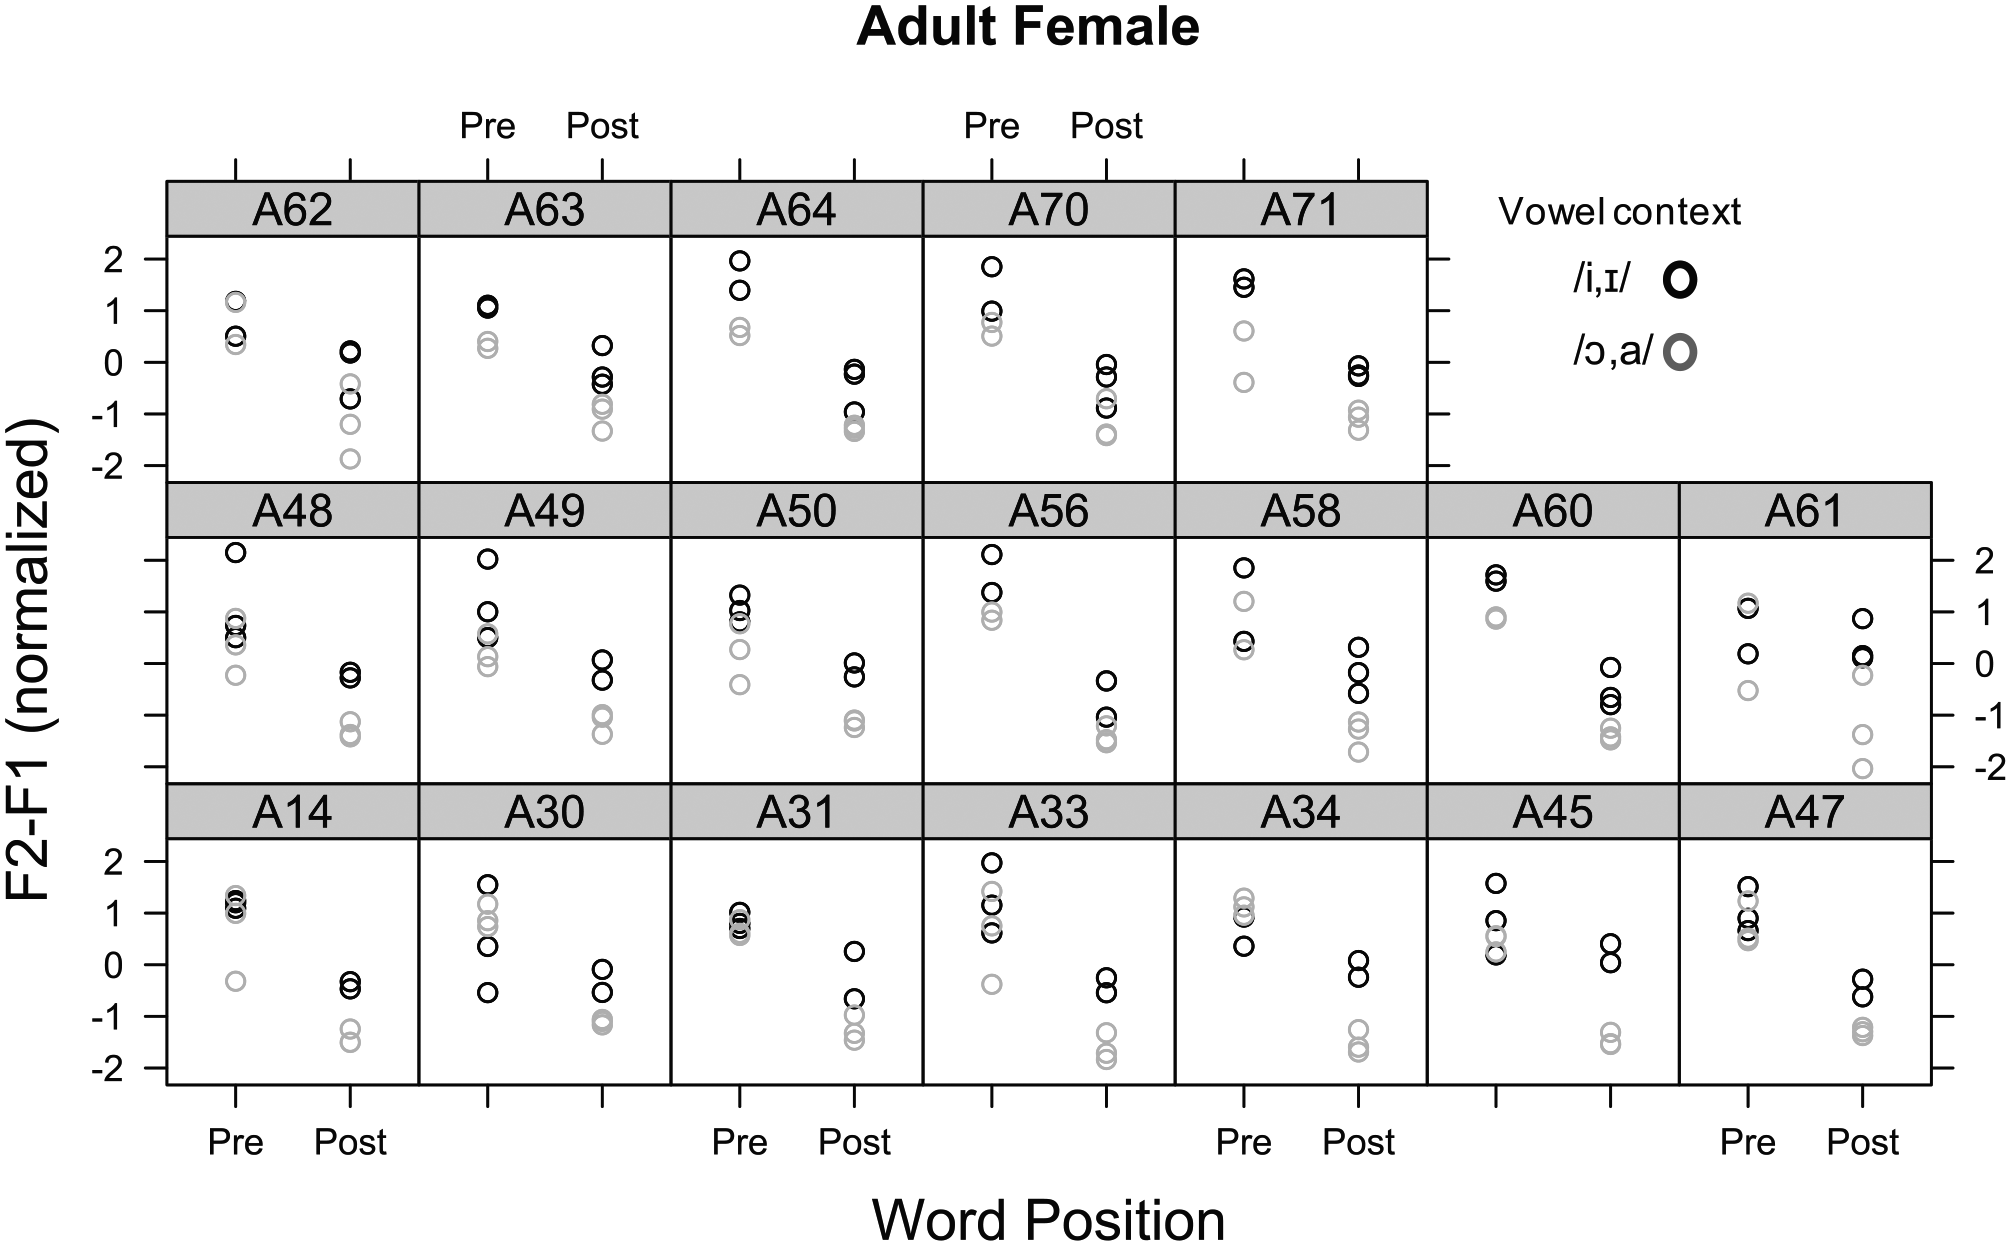
F2-F1 (normalized) patterns of /l/ of each female adult speaker predicted from the linear mixed-effects model.
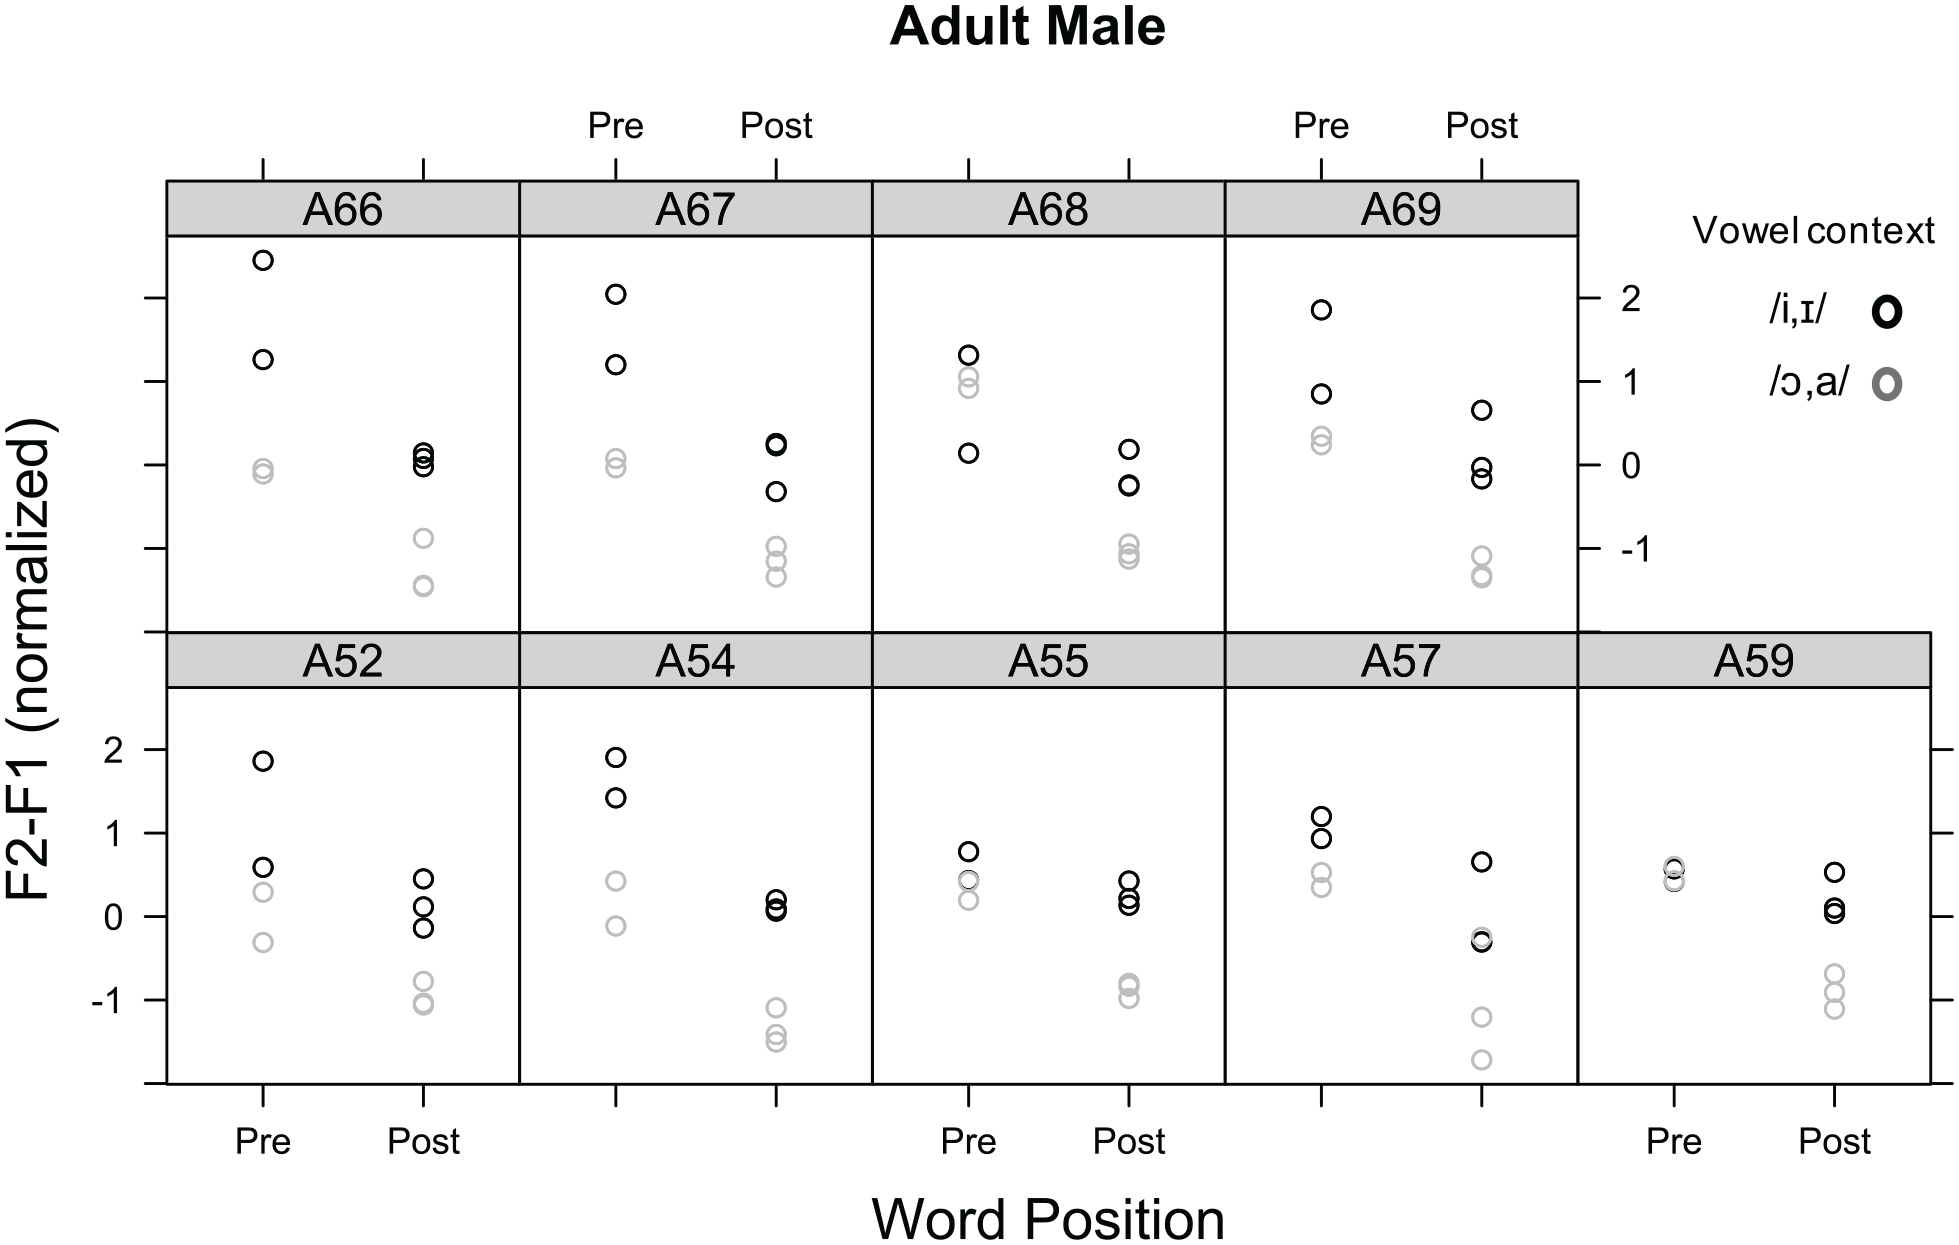
F2-F1 (normalized) patterns of /l/ of each male adult speaker predicted from the linear mixed-effects model.
4 Discussion
The current study examined pre- and post-vocalic /l/ in two vowel contexts produced by college female and male SWVE speakers from Louisiana. Firstly, as predicted, the qualitative analysis of F1, F2, and F2-F1 figures showed that formant patterns of SWVE /l/ were comparable to those of dialects/languages with dark /l/ variants. This finding is consistent with previous studies that suggested darker AE /l/ compared to /l/ patterns of other dialects/languages (Berkson et al., 2017; Recasens, 2004; Recasens & Espinosa, 2005; Recasens et al., 1995; Wells, 1982). This also suggests that SWVE speakers produce both pre- and post-vocalic /l/ with a more retracted and lowered tongue body and root than speakers of dialects/languages with light /l/ variants (e.g., Spanish). Secondly, the findings of the current study showed that there were significant differences in /l/ acoustic patterns by word position. Pre-vocalic /l/ showed significantly higher F2-F1 values than those of post-vocalic /l/ consistently across female and male speakers. This indicates that although SWVE /l/ falls within a range of dark /l/, the degree of /l/ darkness differs by word position, with pre-vocalic /l/ being produced with a less retracted tongue body and root than post-vocalic /l/. This finding is also consistent with the findings of Turton (2014), who showed a more retracted tongue root for word-final /l/ compared with word-initial /l/ in AE (dialect or region not specified), and with the findings of Berkson et al. (2017), who showed no evidence of an anterior constriction in pre- and post-vocalic /l/ productions by one speaker from Southern Indiana in comparison to one speaker from New Hampshire.
In addition, contrary to the initial hypothesis that predicted a minimal vowel context effect on SWVE /l/, the findings of the current study showed significant differences in /l/ patterns by vowel contexts (/i, ɪ/ > /ɔ, ɑ/). At first, this finding seemed to contradict the vowel effect reported by Simonet (2015), which showed a greater degree of vowel effect in Spanish /l/, a language with the light /l/ variant, than in Catalan /l/, a language with the dark /l/ variant. However, given that some degree of vowel effect was found both in Spanish and Catalan /l/, the findings of the current study are in line with the findings of Simonet and also provide additional evidence that shows a “gradient” nature of /l/ darkness that is mediated by phonetic contexts (e.g., Recasens, 2004; Recasens & Espinosa, 2005; Simonet, 2015, p.148).
In summary, although at a relatively small scale, the findings of the current study provided dialect-specific /l/ acoustic data produced by SWVE speakers from Louisiana. Overall, SWVE /l/ showed patterns of dark /l/, although some individual differences were noted. Based on the /l/ patterns of previous studies (i.e., EA speakers in North Carolina reported by Van Hofwegen, 2010), it can be speculated that speakers of SWVE produce /l/ with a lesser degree of anterior constriction than those of non-SWVE speakers. However, it should be noted that the current study included only white college students from Louisiana. Whether the /l/ patterns documented in the current study showed /l/ characteristics genuinely unique to SWVE or are indicative of the ongoing changes occurring in younger generations, such as the “linguistic de-Southernization” reported for vowels (e.g., Dodsworth & Kohn, 2012; Fridland 2001; Koops et al., 2008), is premature to conclude without additional /l/ data from older SWVE speakers of the same region. Despite this, the findings of the current study justified the importance of considering the linguistic background of speakers as well as phonetic contexts when studying characteristics of /l/ and for guiding phonetic placement cues for eliciting /l/ sounds for individuals with /l/ misarticulations.
This study is not without any limitations. Note that this study was based on acoustic patterns of /l/ elicited in single words. This could have resulted in relatively hyper-articulated productions, resulting in a greater vowel effect on /l/ than those elicited in a connected speech sample. In addition, given the inter-speaker variation noted in Figures 3 and 4, as well as the challenges associated with acoustic analysis of post-vocalic /l/, the addition of articulatory-based data elicited in more naturally produced speech would be necessary before making any generalization or drawing a firm conclusion about the characteristics of SWVE /l/. A larger pool of speakers, including speakers of AAVE or speakers from non-Southern parts of the USA, and with a wider age range would also be important in providing better insight into Southern-specific patterns in AE /l/.