
Abstract
For successful processing of the speech signal, listeners need to perform at least two prosodic tasks: allocating prominences and grouping into smaller units. The separation of these two functions has been a fundamental assumption in the modeling of prosody production and perception across languages. The current study investigates how listeners allocate prominences and demarcate (group) them at the word level in Papuan Malay, an under-researched language of Papua, Indonesia. To this end, a tapping and a grouping task were carried out using acoustically manipulated sequences of strong and weak syllables. It was tested how duration, intensity, spectral tilt and vowel quality affect listeners’ prominence and grouping responses. The results show that, taking into account the variation among participants and items, all cues facilitate prominence allocation, in particular if they are strong enough. Spectral tilt was the main cue found to affect grouping, although duration seemed to play a double role for both prominence and grouping. The outcomes are discussed not only for how they improve our understanding of Papuan Malay prosody, but also for their contribution to the separation of perceptual functions in prosodic theory.
1. Introduction
Recent studies investigated whether there is word stress in Papuan Malay, a language spoken in East Indonesia. Even though word stress does not appear to be lexically stored (Kaland, 2024), several experimental results indicate that this language still has a form of regular word prominence that could be termed ‘word stress’ (e.g., Kaland, 2019, 2021; Kaland et al., 2021; Kluge, 2017). The results are surprising in the context of claims that Papuan Malay and (many) languages spoken in Indonesia lack word stress (Goedemans & van Zanten, 2014; Himmelmann & Kaufman, 2020; Riesberg et al., 2018). The underlying factor that has challenged the research is likely more fundamental in nature. That is, the basic functions of prosody in these languages are not fully understood. Concerning Papuan Malay, it has been a challenge to distinguish highlighting and demarcating functions, as generally done in prosodic theory, that is, pitch accents and boundary tones in autosegmental-metrical theory (e.g., Silverman et al., 1992), head and edge marking in prosodic typology (e.g., Jun, 2014), prominences and boundaries in prosodic transcription methods (e.g., Cole & Shattuck-Hufnagel, 2016), prominence and grouping as perceptual processing mechanisms (Wagner, 2022), etc. It seems that the two functions are (partially) conflated in Papuan Malay in the sense that the largest F0 excursions are mainly found at the right edge of phrases (Kaland & Baumann, 2020) and that listeners tend to agree on where they hear phrase boundaries, more so than on where they hear phrasal prominences (Riesberg et al., 2020).
Recent studies proposed that the identification of the most salient sounds (prominence) and the chunking of the speech stream into smaller parts (grouping) are the core perceptual mechanisms, and that the notions of trochees (strong-weak) and iambs (weak-strong) are derived from these mechanisms, as supported by experimental evidence from perception tasks in English and other languages (Moghiseh et al., 2023; Wagner, 2022; Wagner et al., 2021). This proposal is an alternative interpretation to the iambic-trochaic law (ITL; e.g., Hayes, 1995), which is further discussed in Section 1.4. Although several studies found support for the ITL across languages, the results were often affected by the prosodic characteristics of the languages under investigation, in particular by word stress patterns (e.g., Crowhurst, 2016, 2020).
The current study investigates prominence and grouping at the word level in Papuan Malay. This is needed to shed light on the common separation of highlighting and demarcating functions in prosodic theory, using evidence from a language in which the prosodic system appears to be largely different from well-studied languages. Two perception tasks are reported in which listeners either allocate word prominences by tapping or detect word boundaries by grouping, while listening to an ambiguous rhythmical sequence of acoustically manipulated syllables. Section 1.1 reports the state of the art in Papuan Malay stress research. Section 1.2 discusses two perceptual functions of word stress. Sections 1.3 and 1.4 provide an overview of previous studies using rhythmic experiments. Finally, Section 1.5 summarizes the main aims and research questions of this study.
1.1. Word Stress in Papuan Malay
Papuan Malay is an Eastern-Indonesian Trade Malay variety spoken in the Indonesian provinces of Western New Guinea (Papua, West-Papua, South Papua, Central Papua, Highland Papua, Southwest Papua). Its prosodic system has received increased attention in recent research. The core aim in a series of quantitative studies was to verify the claim that there is regular penultimate word stress, unless schwa is in the penultimate syllable (then stress is ultimate), as put forward for Papuan Malay (Kluge, 2017) and previously for other Trade Malay varieties (e.g., Paauw, 2009). Concerning Papuan Malay, acoustic analyses of spontaneously produced speech showed that duration, spectral tilt and vowel quality were the strongest correlates of word stress (Kaland, 2019). Perception experiments furthermore indicated that listeners tend to be more sensitive to the irregular (ultimate) stress pattern than the regular (penultimate) one; however, with overall small influence of the individual acoustic cues on the perception of nonce syllables (Kaland, 2020). Lexical analyses showed that stress patterns are governed by phonological principles and that stress information can be useful to reject alternative word candidates (Kaland et al., 2021). The latter finding was confirmed in a gating task (Kaland, 2021). A follow-up study tested the extent to which Papuan Malay stress is lexically stored by means of a recall task (‘stress deafness’, Kaland, 2024). Papuan Malay listeners had difficulties recalling stress patterns from their working memory. Their responses were similar to those of listeners of Standard Indonesian (analyzed as stressless) in a previous study using the same experimental materials (Rahmani et al., 2015). It is therefore unlikely that Papuan Malay stress is lexically stored. The lack of lexical storage was indeed predicted for languages with highly regular stress patterns (e.g., Peperkamp et al., 2010).
While previous studies on Papuan Malay found evidence for word stress, its limited functionality and lack of lexical storage cast doubt on the role of this pattern in the prosodic system of the language. Typological accounts of prosodic systems generally assume that the availability of stressed syllables implies anchor points for phrase-level accents, as is the case in many head languages (Jun, 2014). The literature has reported languages for which this is not the case (e.g., Lindström & Remijsen, 2005). Crucially, there is evidence that the largest F0 movements in Papuan Malay occur in the final two syllables of phrases (Kaland & Baumann, 2020; Kaland et al., 2023). These syllables are the domain of final lengthening (Kaland & Baumann, 2020) and are likely the carriers of a phrase-level accent and boundary tone, respectively, indicating that not all stressed syllables in a phrase are anchors. It becomes clear that the prosody of Papuan Malay poses a challenge to current typological accounts and to the common theoretical distinction between highlighting and demarcative functions of prosody. While more research is currently needed and undertaken to clarify this question for the phrase level (e.g., Kaland & Grice, 2024), the present study focuses on the role of word prosody. In particular, highly regular stress as found in Papuan Malay could be ideal for listeners to segment incoming speech into words. The question remains whether Papuan Malay listeners do this and how this demarcating function relates to the potential highlighting function of word stress. The next section discusses these two major functions of word stress and their relation to speech rhythm.
1.2. Perceptual Functions of Word Stress
Perceptual research on word stress has distinguished culminative and demarcative functions of word stress (e.g., Cutler, 2005; Hyman, 2006). The first refers to a single most prominent syllable in the word, and the latter to the way stress helps to segment speech into words. The culminative function of word stress shows a conceptual parallel with the highlighting function of prosody at the phrase level as discussed above. That is, in languages with stress, each word has one syllable that is acoustically highlighted, made prominent, acts as the metrical head, etc. It has been shown that listeners use this stress information in perception, both in word activation to reject alternative candidates (e.g., McQueen et al., 1995), and in word selection such as distinguishing between word classes (e.g., control as noun or verb; Sereno, 1986).
As for the demarcative function of word stress, studies have shown that listeners use stress information to detect word boundaries, regardless of whether languages have variable or fixed locations of word stress. Thus, despite stress being described as ‘free’ in Germanic languages, there is a strong tendency for stress to occur word-initially (Baayen et al., 1995). Studies on English and Dutch have shown that listeners’ misperceptions (e.g., ‘Into opposing camps’ perceived as ‘Into a posing camp’, see Cutler & Butterfield, 1992, Table 1) are affected by this tendency. That is, stressed syllables tend to occur word-initially in wrongly segmented speech (Cutler & Butterfield, 1992; Vroomen et al., 1996). As for fixed-stress languages, listeners in word recognition experiments were also shown to make use of the canonical location of stress (e.g., French: Dahan, 1996 and Finnish: Suomi et al., 1997).
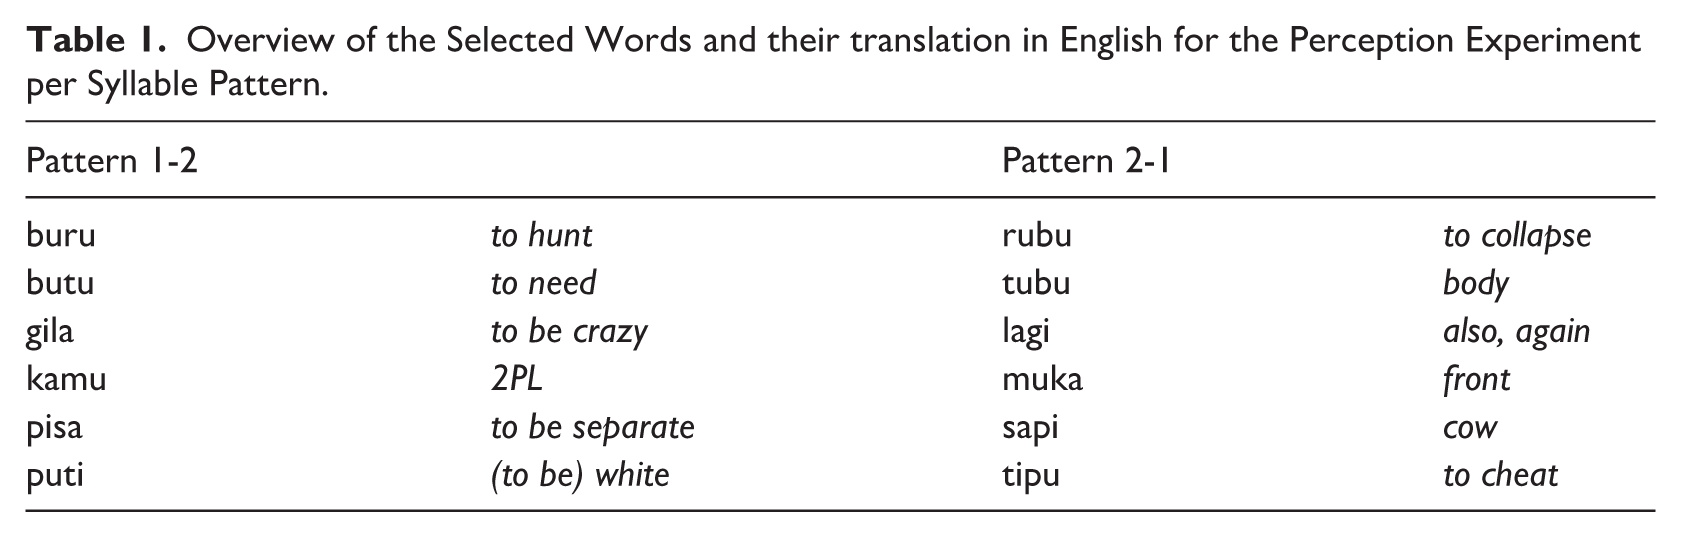
Overview of the Selected Words and their translation in English for the Perception Experiment per Syllable Pattern.
Word stress, in particular the regularity with which it occurs, is often seen as part of speech rhythm (e.g., Cummins & Port, 1998). Speech rhythm research has moved away from the classic distinction between stress-timed, syllable-timed and mora-timed languages, mainly because natural speech is not strictly isochronous as in music (e.g., Arvaniti, 2009; Dalla Bella et al., 2013; Nolan & Jeon, 2014). Experiments have shown, however, that a more strictly timed rhythm can be forced onto speech in so-called speech cycling tasks in which speakers synchronize their utterances to a metronome (e.g., Cummins & Port, 1998) and tasks in which listeners tap along with stressed syllables (e.g., Lidji et al., 2011). The idea is that participants in those tasks align stressed syllables with the ‘beats’ that make up the rhythm. The performance of participants in those tasks appeared to strongly correlate with their musical abilities, reading proficiency, speech disorders and language learning proficiency (e.g., Baills & Prieto, 2023; Bhide et al., 2013; Cumming et al., 2015; Jin et al., 2019; Moritz et al., 2013). Speech cycling tasks therefore make a case for (forced) rhythm as a valuable concept to study speech and language, even if these rhythmic tasks do not reflect natural language use. They offer a unique perspective on prosody, in particular on the division between prominence and grouping in speech perception. That is, the alignment of stresses to beats relies on the attraction of listeners’ attention to prominent elements or perceptual centers (P-centers; e.g., Morton et al., 1976). At the same time, tasks using sequences of repeated (looped) sounds or pseudo-words have shown that the allocation of the prominent element as group-initial or group-final is directly influenced by specific acoustic cues (e.g., ITL; Hayes, 1995) and the prosodic characteristics of the language (e.g., Bhatara et al., 2013; Crowhurst, 2020; Kaland et al., 2025). Studies indeed show that ‘looped speech has the potential to reveal underlying rhythmic structures of sentences; (Rathcke et al., 2021, p. 5). The next sections discuss research that used such tasks in typologically different languages as a way to investigate synchronization to beats (prominence allocation) and to investigate demarcation into smaller units (grouping).
1.3. Rhythm Synchronization Tasks Across Languages
Czech speakers were investigated in a speech cycling task in which they aligned their productions of disyllabic words to a metronome beat (Volín et al., 2014). The results showed a stable alignment of the vowel onset in the first syllable to the beat. This finding corroborated an earlier study with Brazilian Portuguese speakers using a comparable task (Barbosa et al., 2005).
French and English speaking participants (monolingual and bilingual) tapped along with the subjective ‘beats’ that they perceived in sentences in either language (Lidji et al., 2011). The main finding in this study was that both monolingual and bilingual listener groups tapped more regularly with English sentences than with French ones. This was explained by lower variation in intervocalic intervals in the English sentences compared to the French ones. The variation in vowel intervals has been quantified in earlier work by other metrics (e.g., %V, ∆V and V-nPVI; Grabe & Low, 2002) to test the rhythm-class hypothesis, that is, the division of stress-, syllable- and mora-timed languages. It thus seemed that intervocalic variation affects listeners’ rhythmic perception.
The importance of vowels in the perception of rhythm in speech was furthermore confirmed by two tapping tasks carried out with English participants (Rathcke et al., 2021). In one task, participants tapped along with looped sentences, a paradigm known as sensory motor synchronization (SMS, e.g., Repp, 2005). In another task, participants tapped to the rhythm of looped sentences after they heard them (non-synchronized motor repetition; NMR). The SMS task showed more clearly than the NMR task that taps align with linguistic units. In particular, vowel onsets showed the least variation in asynchronies with participants’ taps (Rathcke et al., 2021).
It is important to note that English has played a dominant role in rhythm research, therefore shaping our understanding of rhythmicity in speech. Thus, the intervocalic interval variation (Lidji et al., 2011) may be typical for English ‘stress-timed rhythm’, and fully absent in languages that do not make use of stress (e.g., Nolan & Jeon, 2014). Variants of Malay could play a particularly important role in studies on the relationship between stress and rhythm. Thus, Ambonese Malay was referred to in Nolan and Jeon (2014, p. 9) as one of the languages without stress (following Maskikit-Essed & Gussenhoven, 2016), in addition to Tamil, Mongolian and Korean. It therefore remains a largely open question how listeners in these languages perceive rhythmic speech and what this may reveal about their prosody. Very few studies have investigated these issues for Malay variants.
Standard Malay speakers with syntactic specific language impairment were tested on their comprehension of wh-questions in relation to musical training (Hui Ying et al., 2023). The test group received musical training over a period of 8 weeks in different phases: tapping and moving with the beat of the musical rhythm, pitch identification using rhythm, rhythm identification without the help of beats, and improvising the rhythm and melody of a song in a group-like (joint) setting. Participants who received the musical training showed significant improvement in question comprehension compared to the ones who did not.
Papuan Malay speakers have been investigated for their use of speech-accompanying handclaps. Note that these were spontaneously occurring claps in a non-rhythmic manner (Kluge, 2019), 60% of which occurred with stressed syllables, 60% with a clause boundary and 30% at the discourse level for structuring purposes (with either introduction, climax or conclusion).
To sum up, it shows from several studies that synchronization to speech, whether rhythms were forced or not, is governed by non-arbitrary properties of the language’s prosody such as stressed syllables and their segmental make-up. The next section discusses studies that have used rhythmic tasks to investigate prosodic grouping across languages.
1.4. Rhythmic Grouping Tasks Across Languages
Many studies on word-level prosodic grouping in speech perception have based their hypotheses on the predictions of phonological metrical theory (e.g., Hayes, 1995) on how acoustic cues (duration and intensity) determine grouping into disyllabic units (e.g., feet). In this theory, the most prominent element in the foot (i.e., the head) either comes first (trochee) or last (iambic). The ITL (iambic-trochaic law; Hayes, 1995, p. 80) is based on the outcomes of experiments using sequences of sounds varying in duration and intensity as described in Bolton (1894, p. 232): In a series of auditory impressions any regularly recurrent impression which is different from the rest, subordinates the other impressions to it in such a way that they fall together in groups. If the recurrent difference is one of intensity, the strongest impression comes first in the group and the weaker ones after. If the recurrent difference is one of duration, the longest impression comes last.
Several studies have tested the ITL predictions in speech perception tasks, some using pitch as an additional cue, which is supposedly coupled with intensity and thus expected to lead to trochaic grouping (e.g., Nespor et al., 2008).
A common paradigm to test the ITL predictions makes use of alternating sequence/direct response tasks (ASDR; Crowhurst, 2020). In these tasks, listeners are presented with a sequence of alternating sounds. The alternation concerns (a combination of) specific acoustic cues, that is, intensity, duration or pitch. The listeners’ task is to indicate whether they perceive the sequence as composed of repetitions of strong-weak (iambic) or weak-strong (trochaic) units. The paradigm has been applied to a variety of languages and it seems that the ITL does not consistently hold across languages (see Crowhurst, 2020, for a review). Importantly, the prosody of the language under investigation, acoustic variability in the stimuli, and the musical abilities of the participants all affect the extent to which perceived grouping conforms to the predictions of the ITL. This was shown for, among other languages, German and French (Bhatara et al., 2013), French and English (Hay & Diehl, 2007), English and Japanese (Iversen et al., 2008), and English and Mexican Spanish (Crowhurst, 2016).
A recent study investigated Papuan Malay, Akan (Niger-Congo language of Ghana) and German (Kaland et al., 2025) and replicated earlier results of Bhatara et al. (2013) and Bhatara et al. (2016) for German using the same materials. The study made use of non-speech stimuli to test all languages, which were obtained from the spectral profiles of musical instruments; either a single instrument (low acoustic variability) or multiple ones (high acoustic variability). Both Papuan Malay and Akan listeners performed similarly in that no trochaic grouping preference was found for intensity contrasts, but only a iambic grouping preference for duration contrasts. The latter effects were also limited to low variability stimuli, whereas for German, listeners showed duration-based effects regardless of stimulus variability. The German listeners also had an overall bias for trochaic grouping. Both the trochaic bias in German and the lack of effects for acoustically more complex (high variability) stimuli in Papuan and Akan were interpreted as consequences of the prosodic systems of these languages. In German, word stress experience made listeners more sensitive to the acoustic cues, whereas the highly regular stress pattern in Papuan Malay and the possibly stressless language Akan led to much weaker perceptual sensitivity.
To sum up, the studies that tested the ITL across languages indicate that the prosody of the language under investigation generally plays an important role in listeners’ grouping preferences. Thus, although a strict version of the ITL does not hold across languages (see also Moghiseh et al., 2023 and the initial paragraphs of this section), the extent to which it does is informative for the investigation of prosodic grouping.
1.5. Research Aims
The aim of the current study is to investigate two prosodic functions of Papuan Malay word prosody in speech perception. That is, perceptual mechanisms that either allocate word prominences (highlighting) or group into words (demarcating) are investigated in two separate perception experiments using the same set of stimuli. Although the separation of two experimental tasks is based on the theoretical divide between prominence and grouping (e.g., Moghiseh et al., 2023), the two prosodic functions might be intertwined depending on the language. There is evidence, for example, that sensori-motor synchronization by means of co-speech gestures is sensitive to both prominences and grouping (Franich et al., 2025). The stimuli used in the current study are sequences of repeated, acoustically manipulated, disyllabic words. The words are chosen in such a way that the acoustic manipulations in terms of strong/weak syllable alternations act as the disambiguating cues for word identification. With regard to highlighting, this study investigates how listeners allocate prominences in these sequences in a tapping task (RQ1). As for demarcating, the current study investigates how listeners divide the sequences into words (RQ2). In this way, the current study adds to the description of understudied prosodic systems and provides additional insights into the role of (fixed) stress in speech perception. Unlike previous studies focusing on just a few acoustic cues, the current experiments test the effects of duration, intensity, spectral tilt and vowel quality, which all play a role in signaling word stress in Papuan Malay (Kaland, 2019). Note that F0 was found to weakly correlate with word stress and rather signaled phrase intonation (e.g., Kaland, 2019; Kaland & Baumann, 2020), in line with typological accounts on the limited role of F0 in word stress (Gordon, 2014; Gordon & Roettger, 2017). Given the focus of this study on word-level prosody, F0 is therefore not taken into account. Furthermore, this study makes use of existing Papuan Malay words, therefore improving the naturalness of the experimental tasks compared to previous studies in which non-speech or only speech-like stimuli were used (see Crowhurst, 2020, p. 5).
As for RQ1, it is hypothesized that allocating word-level prominences is facilitated by all acoustic cues under investigation such that increased acoustic prominence leads to increased likelihood that those cues act as a ‘beat’ for tapping, in order of strength (following Kaland, 2019): duration, vowel quality, spectral tilt, and intensity. The vowel (onset) is expected to play a particularly important role as attractor of taps, that is, as p-center (e.g., Barbosa et al., 2005; Lidji et al., 2011; Morton et al., 1976; Rathcke et al., 2021; Volín et al., 2014).
As for RQ2, it is expected that listeners group syllables such that their prominence pattern matches the word that they need to identify. Thus, for the disyllabic words with initial prominence (penultimate stress/trochaic), as used in the current study (Section 2.1), the sequences are expected to be perceived as repetitions of words with a strong-weak prominence pattern. In the light of these expectations, it is particularly interesting to observe how stress cues might interact with general predictions of the ITL (Hayes, 1995; Moghiseh et al., 2023). This holds in particular for duration, which is expected to act as a correlate of penultimate (trochaic) stress (Kaland, 2019), even though the ITL predicts duration contrasts to elicit iambic grouping (as shown in Kaland et al., 2025). Spectral tilt essentially concerns intensity differences between different frequency bands. Therefore, spectral tilt and intensity are expected to elicit trochaic grouping, which is also expected in this study for these cues as correlates of penultimate stress. As for vowel quality, it remains to be seen how this cue relates to the principles of the ITL, as it has not been tested in previous research.
The main interest of the current study concerns the perceptual mechanisms underlying word prosody in Papuan Malay. As previous research has shown, however, participants’ musical background is likely playing a role in their responses, both for tapping (e.g., Jin et al., 2019) and for grouping (e.g., Bhatara et al., 2016). Therefore, the potential influence of musical experience is taken into account in the main analyses conducted in this study.
2. Experimental Methods
This section describes the methodological approach, which makes use of repeated syllables in an auditory sequence, inspired by the ones used in Bhatara et al. (2013), Bhatara et al. (2016) and Kaland et al. (2025). Note that in the current study, however, additional acoustic cues were manipulated and the sequences consisted of existing Papuan Malay words.
2.1. Stimulus Preparation
From the word lists in Kluge (2017), six words were selected. They were all Papuan Malay roots (no loanwords) with a CV.CV syllable structure and word stress on the first (penultimate) syllable, that is, the default stress pattern in this language. These words were selected because reversing the order of their syllables also corresponded to existing Papuan Malay roots with penultimate stress (e.g., ‘buru’ and ‘rubu’; henceforth syllable patterns 1-2 and 2-1). This criterion was used to generate segmentally ambiguous sequences of syllables, in which the manipulated acoustic cues are expected to determine the stressed syllables and thus affect which word would be perceived as being repeated in the sequence. Table 1 provides an overview of the selected words.
2.2. Acoustic Manipulation
The stimuli were created by acoustic manipulation of the syllables occurring in the words in Table 1. The manipulation ensured that syllables in the sequences had an alternating pattern of acoustic prominence (weak-strong: WS or strong-weak: SW), which was repeated 16 times (32 syllables in total per sequence). The manipulated acoustic cues were either duration, intensity, spectral tilt or vowel quality. The cues were tested individually, that is, not in combination, to test the strength of each of them separately. Although this decreased the naturalness of the stimuli to some degree, testing all combinations of these cues would have required higher numbers of stimuli and participants, which was not feasible for the current study, see also Section 2.4.
As for duration, intensity and spectral tilt (see below for vowel quality), the syllables were obtained from a text-to-speech system using a neural network-generated male Indonesian voice (‘Ardi’; Microsoft Corporation, 2023). They were obtained by spelling out each individual syllable separately. The generated syllables were each 300 ms long, and their average intensity and flat F0 level were set to 70 dB and 110 Hz, respectively, using Praat (Boersma & Weenink, 2023). The subsequent manipulations were done on the basis of these default acoustic properties. Acoustically strong and weak syllables were generated by manipulating one of the acoustic cues for both syllables. This was done with two levels of acoustic contrast per cue, in addition to a version in which there was no acoustic contrast (control condition with default values). One contrast level was a direct approximation of the naturally produced levels in Papuan Malay stressed and unstressed syllables based on the production data reported in Kaland (2019) (natural contrast). The other contrast level was a doubling of those values (enhanced contrast). The acoustic contrasts were generated by both making the syllable that was intended as strong acoustically more prominent and by making the syllable that was intended as weak acoustically less prominent. See Table 2 for an overview of the acoustic manipulations.
Overview of the Acoustic Manipulations for Each Cue and Cue Contrast Level.
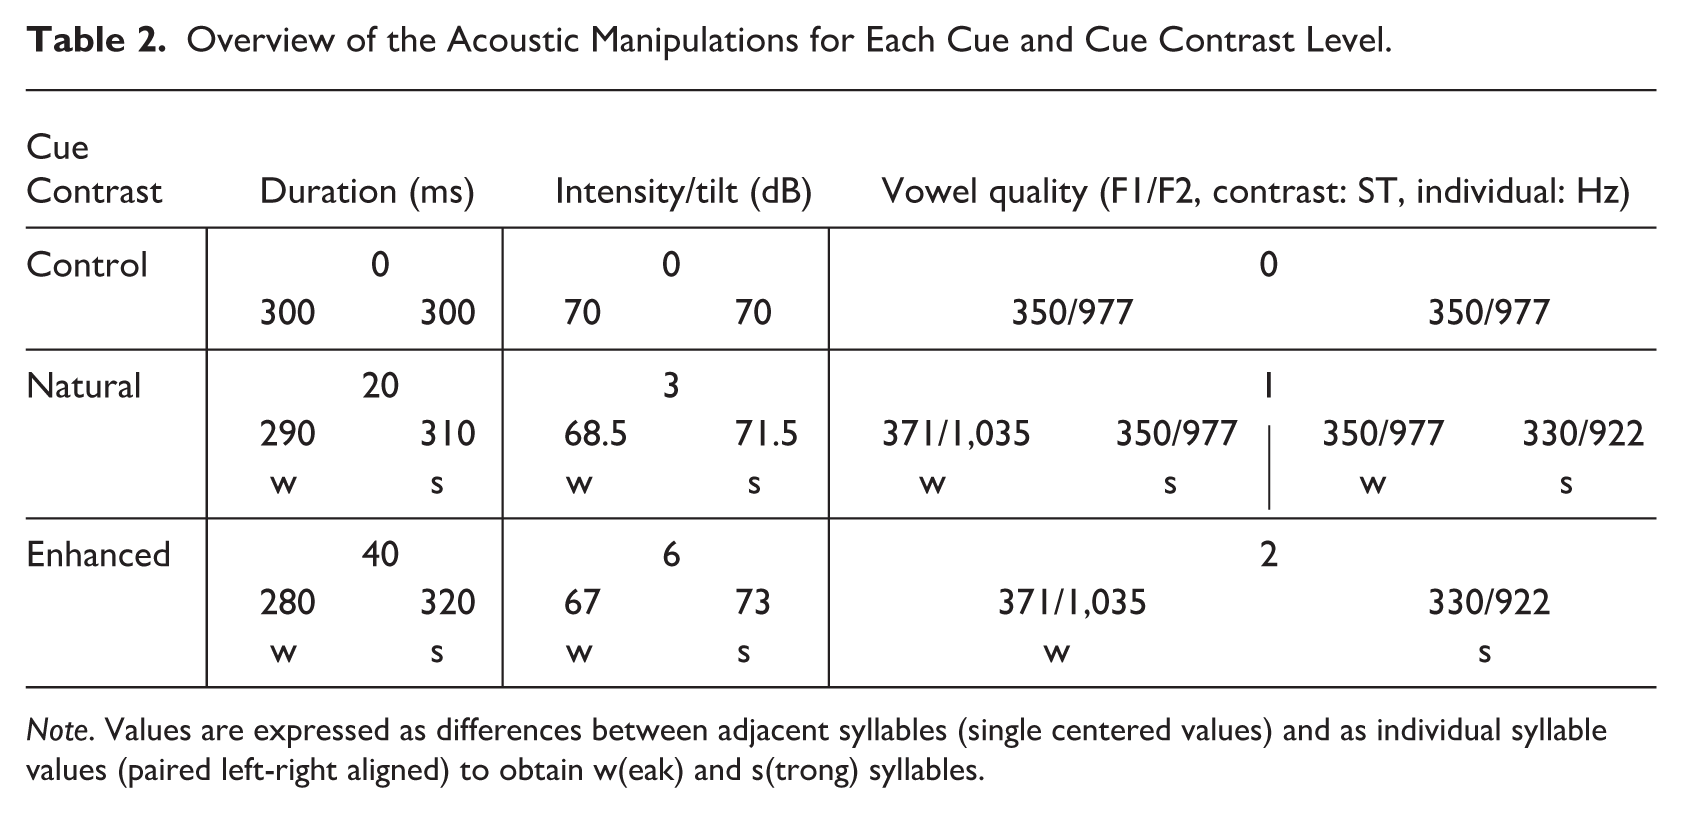
Note. Values are expressed as differences between adjacent syllables (single centered values) and as individual syllable values (paired left-right aligned) to obtain w(eak) and s(trong) syllables.
Duration was manipulated by lengthening and shortening the syllables by 10 ms or 20 ms, such that length differences between subsequent syllables in the sequences were 20 ms (natural) or 40 ms (enhanced), respectively.
Intensity was manipulated by an increase or decrease in overall syllable amplitude by 1.5 dB or 3 dB, such that intensity differences between subsequent syllables in the sequences were 3 dB (natural) or 6 dB (enhanced), respectively.
Spectral tilt was manipulated by an increase or decrease of the frequencies between 500 and 5,000 Hz using the filter (formula) function in Praat (Boersma & Weenink, 2023). These frequencies were chosen to change the difference between the amplitude of the first harmonic (H1, typically found below 500 Hz) and the amplitude of the second or third formant (A2/A3, typically found above 500 Hz). Note that both H1-A2 and H1-A3 were found to be strong acoustic correlates in Kaland (2019). The formula used an amplification/softening level that resulted in an overall syllable amplitude increase or decrease by 1.5 dB or 3 dB, such that the contrasts between subsequent syllables in the sequences were 3 dB (natural) or 6 dB (enhanced), respectively. The formula used for these operations was: if x > 500 or x < 5,000 then self*f else self endif; rectangular band filter, where f was the factor needed to achieve the desired increase/decrease of overall amplitude, which differed slightly between the stimuli due to their different frequency profiles in the manipulated frequencies. Thus, this factor corresponded to approximately 20% and 40% for the 1.5 and 3 dB manipulations, respectively, which resulted in f values of approximately 0.60 or 0.80 (decrease), and 1.2 or 1.4 (increase).
Vowel quality manipulations were obtained from cross-spliced syllables, for which the consonantal part was generated by the eSpeak NG text-to-speech synthesizer as implemented in Praat (Indonesian – ‘Male1’; Duddington & Dunn, 2022) and the vocalic part was generated by the VowelEditor function in Praat (Boersma & Weenink, 2023). This was done to obtain maximal control over the formant structure, in particular F1 and F2. The consonantal and vocalic parts were concatenated at zero dB crossings to obtain a smooth transition between the two. The duration, intensity and F0 were set to the same levels as the neural network-generated syllables described above (300 ms, 70 dB, 110 Hz, respectively). To facilitate the perception of the vowel quality contrast, only words were used in which both syllables had the same vowel (i.e., ‘buru’/ ‘rubu’ and ‘butu’/‘tubu’, respectively). This was done to facilitate the perceived difference between the strong and weak syllables; that is, one vowel could act as reference for the other when they are both the same. It would be more challenging to interpret the vowel quality cues as more central or more peripheral in a sequence with multiple alternating vowels. Before manipulation, the F1/F2 frequencies were set to the default levels obtained from the vowel (/u/) produced by neural network voice (F1: 350 Hz, F2: 977 Hz), that is, matching the stimuli with /u/ for which duration, intensity and spectral tilt were manipulated. Vowel quality was manipulated by adding or subtracting a semitone (ST) from each formant, such that the production of the vowel in the acoustic space would be more centralized or more peripheral compared to the default production, respectively (approximating the values measured in Kaland, 2019). Note that semitones were used to account for vowel quality differences. That is, the formant value in Hertz acted as the reference level in the semitone conversion before addition or subtraction was applied. The generated acoustic differences between two subsequent syllables in the sequence were one ST (natural) or two ST (enhanced). Two variants of the stimuli with one ST contrast were generated: one variant in which the default formant values were used for the strong syllable (with /u/ being one ST more central for the weak syllable), and one variant in which the default formant values were used for the weak syllable (with /u/ being one ST more peripheral in the strong syllable). This was done to account for the fact that the default formant values were neither stressed nor unstressed as generated by the Indonesian neural network voice, as Indonesian is analyzed as a language without stress. The two ST contrasts were obtained by applying the manipulation in both directions: one ST more central for the weak syllable and one ST more peripheral for the strong syllable (Table 2).
Each sequence, regardless of which acoustic cue was manipulated, was 9,600 ms long (32 syllables with an average of 300 ms) and started either with the 1-2 or the 2-1 syllable pattern. To prevent that the initial syllable in the sequence would bias participants’ responses toward a particular response, the first three seconds of speech were faded in and masked by a fading out white noise (both were cosine fades). All manipulation values are provided in Table 2. The generated syllables in the sequences had a highly comparable composition in terms of timing, with vowel onsets occurring at approximately 55 ms for syllables with voiceless stops and approximately 95 ms for syllables starting with any of the other consonants.
2.3. Participants
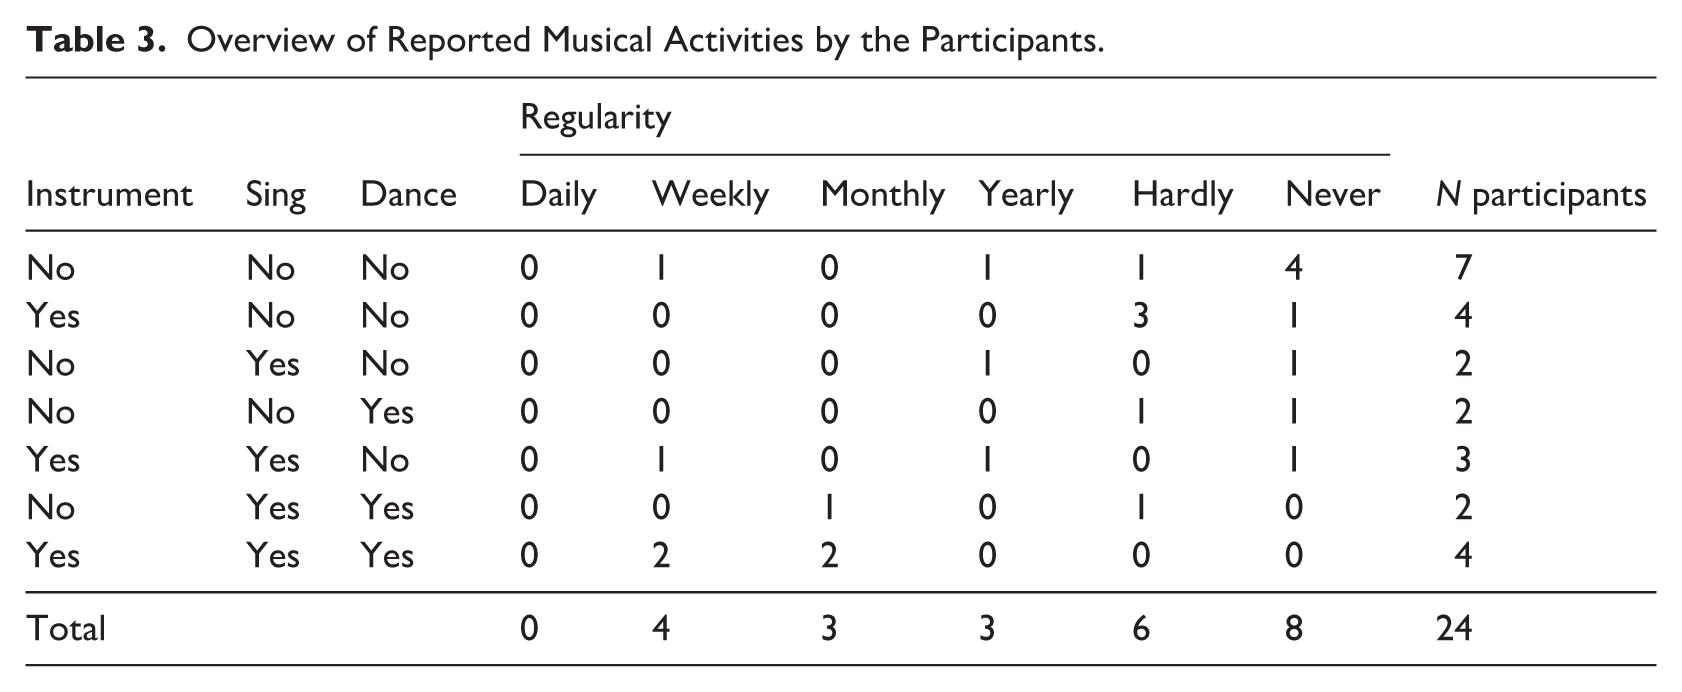
In total, 24 participants completed the experimental tasks (17 female, 7 male, mean age: 26 years, age range: 19–42). They were all native speakers of Papuan Malay without hearing problems. The majority of the participants were born in the Jayapura or Sarmi regency (20), and some were born in other Papuan places (Sorong, Biak, Central Mamberamo Regency) or Jakarta (1). All participants learned Papuan Malay from birth and reported using the language at home in daily life at the time of participation. Two of them were also native speakers of Biak (iso: bhw). In a questionnaire, they reported whether they had experience with musical activities, either actively (playing an instrument, singing or dancing) or passively (attending), and how regularly they engaged in these activities. An overview of their responses is given in Table 3. From these responses, a single musicality score was calculated per participant by adding up whether they played an instrument, sung, or danced (1 for yes, 0 for no) and multiply that by the scaled regularity values (between 0 for never and 1 for weekly, excluding the ‘daily’ option which no participant had chosen).
Overview of Reported Musical Activities by the Participants.
2.4. Design
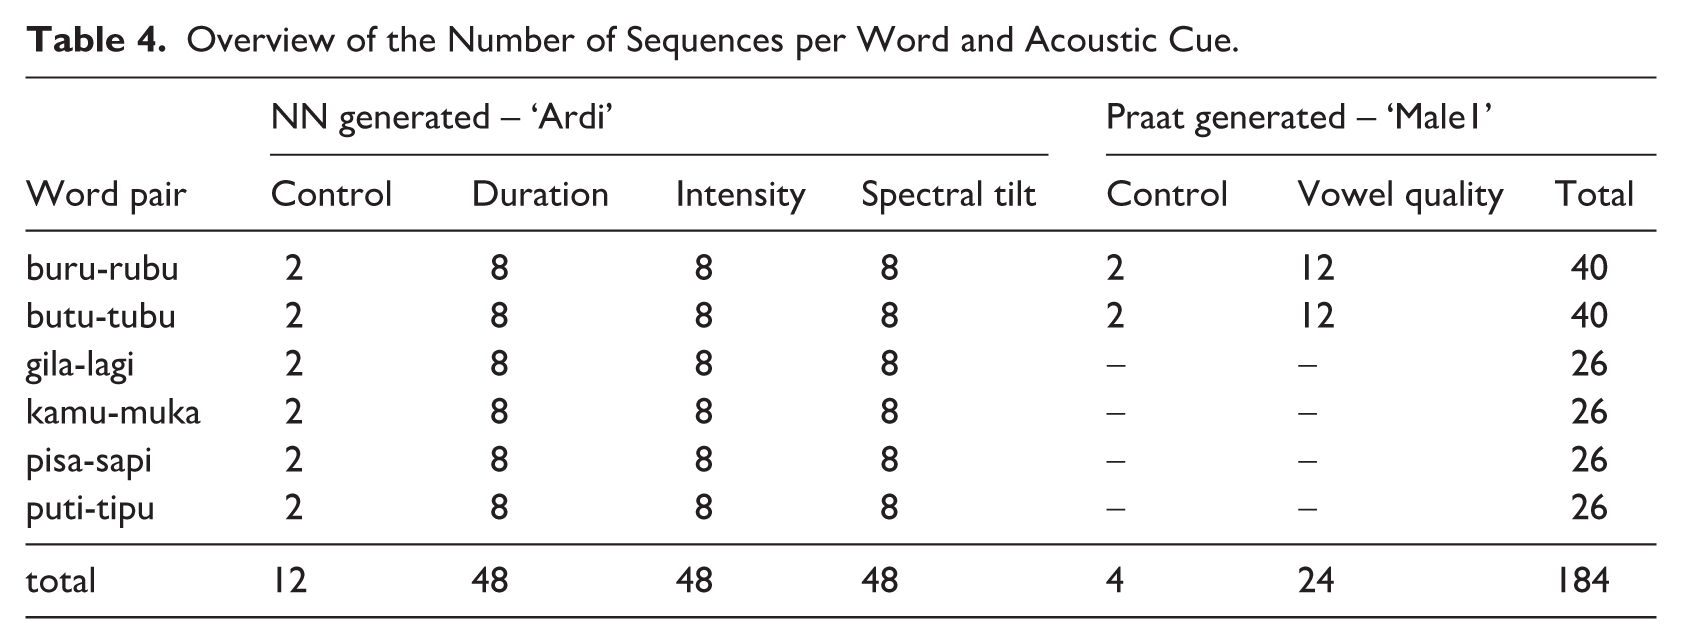
In total, 184 acoustically manipulated sequences were generated (Table 4). The sequences were entirely counter-balanced to further avoid any effects of the order of the sequence (see also Section 2.2). This was done by starting the sequences with either an SW or WS stress pattern and with either a 1-2 or 2-1 syllable pattern. A distinction was made between the sequences generated by the neural network (NN) synthesizer (duration, intensity, spectral tilt) and the ones generated by Praat (vowel quality). For the NN-generated sequences, two sequences did not have any difference in acoustic cues (controls); one with initial 1-2 syllable pattern and one with initial 2-1 pattern. For the cues duration, intensity and spectral tilt, eight sequences per word pair were generated each: two stress patterns: SW/WS * two syllable patterns: 1-2/2-1 * two levels of acoustic contrast: natural/enhanced. For the Praat-generated sequences (vowel quality), there were two control sequences without any acoustic difference between the syllables (two syllable patterns: 1-2 and 2-1). 12 test sequences were generated per selected word pair (buru-rubu/butu-tubu): two stress patterns: SW/WS * two syllable patterns: 1-2/2-1 * three degrees of acoustic contrast: natural (2) and enhanced (1).
Overview of the Number of Sequences per Word and Acoustic Cue.
The tapping and grouping task were carried out subsequently with one acoustic cue tested per task (between-participant design). This was done to retain participants’ attention, that is, by limiting the experiment duration and the number of stimuli. Thus, participants were presented with sequences from any possible combination of two out of the four acoustic cues (six possibilities, two orders). Per combination, one cue occurred in the first task and the other in the second task, crossed with the type of task (tapping or grouping): 6 * 2 * 2 = 24 cue/order variants (see Appendix A), each to which one participant was assigned. The cue/order variants were generated to counterbalance any effects of the order of acoustic cues or any effects of the order of the tasks. The total number of stimuli per task was either 40 (12 + 4 + 24; if vowel quality was tested) or 60 (12 + 48; if vowel quality was not tested). Note that the 4 items in the task with vowel quality stimuli were additional control items to account for the voice they were generated from (Male1). The presentation order of the stimuli was randomized within each task and was different for each participant. Thus, each unique sequence (from the total of 184) was presented to six participants (Appendix A), and each sequence was a repetition of 16 disyllables with or without an acoustic contrast (at least 10 of which were audible), yielding a total of at least 60 presentations of a unique disyllable.
2.5. Procedure
Participants were tested in Sentani, Papua (Indonesia), in laboratory circumstances. They carried out the task behind a laptop computer using headphones in a quiet room. Participants were given written (Appendix B) and oral instructions in Papuan Malay about the tasks before the start of the experiment. They also filled out the questionnaire about their musical experience before the start of the tasks (see Section 2.3).
For both tasks, they were instructed to identify the word that was repeated in the sequence that they would hear, and that each sequence would be played only once. In the tapping task, participants were instructed to use the space bar on the keyboard to tap along with the start of the repeated word, not with each syllable. In the grouping task, participants were instructed to choose which word was the repeated one in the sequence. They could make their choice by clicking on one of the words on the screen (either syllable pattern 1-2 or 2-1, see Table 1).
There was a break between the two tasks (approximately 5 min) and the total time to complete both tasks was 30–45 min, with participants assigned to a task in which vowel quality was tested taking less time due to the lower number of stimuli compared to ones for which other acoustic cues were tested. The tasks were implemented in PsyToolkit, an online platform for experimentation (Stoet, 2010, 2017). The tasks were, however, run in offline mode, due to instable internet connection at the test location. In the tapping task, the time-stamp of each of the participants’ space bar presses were recorded from the onset of the sequence to the end (0–9,600 ms). In the grouping task, participants’ word choice was recorded.
2.6. Data Processing
2.6.1. Tapping
For each syllable in each sequence, it was labeled whether a tap had been given or not (1 or 0, respectively, henceforth number of taps). This was done for a total of 42,240 syllables: 6 participants receiving 40 stimuli (vowel quality) + 18 participants receiving 60 stimuli (other cues) times 32 syllables per stimulus (sequence). In addition to the acoustic manipulation factors cue (control, duration, intensity, spectral tilt, vowel quality) and cue contrast (control, natural, enhanced) (Table 2), a number of properties related to the stimuli were labeled for each syllable: synthetic voice (Ardi or Male1), to which unique disyllabic unit the syllable belonged (henceforth: disylllable, that is, the words in the leftmost column in Table 1), syllable pattern (1-2 or 2-1, see Table 1), whether the syllable was the strong one strong syllable (yes or no), the segmental (CV) composition of the syllable (syllable: /bu/, /gi/, /ka/, /la/, /mu/, /pi/, /pu/, /ru/, /sa/, /ti/, /tu/), the consonant in the syllable (/b/, /g/, /k/, /l/, /m/, /p/, /r/, /s/, /t/), vowel onset times depending on whether the consonant was a voiceless stop or not (Section 2.2: yes or no), and the vowel in the syllable (/i/, /a/, /u/).
In total, 17,355 taps were recorded. To assign a tap to a syllable, the tap needed to be given in the time window of that syllable. This was calculated by taking into account the actual length of the syllable in the sequence (either 280 ms, 290 ms, 310 ms or 320 ms for the duration manipulated sequences or 300 ms for any of the other sequences, see Table 2). Syllables for which more than one tap was given were analyzed as not having received any tap (N = 248 taps), as for these taps, their alignment time could not be unambiguously determined. Given that the first 3 s of each sequence were a fade-in from white noise, only taps were taken into account for analysis if they occurred after 3,000 ms (discarding 6 syllables per sequence and a total of 3,488 taps). From 3,000 ms onward, participants could have established a reliable perception of rhythm, that is, having been able to perceive two or three syllables. In total, 29,040 syllables were analyzed, for which 13,619 taps were given.
To assess the extent to which the timing of the recorded taps (henceforth alignment time) was affected by individual variation in participants’ musical background (Section 1.5), control items were analyzed. Control items were chosen because the effect of the acoustic cues could have possibly influenced the alignment times of the test items. First, the most frequent alignment time per participant was calculated using kernel density estimation (density() function in R; R Core Team, 2022). Then the peaks for each participant were again analyzed for their density (Figure 1). These showed a bimodal distribution with peaks at 154 ms and 245 ms, corresponding roughly to the end of the vowel onset or vowel nucleus, and to the vowel offset, respectively. To account for this bimodal distribution of tapping style, participants were assigned to a group of either ‘early’ or ‘late’ aligners depending on whether the majority of their taps were mostly aligned before or after the time corresponding to the valley between the modes in the distribution (198 ms, Figure 1).
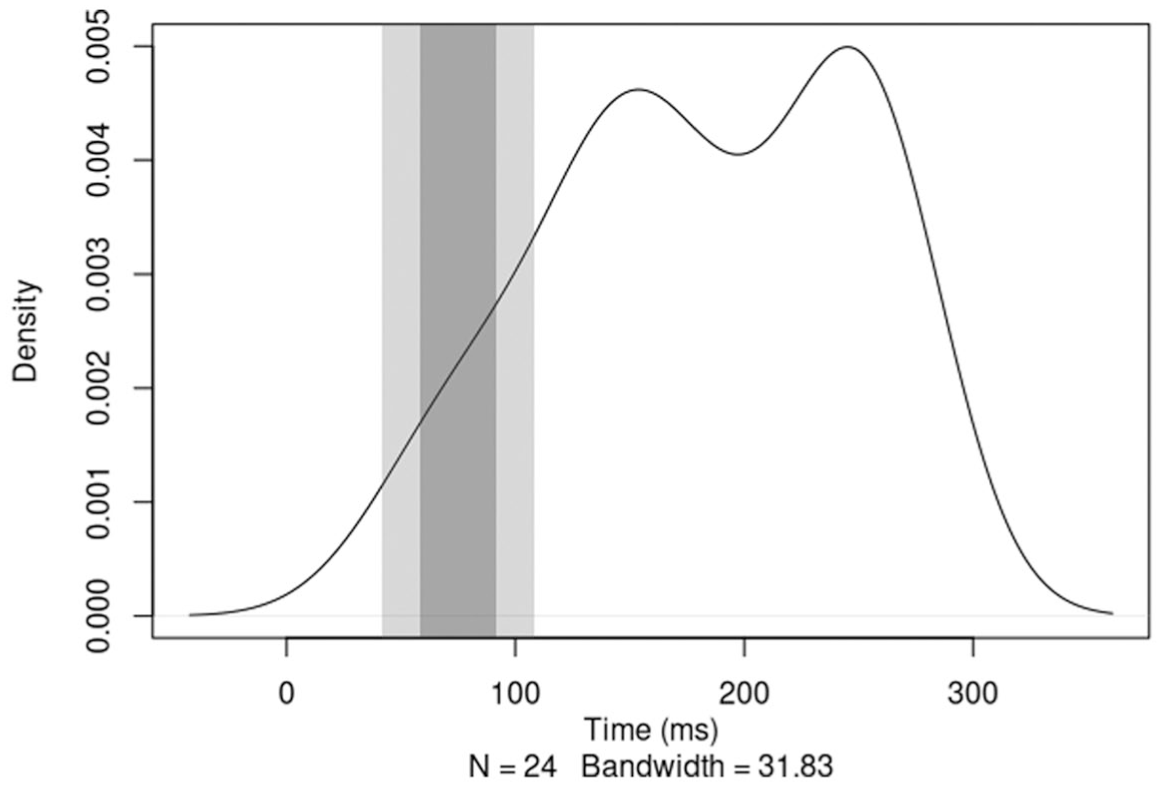
Density plot of tap alignment time modes per participant in the control items.
For taps given to the test items (N = 10,348), it was labeled whether they were given to a strong or weak syllable, coded as ‘1’ or ‘0’, respectively. Control items were not taken into account for this labeling, as for these items, there was no manipulated distinction between strong and weak syllables.
2.6.2. Grouping
For the grouping responses, it was checked whether the first syllable of the word that participants chose was the acoustically prominent one in the sequence (penultimate stress/trochaic, see Table 1 and Section 1.5). The response was then expressed as a matching score: 1 for matching and 0 for mismatching. For example, if the syllable ‘ti’ in the disyllable ‘puti’ was the prominent one in the sequence (by any of the manipulated acoustic cues), it matched the stressed syllable of the word ‘tipu’. The score would thus be registered as matching (1) when participants had chosen ‘tipu’ and mismatching (0) when they had chosen ‘puti’. A total of 1,319 grouping responses were collected: 40 for each participant tested for vowel quality (N = 6), 60 for each participant tested for any of the other cues (N = 18), see also Appendix A. One response was given after the time-out set for the grouping response (6 min) and resulted in a missing value.
3. Statistical Analyses
This section describes the statistical analyses that were carried out on the data collected in the tapping and grouping task. To ultimately arrive at Bayesian models that test the hypotheses of this study (Section 1.5), the following statistical analyses were carried out. First, the predictors for the Bayesian models were carefully selected using random forests with multiple (co-varied) factors relating to the manipulated cues (hypothesized predictors), the stimulus materials, and the participants (Section 3.1). This was done to assess how important these factors were in predicting the tapping responses (alignment time and number of taps) and the grouping responses. Second, based on the random forest analysis, additional correlation measures and mixed models were carried out to further scrutinize the relation between participants’ musical experience and their tapping behavior (Section 3.2). The results of the predictor selection are discussed briefly in the interim conclusion in Section 3.3. The models that were created based on the outcomes of the prediction selection and subsequently tested the hypotheses of the current study are described in Section 3.4.
3.1. Predictor Selection
For the tapping responses, two random forest (RF) analyses were carried out. One analysis was carried out on the alignment times for all taps given to syllables in control items (RF-time). The other analysis was done on the number of taps given to all syllables (RF-tap), to assess which factors determined giving a tap in the first place (analyses of the taps given to strong syllables are reported in Section 3.4). For the grouping responses, a random forest analysis was carried out on the scores for the test items (RF-group). Table 5 lists all predictors and in which analyses they were used.
Overview of All Predictors in the Random Forest (RF) Analyses.
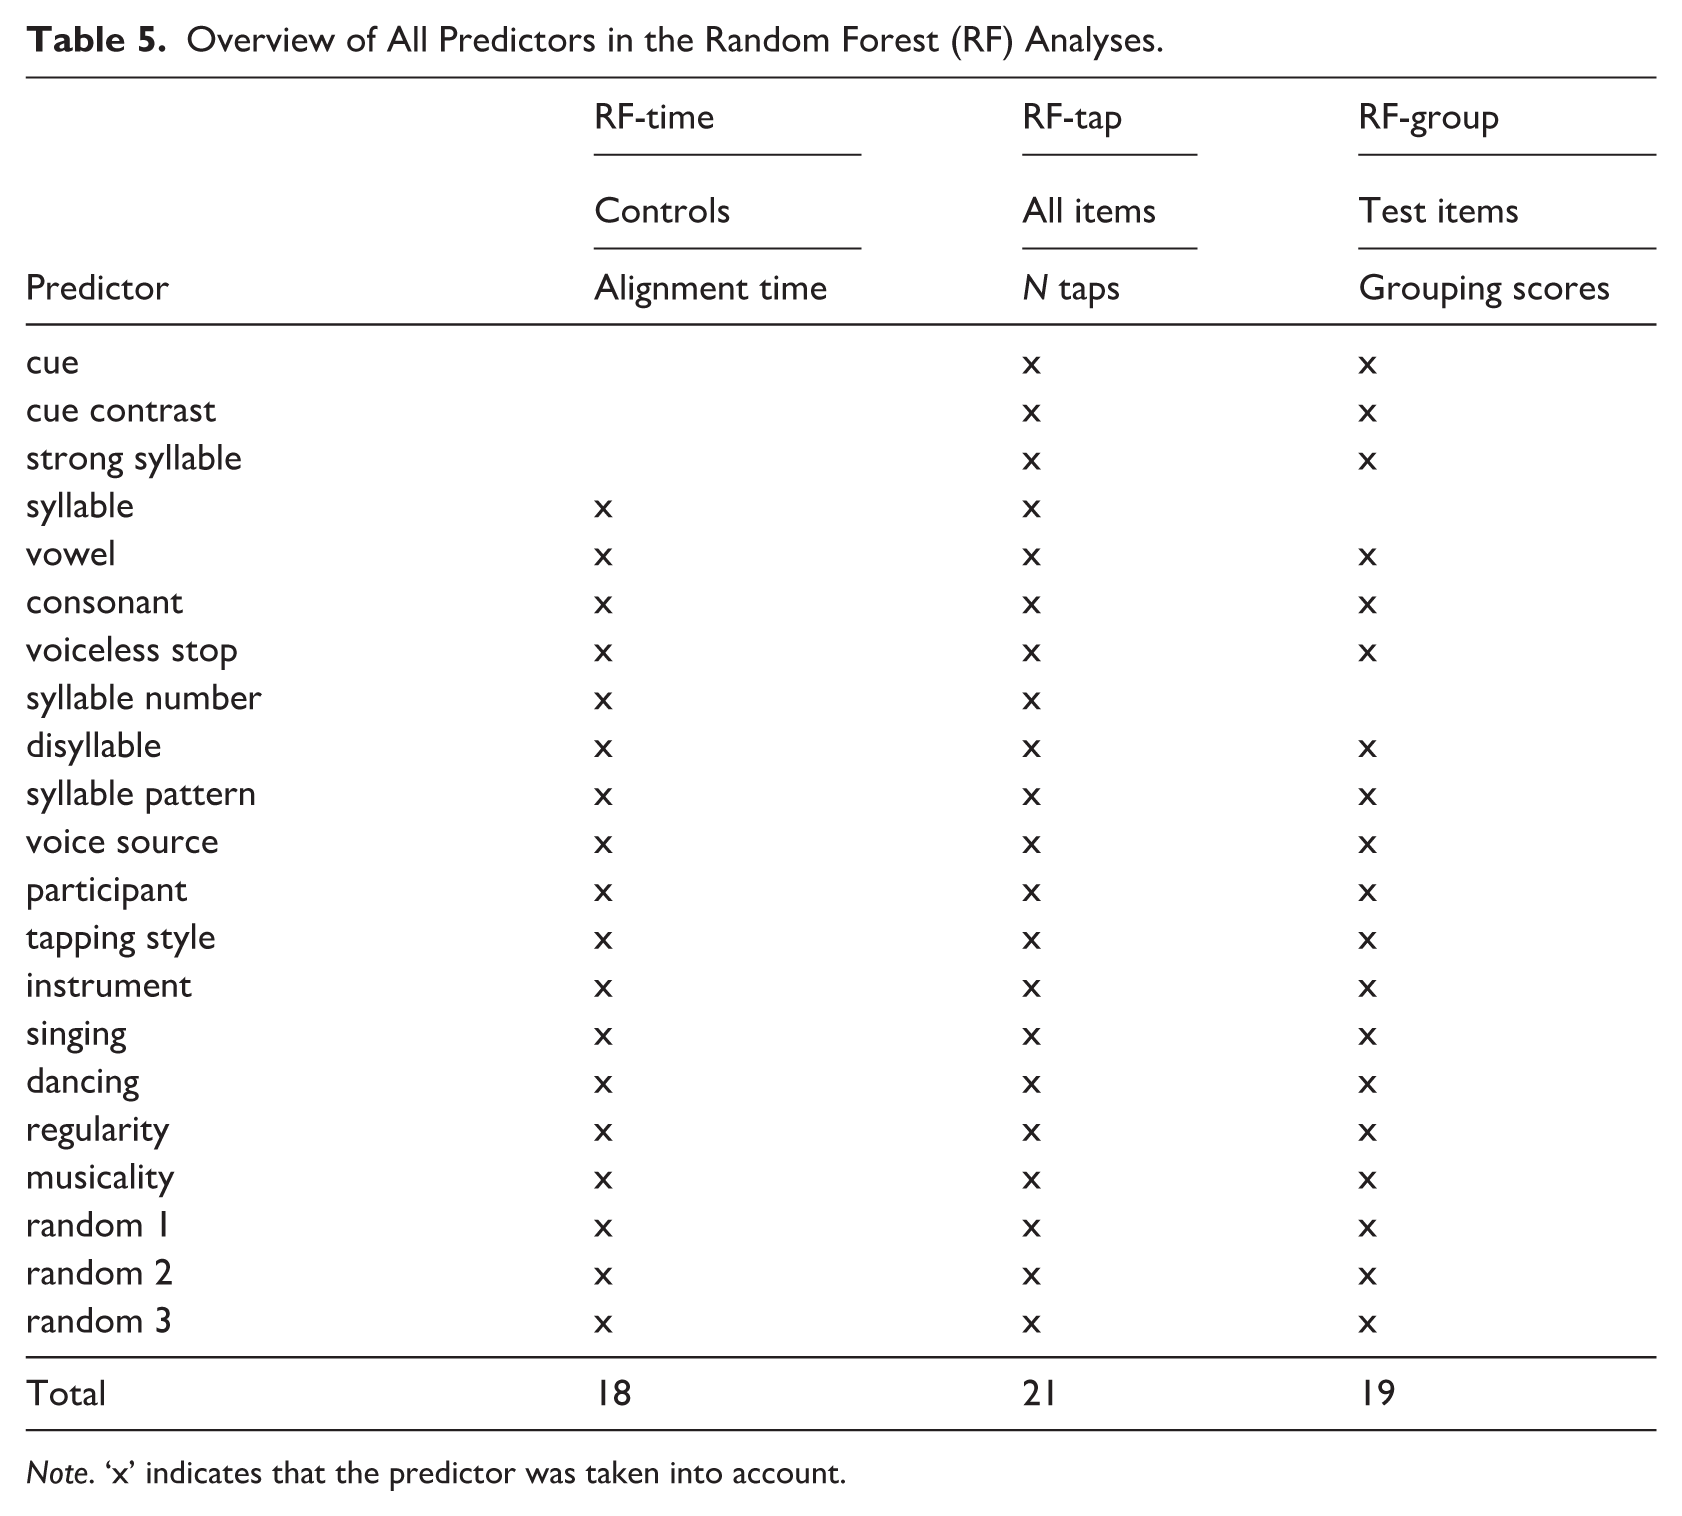
Note. ‘x’ indicates that the predictor was taken into account.
The RF analyses were carried out in R (R Core Team, 2022) and RStudio (R Studio Team, 2023) using the package ranger (Wright & Ziegler, 2017). In addition to the labeled properties for each syllable in the sequence as described above, the RF analysis also included factors that were obtained from participants’ musical background responses (Table 3) and their tap alignment (Figure 1).
The predictors were cue (five levels: control, duration, intensity, spectral tilt, vowel quality), cue contrast (RF-tap: three levels: control, natural, enhanced; RF-group: two levels: natural, enhanced), strong syllable (two levels: yes, no), syllable (12 levels: /bu/, /gi/, /ka/, /la/, /mu/, /pi/, /pu/, /ru/, /sa/, /ti/, /tu/), vowel (three levels: /a/, /i/, /u/), consonant (nine levels: /b/, /g/, /k/, /l/, /m/, /p/, /r/, /s/, /t/), voiceless stop in the syllable onset (two levels: yes, no), syllable number in the sequence (22 levels: 11-32), disyllable (six levels: ‘buru’, ‘butu’, ‘gila’, ‘kamu’, ‘pisa’, ‘puti’), syllable pattern (two levels: 1-2, 2-1), voice source of the sequence (two levels: Ardi, Male1), participant (24 levels: 1-24), tapping style (two levels: early, late), musical instrument (two levels: yes, no), singing (two levels: yes, no), dancing (two levels: yes, no), regularity of musical activities (five levels: weekly, monthly, yearly, hardly, never), overall musicality (eight levels: 0, 0.25, 0.50, 1, 1.5, 2, 2.25, 3).
In addition, three random predictors were added to the random forest. They were random numbers assigned to each tap from a distribution ranging from 1 to 5, 1 to 10, or 1 to 100, respectively. These random predictors were added for two reasons. First, it is expected that random variables end up with a low variable importance, that is, as a control predictor in the random forest model. Second, random predictors may act as a reference for other predictors’ variable importance. That is, predictors with a similarly low variable importance as the random ones are likely to have a negligible or no effect on the response (see Kaland et al., 2021 for a similar procedure). Note that there were several highly correlating predictors (e.g., disyllable and syllable, or vowel, consonant and voiceless stop), which were included in the analysis to test more precisely whether the subtle differences they represented made a difference to the prediction of the response. For example, it could be that the vowel is a better predictor than the (di)syllable it is in (or vice versa) and including both allows us to assess this. Random forests are particularly suitable for handling correlated predictors (Strobl et al., 2008).
Note that cue, cue contrast and strong syllable were excluded from the analysis of control items as these had no manipulated acoustic contrasts (RF-time), and syllable and syllable number were excluded from the RF-group, as the grouping responses were not given to particular syllables (see Table 5).
The number of trees in the analysis was increased in steps of 1,000, starting from 1,000 trees. The variable importance of the predictors reached a stable ranking around 5,000 trees. To obtain a robust result, the final number of trees was set to 10,000. The number of randomly preselected predictors was set to the square root of the total number of predictors in the analysis (see Table 5), and variable importance mode was set to ‘permutation’. These settings are recommended for analyses with correlating predictors (Strobl et al., 2008, 2009).
3.2. Results Predictor Selection
The results are provided in variable importance plots for each RF analysis (Figures 2 to 4). Note that the scale of variable importances (x-axes in the figures) is random and that only the ranking can be interpreted from the sorting of the variable importances. Zero may act as a reference point for the coarse-grained assessment of the variables’ contribution to predicting the response, that is, improving the prediction (positive values), worsening the prediction (negative values) or no contribution to the prediction (zero).
RF-time: variable importance for each predictor of alignment time, sorted decreasingly.
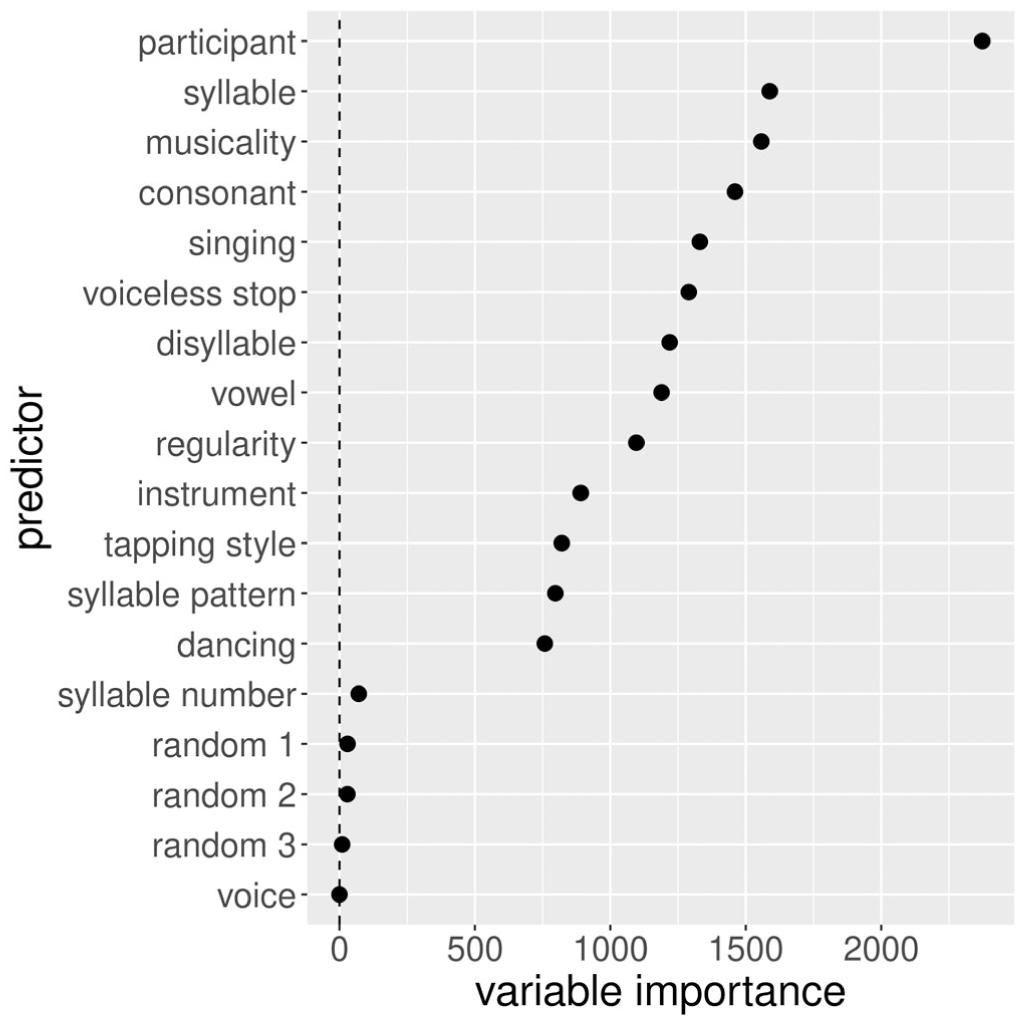
RF-tap: variable importance for each predictor of number of taps, sorted decreasingly.
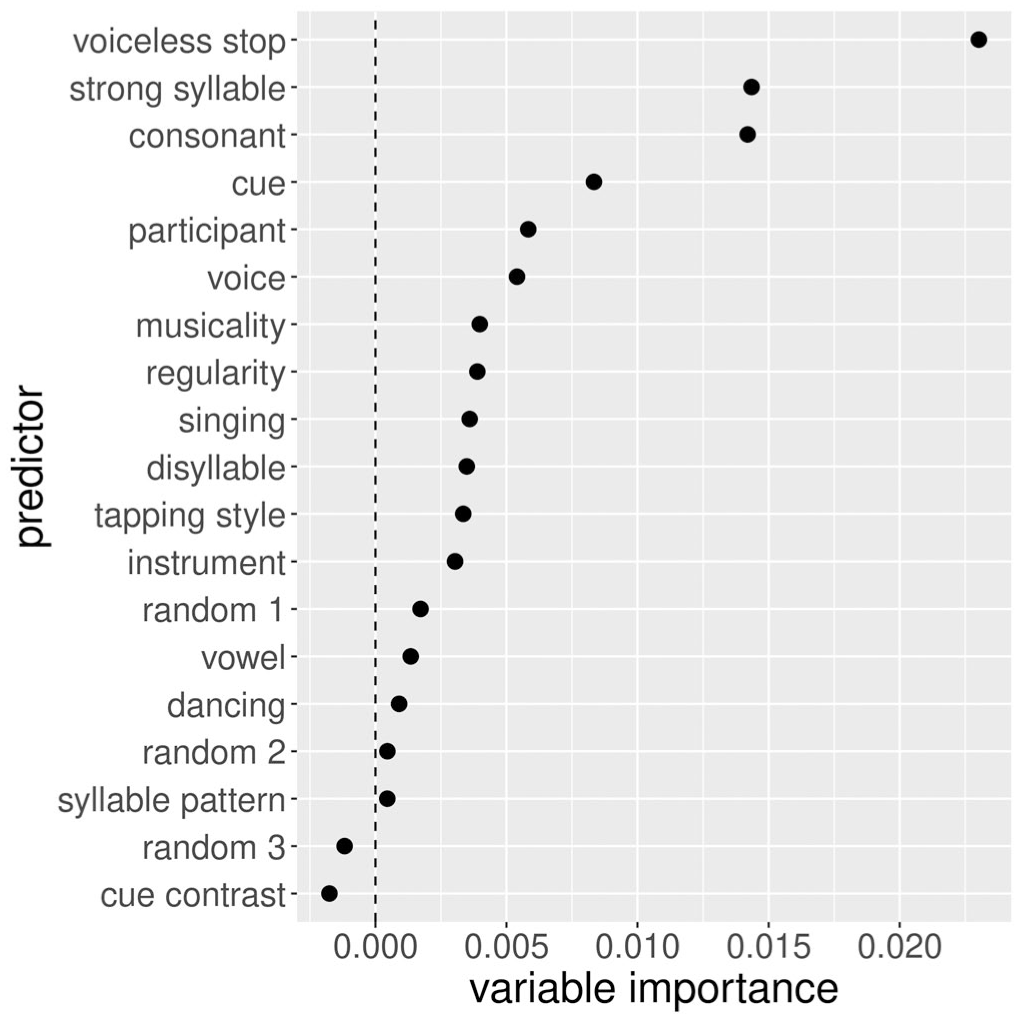
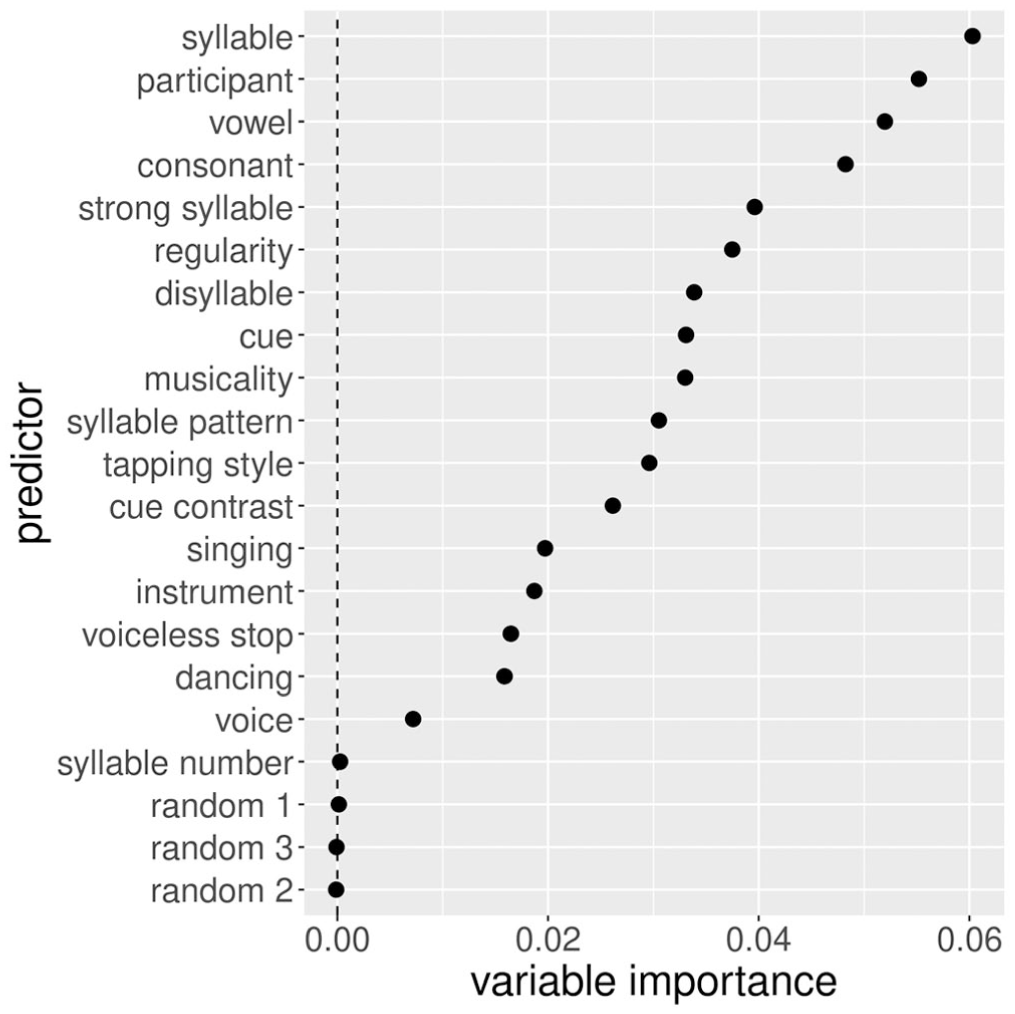
RF-group: variable importance for each predictor of matching, sorted decreasingly.
As for RF-time (Figure 2), participant variation predicts the alignment time best. Which syllable was tapped to was ranked second, closely followed by participants’ musicality and the consonant in the syllable. The remaining high-ranked predictors in RF-time were mostly related to the segmental composition of the sequences (i.e., voiceless stop, disyllable and vowel) or to the factors on which the calculation of participants’ musicality score was based (singing, regularity). The position of the syllable in the sequence (syllable number), the voice in the stimuli (voice) and the three random predictors had close to zero variable importance.
As for RF-tap (Figure 3), syllable was ranked highest, followed by participant, vowel and consonant, indicating that these predicted the number of taps best. Other somewhat high-ranked predictors were related to the supra(segmental) composition of the sequence (strong syllable, disyllable, cue, syllable pattern) and the musical experience of the participants (regularity, musicality, tapping style). The individual musicality scores (singing, instrument and dancing) were ranked low. The position of the syllable in the sequence (syllable number) and the three random predictors had close to zero variable importance.
As for the grouping responses (RF-group, Figure 4), voiceless stop had the highest variable importance, much more so than the variables that were ranked second and third: strong syllable and consonant. Cue, voice and participants were lower ranked. None of the other predictors showed values close to the third random predictor, which was taken as an indication that their predictive strength was weak.
To obtain better insight into the predictors related to the segmental composition of the sequence (syllable, disyllable, strong syllable, consonant, vowel), which were highly ranked in all RF analyses, Table 6 gives the alignment times (and their standard deviations), number of taps and grouping scores.
Mean Tap Alignment Time and Standard Deviation (ms), Number of Taps and Grouping Score (Proportions) per Disyllable, Syllable, Consonant and Vowel.
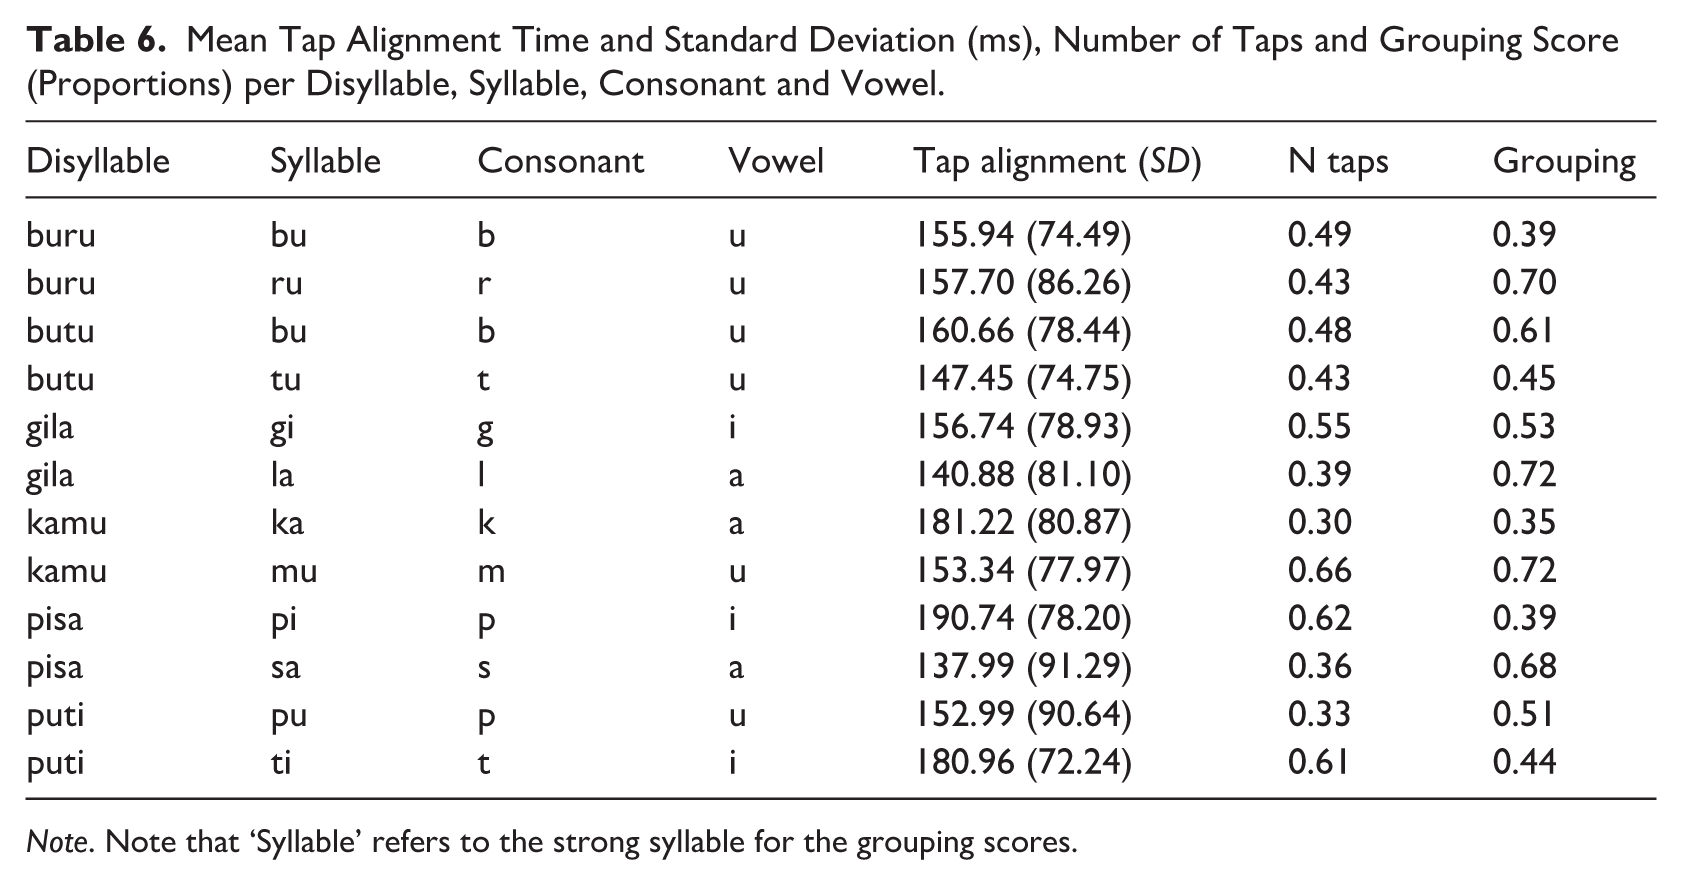
Note. Note that ‘Syllable’ refers to the strong syllable for the grouping scores.
With regard to the alignment times, the syllables /la/ and /sa/ showed the lowest (earliest) values, whereas /ka/ and /pi/ showed the highest (latest) values. The alignment times’ standard deviations varied somewhat with the vowel in the syllable; /i/ had SDs below 80 ms, whereas /a/ had SDs above 80 ms. SDs for /u/ were more variable.
With regard to the number of taps, a rough division into three groups can be made that appears to pattern with the vowel in the syllable: low scores for /a/ (<0.40), medium to high scores for /u/ (0.43–0.66) and high scores for /i/ (>0.55). It can furthermore be observed from the scores that in the same disyllable, one syllable was generally preferred to tap with over the other, following the same ranking of vowels, that is, /gi/ over /la, /mu/ over /ka/, /pi/ over /sa/, and /ti/ over /pu/.
The grouping responses show the highest matching scores for /ru/, /la/ and /mu/ (>0.70), medium scores (40–70) for /bu/ (in ‘butu’), /tu/, /gi/, /pu/ and /ti/, and low scores (<0.40) for /bu/ (in ‘buru’), /ka/ and /pi/. Although the vowel composition of the syllables seems mixed, the coarse three-way division (high-medium-low) shows that the high category consists of only voiced non-plosive consonants, whereas the low category consists of plosives (one voiced and two unvoiced) only.
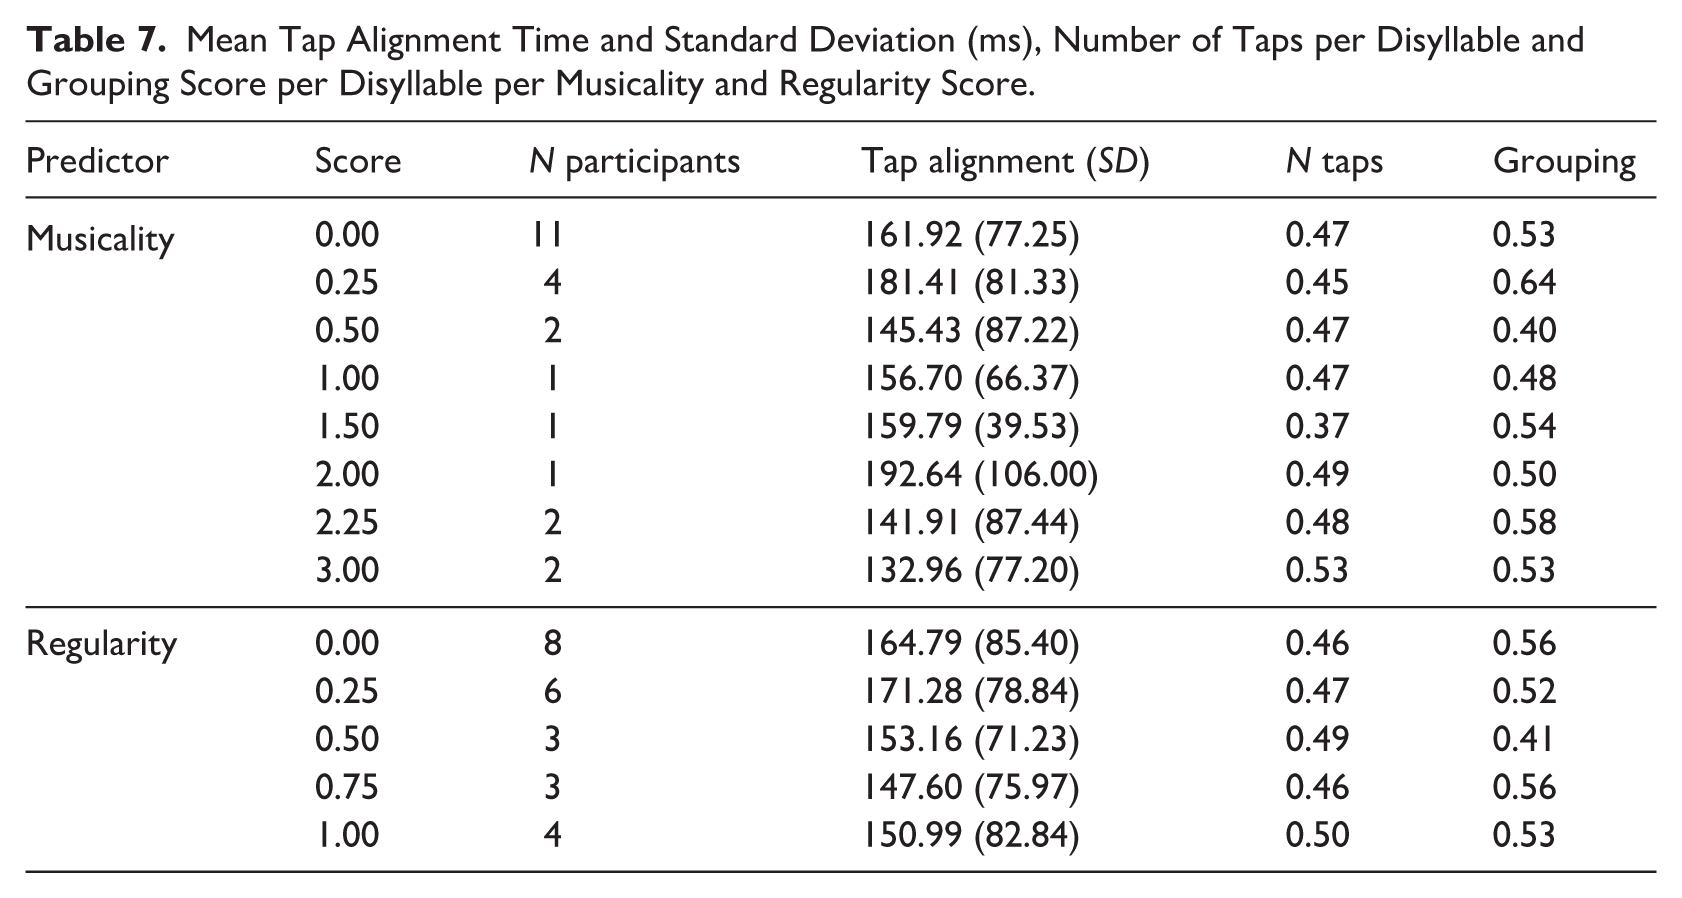
Musical experience, in particular overall musicality and regularity, had a high importance in both RF-time and RF-tap, and much less so in RF-group. Table 7 reports the alignment times, number of taps and grouping scores for each musicality and regularity score that was registered for the participants. To further assess the precise relation between musical experience and tapping behavior, additional analyses were carried out. The general trend of more overall musicality and higher regularity in engaging in musical activities, leading to earlier alignment times and more taps, was weakly supported by Pearson correlations:
Mean Tap Alignment Time and Standard Deviation (ms), Number of Taps per Disyllable and Grouping Score per Disyllable per Musicality and Regularity Score.
3.3. Interim Conclusion: Predictor Selection
To sum up the predictor selection analyses, several conclusions can be drawn. Foremost, the stimulus materials affected all the responses to a large extent. The syllable had a particularly high importance in predicting the responses across all RF analyses. These results indicate that the segmental composition of the sequences predicted the responses more than the hypothesized predictors cue and cue contrast. In particular, the number of taps appeared to be higher for higher vowels (Table 6, which speculatively could be attributed to the fixed F0 level in the stimuli (more discussion in Section 5). As for the tapping responses (RF-time, RF-tap), the individual variation among participants was high, and their differences could be captured by overall musical experience to a large extent. Grouping responses (RF-group) were predicted best by whether the syllable onset was a voiceless stop or not, and were affected by musicality to a negligible extent. As for the voice in the stimulus materials, this predictor was irrelevant for tapping and somewhat relevant to grouping. The random predictors showed an expected importance around 0, facilitating the identification of other irrelevant predictors in the RFs. The next section analyses the responses using the most important predictors in a series of Bayesian models.
3.4. Modeling
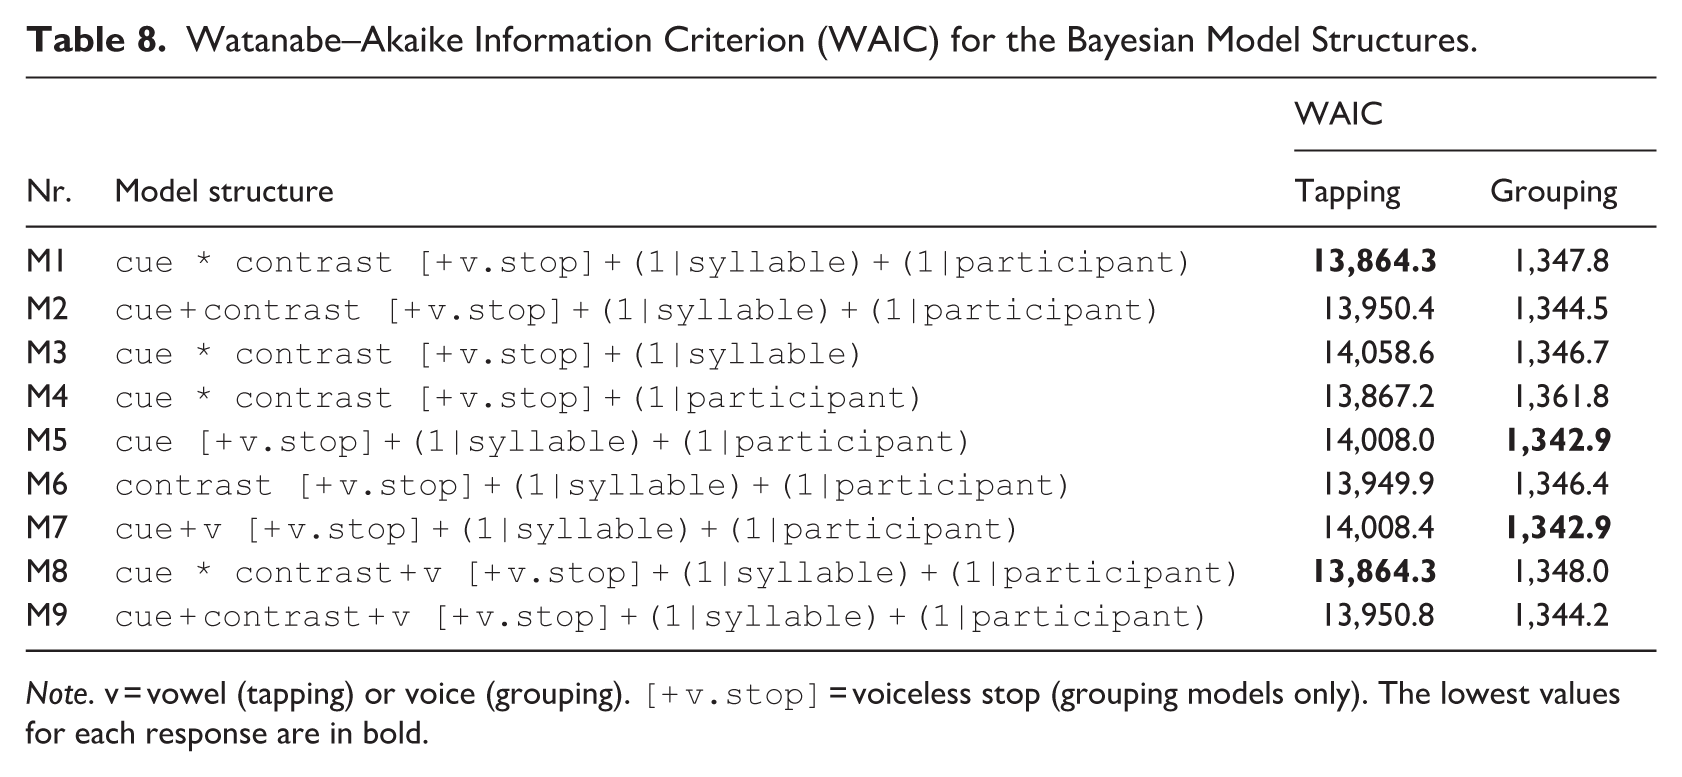
Several Bayesian mixed effects model structures were tested for how well they fitted the data. This was done to select which predictors should be included in the final model and was assessed by calculating the Watanabe–Akaike information criterion (WAIC; Watanabe, 2013).
The modeling was performed for tapping and grouping responses separately in R (R Core Team, 2022; R Studio Team, 2023) using the brms package (Bürkner, 2021). The response for tapping was the number of taps that were given to strong syllables divided by the total number of taps, that is, the likelihood of tapping to a strong syllable (henceforth tapping score). The response for grouping was the matching score as described in Section 2.6.2.
The basic model structure included the hypothesized fixed factors (dummy coded) cue (four levels: duration, intensity, spectral tilt, vowel quality) and cue contrast (two levels: natural, enhanced), which were tested independently and in interaction, and random intercepts for strong syllable (12 levels: /bu/, /gi/, /ka/, /la/, /mu/, /pi/, /pu/, /ru/, /sa/, /ti/, /tu/) and participant (24 levels: 1–24). The basic model structure was then altered in a stepwise manner such that the derived structures were minimally different from each other (Table 8). This was done by adding or removing the interaction between the hypothesized fixed factors, or by adding or removing a factor or random intercept. For tapping, the additional fixed factor vowel (three levels: /a/, /i/, /u/) was tested, whereas for grouping, the additional fixed factors voiceless stop (two levels: yes or no), voice (two levels: Ardi or Male1) was tested, following the importance they had in RF-tap (Figure 3) and RF-group (Figure 4) respectively. The WAIC was computed for each model structure (Table 8).
Watanabe–Akaike Information Criterion (WAIC) for the Bayesian Model Structures.
Note. v = vowel (tapping) or voice (grouping). [
Priors for population-level effects were set to a normal distribution
Model structures M1 and M8 both had the lowest WAIC for the tapping responses (Table 8). Given that M8 only differed for including the extra factor vowel, which was highly ranked in the RF (Figure 3), M8 was chosen as the final model. Model structures M5 and M7 had the lowest WAIC for the grouping responses, which both did not include cue contrast. Also, for grouping, the model with the additional factor (voice) was chosen as the final one. Note that in both final model structures (tapping: M8, grouping: M7) as well as in other high-ranked models, the random intercepts for syllables and participants were both included, indicating that accounting for their effects improved the model-to-data fit.
Non-linear hypothesis testing was performed for both final models (hypothesis() function in the brms package; Bürkner, 2021). Note that the control items were excluded for both model analyses (Section 2.6), as the responses tapping to the hypothesized syllable (strong) and matching the hypothesized grouping could not be calculated for the control items. A reference level for contrast coding of the factors in the model was therefore missing. As for the factor cue (four levels), the reference level was set to zero by removing the intercept from the model (formula: . . . ∼ 0 + . . .). This allowed us to test the hypotheses for all levels of the factor cue. Other factors had only two levels (cue contrast: natural, M8-voice: Ardi). Note that /a/ was the reference level for the factor vowel in M7. The hypotheses that any of the cues would lead to above chance-level (0.5) tapping or grouping scores were tested. The other fixed factors (two levels) were tested against their reference level.
In addition to the Bayesian modeling, which only provided overall chance-level tests for the factor cue, Wilcoxon signed-rank tests were performed on the tapping and grouping responses for each level of cue and cue contrast separately. This was done to test whether these scores were above chance level (
4. Results
As for tapping, the results of the Bayesian model indicate cue contrast effects for all cues (Table 9). For duration, the effect of cue contrast (‘contrast-enh.’ in Table 9) indicated less taps to strong syllable for enhanced contrasts than for natural contrasts. For all other cues, enhanced contrasts showed significantly more taps to strong syllables than natural contrasts. These effects were largely corroborated by the Wilcoxon tests (Table 11). An additional effect for the natural spectral tilt contrast was found in that these led to above chance-level tapping responses.
Model Output Including the Tested Hypotheses for the Interaction of Cue and Cue Contrast, and Vowel (M8) on the Tapping Responses.
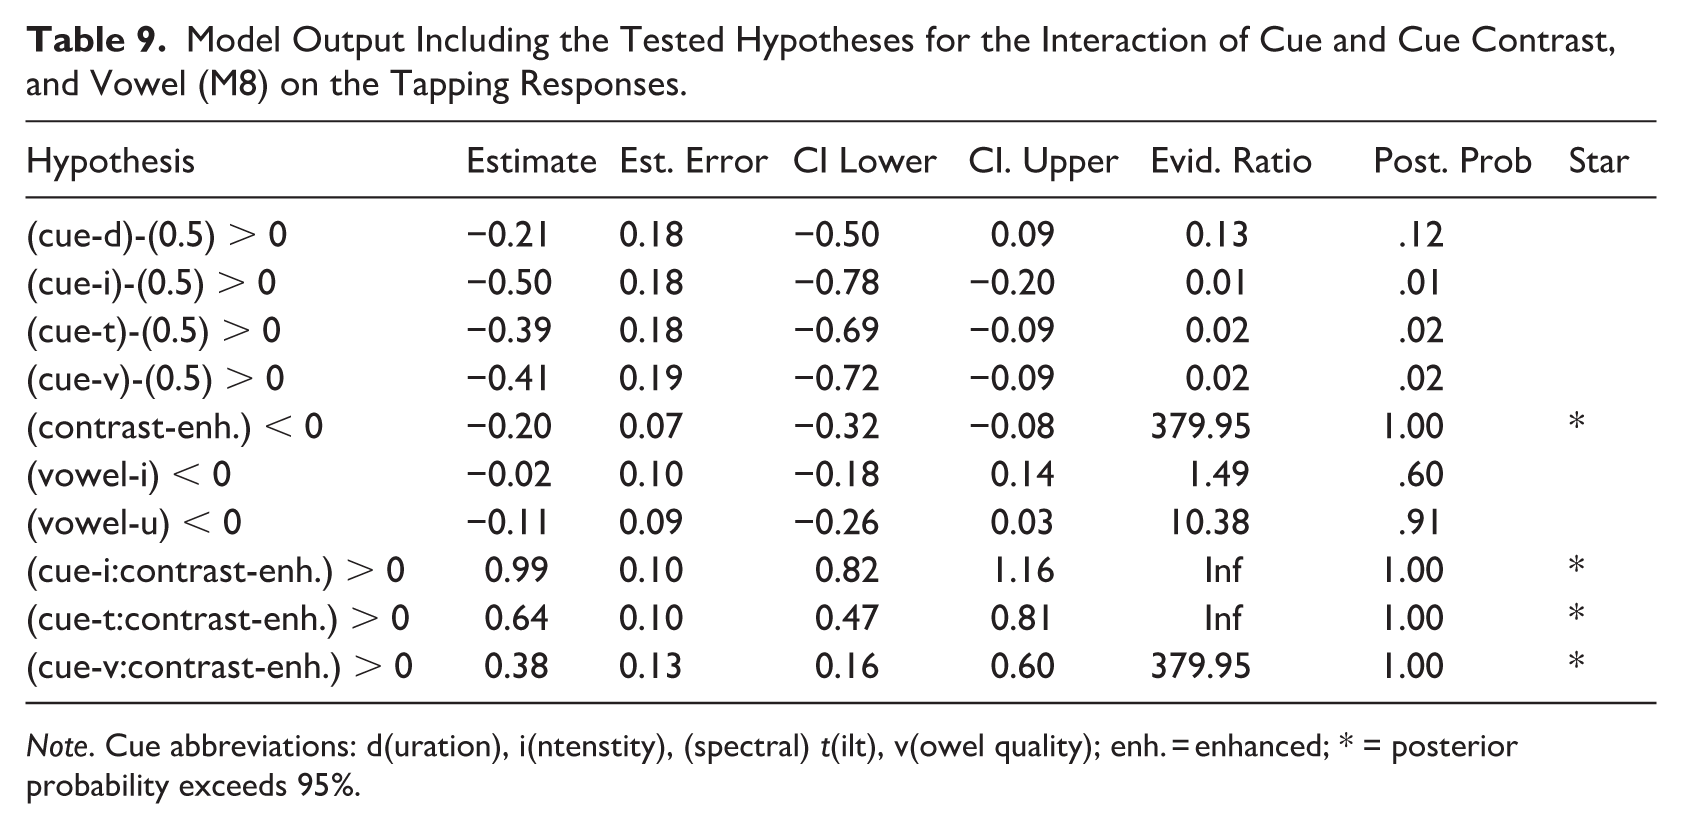
Note. Cue abbreviations: d(uration), i(ntenstity), (spectral) t(ilt), v(owel quality); enh. = enhanced; * = posterior probability exceeds 95%.
The Bayesian analysis of the grouping responses showed an effect of spectral tilt in that this cue led to significantly more taps to strong syllables (re. chance level; Table 10). A significant decrease in matching grouping responses occurred when the onset of the syllable was a voiceless stop. No effects of the other cues nor of the factor voice were found. The Wilcoxon tests confirmed an effect of spectral tilt for both natural and enhanced contrasts, in that participants’ grouping matched significantly above chance level. None of the other cues showed any effects in the Wilcoxon tests.
Model Output Including the Tested Hypotheses for Cue and Voice (M7) on the Grouping Responses.
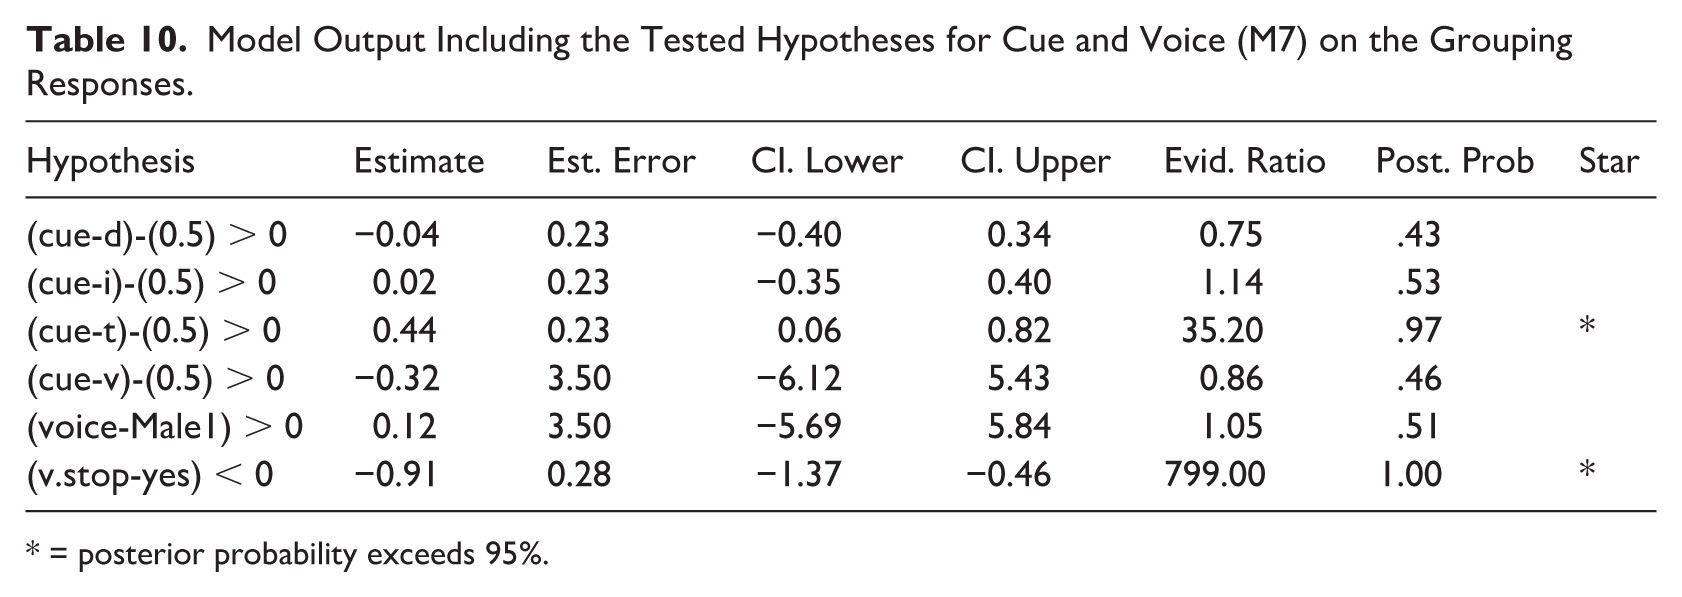
* = posterior probability exceeds 95%.
5. Discussion and Conclusions
This study investigated tapping to prominent syllables and grouping syllables into words using acoustically manipulated sequences of Papuan Malay words. Before turning to the results of the main factors of interest (cue and cue contrast), it is important to acknowledge that the responses in the tapping and grouping task were affected by both the presented stimulus materials and the variation among participants. The conclusions drawn from this study should therefore be interpreted in the context of these factors, as further discussed below. We now turn to a discussion of the main findings for tapping and grouping.
5.1. Tapping and Grouping
As for the tapping behavior, the taps to strong syllables occurred significantly more often than taps to weak syllables, although the scores were still somewhat close to chance level (Table 11). Above chance-level taps to strong syllables for natural acoustic contrasts were only given when the cue was duration or spectral tilt, corroborating the importance of these cues as correlates of word stress in Papuan Malay (Kaland, 2019). The modeling results indicated that only enhanced acoustic contrasts were strong enough to significantly affect the responses (Table 9). The enhancement of the acoustic contrast increased the number of taps to strong syllables for intensity, spectral tilt and vowel quality. Enhanced duration contrasts (strong syllable 20 ms longer, weak syllable 20 ms shorter) made participants tap at chance level to either syllable (Tables 9 and 11). It seems unexpected that enhanced duration contrasts did not facilitate taps to strong syllables. However, an explanation could be that duration also had an iambic effect as predicted by the ITL (Hayes, 1995). That is, lengthening according to this law is associated with finality. Thus, enhanced duration contrasts could have acted as an ambiguous cue, that is, for stress lengthening and final lengthening simultaneously. Recall that participants’ task was to tap to the start of the word (Section 2.5). Therefore, the stress lengthening interpretation would lead to tapping to the long syllable, being the first syllable in the word that participants needed to identify. The final lengthening interpretation would lead to tapping to the weak syllable, as the long one should have come last as per ITL. It could be expected that even larger duration contrasts (> 40 ms difference between strong and weak) would lead to even more taps to weak syllables. This line of reasoning is further supported by the iambic effect of duration in non-speech stimuli in Kaland et al. (2025). The grouping scores show a tendency that is in line with this reasoning, but do not show effects that confirm it. Note, however, that this might still be a result of duration being an ambiguous cue.
Average Scores of Tapping and Grouping Responses, and p-Values Indicating Whether These Were Significantly Above Chance Level (Wilcoxon signed-Rank Test With µ
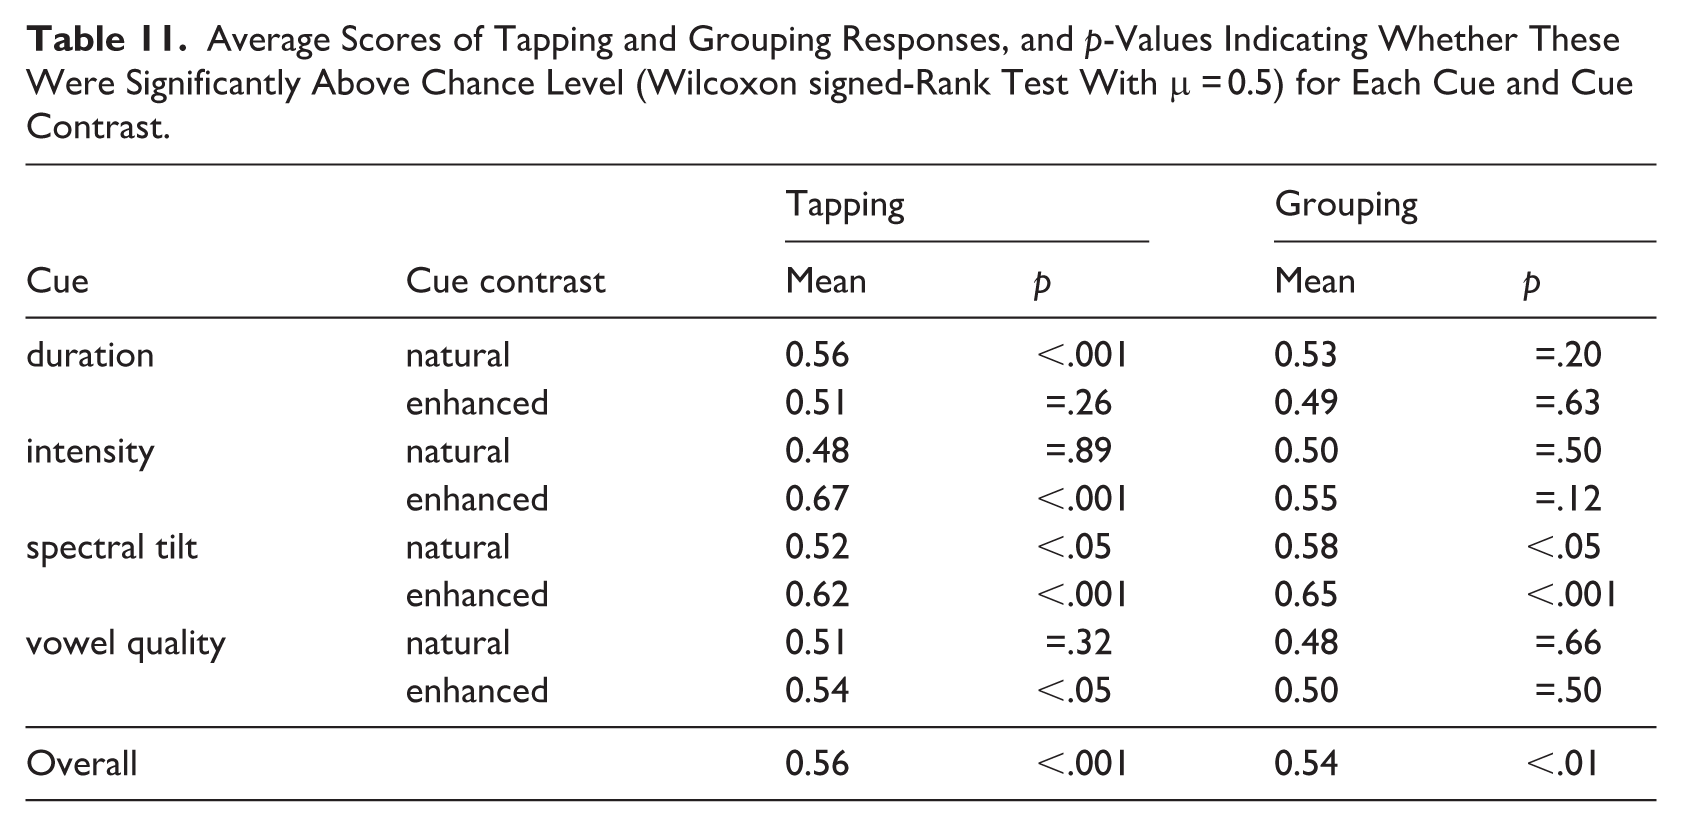
With regard to grouping, significantly more words with initial prominence (trochaic) than words with final prominence (iambic) were grouped, even though the overall mean was close to chance level (Table 11). Both the modeling and the chance-level tests revealed that spectral tilt was the only cue that significantly affected the grouping responses, in that syllables for which spectral tilt was manipulated were grouped as word initial (Tables 10 and 11). Enhanced spectral tilt contrasts led to even more trochaic responses (Table 11). The remaining cues only showed trends in that intensity and vowel quality contrasts lead to somewhat more trochaic groupings. Duration showed slightly more iambic grouping than trochaic grouping for enhanced contrasts (Table 11). This observation resembles the duration effect on the tapping responses described above (Table 9 and Kaland et al., 2025). That is, enhanced duration contrasts possibly evoked more iambic grouping (less trochaic grouping) due to the ITL. It is furthermore worth noting that the chance-level responses were comparable those in Bhatara et al. (2016, Figure 1) for the high-variability stimuli. When compared to the low variability ones, the high-variability stimuli were found to challenge both the French and German listeners in that study. In the current study, all stimuli were acoustically complex, plausibly more so than in Bhatara et al. (2016), as they were based on speech rather than musical instruments. This difference could explain why only spectral tilt exceeded chance-level results in the grouping task in the current study.
5.2. Items and Participants
A somewhat less desired effect occurred due to the composition of the stimulus materials. Both the tapping and the grouping were strongly affected by which syllable was acoustically manipulated to be the strongest (Table 6). In particular, grouping was strongly affected by the occurrence of voiceless stops in the syllable onset. Recall from Section 2.2 that vowel onsets occurred approximately 40 ms earlier after a voiceless stop. Given the importance of vowel onsets in rhythmic tasks (e.g., Barbosa et al., 2005; Lidji et al., 2011; Morton et al., 1976; Rathcke et al., 2021; Volín et al., 2014), their timing in the syllable likely affected the perceived grouping. Under this view, the vowel onsets may be seen as attack points (e.g., Lerdahl & Jackendoff, 1983), ruled by principles of proximity (e.g., Wertheimer, 1923), following a similar explanation in Moghiseh et al. (2023, p. 1126). Thus, in the stimuli of the current study, the interval between subsequent vowel onsets in the sequence was not identical in all disyllables. Vowel onsets following a voiceless stop occurred earlier to the previous vowel onset than to the following one, increasing the likelihood of grouping with the previous syllable, rather than with the following one. Thus, in the disyllables ‘butu’, ‘kamu’ and ‘pisa’, the syllables with a voiceless stop ‘tu’, ‘ka’ and ‘pi’ would be more likely to be grouped with the previous one, leading to the observed strong preferences of grouping them as ‘butu’, ‘muka’ and ‘sapi’ (Table 6). As expected along the lines of this explanation, the onset timing effect is not clearly observed for ‘puti’, in which both syllables started with a voiceless stop. Although the timing of the vowel onset explains some of the strong grouping asymmetries, it is likely not the only factor. It can furthermore be observed that if the consonant was voiced and not a stop, the likelihood of being grouped as initial strong syllable was higher (‘ru’, ‘la’, ‘mu’). It can be expected that adding both voicing and manner of the initial consonant as separate factors in the random forest analysis would have led to a high ranking of these factors for the prediction of the grouping responses. In this context it is also important to note that the synthetic voice used for the creation of the stimuli was Indonesian. It can therefore not be entirely ruled out that listeners had a perceptual bias for Indonesian. This effect, however, would have only occurred due to the acoustic properties of some individual sounds (segments), as the crucial prosodic manipulations in the stimuli were entirely based on Papuan Malay acoustics (Section 2.2). It is furthermore possible that intrinsic properties of vowels such as duration played a role (recall the vowel ranking in Section 3.2), which were shown to be under the control of the speaker in some languages, but not in others (e.g., Solé & Ohala, 2010). Without further knowledge of these effects in Papuan Malay, these effects remain speculative.
The segmental composition of the syllables in the sequences also affected the responses in other ways. Although the factors consonant and vowel were highly ranked for tapping, no consistent patterns in terms of timing or number of taps could be identified (Table 6). This indicates that the composition of the syllable as a whole was determining the tapping responses better than the individual vowels and consonants. One explanation might lie in the effect of the acoustic manipulation, which was done in an identical way for all syllables. Lengthening, for example, generally affects vocalic portions of the syllable more than consonantal ones, which was not accounted for in the current stimuli. This manipulation could have made some syllables better candidates to tap to than others. Similar phenomena are likely to hold for increasing intensity or spectral tilt. Shifting formant frequencies to the same degree for all vowels, as done in this study, could also have affected certain vowels more than others. Note that in Kaland (2019, Figure 5) /a/ appeared more peripheral when stressed than any of the other Papuan Malay vowels. It cannot be excluded that the acoustic manipulation would have been more naturalistic with vowel-specific formant shifts between strong and weak syllables, possibly reducing the effects of the stimulus material. At the same time, mid vowels /ɔ/ and /ɛ/ are frequently avoided in Papuan Malay stressed syllables (Kaland et al., 2021), showing that the language does have natural preferences for certain vowels in strong syllables. These vowels were not present in the current stimuli. However, it cannot be ruled out that among the tested vowels certain language-intrinsic or vowel-intrinsic effects played a role (i.e., vowel-intrinsic intensity: Fairbanks et al., 1950; Kaland and Postma-Nilsenová, 2014; Lehiste & Peterson, 1959; Ruederer, 1915).
As already shown in the predictor selection (Section 3.1 and Table 7), participant variation was an important factor that was taken into account in the final Bayesian modeling. As shown in previous studies, musical experience indeed affects responses in tapping or grouping tasks, regardless of whether they are speech- or non-speech-like (Bhatara et al., 2013, 2016; Hui Ying et al., 2023). In the current study, musical experience was of particular importance to tapping (Figures 2 and 3), less so to grouping (Figure 4). Apart from other factors that caused the participant variation, musicality seemed to capture some of the participant variation in the alignment times (Section 3.2). None of the individual aspects of musicality that were used to compute the score (instrument, singing, dancing) appeared to have an effect on their own. It might be unsurprising that the musicality experience of the participants mainly affected the tapping rather than the grouping. The nature of the tapping task mainly requires synchronization, rather than the identification of the word. In comparison, word identification seemed more crucial in the grouping task. Previous work showed that dancers did not only tap earlier but also more synchronously to a beat than non-dancers (Jin et al., 2019). The current results showed weak correlations in the same direction in that alignment times were earlier for participants with regular musical experience (Table 7). The bimodal distribution of tap times (Figure 1) showed approximately 90 ms difference between the early and late aligners, which is considerably larger than the approximately 25 ms difference between the dancers and non-dancers in Jin et al. (2019, Figure 1). It therefore seems that participant variation is only partially explained by musical experience, and musical experience only partially explains tap timing differences. It can therefore be concluded that musicality was indeed an important source of participant variation and most likely not the only one. As shown in previous tapping tasks, reading proficiency, speech disorders and language learning proficiency were also factors that affected the results in synchronization tasks (e.g., Baills & Prieto, 2023; Bhide et al., 2013; Cumming et al., 2015; Moritz et al., 2013). These other sources of variation could have played a role in the current results too, although they were not explicitly tested.
5.3. Conclusions
Coming back to the hypotheses of the current study (Section 1.5), Papuan Malay listeners indeed use all acoustic cues to allocate prominences. Duration and spectral tilt appeared to be stronger cues than intensity and vowel quality, as the latter two cues only had an effect as enhanced contrast (Table 11, tapping). Duration and spectral tilt are indeed strong stress correlates in Papuan Malay (Kaland, 2019). It can furthermore be confirmed that vowels play an important role as p-centers (Barbosa et al., 2005; Morton et al., 1976; Rathcke et al., 2021; Volín et al., 2014), as taps were predominantly aligned to the vocalic portion of the syllable (Figure 1). The bimodal distribution of alignment times furthermore indicated that the vowel onset was not necessarily the p-center for all participants, which could be attributed to their musical experience to some extent.
Papuan Malay listeners rely on spectral tilt as most important and consistent grouping cue. Without clear effects, it remains speculative what the role of vowel quality might be in the context of possible simultaneous effects of the ITL. The natural vowel quality contrasts seem to hint at iambic grouping, whereas the enhanced contrasts are exactly at chance level (Tables 10 and 11). It can therefore not be concluded whether enhanced vowel quality contrasts facilitate trochaic grouping. Future research should therefore investigate to what extent vowel quality contrasts are subject to stress differences and/or affected by the ITL. A language such as English, which primarily relies on vowel quality as a cue to stress (e.g., Cooper et al., 2002) could be investigated in this respect. Minimal stress pairs such as noun/verb distinctions (e.g., permit, record, subject, contract, etc.) would be ideal test cases in paradigms as the ones used in this study. They could reveal whether manipulated vowel quality contrasts affect the interpretation of the word class, and if so, whether enhanced contrasts would boost or weaken the effect.
The current study sheds new light on the role of duration in Papuan Malay prosody. Thus, lengthening as cue to stress only (20 ms) or as cue to both stress and finality (40 ms) could explain the outcomes of this study. This result confirms the finding in Moghiseh et al. (2023) in that ITL effects occur most clearly for extreme acoustic manipulations. More fundamentally, the current results corroborate the alternative interpretation of the ITL which argues that prominence and grouping are underlying perceptual mechanisms to parse prosodic structure. The current results confirm the cross-linguistic tendency that prominence is cued by duration and grouping by intensity (Wagner et al., 2021). That is, duration (natural contrasts) contributed to an increase in taps to strong syllables in the tapping task, and spectral tilt, taken as an amplitudinal cue, was the sole cue that affected listeners’ responses in the grouping task. The enhanced duration contrasts, although not natural for the word level, could have matched the degree of lengthening that is required at a larger domain (i.e., phrase or utterance) to signal its right edge. In a study on 10 typologically diverse languages, an average utterance-final lengthening of 19.8% (median: 12%) was found (Seifart et al., 2021, Table 2), which is highly comparable to the enhanced duration contrast of 280 ms to 320 ms (14.3% lengthening) in the current study. It is therefore likely that the enhanced duration contrasts matched Papuan Malay listeners’ expectations of final lengthening at the utterance level. In a sequence of repeated syllable- or word-like units, as used in the current study, enhanced duration was therefore particularly ambiguous for participants and thus led to chance-level groupings. It can therefore be concluded that duration is not exclusively related to prominence (cf. Wagner et al., 2021). The degree of duration appears to guide Papuan Malay listeners in recognizing two aspects of prosodic structure: the level (word or phrase) and the function (prominence or grouping). Lengthening of approximately 6.8% leads to the interpretation of word prominence (Table 9), whereas lengthening of approximately 14.3% or more arguably contributes to the interpretation of final lengthening within a larger domain than the word.
With regard to the separation of prominence and grouping as two different prosodic functions in Papuan Malay, the current study confirms that this is useful to the extent that the tasks used to investigate these functions involve different degrees of importance of the acoustic cues. This does not necessarily mean that these functions are entirely separable for Papuan Malay (see also Kaland & Baumann, 2020 and Section 1). This separation appears a particularly challenging endeavor when acoustic cues contribute to both functions depending on the degree of the contrast they signal (i.e., duration). Thus, this study reconfirms the importance of investigating lesser-researched languages for the perceptual mechanisms underlying their prosodic structure. The tasks and setup used in the current study may be applicable to other languages too, provided that the segmental and prosodic make-up of the materials undergoes further tailoring to the language at hand. Many more languages are left for future work in this respect.
Footnotes
Appendix A
Table A1. List of Participants (pp) Assigned to a Combination of Two Acoustic Cues (
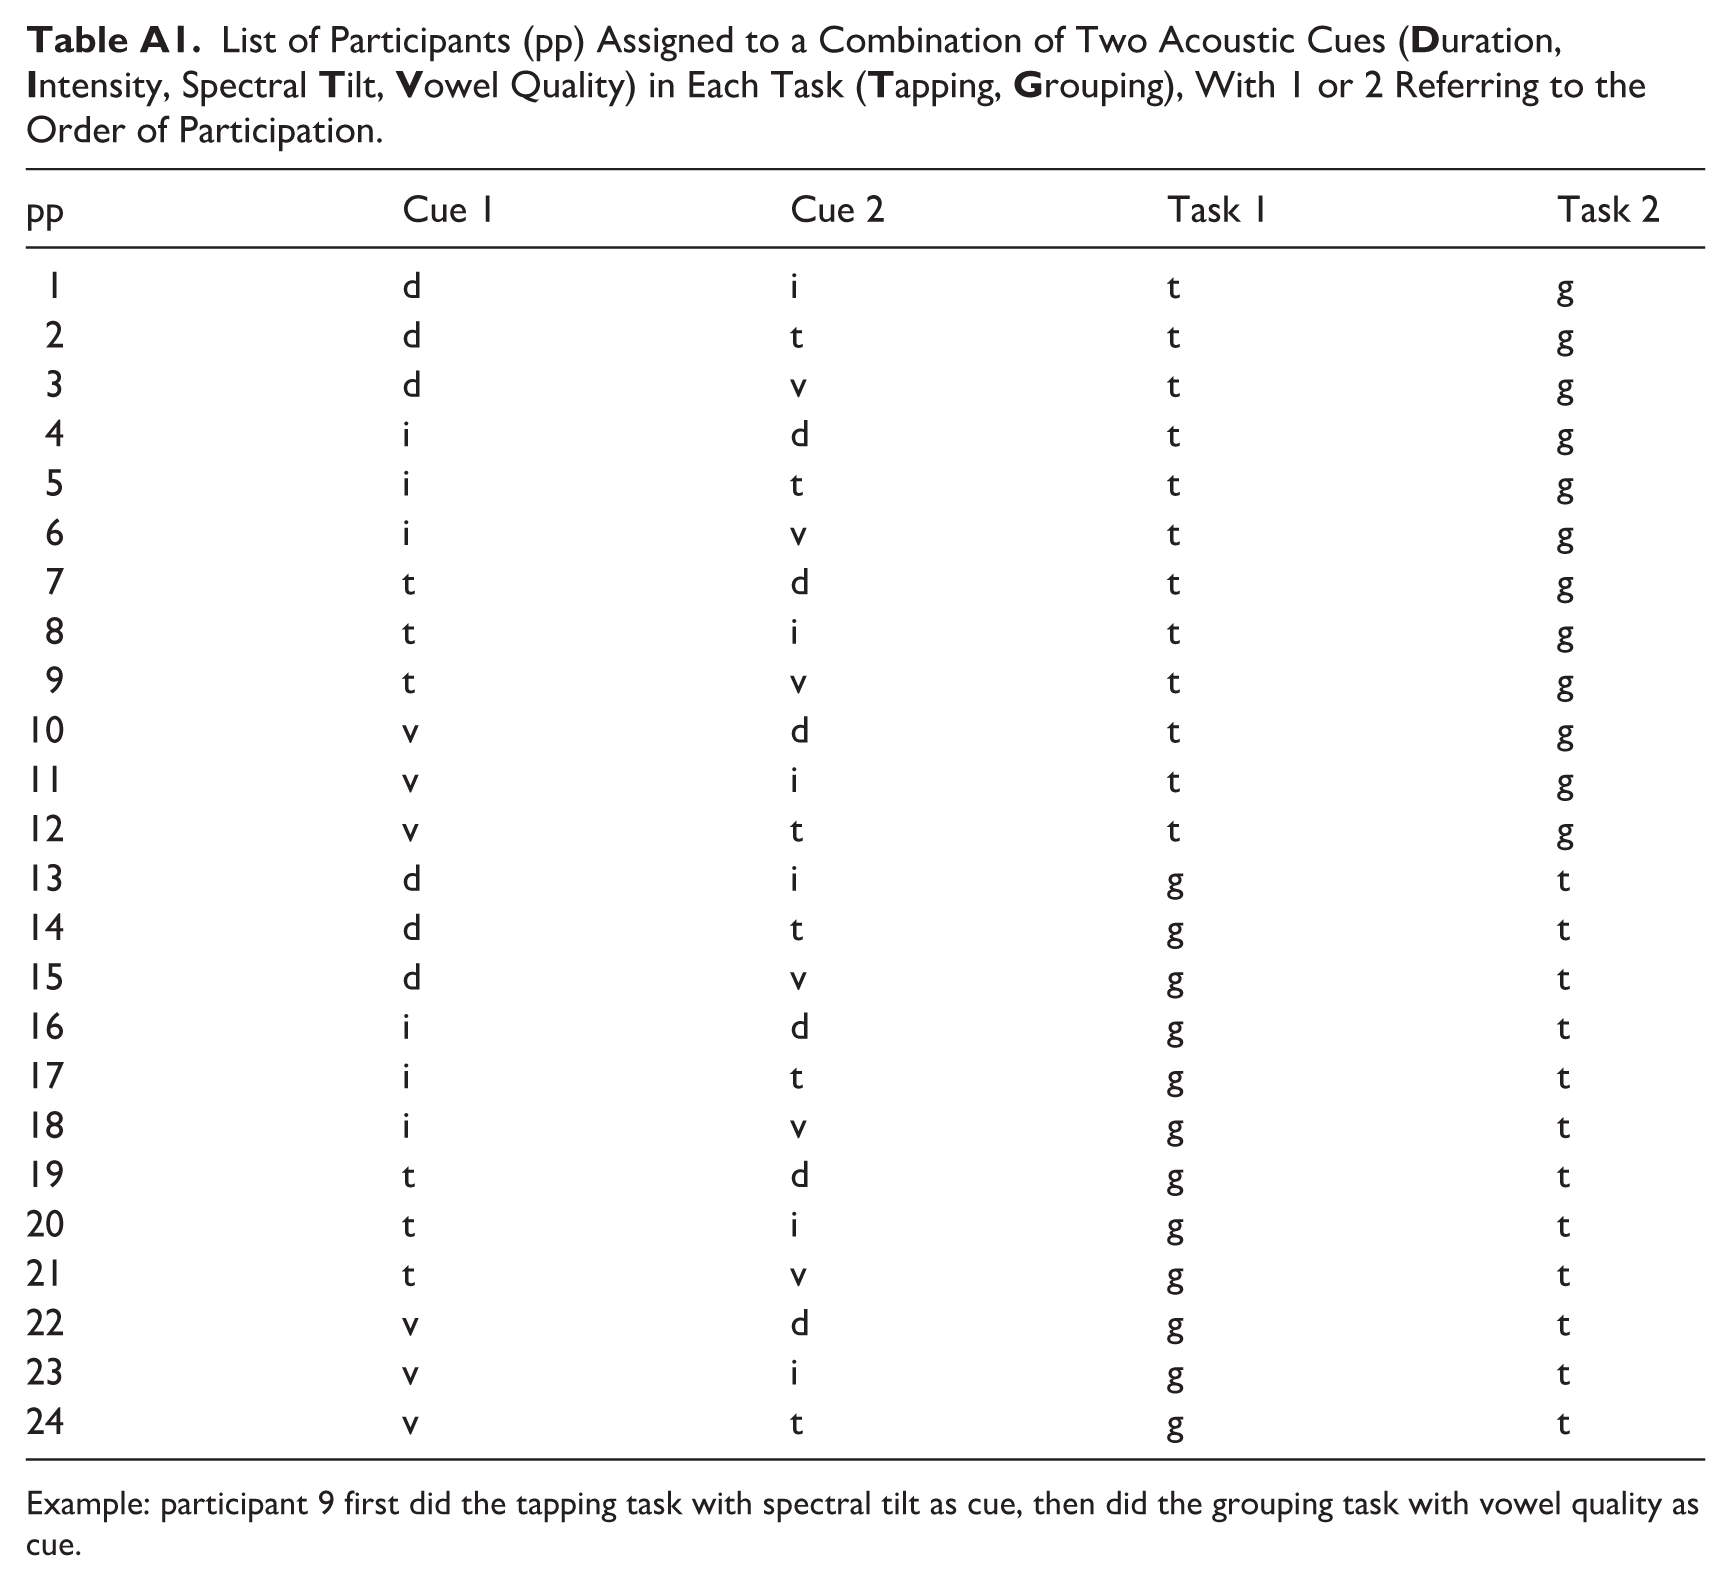
| pp | Cue 1 | Cue 2 | Task 1 | Task 2 |
|---|---|---|---|---|
| 1 | d | i | t | g |
| 2 | d | t | t | g |
| 3 | d | v | t | g |
| 4 | i | d | t | g |
| 5 | i | t | t | g |
| 6 | i | v | t | g |
| 7 | t | d | t | g |
| 8 | t | i | t | g |
| 9 | t | v | t | g |
| 10 | v | d | t | g |
| 11 | v | i | t | g |
| 12 | v | t | t | g |
| 13 | d | i | g | t |
| 14 | d | t | g | t |
| 15 | d | v | g | t |
| 16 | i | d | g | t |
| 17 | i | t | g | t |
| 18 | i | v | g | t |
| 19 | t | d | g | t |
| 20 | t | i | g | t |
| 21 | t | v | g | t |
| 22 | v | d | g | t |
| 23 | v | i | g | t |
| 24 | v | t | g | t |
Example: participant 9 first did the tapping task with spectral tilt as cue, then did the grouping task with vowel quality as cue.
Appendix B
Acknowledgements
The author is grateful to The Papuan Malay Bible Translation Team (Tim Penerjema Alkitab Melayu Papua) for help with participant recruitment and experiment facilitation. The experiments reported in this paper have been conducted following protocols and informed consent practices in compliance with the Helsinki Declaration, with approval of the Papuan Malay Bible Translation Team.
Funding
The author disclosed receipt of the following financial support for the research, authorship, and/or publication of this article: Research for this paper was funded by the German Research Foundation (DFG) – Project-ID 281511265 – SFB 1252.
Declaration of Conflicting Interests
The author declared no potential conflicts of interest with respect to the research, authorship, and/or publication of this article.