






Abstract
In U.S. English, nonpathological creaky voice (vocal fry) is a common voice quality that contributes meaningful linguistic information. However, several studies have found that speakers who use creaky voice, particularly young women, are rated as sounding less hirable and less pleasant. The current study reexamines these findings by using utterances with spontaneously produced creaky voice in one of its most common locations (phrase-final position). In addition, five different listener groups varying in age and gender (younger women, younger men, younger nonbinary listeners, older women, older men) were recruited to explore which listeners exhibit more negative perceptions of creaky voice. We selected spontaneously produced sentences from 10 speakers such that half had creak on the final word and half did not. A total of 104 listeners rated the sentences on a hirability scale and a pleasantness scale. Then, they completed implicit and explicit association tasks about gender and career roles. Contrary to previous research, listeners did not rate sentences with phrase-final creaky voice as less hirable or less pleasant overall, although older women rated the sentences with creaky voice as sounding less pleasant than sentences without creak. Younger nonbinary listeners rated voices as sounding more hirable overall (regardless of creak status) than either younger women or younger men. Taken together, these results suggest that phrase-final creak, when produced spontaneously, is not universally perceived more negatively than fully modal productions.
1. Introduction
Creaky voice 1 is a voice quality that has been described as sounding like “popping corn” (Moser, 1942) or a “stick being run along a railing” (Catford, 1964). Although creaky voice can be symptomatic of a voice disorder when accompanied by pain or other symptoms (Langeveld et al., 2000; Morrison et al., 1986; Ross et al., 1998), it is also a voice quality that is used by vocally healthy speakers to mark the ends of utterances in U.S. English (Abdelli-Beruh et al., 2016; Chafe, 1994; Grivičić & Nilep, 2004; Laver, 1980; also in Finnish, Kallio et al., 2022; Ogden, 2001), parenthetical speech (Lee, 2015), and other uses both in U.S. English and cross-linguistically (see below for details). Despite its linguistic uses, negative attitudes toward creaky voice in U.S. English exist in both the popular press and academic research. Media pieces (e.g., Hageman, 2013; Mo, 2016; Mozo, 2021; Rhodan, 2014) often refer to academic articles to support the argument that using creaky voice negatively impacts young women’s hirability. However, several methodological decisions in these research studies may have contributed to results showing that speakers who use creaky voice are perceived more negatively than speakers who do not (see below for details). Furthermore, even though the majority of studies have used a single listener group (typically not separated by age or gender), the results are often interpreted as being highly generalizable. To expand on these methodological decisions, the current study uses spontaneously produced speech samples with creaky voice in one of its most commonly found locations (phrase-final position) and investigates the extent to which attitudes toward creak differ across listener groups. The purpose of the current study is to examine if sentences produced by young women with phrase-final creaky voice are evaluated more negatively than sentences without creaky voice and if these evaluations are held by all listener groups.
This introduction first presents a brief overview of the physiological and acoustic aspects of creaky voice production (Section 1.1). Then, research on the linguistic functions (Section 1.2) and social perceptions (Section 1.3) of creaky voice is presented. Next, we discuss methods used in previous studies with particular focus on those that we seek to modify in the current study (Section 1.4). Then, we introduce ways to examine listeners’ implicit and explicit associations between gender and career concepts (Section 1.5) given the numerous studies on young women’s hirability in the context of creaky voice production. Finally, we introduce the current study (Section 1.6).
1.1. Production of Creaky Voice
Creaky voice is produced with a compressed vocal fold configuration (Hollien et al., 1966) and a low amount of airflow (McGlone & Shipp, 1971), resulting in a slow rate of vocal fold vibration during phonation (Michel, 1968) and a longer amount of time spent in the contact phase of phonation (DiCanio, 2009; Garellek, 2014). Creaky voice is often characterized by an irregular fundamental frequency (F0) below 100 Hz (Blomgren et al., 1998; Hollien & Michel, 1968; Hollien & Wendahl, 1968; McGlone, 1967; McGlone & Shipp, 1971), although there is variability in the production of creaky voice (see Garellek, 2019, for a review). For example, Keating et al. (2015) discuss six different types of creaky voice that primarily vary in the combination of a low F0, irregularity of F0, and the degree of constriction of the glottis. Although there are different types of creaky voice, at least two (prototypical and multiply pulsed) are perceived similarly (Davidson, 2019a). Furthermore, listeners perceive a variety of acoustic correlates as creaky voice, such as a low F0, low harmonics-to-noise ratio, and a low difference in amplitude between the first and second harmonics (H1-H2) (Davidson, 2019a; Hollien & Wendahl, 1968). Visual evidence for creaky voice in the waveform and spectrogram typically includes irregular pulses that are further spaced apart than for modal voice (Johnson, 2011; Ladefoged, 2003; Melvin & Clopper, 2015; Redi & Shattuck-Hufnagel, 2001).
The public view of creaky voice in U.S. English focuses on its increasing use among women; however, there is not a sufficient body of work to substantiate this claim (Dallaston & Docherty, 2020). In fact, there appears to be considerable variation in the rate of production of creaky voice across genders and sexes. 2 Earlier work found greater production of creaky voice in men than in women in England and in Scotland (Henton & Bladon, 1988; Stuart-Smith, 1999) and more recent work on Canadian English-French bilingual speakers has also shown this pattern (Brown & Sonderegger, 2025). Other studies have discussed a different distribution of production, with college-aged U.S. English-speaking women producing more creaky voice during read speech than college-aged U.S. English-speaking men (Abdelli-Beruh et al., 2013; Wolk et al., 2012; Yuasa, 2010). Zimman’s (2013) work examining creaky voice in gay cisgender 3 men, straight cisgender men, and transgender men found that transgender men and gay cisgender men produced creaky voice at similar rates, and more so than straight cisgender men. In a later study of 43 speakers that included speakers of several genders including cisgender women, Becker et al. (2022) found no significant differences in the rate of production of creaky voice across genders. The suggestion that creaky voice is used more among young women also has not been substantiated, with one study finding similar amounts of creaky voice between young (18–25 years old) and middle-aged (35–50 years old) women (Oliveira et al., 2016). Despite the lack of definitive evidence that creaky voice is more frequent in young women’s speech than in that of other genders, the current study investigates listener evaluations of creaky voice produced by young cisgender women due to the focus of media pieces and research studies on young cisgender women’s use of creaky voice (see Section 1.3).
1.2. Linguistic Uses of Creaky Voice
Creaky voice is used for several linguistic purposes. For example, creaky voice can be used phonemically (Belotel-Grenié & Grenié, 2004; Esposito & Khan, 2020; Garellek & Keating, 2011; Keating et al., 2023; Kuang, 2017, 2018; Yu & Lam, 2014) or allophonically (Bellavance, 2021; Garellek, 2015; Garellek & Seyfarth, 2016; Peña et al., 2021). Creaky voice is also used at the sentence or discourse level. In English, it can be used to mark parenthetical speech (Lee, 2015) or the end of an utterance (Abdelli-Beruh et al., 2016; Chafe, 1994; Grivičić & Nilep, 2004; Laver, 1980; also in Finnish, Kallio et al., 2022; Ogden, 2001).
Creaky voice can also be used to indicate group membership (Mendoza-Denton, 2011; Pratt, 2023; Yuasa, 2010) or as a marker of affect or sociolinguistic stance in English (Becker et al., 2022; Lee, 2015; Sicoli, 2015; Yuasa, 2010). For example, it has been argued that creaky voice is used to index a hardcore persona for some Chicano English speakers (Mendoza-Denton, 2011), an upwardly mobile persona for some young white women in California (Yuasa, 2010), or a chill persona for male high schoolers in California (Pratt, 2023). Sociolinguistic work has also found that creaky voice can index a wide variety of specific stances or affects. For example, creak can be used to signal disengagement, detachment, or commiseration in English (Becker et al., 2022; Eckert & Podesva, 2021; Lee, 2015; Sicoli, 2015; Yuasa, 2010). In contrast, others have posited that creak indexes authority (Lefkowitz & Sicoli, 2007) or hypermasculinity (Henton & Bladon, 1988).
1.3. Social Evaluations of Creaky Voice
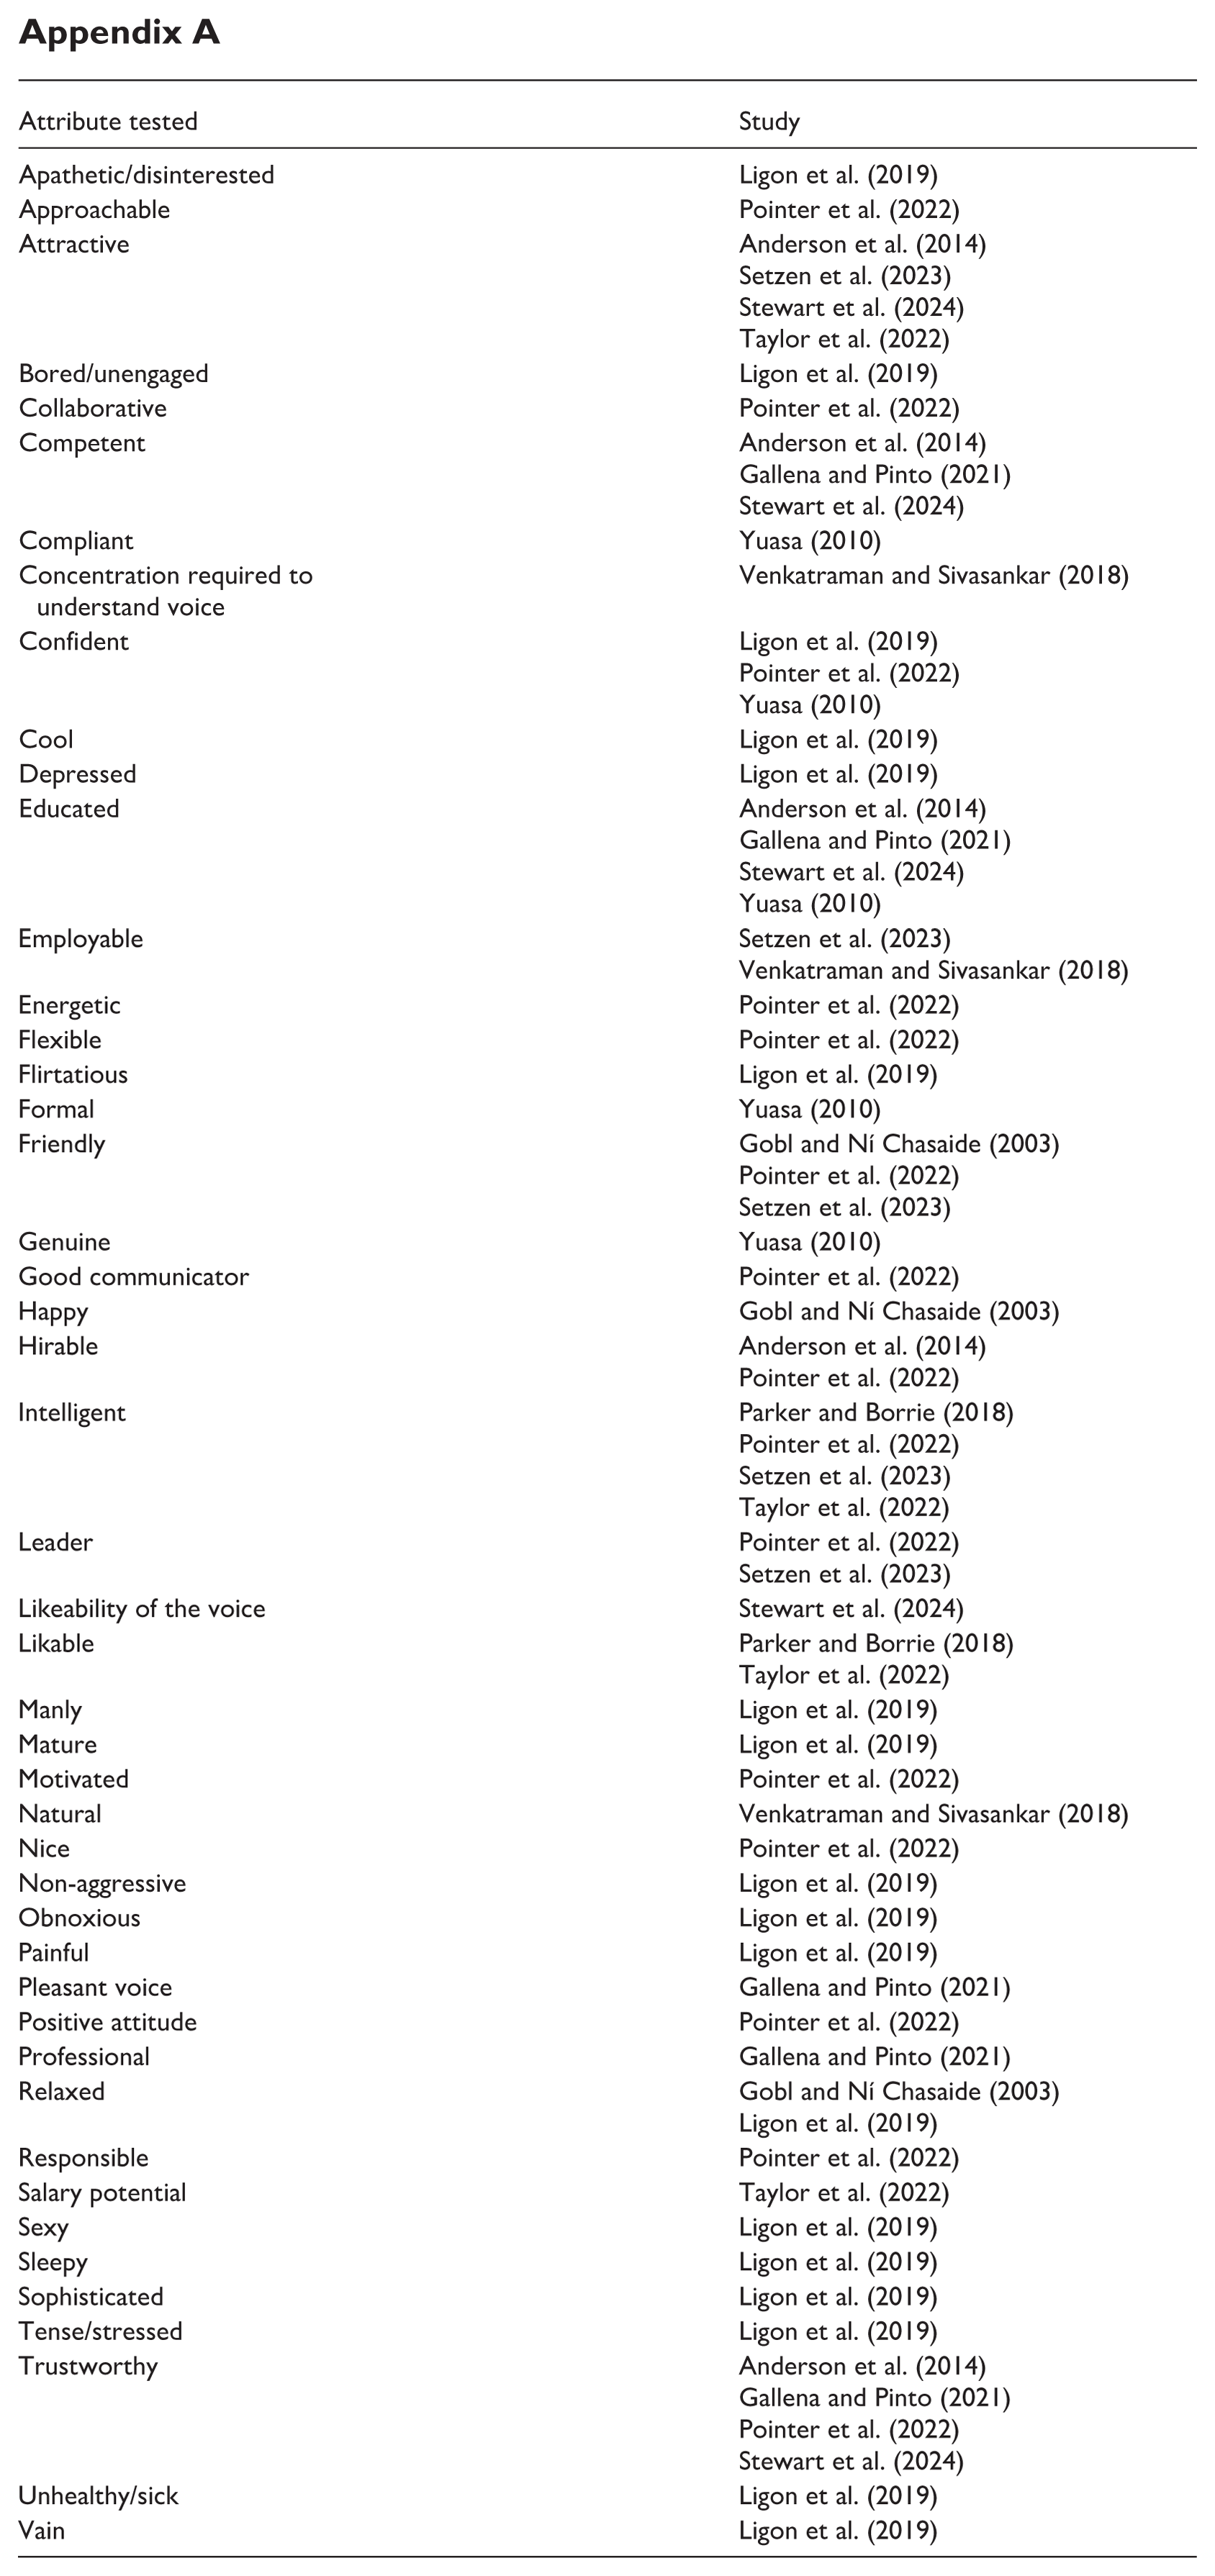
In addition to investigating the discursive meanings of creaky voice, several studies have examined how the presence of creaky voicing affects listeners’ attitudes toward speakers of U.S. English. These studies have typically asked listeners to either rate a single voice sample along a scale or to pick which of two voice samples is more or less of some attribute (e.g., pleasant; see Appendix A for a full list of attributes tested). In the current study, we focus on two attributes that have been previously used: hirability and pleasantness. The terms hirable and pleasant were selected in part to allow direct comparison with the results of Anderson et al. (2014) and Gallena and Pinto (2021), who found that utterances with creaky voice produced by young women were rated as less hirable and less pleasant than those that did not contain creaky voice, respectively.
The term hirable was chosen for several additional reasons. First, a recent study suggesting more negative perceptions of hirability for speech with creaky voice (Gallena & Pinto, 2021) received 41 responses on the social media platform X (previously known as Twitter; SIGPerspectives, 2021) objecting to the conclusions of the study, as well as a peer-reviewed response paper by Winn et al. (2022), who outline how criticism of creaky voice is a proxy for discrimination due to the voice quality’s social indexicality of a particular group of speakers. Second, the implication that women who use creaky voices are perceived as less hirable is particularly relevant in an economy where women continue to earn less than men (Fry & Aragão, 2025). Indeed, several studies and media pieces recommend that young women eliminate creaky voice from their speech to increase employment potential (Anderson et al., 2014; Chappelow, 2012; Gallena & Pinto, 2021; Hageman, 2013; Khazan, 2014; Mo, 2016; Mozo, 2021; Pointer et al., 2022; Rhodan, 2014; Sullivan, 2014). Due to the relatively high level of publicity and negative implications of studies examining hirability ratings of young women’s use of creaky voice, we believe it is an important attribute to include in our reconsideration of listener evaluations of creaky voice in this population.
It is worth noting that numerous other terms related to hirability and likelihood of job success have been examined. For example, women’s speech with creaky voice has been rated as sounding less competent (Anderson et al., 2014; Gallena & Pinto, 2021; Stewart et al., 2024), less employable (Venkatraman & Sivasankar, 2018), less hirable (Anderson et al., 2014; Gallena & Pinto, 2021; Pointer et al., 2022), less professional (Gallena & Pinto, 2021), and as having less salary potential (Taylor et al., 2022) than when their speech does not contain creaky voice. Several studies have also investigated how creaky voice is evaluated on other hirability-related attributes, including a study devoted entirely to hirability attributes (Pointer et al., 2022). Women’s speech samples that contained creaky voice were rated as less educated (Anderson et al., 2014; Gallena & Pinto, 2021; Ligon et al., 2019; Stewart et al., 2024), less intelligent (Pointer et al., 2022; Setzen et al., 2023; Taylor et al., 2022), and less trustworthy (Anderson et al., 2014; Pointer et al., 2022) than speech without creaky voice. One exception to these negative evaluations of creaky voice is Yuasa’s (2010) study, in which listeners rated a woman’s creaky speech as sounding more educated and career-oriented than speech without creaky voice. The author posited that this finding may be due to the perceptual similarity between creaky voice and the average F0 of men’s voices. In response to this publication, media outlets pushed back against the idea that creaky voice could be advantageous for young women in the workplace (Carney, 2012; Chappelow, 2012; Saunders, 2013). Yuasa’s (2010) article and subsequent media responses were motivation for the focus on hirability ratings in Anderson et al. (2014) and hirability has since become a frequent attribute for perceptual evaluation studies.
Whereas studies related to hirability ask listeners to judge something about the person who produced the utterances, other studies have used terms that focus directly on how the voice sounds. Given unfavorable descriptions of creaky voice such as “grating” (Gallena & Pinto, 2021), a “gutteral growl” (Wolf, 2015), a “laconic tone” (Rhodan, 2014) and a “heinous habit” (Swannell, 2023), we were also interested in how listeners judged the sound of the voice without focusing on the person who had produced the utterance. We aim to reconsider how pleasant a voice sounds when creaky voice is spontaneously produced (not coached) and in a common utterance location. Therefore, the second attribute tested in the current study is how pleasant the voice sounds.
With regard to how a voice sounds, utterances containing creaky voice have been found to sound less pleasant (Gallena & Pinto, 2021), less well-liked (Stewart et al., 2024), less natural (Venkatraman & Sivasankar, 2018), and as requiring more listener effort (Venkatraman & Sivasankar, 2018). In Gallena and Pinto (2021), listeners were asked to “rate your opinion of the speaker’s voice” on a 5-point Likert-type scale from “very bothersome” to “very pleasant.” Stewart et al. (2024) asked listeners if they “like this voice.” Venkatraman and Sivasankar (2018) chose to examine perceived naturalness due to the use of creaky voice in the broader population, and to examine listener effort due to that measure’s use in a study of a disordered voice quality (Nagle & Eadie, 2012). Thus, in addition to being able to compare our results to previous studies that have examined pleasantness, this particular term was selected to allow one term that focuses on the person (hirable) and one that focuses on the sound of the voice (pleasant).
1.4. Methodology of Previous Studies
Many aspects of experimental design can alter how participants respond to a given task. Therefore, it is important to examine methodological choices from previous studies of ratings of young women’s creaky voice in U.S. English given the frequent assumption that negative evaluations of creaky voice are pervasive. Below, we discuss methodological decisions regarding the listener sample and the speech samples.
In terms of the listeners, the majority of previous studies on the perception of creaky voice have examined responses from listeners without examining socially conditioned groups within the listener pool, leaving open the possibility that variation in the listener pool meaningfully contributed to variation in listener responses. For example, whereas many studies have specified the ages of their participants (Gobl & Ní Chasaide, 2003; Parker & Borrie, 2018; Pointer et al., 2022; Stewart et al., 2024; Taylor et al., 2022; Venkatraman & Sivasankar, 2018; Yuasa, 2010), only two have explicitly examined the effect of age on evaluations of creaky voice (Anderson et al., 2014; Eckert, 2019). Considering age is particularly relevant when examining a highly enregistered linguistic variable such as creak, given that its social indexicality can differ across generations (Eckert, 2019). That is, a linguistic variable can carry different social meanings across generations due to the constant nature of language change. Eckert (2019) examined differences in listener ratings of authoritativeness between three sentences from three different podcasts. These sentences were produced by three different speakers, and varied by pitch range, word-initial glottal stops, and the location of creaky voice. She found that younger listeners rated the sentence with the smallest pitch range, the least amount of word-initial glottal stops, and creaky voice only at the end of the sentence as sounding less authoritative than the sentence with more of these features. In contrast, listeners who were 40 years old or older rated this sentence as sounding more authoritative. Eckert discussed her own findings in the context of evolving social meanings of linguistic features. In Anderson et al.’s (2014) study, older listeners rated creaky stimuli as sounding less competent than younger listeners did. Thus, the current study explicitly tests differences between younger and older listeners.
With respect to listener gender, most studies had an approximately even split between men and women, but only Anderson et al. (2014) explicitly investigated differences in voice quality evaluations between listener genders. In that study, women rated creaky voice stimuli more negatively than men. To our knowledge, no previous study on this topic has included gender diversity in its study design. This can lead to misinformed results if participants are categorized into groups they do not align with, which can mask meaningful variation between listener gender groups (for a fuller treatment of these issues, see Becker et al., 2022). Similar to the discussion above related to age, linguistic features do not necessarily carry the same meaning across gender groups, nor even within a single gender group (Calder & Steele, 2024; Eckert & Podesva, 2021). As such, it is critical that perceptual evaluation studies do not assume a single-gendered listening group or ignore differences across listener groups. The current study therefore examines differences across listener genders, including those outside of binary genders.
As mentioned in the previous paragraph, two studies have examined differences across listener groups, but none have examined individual differences within these groups. Given the frequent focus on women’s hirability in studies of the evaluation of women’s creaky voice, it is possible that listeners who have stronger traditional views of gender roles would rate women’s voices as less hirable than listeners with less traditional views of gender roles. To interrogate this relationship, the current study will collect listeners’ associations between gender and career concepts using both implicit and explicit measures (discussed in more detail in Section 1.5).
We now turn to the speech samples used in previous studies, which differed along several dimensions. One way in which these speech samples differed was in whether the creaky voice portions were spontaneously produced or the result of coaching. In some studies, researchers coached speakers on how to produce creaky voice and subsequently used this speech as stimuli (Anderson et al., 2014; Taylor et al., 2022; Venkatraman & Sivasankar, 2018). A benefit of using coached creaky voice is the ability to control the content of utterances, such as asking speakers to produce the same sentences with and without creaky voice. Unfortunately, this coaching strategy can introduce additional changes to the speech sample, such as exaggerated intonation contours, phoneme elongation, and unexpected vowel qualities (as noted by Davidson, 2021, regarding stimuli in Anderson et al., 2014). In contrast, many other studies examining the perception of creaky voice have used speech samples with spontaneously produced creak (Gallena & Pinto, 2021; Parker & Borrie, 2018; Pointer et al., 2022; Setzen et al., 2023; Stewart et al., 2024; Yuasa, 2010) to avoid these possible additional modifications to the speech samples. The current study follows these latter studies by using spontaneously produced creak.
A second way in which speech samples have differed across studies is in the amount of creak in both the creaky stimuli and the non-creaky stimuli. For example, the modal productions in Anderson et al. (2014) included creak, albeit in the expected locations (e.g., phrase-finally, as was also mentioned in Davidson, 2021). Gallena and Pinto (2021) only used spontaneously produced utterances with a boundary for utterances with less (<5.51%) versus more (>11.81%) creak. Pointer et al. (2022) coded the speech of three speakers as each having different amounts of creaky voice, though the number of syllables of creaky voice for the different categories was not specified. Studies have included stimuli produced with creaky voice spanning entire phrases, but discussed their findings within the context of any creak production (Anderson et al., 2014; Pointer et al., 2022), thus generalizing across different amounts of creak production. The current study uses stimuli with spontaneously produced creaky voice on the last syllable, a location where creaky voice is common in U.S. English.
A third way in which stimuli have varied is in the number of speakers used and whether the same speaker produced both creaky and modal stimuli. Yuasa (2010) used only two utterances from a single speaker, which makes the study’s findings difficult to generalize to a larger population. In contrast, other studies have included more speakers (32 in Gallena & Pinto, 2021; eight in Parker & Borrie, 2018; three in Pointer et al., 2022), but speakers were only included in either the creaky or modal categories, which confounds voice quality with other speaker-specific characteristics. In other words, a particular speaker who uses more creaky voice could also have other linguistic properties that are rated more negatively by the listeners (e.g., dialect, speaking rate), making the difference in listener ratings difficult to attribute to voice quality alone. The current study uses 10 speakers, each of whom produces both creaky and modal utterances.
1.5. Listener Associations Between Gender and Career Concepts
We would like to note here that the relationship that has been created between creaky voice and hirability is not inherent but instead relates to broader issues of women’s ability to conform to an idealized concept of a professional worker. We echo the sentiment expressed by Winn et al. (2022) that the enterprise of the work investigating the relationship between the amount of creak and perceived hirability may present as facilitating women’s employment, but it does not deviate from imposed standards. Critically, the lack of investigation into aspects of the listener further anonymizes who is making these evaluations and what the consequences of this social evaluation might be. Work on the listening subject (Inoue, 2003) has demonstrated the practice of individuals in a hegemonic group assigning social meaning to the language of a marginalized group, which often does not align with the meanings recognized within the marginalized group, across a variety of contexts. The white listening subject has been discussed in Flores and Rosa’s (2015) work on raciolinguistics as a way to describe the ideological positioning of a white listener evaluating the language of a nonwhite speaker along notions of appropriateness (often in a school setting). Similarly, Calder and Steele (2024) discuss the cisgender listening subject as an ideological positioning of a cisgender listener as the expected and primary audience from which evaluations of transgender individuals’ speech occur, especially regarding the relative success of conforming to what is believed to be gender-appropriate use of language features. As described in Inoue’s (2003) analysis of Japanese male intellectuals’ criticisms of schoolgirls’ speech, here too the listener may be negatively evaluating the speech of young women as a way to maintain social order. Therefore, we include a task in the current study that probes listeners’ associations between gender and career concepts to interrogate the supposed relationship between young women’s creaky voice production and their perceived hirability. That is, the substantial focus on the employment ramifications of using creaky voice for young women has left a wide gap in critically examining the possibility that listeners with negative evaluations of women’s use of creaky voice are those who also have negative evaluations of women in the workforce.
There are several ways that researchers can probe participants’ attitudes toward different populations. One well-examined method is the Implicit Association Test (IAT; Greenwald et al., 1998). In this test, participants sort words into categories as quickly as possible. Target-concepts (e.g., male names, female names) and categories (e.g., career words, family words) are paired in a combination that is considered congruent according to traditional expectations (e.g., female and family) and one that is considered incongruent (e.g., female and career). The difference in reaction time between the congruent and incongruent trials is used as a proxy for measuring implicit associations. Examining associations of social groups can also be done through explicit questionnaires of the same concepts. Correlations between implicit and explicit association tasks suggest that they measure related, but distinct processes (Hofmann et al., 2005; Nosek & Smyth, 2007). Specifically, the IAT is thought to measure automatic associations, whereas an explicit questionnaire is thought to measure deliberate associations. The current study includes measures of both implicit and explicit associations between gender and career concepts to examine the extent to which these individual differences impact perceptions of creaky voice.
1.6. The Current Study
The current study investigates the extent to which negative evaluations of creaky voice produced by young women holds across multiple listener groups. To probe the relationship between listener characteristics and evaluations of creaky voice, the current study includes multiple listener gender groups (women, men, nonbinary), younger and older listeners, and measures related to listeners’ gender-career associations (using both an implicit association task and explicit questions). Association tasks between gender and career concepts were included due to the frequency with which previous studies have asked for hirability ratings of speech samples.
Given the previous findings of Anderson et al. (2014), we hypothesize that women listeners will rate sentences with creak more negatively than modal stimuli. In addition to women and men listeners, nonbinary listeners were included with the goal of expanding the possibility of capturing meaningful variation across listener gender groups. We also hypothesize that older listeners will rate creaky stimuli more negatively than modal stimuli due to previous findings showing this directionality in ratings (Anderson et al., 2014; Eckert, 2019). Given these two hypotheses, we expect that a combination (namely older women listeners) would show even stronger negative ratings for creaky productions compared with modal productions. Finally, we hypothesize that listeners with stronger (more traditional) associations between gender and career concepts will show more negative listener ratings overall for both hirable and pleasant rating scales due to the narrower societal positioning of women implicated by stronger implicit association scores.
Based on the range of studies that have examined listeners’ ratings of speech with creaky voice, the following decisions regarding the speech stimuli were made in the current study. First, we use stimuli with spontaneously produced creaky voice rather than coached speech, out of concern for other acoustic changes that could result from coached productions. Indeed, spontaneously produced creaky voice has been used in several of the studies mentioned above (Gallena & Pinto, 2021; Parker & Borrie, 2018; Pointer et al., 2022; Setzen et al., 2023; Stewart et al., 2024; Yuasa, 2010). Second, rather than selecting stimuli with more versus less creak, the stimuli used here include creaky voice only on the final syllable of the sentence, 4 the most common location for creaky voice in U.S. English (Abdelli-Beruh et al., 2013, 2016; Kreiman, 1982; Redi & Shattuck-Hufnagel, 2001; Wolk et al., 2012). Furthermore, the current study includes 10 speakers who produce multiple sentences in both the modal and creaky conditions. Because the stimuli used here are spontaneously produced (not coached) and occur in an expected utterance position in U.S. English (phrase-final), this study provides a strong test of attitudes toward productions containing creaky voice.
Prior to the rating experiment (Experiment 2), we first conducted a stimulus selection experiment (Experiment 1) to ensure that inexperienced listeners could perceive the presence of creaky voice when explicitly asked to do so, thus reducing the possibility that listeners in Experiment 2 were rating sentences in which they could not have reasonably perceived creaky voice. First, we present the methods and results of the stimuli selection experiment, followed by the methods and results of the rating experiment.
2. Experiment 1: Stimulus selection
2.1. Methods
2.1.1. Listeners
Twenty-seven participants aged 18–30 were recruited through Prolific (2014) and paid $10 for their participation. All participants provided informed consent and the study was approved by the Institutional Review Board at New York University. Seven participants were excluded from the analysis for failing the headphone screener (n = 5) (Woods et al., 2017) or having a history of a speech or hearing disorder 5 (n = 2), leaving 20 participants (12 women, 7 men, 1 nonbinary person) for data analysis. These remaining participants were all native speakers of U.S. English.
2.1.2. Stimuli
The stimuli were selected from a previously collected database in the lab. Ten cisgender women who were native speakers of U.S. English were selected. Cisgender women were selected for closer comparison to previous studies. 6 All speakers were aged 18–31 and had no history of smoking. Seven speakers self-reported their race as white, two as Asian, and one as more than one race. Speakers produced 100 low-predictability sentences (e.g., I’m glad you called to talk about the log) from the Speech Perception in Noise test (SPIN; Kalikow et al., 1977). Low-predictability sentences were chosen to reduce any potential rating biases related to the semantic content of the sentences. The first author and a trained research assistant listened to each sentence and indicated whether creaky voice was present on the final syllable, based on both auditory and visual inspection in Praat (Boersma & Weenink, 2025; see Figures 1 and 2). Auditory cues for identifying creaky voice included the perception of “popping corn” (Moser, 1942), low pitch, and distinct pulses of the voice. Visual cues included widely spaced glottal pulses in the spectrogram, irregular F0 tracking in the spectrogram, double pulsing in the waveform, and/or aperiodicity in the waveform. Some combination of auditory and visual cues was present for stimuli marked as containing creaky voice, because not all instances of creaky voice contain all features (Keating et al., 2015). All instances of disagreement of stimulus type (creak, no creak) between the two coders underwent discussion until agreement was met for all stimuli.
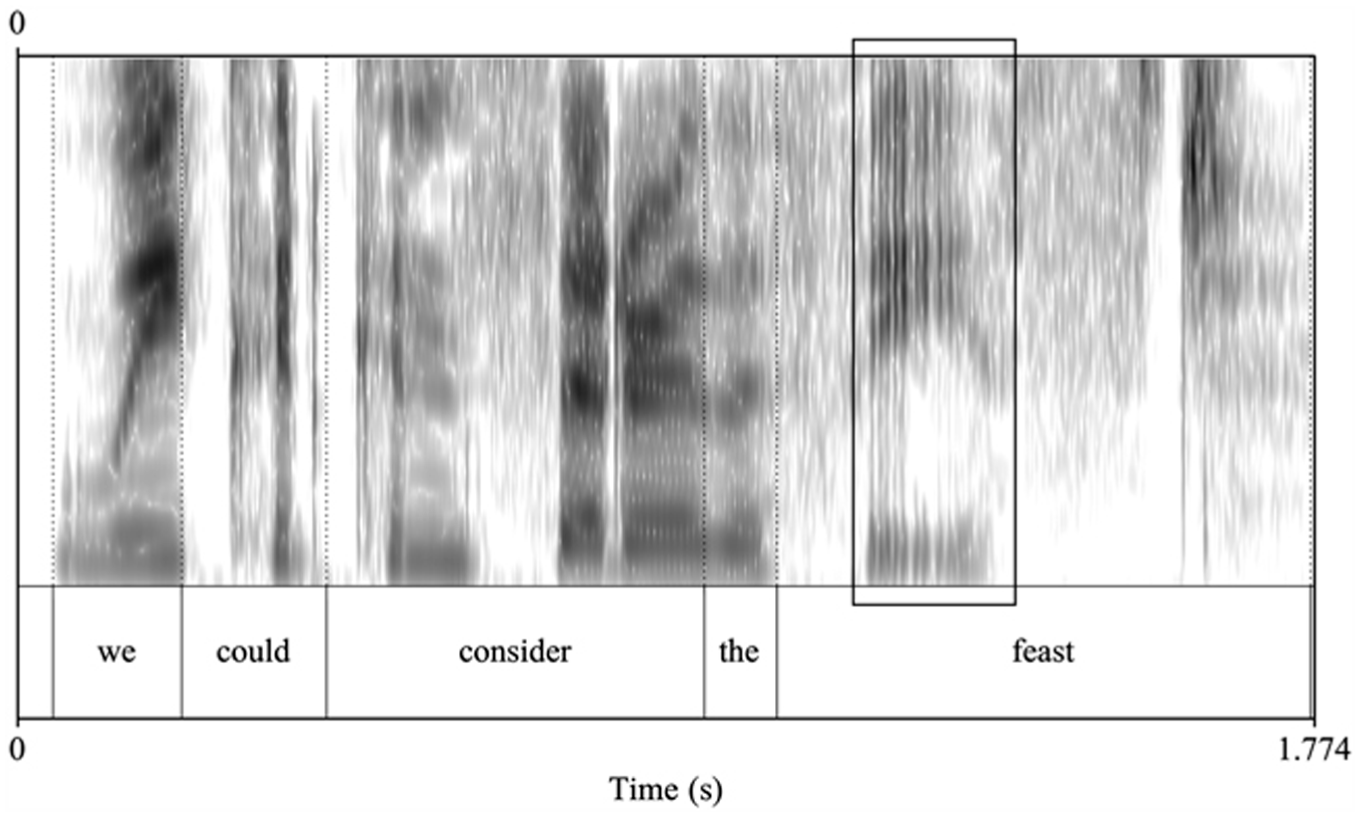
Example stimulus from Speaker 216 (we could consider the feast) containing creaky voice on the sonorant portion of the final syllable (indicated with overlaid box).
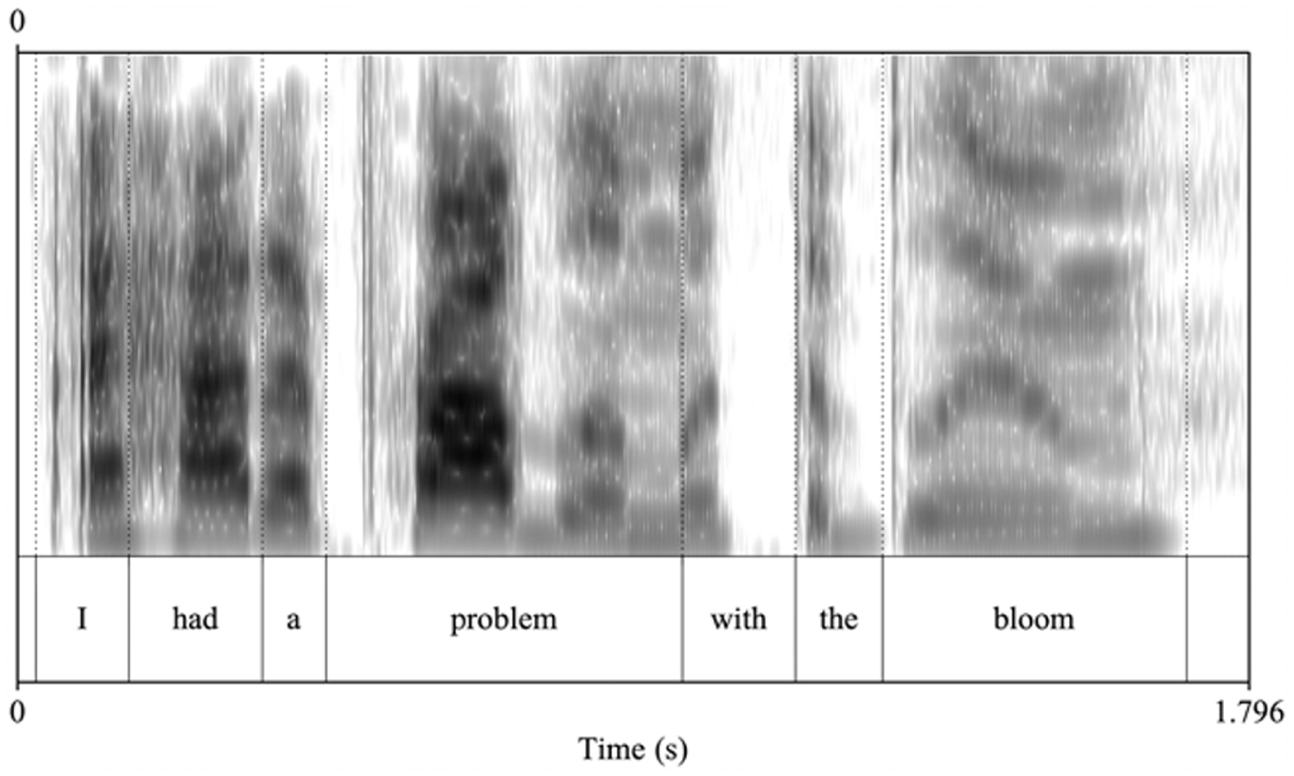
Example stimulus from Speaker 216 (I had a problem with the bloom) not containing creaky voice on the final word (indicated with overlaid box).
For each of the 10 speakers, a minimum of 10 sentences were selected with and without creaky voice for a total of 213 sentences. Of these, 114 sentences contained creaky voice on the last syllable of the sentence. 7 No creaky voice was present in the modal stimuli.
2.1.3. Procedure and Analysis
The experiment was created and hosted on Gorilla Experiment Builder (www.gorilla.sc) (Anwyl-Irvine et al., 2020). To familiarize the participants with the two voice qualities, participants first listened to three example sentences with spontaneous creak on the last syllable and three without creak and were explicitly told which sentences contained creaky voice. They were allowed to listen to these sentences as many times as they wished during this familiarization portion. Then, listeners completed 10 practice trials (half with creaky voice and half without) with feedback. Items were presented in random order and were produced by a different speaker from those in the experimental blocks. In the experimental portion, listeners were presented with sentences (blocked by speaker) in random order and asked to determine if the sentence contained creaky voice. In the experimental portion, listeners were only allowed to listen to the sentences once. The entire experiment took approximately 20 minutes to complete.
Listener identification of the presence or absence of creaky voice in a sound file was compared with the researchers’ identification of the presence or absence of creaky voice. Accuracy of voice quality identification was calculated as 1 = correct and 0 = incorrect for each sentence for all listeners. Mean accuracy and standard deviation per sound file across all listeners were calculated.
2.2. Results and Discussion
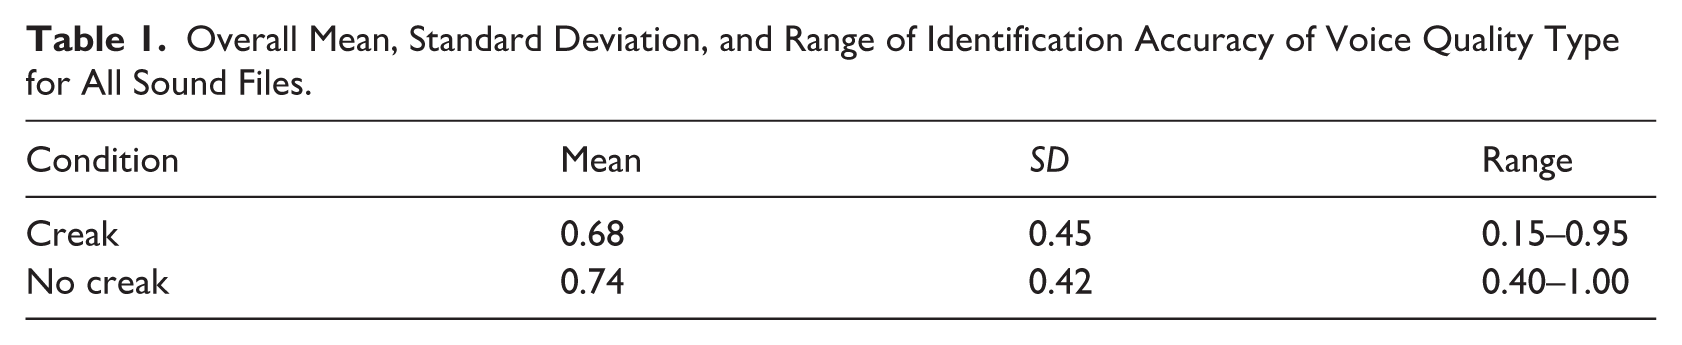
Mean accuracy of voice quality identification across all listeners was above chance (0.5) for both types of stimuli (Table 1). The distribution of identification accuracy was not normal as determined by a Shapiro–Wilk normality test (W = 0.94, p-value = .033). A Wilcox signed-rank test between the means of identification accuracy of the two voice qualities revealed significantly higher identification accuracy for stimuli without creak than for stimuli with creak (V = 29, p = .003).
Overall Mean, Standard Deviation, and Range of Identification Accuracy of Voice Quality Type for All Sound Files.
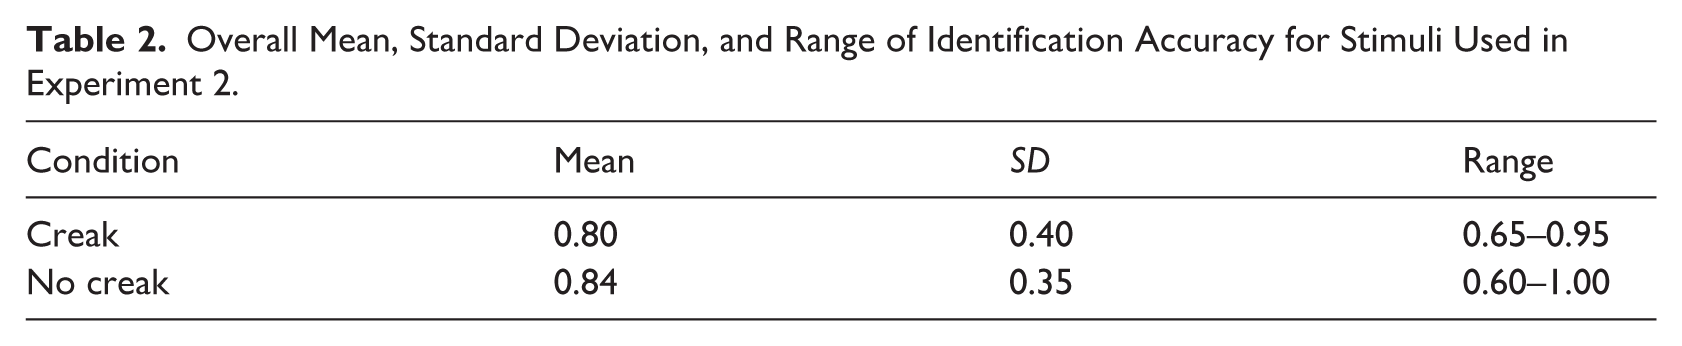
The four sentences per speaker with the highest average listener accuracy for each of the two voice quality conditions (creak, no creak) were selected for use in Experiment 2. Descriptive statistics related to this subset of items are presented in Table 2. Identification accuracy for this subset of sentences was not normally distributed (Shapiro–Wilk normality test, W = 0.88, p-value = .001). The item-level response accuracy averaged across all listeners is presented in Appendix C. A Wilcox signed-rank test did not show a significant difference in accuracy between the two voice quality conditions (V = 43.5, p-value = .361).
Overall Mean, Standard Deviation, and Range of Identification Accuracy for Stimuli Used in Experiment 2.
3. Experiment 2: Attribute ratings
3.1. Methods
3.1.1. Listeners
Five groups of participants were recruited through Prolific (see Table 3). Participants were paid $10 for their participation. All participants provided informed consent and the study was approved by the Institutional Review Board at New York University. Fourteen participants were excluded from the analysis for failing the headphone screener (n = 6) (Woods et al., 2017), having a history of a speech or hearing disorder 8 (n = 7), or having extreme reaction times on the IAT (n = 1; see Appendix B for details), leaving 104 for data analysis. These remaining participants were all native speakers of U.S. English. Two age groups (18–31 and 50–60) were recruited using screeners in Prolific for direct comparison to the youngest and oldest age groups in Anderson et al.’s (2014) study. Three gender groups were recruited using screeners in Prolific (“woman”, “man”, and “non-binary”). Due to the limited number of older nonbinary users in Prolific at the time of data collection, this cell of Table 3 is empty.
Age and Gender Information for Listeners in Experiment 2.
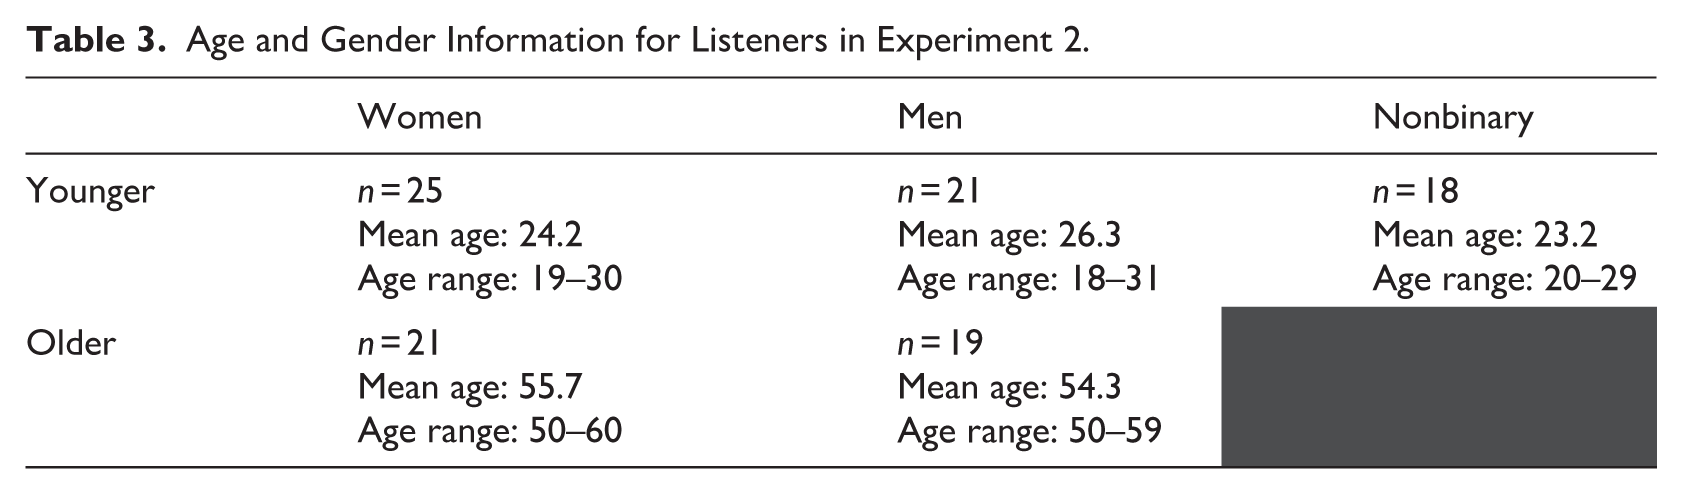
In a background survey, participants provided their gender in an open-response format. Using these responses, similar labels were aggregated to compare across groups (woman = F, female, woman; man = male, man; nonbinary = non-binary, nonbinary, genderqueer, none, nonbinary male, male/nonbinary). The nonbinary group comprises those who identify beyond the binary genders of woman and man. Neither cisgender/transgender status nor sex assigned at birth was asked of participants.
3.1.2. Stimuli
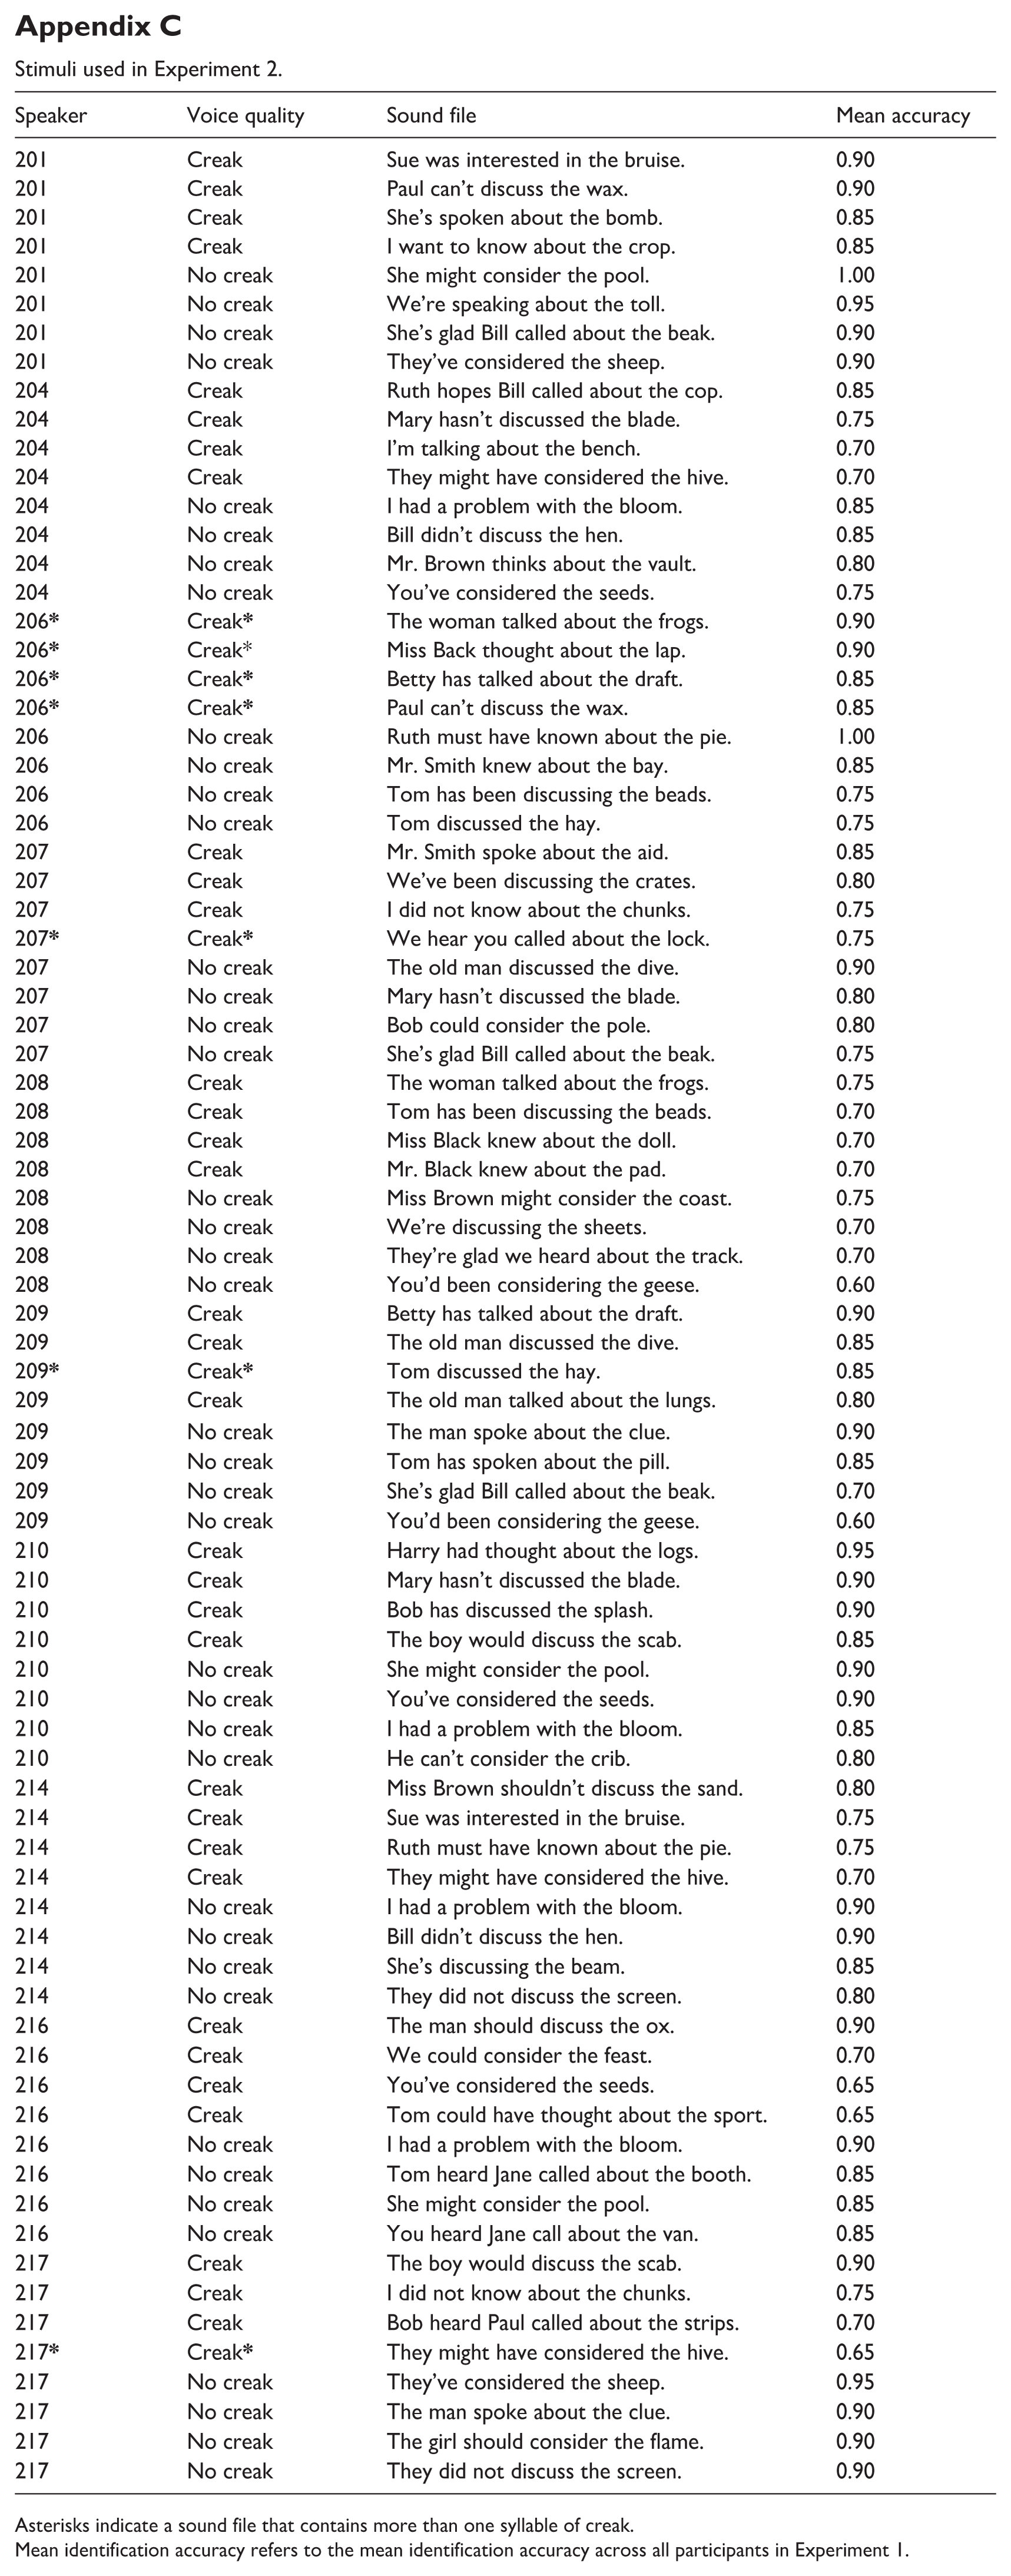
The 80 sentences (4 sentences × 2 voice quality conditions × 10 speakers) with the highest accuracy from Experiment 1 were used in Experiment 2. After data collection, a check of the creaky voice sentences revealed creaky voice on additional syllables earlier in the sentence in 7 of the 40 creaky sentences. These are indicated with an asterisk in Appendix C. All other syllables in the creaky stimuli were modally produced. No creaky voice was present in the modal stimuli.
3.1.3. Procedure
Participants completed four experimental tasks: two attribute ratings, an IAT, and an explicit association questionnaire. The experiment was created and hosted on Gorilla. The entire experiment took approximately 20 min to complete.
For the two attribute rating tasks, stimuli were divided into two sets (A and B), evenly split among the speakers and the two voice quality conditions. For half of the participants, set A was presented with the hirable rating scale and set B with the pleasantness rating scale. For the other half of the participants, this was reversed. Within each rating scale, stimuli were presented in random order. The order of the rating blocks was counterbalanced across participants. On each trial, a center tick-mark was presented and participants moved the marker along a visual analog scale. The anchors on the scale were “not at all hirable/pleasant” and “very hirable/pleasant.” Placement along the visual analog scale was encoded numerically from 0 to 100 (respectively), but these numeric values were not visible to participants. Participants provided their response after the entire sound file had played. Sound files were only played once. For the hirable rating, participants were instructed to “rate these voices on how hirable they sound for a professional, corporate job.” For the pleasantness rating, participants were instructed to “rate these voices on how pleasant they sound.” For both attribute rating tasks, listeners were asked to “base your ratings on the person’s voice, not on what they are saying.”
Following the two attribute rating tasks, participants completed a Gender-Career IAT (Greenwald et al., 1998). Details for the procedure can be found in Appendix B. In brief, participants sorted male or female names (e.g., John, Ann) and career or family words (e.g., corporation, home). In congruent blocks, male names and career terms were mapped onto the same side of the screen, and in incongruent blocks, male names and family terms were mapped onto the same side of the screen. An individual’s IAT score was calculated as the difference between their average logged reaction times on incongruent and congruent trials. Thus, a more positive IAT score (longer reaction time) indicates a stronger association of more traditional gender roles between men and women.
Participants then answered two questions related to explicit gender associations, which were chosen based on their high correlation with the constructs tested in the preceding IAT (Hofmann et al., 2005). The questions asked the degree to which career and family were male or female. These were measured using a 7-point Likert-type scale, from strongly female to strongly male. For the career scale, a “strongly male” response was coded as “3”, and a “strongly female” response was coded as “−3”. For the family scale, a “strongly female” response was coded as “3”, and a “strongly male” response was coded as “−3”. Thus, for both gender-career association scores, more positive numbers indicate a stronger traditional gender-career association and more negative numbers indicate a weaker traditional gender-career association. Responses to these two questions were averaged for each participant.
3.1.4. Analysis
Due to the lack of an older nonbinary group, two distinct sets of analyses were conducted: one comparing age (younger, older) and gender (women, men) and a second comparing gender (women, men, nonbinary) only among the younger participants. First, ANOVAs were conducted to examine group differences in implicit and explicit association scores to determine if listener groups differed in their association scores (e.g., if older listeners had stronger traditional gender-career associations). This was done to ensure that including both listener group and association scores in the analyses would not explain the same variance.
Next, for the age by gender analysis, two sets of linear mixed-effects models (one for hirable, one for pleasant) were fit to the data using the lme4 package (Bates et al., 2015) in R (R Core Team, 2021). Three models were created with fixed effects for listener age (younger, older), listener gender (woman, man), voice quality (creak, no creak), and all two-way and three-way interactions. In addition, we included a fixed effect for block order (hirable-first/pleasant-first). The three models differed in which, if any, association measure was included (IAT, explicit association, or no association measure). These three models that differed in association measure were compared using the Bayesian Information Criterion (BIC; Schwarz, 1978) and the model with the lowest BIC was selected for analysis and interpretation, as this represents the best-fitting model. Models were created and compared in this way due to previous research demonstrating that the implicit and explicit measures are correlated (Hofmann et al., 2005; Nosek & Smyth, 2007) and to avoid having multiple predictors that potentially capture the same variance. These models also included random intercepts for the listener and item. Random slopes between voice quality condition and listener, as well as between listener groups (age, gender) and item, were not included in our models due to overfitting (Matuschek et al., 2017). All categorical fixed effects were sum-coded and the continuous predictor (association measures, if included) was scaled and centered. This model building process was conducted for each of the two attribute ratings: hirability and pleasantness.
Similarly, for the models of only the younger listeners, three models with fixed effects for listener gender (woman, man, nonbinary), voice quality (creak, no creak), and their interaction were created. The models also included order of attribute presentation (hirable-first/pleasant-first). The same comparison between the three models with different association measures (IAT, explicit association, none) was conducted and the model with the lowest BIC was selected for interpretation. This model building process was conducted for each of the two attribute ratings: hirability and pleasantness.
3.2. Results
3.2.1. Analysis of Listener Age (Younger, Older) and Gender (Woman, Man)
A two-way ANOVA was conducted for each association score (implicit, explicit) with listener age group (older, younger) and listener gender group (women, men) as between-subjects factors, as well as their interaction. For the implicit association scores, no significant effects of age, F(1, 82) = 2.71, p = .103; gender, F(1, 82) = 0.00, p = .958; or their interaction, F(1, 82) = 3.69, p = .058, were found. Descriptive statistics for the implicit association scores can be found in Table 4. This table includes information for the younger nonbinary group for ease of reference across analyses.
Implicit Association Scores by Listener Age (Younger, Older) and Gender (Women, Men, Nonbinary).
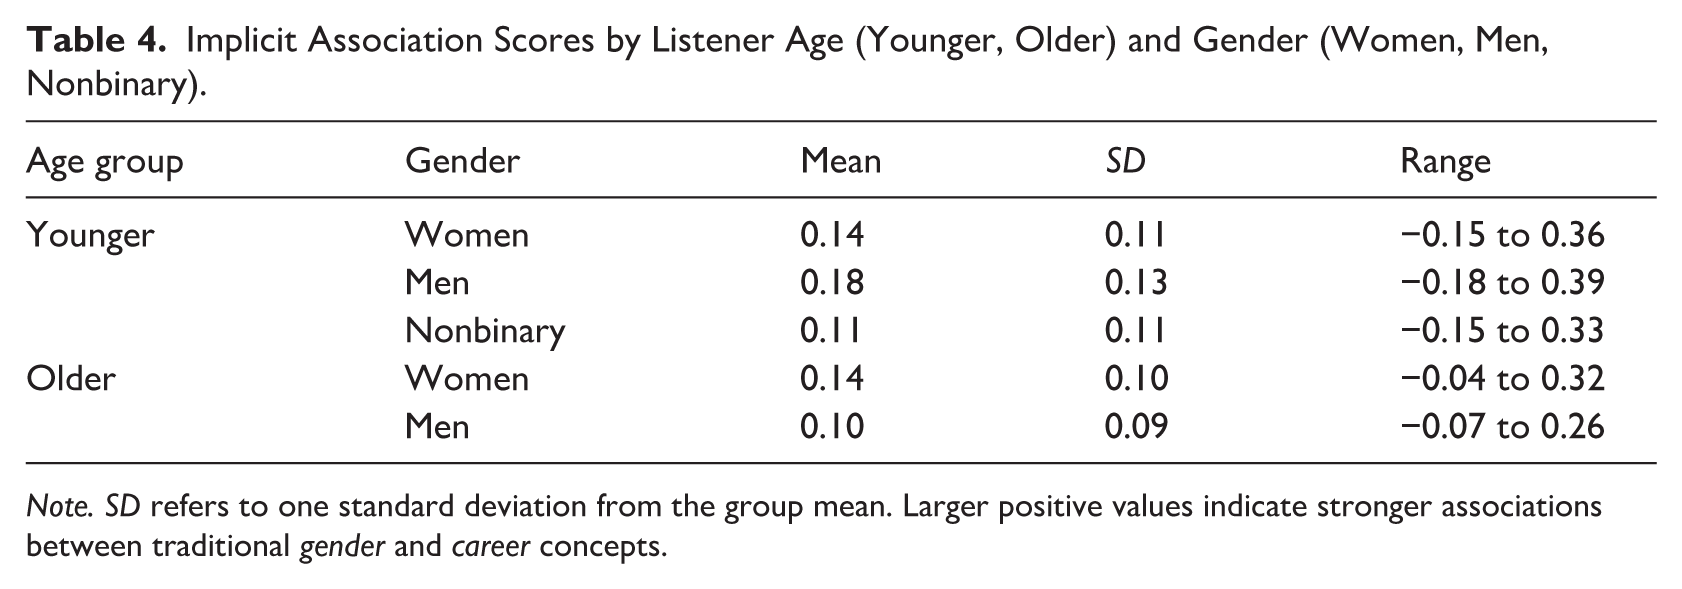
Note. SD refers to one standard deviation from the group mean. Larger positive values indicate stronger associations between traditional gender and career concepts.
Similarly, no significant effects were found for the explicit association scores: age, F(1, 82) = 1.46, p = .704; gender, F(1, 82) = .21, p = .652; or their interaction, F(1, 82) = 3.90, p = .052. Descriptive statistics for the explicit association scores can be found in Table 5. This table also includes information for the younger nonbinary group for ease of reference across analyses.
Explicit Association Scores by Listener Age (Younger, Older) and Gender (Women, Men, Nonbinary).
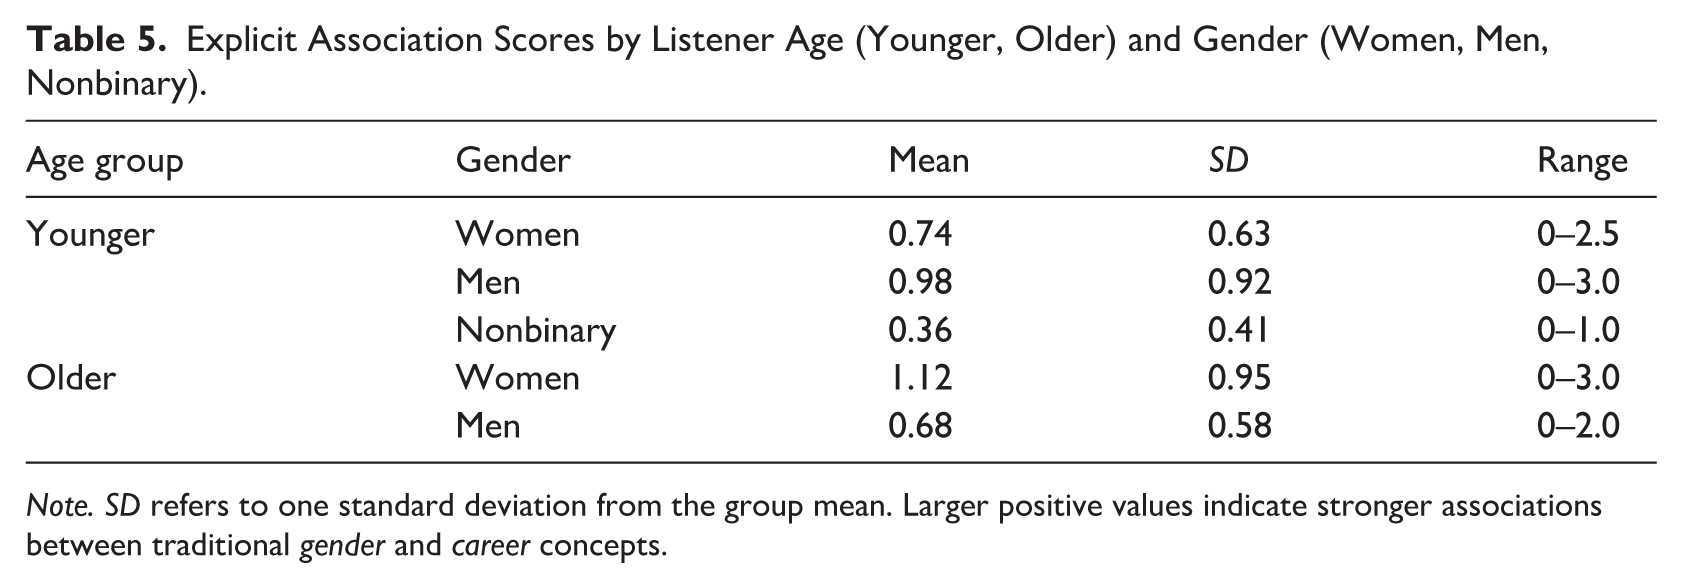
Note. SD refers to one standard deviation from the group mean. Larger positive values indicate stronger associations between traditional gender and career concepts.
For the three hirability models, the one with no association score had the lowest BIC value (implicit: 30,988.4, explicit: 30,976.8, no association score: 30,947.4) and was therefore selected as the model for analysis and interpretation. For this winning model, none of the predictors reached significance (all p > .05). The full output of the selected model can be found in Appendix D.
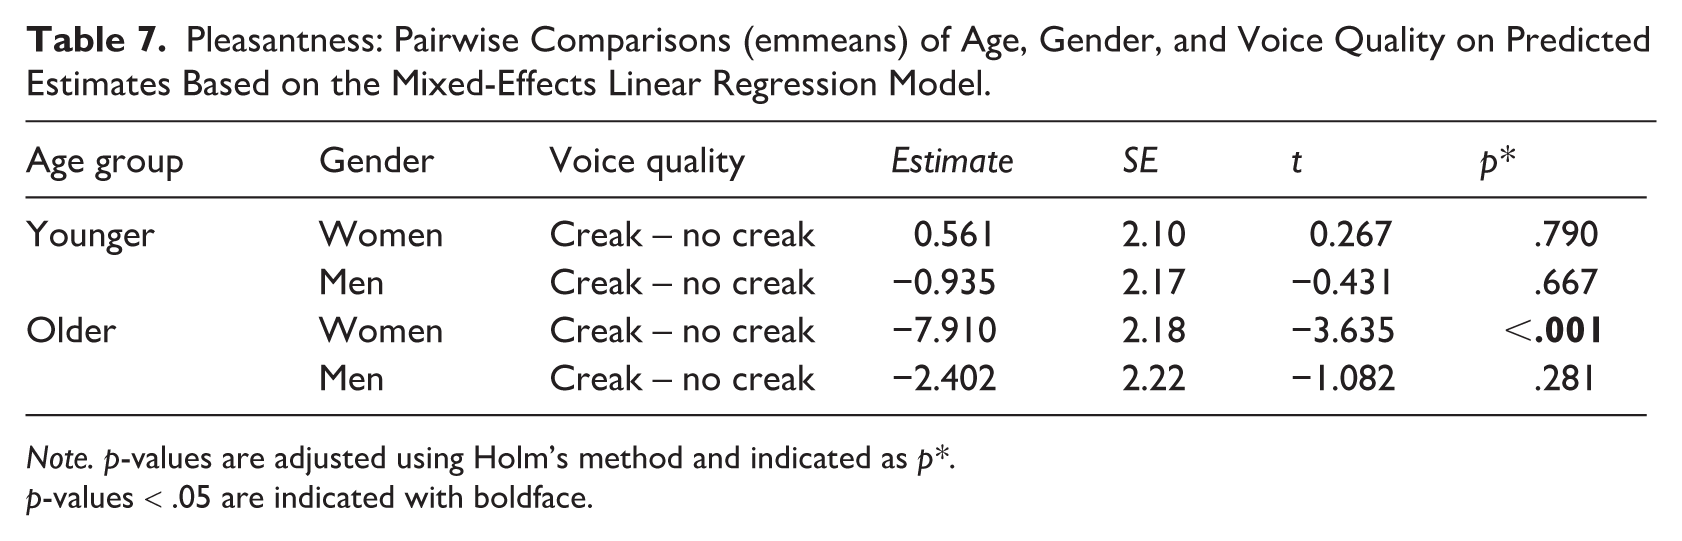
Similar to the hirability model, the pleasantness model without an association score had the lowest BIC (implicit: 30,869.2, explicit: 30,867.6, no association score: 30,842.9). This model revealed a significant interaction between voice quality and age (p < .001) and between voice quality, age, and gender (p = .011). No other effects reached significance. See Appendix D for the full model output. An emmeans analysis (Lenth, 2019) of the two-way interaction revealed that older listeners rated sentences with creaky voice as sounding less pleasant than those with modal voice, but younger listeners did not show significant differences based on voice quality (Table 6). Given the three-way interaction between voice quality, age, and gender, an additional emmeans analysis was conducted (see Table 7) which revealed that older women rated sentences with creaky voice as less pleasant (M = 49.1, SD = 27.1) than those with modal voice (M = 56.8, SD = 26.8), but the other groups of listeners (including older men) did not show differences based on voice quality. These data are visualized in Figure 3.
Pleasantness: Pairwise Comparisons (emmeans) of Age and Voice Quality on Predicted Estimates Based on the Mixed-Effects Linear Regression Model.
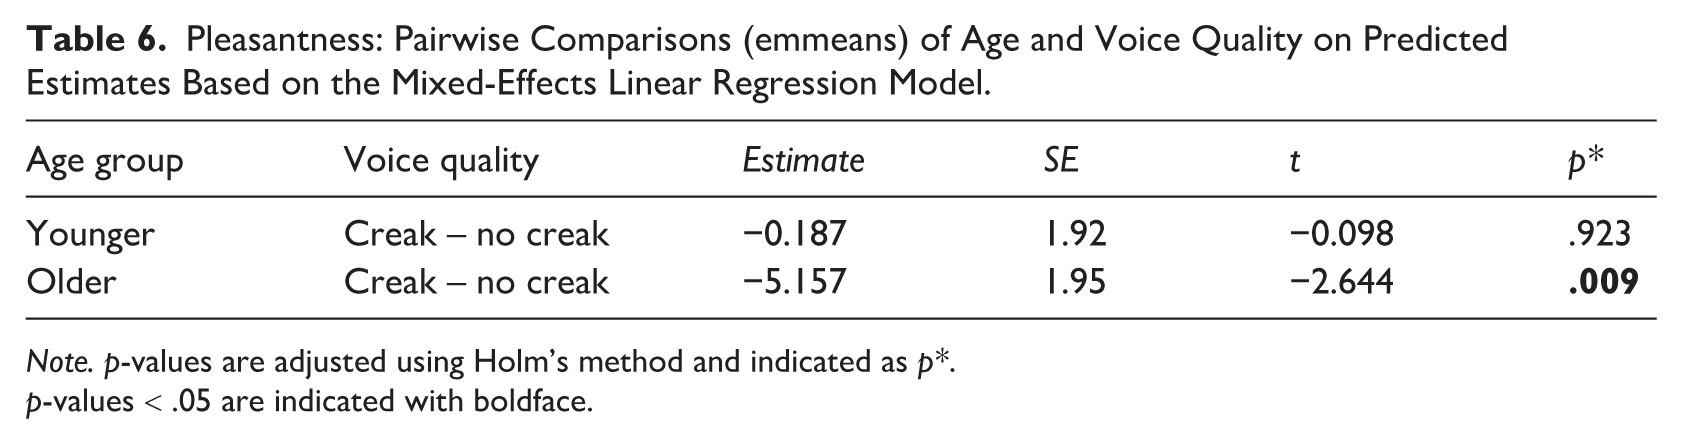
Note. p-values are adjusted using Holm’s method and indicated as p*.
p-values < .05 are indicated with boldface.
Pleasantness: Pairwise Comparisons (emmeans) of Age, Gender, and Voice Quality on Predicted Estimates Based on the Mixed-Effects Linear Regression Model.
Note. p-values are adjusted using Holm’s method and indicated as p*.
p-values < .05 are indicated with boldface.
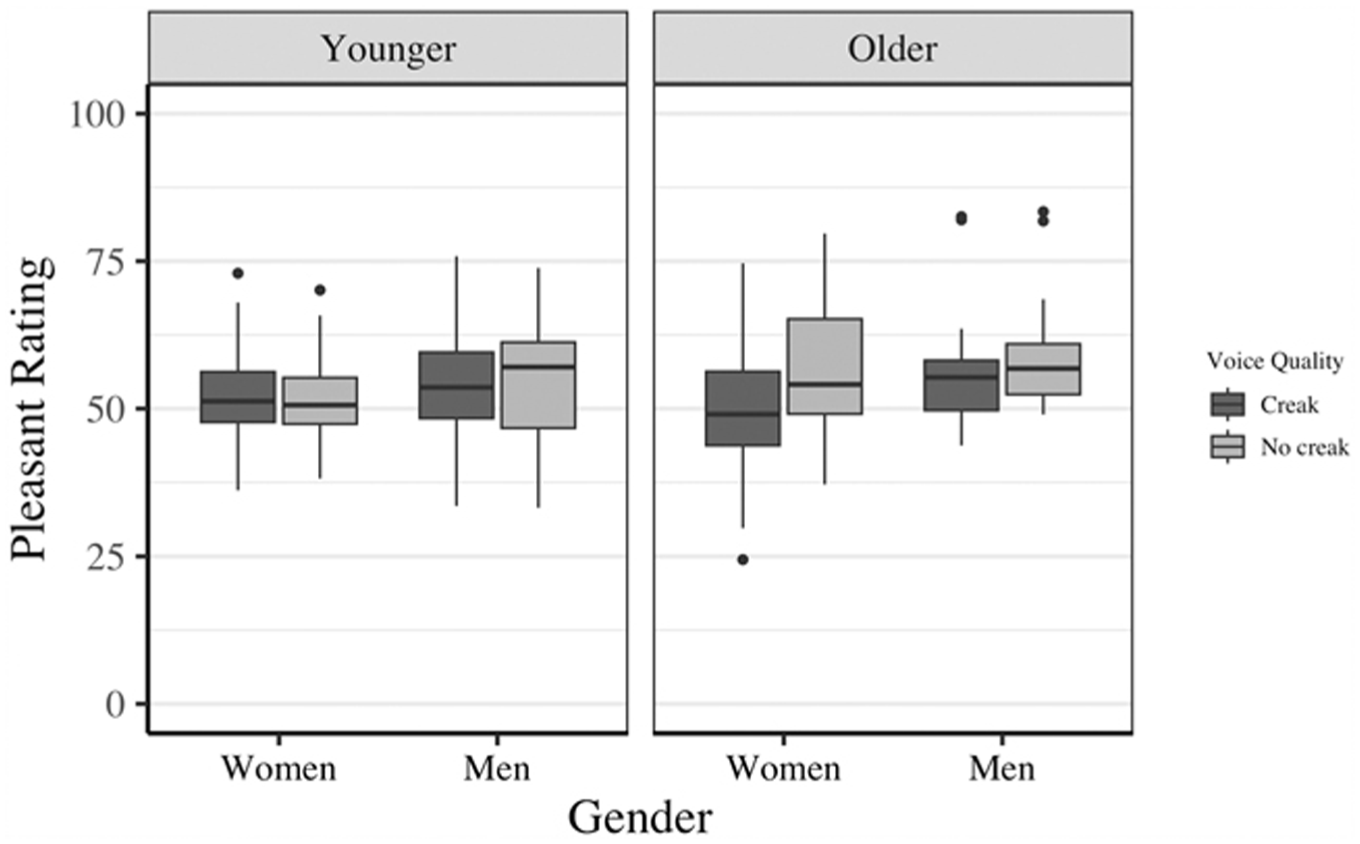
Boxplot of pleasantness ratings between voice quality and gender, faceted by age. On the y-axis, 0 indicates “not at all pleasant” and 100 indicates “very pleasant.”
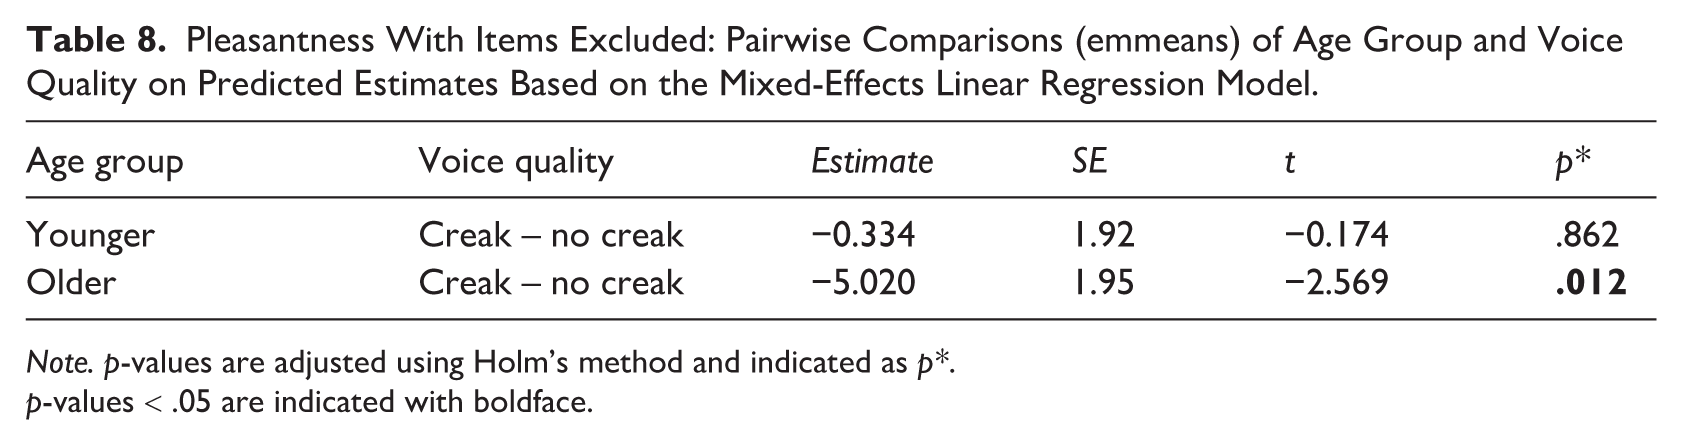
As mentioned in Section 3.1.2, 7 of the 40 creak stimuli had creaky voice on more than just the last syllable. As such, we reran these analyses without these seven items. The only difference was that in the pleasantness model, the three-way interaction between age, gender, and voice quality did not reach significance; however, the two-way interaction between voice quality and age group did. An emmeans analysis (Table 8) revealed the same pattern of results, with older listeners rating stimuli with creak as less pleasant (M = 52.6, SD = 23.8) than those without creak (M = 57.9, SD = 24.3) (p = .012). All other results from the hirability and pleasantness models with the seven items removed patterned the same as the models with all stimuli (Appendix D).
Pleasantness With Items Excluded: Pairwise Comparisons (emmeans) of Age Group and Voice Quality on Predicted Estimates Based on the Mixed-Effects Linear Regression Model.
Note. p-values are adjusted using Holm’s method and indicated as p*.
p-values < .05 are indicated with boldface.
As we predicted, there was no overall significant difference between the two voice qualities in either the hirability or pleasant tasks when creaky voice was limited to the final syllable of the sentence. Instead, these results indicate that listener groups differ in their attitudes (as measured by pleasantness and hirability ratings) toward speech with creaky voice. However, our prediction that older listeners and women listeners would rate creaky stimuli less favorably than modal stimuli was only found in the pleasantness model for older women listeners as an age and gender interaction when all stimuli were considered (including those that had creak on multiple syllables). When these items were removed, the effect of gender disappeared, possibly suggesting that longer durations of creaky voice were driving the effect of gender. A similar result was not found in the hirability model.
3.2.2. Analysis of Only Younger Listeners Across Gender (Woman, Man, Nonbinary)
A one-way ANOVA was conducted for each association score (implicit, explicit), with gender group (women, men, nonbinary) as a between-subjects variable for the younger listeners only. For the implicit association score, no effect of gender was found, F(2, 61) = 1.78, p = .177. Descriptive statistics for each listener group can be found in Table 4 above. For the explicit association scores, a significant effect of gender was found, F(2, 61) = 3.70, p = .026. A post hoc Tukey test revealed that the nonbinary listeners had lower scores (less strong gender-career associations) than the men (p = .020). The nonbinary group did not significantly differ from women (p = .188), nor did men and women significantly differ from each other (p = .485).
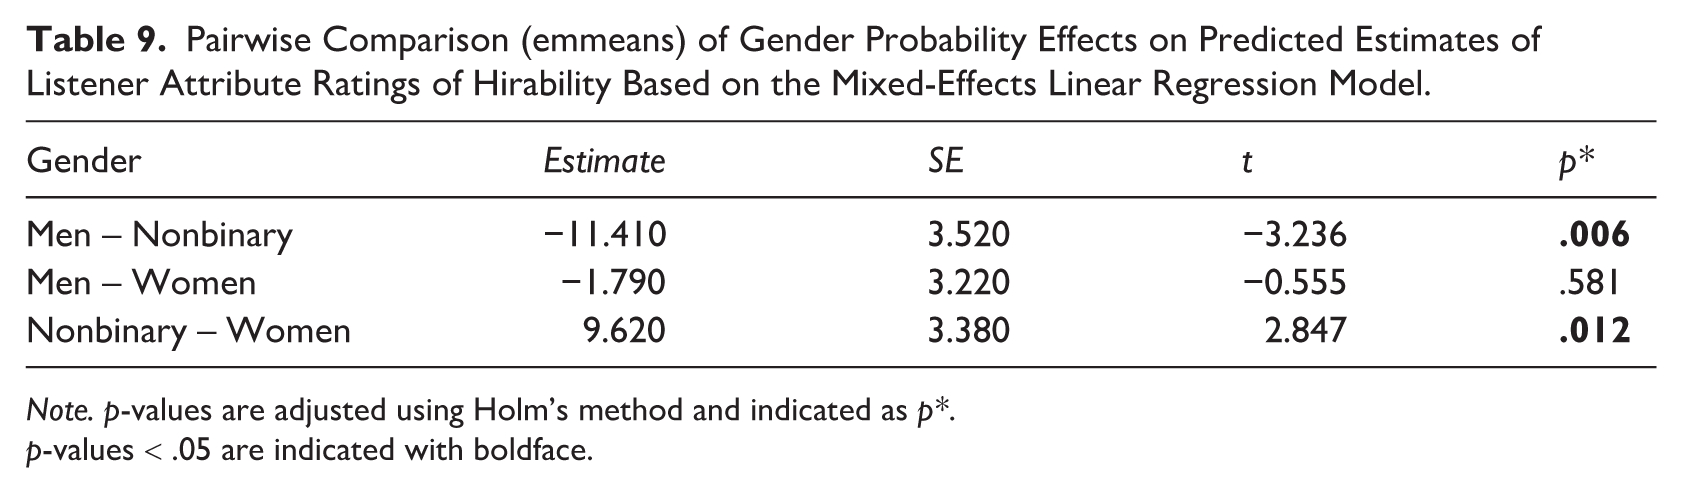
For the three hirability models, the one with no association score had the lowest BIC value (implicit: 22,693.7, explicit: 22,692.6, no association score: 22,665.5) and was therefore selected as the model for analysis and interpretation. For this winning model, there was only a significant effect of gender (p = .003). No other effects reached significance (all p > .05). See Appendix E for the full model output. An emmeans analysis (Lenth, 2019) of the gender effect revealed that younger nonbinary listeners rated stimuli as sounding more hirable regardless of voice quality condition (M = 67.9, SD = 22.7) than did younger women (M = 58.3, SD = 23.3) and younger men (M = 56.9, SD = 24.8), who did not differ from each other (see Table 9). This result is visualized in Figure 4.
Pairwise Comparison (emmeans) of Gender Probability Effects on Predicted Estimates of Listener Attribute Ratings of Hirability Based on the Mixed-Effects Linear Regression Model.
Note. p-values are adjusted using Holm’s method and indicated as p*.
p-values < .05 are indicated with boldface.
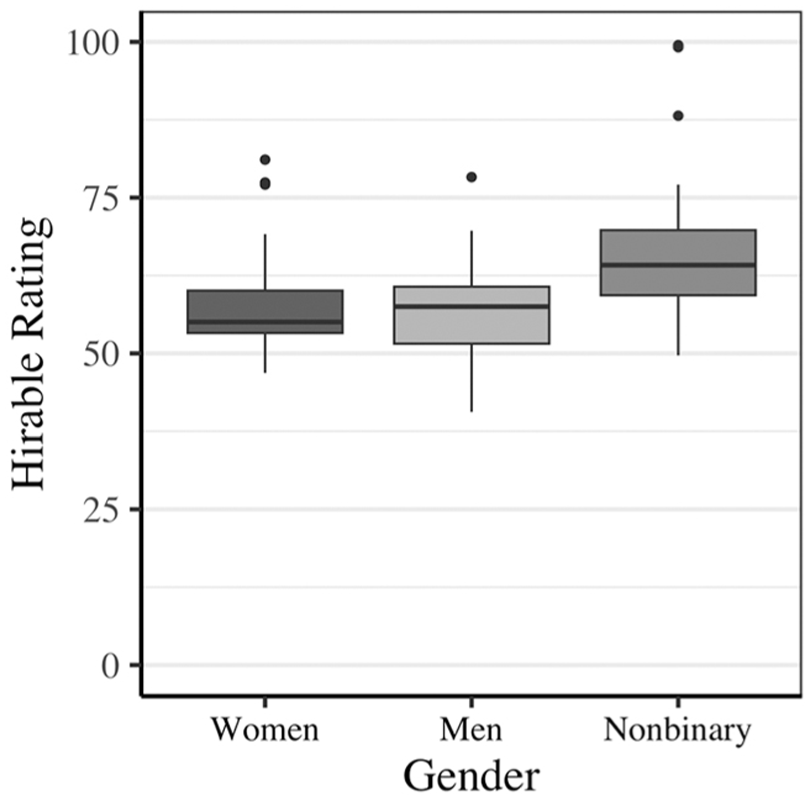
Boxplot of hirability ratings among three groups of younger listeners.
Similar to the hirability models, the pleasantness model without any association score had the lowest BIC (implicit: 22,610.5, explicit: 22,610.6, no association score: 22,586.0). No effects reached significance (all p > .05). See Appendix E for the full model output.
As in the set of models examining age (younger, older) and gender (women, men) groups, we conducted the same analyses of the three groups of younger listeners but with the seven items containing additional syllables with creaky voice removed. All results from the hirability and pleasantness models with the seven items removed patterned the same as the models with all stimuli (Appendix E).
As predicted, there was no overall significant difference between the two voice qualities for either the pleasantness or hirability rating tasks. Our prediction that women listeners would rate creaky sentences less favorably than modal sentences was not found in either the hirability or pleasantness model of the younger listeners.
4. General Discussion
The current study examined listener ratings of creaky voice produced by young women. Numerous studies have examined this topic and generally concluded that the use of creaky voice is more negatively perceived than modal voice, with one notable exception (Yuasa, 2010). The current study aimed to expand on this work by (1) using speech samples in which creaky voice was spontaneously produced and only appeared on the final syllable of the sentence, (2) examining potential listener differences by testing younger and older listeners, different genders, and by using individual difference measures of associations between gender and career concepts, and (3) using two different attributes (hirable, pleasant) to probe different types of voice perceptions: one that relates to a women’s employability and another related to the perceived sound of the voice.
Due to how stimuli in previous studies were selected (e.g., variable durations of creak, coached productions of creak), a primary goal of the current study was to examine the evaluation of spontaneously produced creaky voice in a common utterance location. Part of the motivation in looking at naturally produced creaky voice in this location was the implication in some previous studies that any amount of creaky voice could have negative consequences on a woman’s hirability (Anderson et al., 2014; Gallena & Pinto, 2021; Pointer et al., 2022). A key takeaway from our study was that, despite some variation between listener groups, there was no evidence for more negative evaluations of sentences with phrase-final creaky voice compared with sentences without creaky voice overall for either hirability or pleasantness ratings. This stands in contrast to other studies examining listener evaluations of young women’s creaky voice that found negative evaluations toward creaky voice more broadly (Anderson et al., 2014; Gallena & Pinto, 2021; Pointer et al., 2022; Setzen et al., 2023; Stewart et al., 2024; Taylor et al., 2022; Venkatraman & Sivasankar, 2018). Our finding provides evidence that not all creaky productions are perceived negatively; indeed, we found that when creaky voice is produced spontaneously over the final syllable of an utterance (an expected and linguistically relevant position), it may not negatively affect employment potential. Future research will be needed to examine whether this finding is due primarily to the location (phrase-final) or to the amount (one syllable) of creaky voice.
It is important to note that these null results are not due to listeners’ inability to detect creaky voice at the ends of utterances. Results from Experiment 1 demonstrated that inexperienced listeners, when provided with a brief training on creaky voice identification, were highly accurate at identifying the presence (80%) or absence (84%) of creaky voice on the last syllable of a sentence. Blomgren et al. (1998) found high voice quality identification accuracy for modal (95.5%) and creaky (100%) sustained vowels. The higher accuracy scores in Blomgren et al.’s (1998) study may be accounted for by the proportion of creak in the stimuli. That is, a sustained vowel produced entirely in one voice quality will have a higher proportion of that voice quality than a sentence with mostly one voice quality (modal) and a small amount of the other voice quality (creak), as in the current study. Decreased creak identification accuracy in a phrase-final position, as compared with creak that spans a whole phrase, has also been found in Davidson (2019b).
Turning to listener differences, we found that not all groups of listeners performed the same. In contrast to previous studies which have suggested that creaky voice is perceived more negatively than modal voice across all listeners, our findings suggest that only older men and women listeners have more negative evaluations with regard to pleasantness when creaky voice is on the final syllable of a sentence. This aligns with the results of Anderson et al. (2014), who found that older listeners rated speakers as sounding less competent when they produced sentences with creaky voice compared with sentences without, but this difference was not present for other rating scales that they tested. We propose that this difference between age groups in the current study, and perhaps in that of Anderson et al. (2014) as well, may be understood as an example of indexical obsolescence (Eckert, 2019), in which linguistic and social change among younger generations creates new linguistic meaning that differs from that of older generations. If creaky voice is being used in new ways by younger speakers, older listeners may not understand its newer indexical properties (e.g., a specific stance or persona) and instead perceive these voices as sounding less pleasant. We are unable to generalize our finding to all older listeners, as this study only tested older men and women. Nevertheless, this explanation does not fully account for our finding that when all stimuli were considered (including those seven with additional creaky voice), a three-way interaction emerged in which older women evaluated sentences with creaky voice more negatively than sentences without creaky voice. This suggests that sentences with more creaky voice may be more negatively evaluated by older women than older men. This finding also aligns with Anderson et al.’s (2014) study showing that women rated sentences with creaky voice less favorably than men overall. In the current study, however, this difference for age (and gender with the extended set of sentences) was only found for pleasantness and not for hirability. Because the sentences used in this study were produced by younger women, the more negative pleasantness evaluations may be a form of in-group distancing between younger and older women. Some studies have shown that an individual may distance themselves from others within their own group in an effort to pursue individual success (Derks et al., 2016; Ellemers et al., 2004; Garcia-Retamero & López-Zafra, 2006; Mathison, 1986; Van Veelen et al., 2020). However, we did not find evidence for older women rating sentences with creaky voice as sounding less hirable, which makes such an interpretation difficult to apply to all current results. It should also be noted that the median (and mean) ratings for both voice quality conditions for all listener groups were near 50 (center of the scales). Therefore, even when ratings for creaky voice stimuli are lower than modal stimuli, they are still near the middle of “not at all pleasant” and “very pleasant.” Due to the relatively small difference in ratings between voice quality conditions for only one of the rating scales and for only one of the five listener groups, we hesitate to strongly interpret this finding with any theoretical explanation or to be confident that this finding would hold in a larger sample of listeners. Finally, younger nonbinary listeners rated voices as sounding more hirable overall than younger women and younger men. It is worth noting that although the current study attempted to examine all combinations of listener gender and age, the study was limited by the lack of data from older nonbinary listeners and therefore cannot speak to gender differences beyond binary genders across age groups. Additional listener characteristics relevant to social group differences should be examined in future research. Future research examining listeners’ openness to different genders in the workforce could also help explain our findings.
Another listener difference to emerge was the finding that younger nonbinary listeners were generally more positive toward women’s hirability overall. Association tasks between gender and career concepts that were used in the current study cannot fully account for this result. That is, while the analyses of association scores between genders revealed that the nonbinary participants had significantly weaker associations between traditional gender and career roles than younger men (but not women), these scores were not predictive in the overall models for hirability and pleasantness ratings. If such associations predict evaluations of creaky voice, these were not captured by the association tasks used in the current study. It should also be noted that the association tasks used in the current study heavily rely on binary gendered assumptions. Binary gendered names presented to participants for a sorting task may not have sufficiently captured the gender associations of the participants in this study. An alternative explanation may be found in research that has found perceptual differences between gender expansive (including nonbinary) and non-gender-expansive listeners. Differences have been found in sibilant categorization (Hope & Lilley, 2023) and variably in the gender perception of voices (in Hope & Lilley, 2022, but not in Brown et al., 2021). Although we cannot directly compare the findings in the current study with these studies due to the lack of information regarding identification with the gender expansive community as well as cisgender or transgender status, we believe that our results are valuable evidence that participants outside of the (cis)gender binary should be included in perception studies examining gender groups. We encourage the inclusion of nonbinary listeners in perceptual studies to further contextualize this result and explore listener differences that go beyond binary genders.
5. Conclusion and Future Directions
The current study tested the extent to which sentence-final creaky voice is perceived more negatively than sentences with only modal voice by listeners who differed across age and gender. Results of this study do not show more negative ratings of productions with creaky voice across all listener groups. These results differ from several previous studies that have found more negative ratings of young women’s utterances with creaky voice than of utterances without creaky voice in U.S. English (Anderson et al., 2014; Gallena & Pinto, 2021; Pointer et al., 2022; Stewart et al., 2024; Taylor et al., 2022; Venkatraman & Sivasankar, 2018). It should be noted that the current study differs from these studies in a variety of ways, including location (phrase-final) and quantity (one syllable) of creaky voice. Unfortunately, it is not possible to determine whether our different findings are due to the location, quantity or a combination of both. Future work is needed to adjudicate between these possibilities. In addition, the current study only examined creaky voice produced by young, mostly white, women. Future studies are needed to probe how evaluations of creaky voice differ across speakers of different social groups and characteristics. Turning to the listeners, our results and those of Anderson et al. (2014) confirm the importance of examining listener characteristics in perceptual studies.
The current findings shift the narrative on evaluations of young women’s creaky voice from the speakers to the listeners who have (or do not have) negative evaluations of creaky voice in women’s speech. Given that social evaluations of women’s speech often serve to limit women’s freedom of linguistic expression, and perhaps even expression of authority, we again emphasize the importance of considering the listener in such studies (for a more in-depth discussion, see Chao & Bursten, 2021; Theodore, 2022; Winn et al., 2022). Further work will be needed to examine how listener characteristics (e.g., age, gender) impact perceptual evaluations of phrase-spanning creaky voice and speech produced across genders.
Footnotes
Appendix A
Appendix B
In Block 1, participants sorted five male names (John, Paul, Dan, Ben, Jeff) and five female names (Ann, Jane, Kate, Sue, Rose) into two categories. The names appeared in the center of the screen and the category labels appeared in the top left (“Male Names”) and right (“Female Names”) corners of the screen. All text in this block was presented in blue. Participants placed their index fingers on the “f” and “j” keys. Participants used their left finger to press the “f” key for the male names and used their right finger to press the “j” key for female names. To balance syllable length, the names Daniel, Jeffery, Rebecca, Michelle, Emily, and Julia from Greenwald et al. (1998) were replaced with Dan, Jeff, Rose, Kate, Sue, Jane, and Ann. Each name was presented once, for a total of 10 trials.
In Block 2, participants sorted five career words (business, salary, office, career, management) and five family words (marriage, family, parents, children, relatives) into two categories, similar to the name sorting in Block 1. The category labels “Career” and “Family” appeared in the top left and right corners of the screen, respectively. No items were changed from the Greenwald et al. (1998) experiment for this block; however, corporation, professional, wedding, and home were removed to maintain an equal number of words for the name and career categories. All text in this block was presented in green.
In Blocks 3 and 4, all four category labels appeared on the screen with “Male Names” and “Career” on the upper left and “Female Names” and “Family” on the upper right (i.e., the same locations as in Blocks 1 and 2). Due to findings that participants are faster at sorting words when categories are paired in this way, Blocks 3 and 4 are referred to as congruent (Nosek et al., 2002). Block 3 was a practice block, whereas Block 4 was a test block. Block 3 presented all 20 items once (20 trials) and Block 4 presented each item twice (40 trials).
Block 5 was a retraining block in which participants learned to categorize the gendered names on the other side, now with “Female Names” on the left side and “Male Names” on the right side. Only the gendered names appeared in this block. Each name was presented once. Following this retraining, participants completed Blocks 6 and 7 which contained each name and career and family word once (20 trials) and three times (60 trials), respectively. These last two blocks are referred to as incongruent, because the “Female Names” and “Career” labels were paired on the left side and the “Male Names” and “Family” labels were paired on the right side, in what is considered the less expected association (Nosek et al., 2002).
Participants were instructed to respond as quickly and accurately as possible. If they made an error, a red “X” appeared on the screen and they had to then enter the correct response. The screen would only progress when the participant pressed the correct key.
In the original design of the IAT, the order of presentation for the congruent and incongruent blocks is randomized across participants. Because the current study uses this task as a measurement of individual difference, not of distribution of these responses in the population, all participants were given the blocks in the same order (congruent followed by incongruent).
Following best practices for calculating IAT scores set out by Greenwald et al. (2003), participants with 10% or more of trials with reaction times less than 300 milliseconds (16 trials or more) were excluded from analysis. One participant was excluded following this guideline. No reaction times exceeded 10,000 milliseconds, so no trials were excluded for excessively long latencies (Greenwald et al., 2021). All remaining reaction times were log transformed for the analysis.
An individual’s IAT score was calculated as the difference between their average logged reaction times on incongruent (Blocks 7) and congruent trials (Block 4). Thus, a more positive IAT score (longer reaction time) indicates a stronger association with more traditional gender roles between men and women.
Appendix C
Stimuli used in Experiment 2.
| Speaker | Voice quality | Sound file | Mean accuracy |
|---|---|---|---|
| 201 | Creak | Sue was interested in the bruise. | 0.90 |
| 201 | Creak | Paul can’t discuss the wax. | 0.90 |
| 201 | Creak | She’s spoken about the bomb. | 0.85 |
| 201 | Creak | I want to know about the crop. | 0.85 |
| 201 | No creak | She might consider the pool. | 1.00 |
| 201 | No creak | We’re speaking about the toll. | 0.95 |
| 201 | No creak | She’s glad Bill called about the beak. | 0.90 |
| 201 | No creak | They’ve considered the sheep. | 0.90 |
| 204 | Creak | Ruth hopes Bill called about the cop. | 0.85 |
| 204 | Creak | Mary hasn’t discussed the blade. | 0.75 |
| 204 | Creak | I’m talking about the bench. | 0.70 |
| 204 | Creak | They might have considered the hive. | 0.70 |
| 204 | No creak | I had a problem with the bloom. | 0.85 |
| 204 | No creak | Bill didn’t discuss the hen. | 0.85 |
| 204 | No creak | Mr. Brown thinks about the vault. | 0.80 |
| 204 | No creak | You’ve considered the seeds. | 0.75 |
| 206 |
Creak |
The woman talked about the frogs. | 0.90 |
| 206 |
Creak* | Miss Back thought about the lap. | 0.90 |
| 206 |
Creak |
Betty has talked about the draft. | 0.85 |
| 206 |
Creak |
Paul can’t discuss the wax. | 0.85 |
| 206 | No creak | Ruth must have known about the pie. | 1.00 |
| 206 | No creak | Mr. Smith knew about the bay. | 0.85 |
| 206 | No creak | Tom has been discussing the beads. | 0.75 |
| 206 | No creak | Tom discussed the hay. | 0.75 |
| 207 | Creak | Mr. Smith spoke about the aid. | 0.85 |
| 207 | Creak | We’ve been discussing the crates. | 0.80 |
| 207 | Creak | I did not know about the chunks. | 0.75 |
| 207 |
Creak |
We hear you called about the lock. | 0.75 |
| 207 | No creak | The old man discussed the dive. | 0.90 |
| 207 | No creak | Mary hasn’t discussed the blade. | 0.80 |
| 207 | No creak | Bob could consider the pole. | 0.80 |
| 207 | No creak | She’s glad Bill called about the beak. | 0.75 |
| 208 | Creak | The woman talked about the frogs. | 0.75 |
| 208 | Creak | Tom has been discussing the beads. | 0.70 |
| 208 | Creak | Miss Black knew about the doll. | 0.70 |
| 208 | Creak | Mr. Black knew about the pad. | 0.70 |
| 208 | No creak | Miss Brown might consider the coast. | 0.75 |
| 208 | No creak | We’re discussing the sheets. | 0.70 |
| 208 | No creak | They’re glad we heard about the track. | 0.70 |
| 208 | No creak | You’d been considering the geese. | 0.60 |
| 209 | Creak | Betty has talked about the draft. | 0.90 |
| 209 | Creak | The old man discussed the dive. | 0.85 |
| 209 |
Creak |
Tom discussed the hay. | 0.85 |
| 209 | Creak | The old man talked about the lungs. | 0.80 |
| 209 | No creak | The man spoke about the clue. | 0.90 |
| 209 | No creak | Tom has spoken about the pill. | 0.85 |
| 209 | No creak | She’s glad Bill called about the beak. | 0.70 |
| 209 | No creak | You’d been considering the geese. | 0.60 |
| 210 | Creak | Harry had thought about the logs. | 0.95 |
| 210 | Creak | Mary hasn’t discussed the blade. | 0.90 |
| 210 | Creak | Bob has discussed the splash. | 0.90 |
| 210 | Creak | The boy would discuss the scab. | 0.85 |
| 210 | No creak | She might consider the pool. | 0.90 |
| 210 | No creak | You’ve considered the seeds. | 0.90 |
| 210 | No creak | I had a problem with the bloom. | 0.85 |
| 210 | No creak | He can’t consider the crib. | 0.80 |
| 214 | Creak | Miss Brown shouldn’t discuss the sand. | 0.80 |
| 214 | Creak | Sue was interested in the bruise. | 0.75 |
| 214 | Creak | Ruth must have known about the pie. | 0.75 |
| 214 | Creak | They might have considered the hive. | 0.70 |
| 214 | No creak | I had a problem with the bloom. | 0.90 |
| 214 | No creak | Bill didn’t discuss the hen. | 0.90 |
| 214 | No creak | She’s discussing the beam. | 0.85 |
| 214 | No creak | They did not discuss the screen. | 0.80 |
| 216 | Creak | The man should discuss the ox. | 0.90 |
| 216 | Creak | We could consider the feast. | 0.70 |
| 216 | Creak | You’ve considered the seeds. | 0.65 |
| 216 | Creak | Tom could have thought about the sport. | 0.65 |
| 216 | No creak | I had a problem with the bloom. | 0.90 |
| 216 | No creak | Tom heard Jane called about the booth. | 0.85 |
| 216 | No creak | She might consider the pool. | 0.85 |
| 216 | No creak | You heard Jane call about the van. | 0.85 |
| 217 | Creak | The boy would discuss the scab. | 0.90 |
| 217 | Creak | I did not know about the chunks. | 0.75 |
| 217 | Creak | Bob heard Paul called about the strips. | 0.70 |
| 217 |
Creak |
They might have considered the hive. | 0.65 |
| 217 | No creak | They’ve considered the sheep. | 0.95 |
| 217 | No creak | The man spoke about the clue. | 0.90 |
| 217 | No creak | The girl should consider the flame. | 0.90 |
| 217 | No creak | They did not discuss the screen. | 0.90 |
Asterisks indicate a sound file that contains more than one syllable of creak.
Mean identification accuracy refers to the mean identification accuracy across all participants in Experiment 1.
Appendix D
Model outputs for analyses of listener age (younger, older) and gender (women, men) using ANOVA (model). Asterisks indicate p-values < .05.
Appendix E
Model outputs for analyses of listener gender (women, men, nonbinary) for younger listeners using ANOVA (model). Asterisks indicate p-values < .05.
Acknowledgements
We would like to thank attendees at the 184th Annual Meeting of the Acoustical Society of America and the 2023 ASHA Convention for their helpful feedback.

Ethical Considerations
Data collection for this study was approved by the New York University IRB.
Consent to Participate
All participants provided written informed consent.
Funding
The authors disclosed receipt of the following financial support for the research, authorship, and/or publication of this article: This work was supported by the Steinhardt Doctoral Research and Travel Grant.
Declaration of Conflicting Interests
The authors declared no potential conflicts of interest with respect to the research, authorship, and/or publication of this article.