






Abstract
This study examined how dialectal background and individual production patterns influence nasality perception in American English, focusing on Midland and Inland North listeners. Forty-one adults from the two dialect regions completed nasometric testing to index oral–nasal balance characteristics (nasalance). Nasality perception was assessed using direct magnitude estimation (DME) of phrase-level synthetic stimuli, representing a continuum of synthesized velopharyngeal (VP) port sizes (0–0.20 cm2, in 0.04 cm2 steps). Results showed no significant between-dialect differences in nasalance. In contrast, DME ratings increased systematically with synthesized VP port size and differed by dialect, with Inland North listeners assigning higher ratings than Midland listeners, particularly at larger synthesized VP port sizes, yielding a significant dialect-by-synthesized VP port size interaction. Correlation analyses further examined production-perception relationships and revealed a significant negative association between nasalance and DME ratings for the 0.08 cm2 stimulus among Midland listeners, whereas no such association emerged among Inland North listeners. These findings indicate that perceptual judgments of nasality may vary even when production measures appear comparable. One possible explanation is that dialect contact may reduce production differences while perceptual representations remain relatively stable. The production-perception relationship observed exclusively for the 0.08 cm2 stimulus among Midland listeners further suggests that such links may be most evident when external stimulus contrast is minimal and listeners’ production and perceptual norms remain aligned. More broadly, these findings support the view that nasality perception is shaped by experience-based listener factors, consistent with exemplar and normalization accounts of speech perception.
1. Introduction
Nasality refers to a listener’s perception of nasal resonance in a speech signal (Sweeney et al., 1996). To quantify this perceptual phenomenon, the Nasometer, a computer-assisted acoustic device, was developed (Fletcher, 1970), yielding nasalance (i.e., the ratio of nasal to nasal plus oral acoustic energy) as an index of a speaker’s oral–nasal balance characteristics. Nasalance measures have been widely used in research and clinical settings. Reported nasalance data have revealed systematic differences across American English dialects, with Southern and Mid-Atlantic dialect speakers showing higher nasalance than Midland dialect speakers (Awan et al., 2015; Bae et al., 2020; Seaver et al., 1991). Despite extensive work on production, the perceptual dimension of nasality and the listener-dependent factors that contribute to its variability remain significantly understudied.
Variation in nasality perception across listeners can be understood within models that view speech perception as shaped by linguistic experience and production patterns. Exemplar-based approaches propose that listeners perceive incoming speech relative to detailed, experience-based distributions of previously encountered tokens (e.g., Johnson, 1997; Pierrehumbert, 2001). Through repeated exposure, these stored exemplars are updated and reflect the acoustic characteristics typical of one’s speech community, forming perceptual reference distributions that guide categorization. Within this framework, listeners from dialects characterized by greater nasal resonance may develop perceptual reference norms that differ from those from dialects characterized by less nasal resonance, potentially manifesting as broader acceptance of nasal variation (i.e., greater tolerance of nasality) and/or finer perceptual resolution for distinguishing degrees of nasality (i.e., heightened sensitivity to gradations of nasality). That is, a level of nasality that is typical in one dialect may be perceived differently in another.
At the individual level, growing evidence indicates that listeners’ own speech production patterns, beyond segmental levels, influence how they perceive acoustic-phonetic variation. For instance, Beddor et al. (2018) explored the link between production and perception of anticipatory vowel nasalization in American English. Listeners performed a visual-world eye-tracking task in which they heard spoken consonant-vowel-consonant (CVC) or consonant-vowel-nasal consonant-consonant (CVNC) words while viewing corresponding images. Perceptual weighting was inferred from how quickly listeners fixated the intended lexical target under different timings of anticipatory vowel nasalization, and production patterns were assessed based on nasal airflow data. Their findings showed that individuals who produced an earlier onset of anticipatory nasalization (i.e., stronger anticipatory nasalization) tended to fixate on the target image faster than those who produced a later onset, providing evidence for a link between production patterns and perceptual processing. Similarly, Zellou (2017) examined the relationship between listeners’ own anticipatory nasalization patterns and their performance on perceptual tasks using vowels with manipulated nasalization. In the discrimination task, listeners who produced stronger vowel nasalization in their own speech were more likely to treat nasalized vowels as perceptually similar when nasalization was contextually expected, indicating greater perceptual compensation for coarticulatory nasalization. Related evidence from other domains of voice and resonance further supports listener-dependent production-perception coupling. Park et al. (2019) investigated whether perceptual categorization of breathy voice quality relates to acoustic properties of listeners’ own voice production. Using synthetic vowels that varied along a breathiness continuum, they found that listeners who showed greater perceptual precision (i.e., narrower categorical boundaries) in categorizing breathy versus typical voice quality tended to have less breathy voices themselves. Taken together, these empirical findings, along with theoretical perspectives, suggest that listeners’ community-level experience and individual production characteristics may jointly shape perceptual processing, motivating the present study’s focus on listener-dependent variation in nasality perception using systematically manipulated nasality cues.
The present study focuses on two dialect groups of American English: Inland North and Midland. The Inland North dialect geographically encompasses major urban centers in the Great Lakes region, including Northern Ohio, Michigan, and cities such as Chicago and Buffalo, forming a contiguous area of densely populated metropolitan communities (Labov et al., 2006). This region is strongly associated with the Northern Cities Shift, a systematic chain shift involving the raising and tensing of /æ/ and coordinated shifts among multiple vowels across the vowel space (Gordon, 2001; Labov et al., 2006). In contrast, the Midland dialect extends westward from central Ohio and represents a transitional region between the North and the South, defined largely by the relative absence of major chain shifts that characterize neighboring dialects (Clopper et al., 2005; Labov et al., 2006). Within Ohio, the Inland North dialect is primarily represented in the northern region of the state (e.g., Cleveland, Akron, and Canton), whereas the Midland dialect is characteristic of central Ohio (e.g., Columbus) and southwestern metropolitan areas (e.g., Dayton and Cincinnati), making these two dialects geographically proximate within the state yet phonetically distinct (Labov et al., 2006).
These dialectal differences suggest broader variation in speech production patterns and community-specific norms. Systematic differences in vowel configuration across dialects may extend beyond segmental properties and shape acoustic cues relevant to resonance and sounds in context, including nasalization. Although prior work has primarily examined dialectal variation in segmental domains, relatively little is known about how such variation may manifest in suprasegmental properties such as nasality. From an experience-based perspective on speech perception, listeners are thought to internalize the distributional properties of the speech input they encounter, including detailed acoustic variation characteristic of their speech community (Johnson, 1997; Pierrehumbert, 2001). Although these accounts have primarily focused on segmental perception, they provide a framework for understanding how similar experience-based learning may extend to suprasegmental properties such as nasality. If dialects differ in the extent or patterns of nasalization in production, these differences may affect listeners’ perceptual reference norms for nasality. Even within a single dialectal group, variation in nasalance has been attributed to culturally prescribed speech patterns (Mayo et al., 1996), suggesting that nasalization may function as a learned, community-specific feature shaped by linguistic experience. Together, these observations motivate the need to examine whether listener-dependent perceptual variability in nasality is shaped by both dialect-level differences and individual production characteristics, extending existing segmental-based theoretical accounts to suprasegmental aspects of speech perception.
Consistent with this broader account of listener-dependent speech perception, previous studies have documented dialect-specific patterns in nasality perception. Velik et al. (2019) compared nasality perception between Midland and Inland North listeners, in which participants rated synthetic vowel stimuli that varied in degrees of nasality using a direct magnitude estimation (DME) task. Although listeners’ production patterns indexed by nasalance did not differ significantly between the two dialect groups, Inland North listeners assigned significantly higher nasality ratings than Midland listeners to identical auditory stimuli. Bae et al. (2020) extended this comparison to Midland and Texas South dialects, again showing that listeners of two distinct dialects assigned significantly different nasality ratings to identical auditory stimuli, with Texas South listeners exhibiting higher nasalance scores and DME ratings compared with Midland listeners. Although these findings highlight the influence of dialectal background on nasality perception, both studies relied on isolated vowel stimuli, limiting their ecological validity for understanding nasality perception in connected speech. Moreover, the mismatch between production (i.e., standardized passage readings) and perception tasks (i.e., nasality ratings of isolated vowels) constrained interpretation of potential production-perception relationships (Bae et al., 2020).
The present study addresses these gaps by examining how dialectal background and individual production patterns influence nasality perception using phrase-level synthetic auditory stimuli and matched materials to align production and perception tasks. Specifically, we aimed to (1) compare nasalance measures between Midland and Inland North listeners, (2) examine how dialectal background affects nasality ratings for listening stimuli representing a continuum of systematically manipulated velopharyngeal (VP) port sizes, and (3) assess the strength and direction of the relationship between listeners’ nasalance scores and their nasality ratings and examine whether this production-perception relationship differs by dialect. By integrating controlled synthetic stimuli with speaker-specific nasalance data, this study provides new evidence for how community-level experience and individual speech patterns jointly shape the perception of nasality in American English, thereby extending listener-dependent models of speech perception to the suprasegmental domain of resonance.
2. Method
2.1. Participants
This study was approved by the university’s institutional review board, and informed consent was obtained from all participants. Forty-one adults (28 females and 13 males), aged 18 to 52 years (M = 21.8 years, SD = 5.17), were recruited through convenience sampling. All participants self-reported a negative history of speech, language, or hearing issues and no upper respiratory infection/cold symptoms on the day of the experiment. Each completed a questionnaire detailing their residential history and linguistic background. Two dialectal groups were of interest: Midland and Inland North. Dialect group inclusion was determined based on participants’ self-identified region of origin, supplemented by detailed residential history, and interpreted with reference to isogloss boundaries defined by Labov et al. (2006, p. 142). Participants representing the Midland dialect (n = 20) were primarily from central and southwestern Ohio (e.g., Columbus, Cincinnati, and Dayton), whereas those representing the Inland North dialect (n = 21) were from northern Ohio (e.g., Cleveland, Akron, and Canton). Figure 1 illustrates the participants’ primary cities of origin. Among Inland North participants, five reported no residential history outside the Inland North isogloss. The remaining participants reported current residence in the Midland isogloss at the time of testing. Duration of residence outside the Inland North region was as follows: seven participants <3 years, seven <2 years, and two <1 year. These participants were classified as Inland North based on their self-identified region of origin, reflecting their primary dialect exposure. In contrast, Midland participants reported no residential history outside the Midland isogloss.
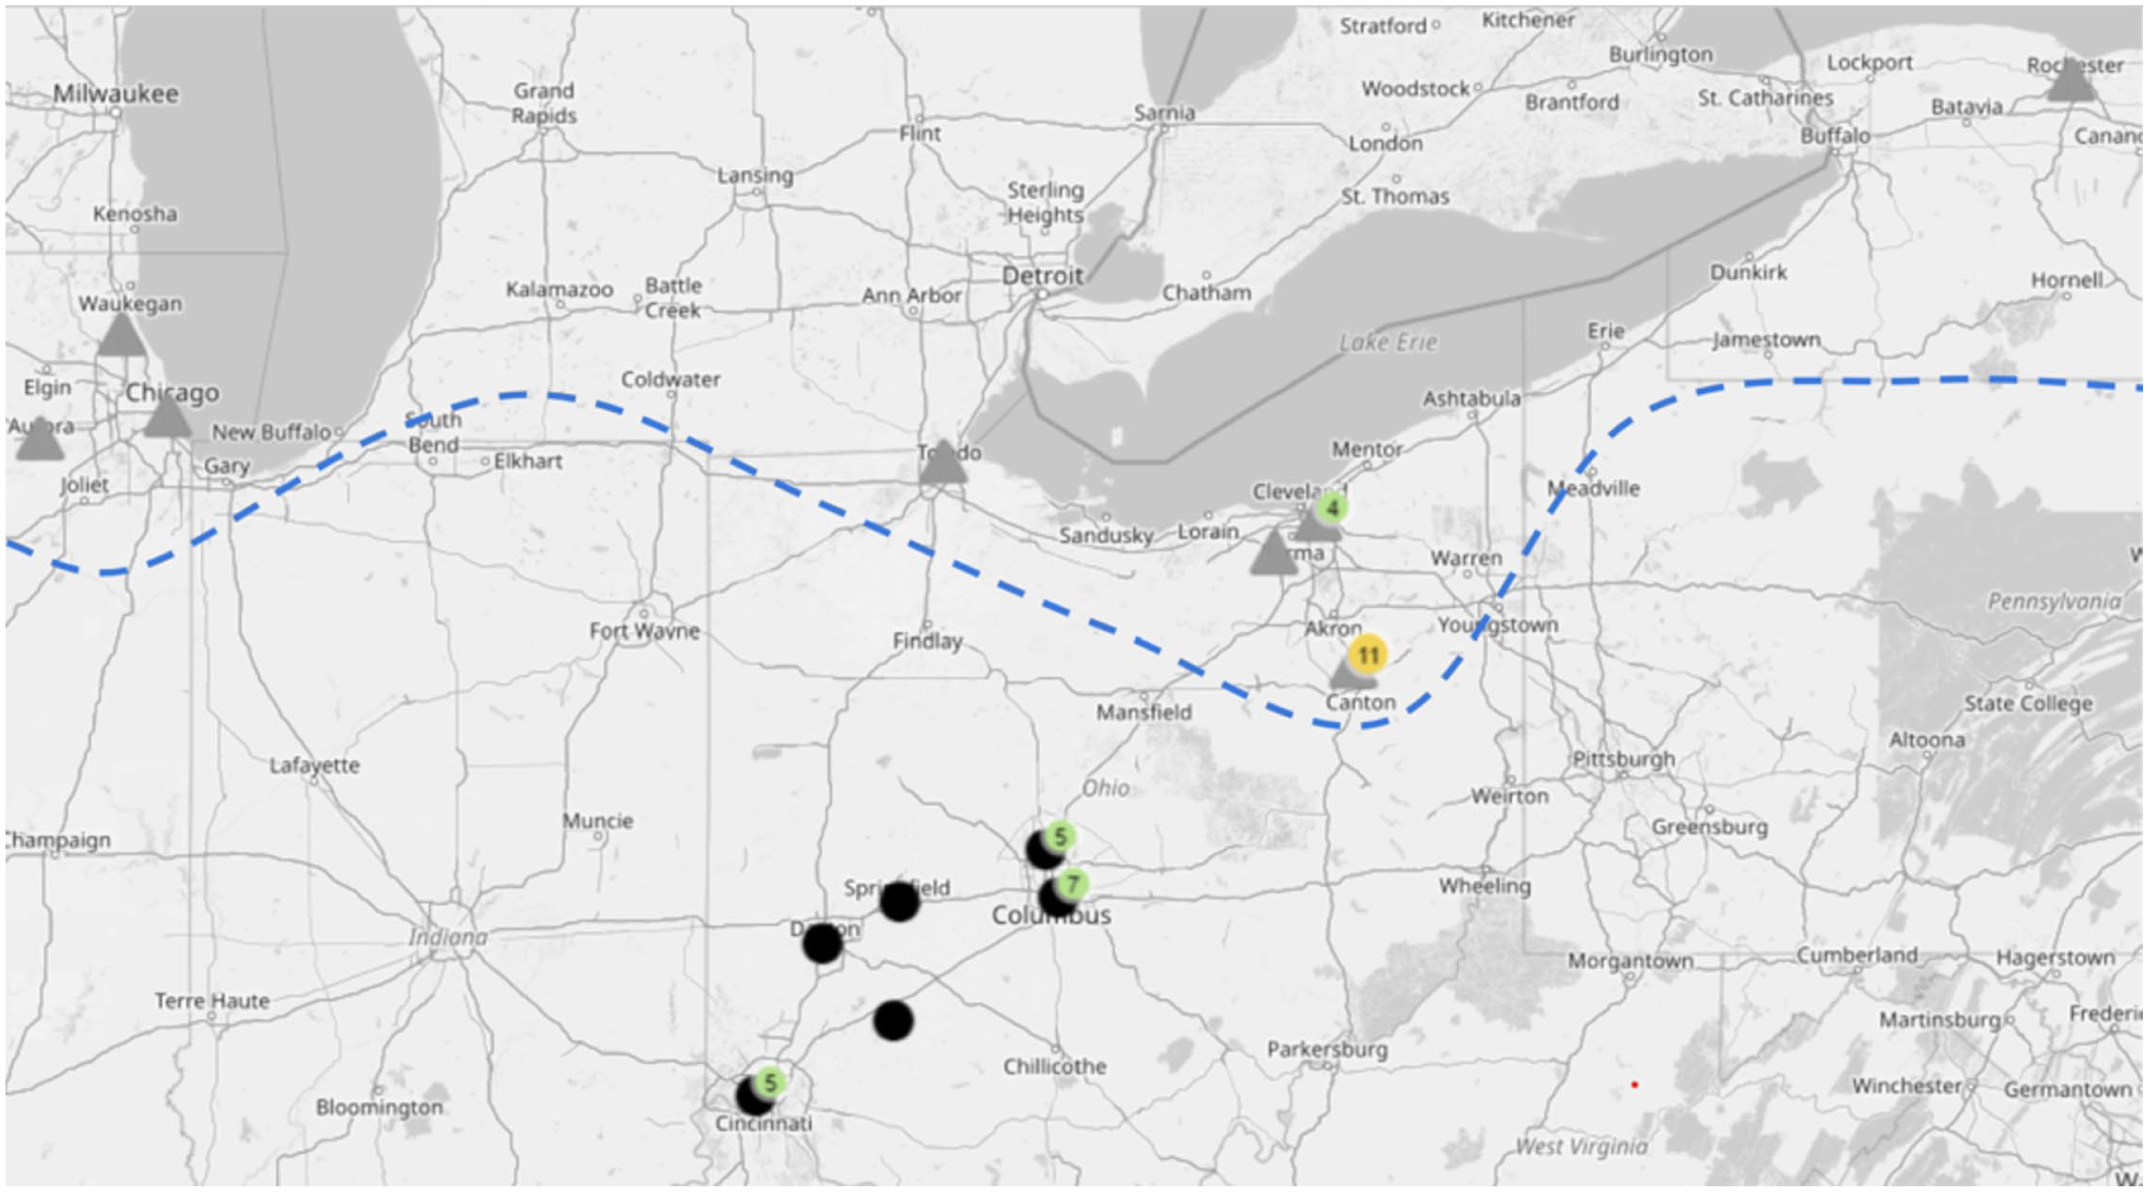
Cities of origin/hometowns of the Inland North participants (gray triangles) and Midland participants (black circles) marked on a portion of a map of the United States. Number labels above location markings indicate the number of participants in the cases of multiple participants originating in the same area. A blue dashed line defines the boundary between the Inland North and Midland regions, located above and below the line, respectively.
2.2. Production Task and Procedure
Each participant underwent nasometric testing (Nasometer II Model 6450, KayPENTAX™, Montvale, NJ) to quantify oral–nasal balance characteristics in their speech. The Nasometer headset was placed such that the metal plate remained firmly secured between the participant’s nose and the upper lip. Acoustic signals recorded through the Nasometer microphone set are subject to a band-pass filter with their center frequency at 500 Hz and a bandwidth of 300 Hz. Speech samples included three standardized passage readings, each repeated twice. The Zoo Passage contains oral phonemes only, the Rainbow Passage contains a mixture of oral and nasal phonemes, and the Nasal Sentences are heavily loaded with nasal phonemes (Kummer, 2008).
2.3. Perception Task and Procedure
2.3.1. Development of Listening Stimuli and Constraints
Synthetic stimuli were chosen over natural speech to control factors that could influence nasality ratings and judgments, such as speaking rate (McHenry, 1999) and other coinciding disordered speech characteristics (Allison et al., 2021; Counihan & Cullinan, 1970). Listening stimuli were synthesized using a computer-based articulatory synthesizer, VocalTractLab (www.vocaltractlab.de). The interactive interface of this software allows the user to modify a visual three-dimensional vocal tract model while quantitatively manipulating 23 vocal tract parameters (e.g., tongue tip position and velic opening). For the creation of a connected utterance, a sequence of dynamic articulatory configurations can be defined using articulatory parameters along with their trajectory and timing information specified in the graphical user interface (Birkholz & Jackèl, 2003; Krug et al., 2021).
A nine-word prototype phrase from the Rainbow Passage, a division of white light into many beautiful colors, with a duration of 2.86 s, was synthesized using a built-in male talker in an articulatory synthesizer. This talker does not correspond to a specific human speaker and was implemented using the built-in German phonemic inventory. Gestural scores were manually adjusted to specify segmental timing while accounting for articulatory overlap and transition patterns to enhance naturalness. To approximate an American English-like prosodic profile, fundamental frequency gestures and lung pressure gestures were iteratively modified to match the synthetic output with a human prototype recording. Despite these adjustments, the resulting prototype retained traces of foreign-accented quality, which should be considered a design constraint when interpreting nasality rating data.
Of particular interest was the size of the synthesized VP port as a means of controlling the degree of nasality in the synthesized stimuli. In addition to the prototype phrase approximating normal oral–nasal balance, five variations differing in synthesized VP port size were generated, resulting in six listening stimuli. Because the prototype phrase already contained nasal consonants (e.g., /m/ and /n/), VP port size adjustments were applied to nonnasal segments while ensuring smooth transition to and from nasal consonants. Synthesized VP port sizes ranged from 0 cm2 (prototype) to 0.20 cm2 in 0.04 cm2 increments (0 cm2, 0.04 cm2, 0.08 cm2, 0.12 cm2, 0.16 cm2, and 0.20 cm2). As VP port size increased, the synthesized stimuli also exhibited acoustic consequences beyond changes in nasal resonance, including the emergence of nasal murmur and reduced oral stop distinctiveness. A 0.04 cm2 increment was selected as a practical step size for phrase-level stimuli, given their greater linguistic complexity relative to isolated vowels (Bunton & Story, 2012) or vowel-consonant-vowel (VCV) segments (Story & Bunton, 2021), both of which used 0.02 cm2 increments, to ensure perceptible magnitude differences between successive stimuli across the continuum. The upper limit was based on prior findings that listeners’ nasality ratings plateau for synthetic vowel samples with port sizes exceeding 0.16 cm2 (Bunton, 2015). To preserve the phonetic integrity of nasal consonants, the synthesized VP port size of 0.50 cm2 predefined for such consonants was left unmodified. Audio samples of the six synthesized listening stimuli are provided in Supplemental Materials 1–6.
2.3.2. Perceptual Rating of Nasality and Considerations
Each participant underwent a brief training session to ensure that they could accurately and consistently identify which listening stimuli were nasal and which were not. This training session was essential to address the colloquial use of ‘nasal’ to describe both hyponasality and hypernasality (Niedzielski & Preston, 2000). During training only, participants were asked to categorize stimuli as ‘nasal’ or ‘not nasal’. The term ‘nasal’ was introduced using nontechnical, perceptual descriptions, such as speech that sounds as if sound is coming through the nose, whereas ‘not nasal’ referred to speech without this perceptual quality. Seated in a sound-attenuated booth, participants were presented with listening stimuli via supra-aural headphones. Training stimuli consisted of a subset of the synthesized listening stimuli used in the experimental session. The participant was first presented with a stimulus synthesized with a 0 cm2 VP port size and was informed that it was a demonstration of a ‘not nasal’ phrase. Then, the participant was presented with a stimulus synthesized with a 0.16 cm2 VP port size and was informed that it was a demonstration of a ‘nasal’ phrase. Once the participant confirmed their understanding, they were presented with the two stimuli multiple times in randomized order and were asked to categorize each stimulus as either ‘nasal’ or ‘not nasal’. Participants indicated their responses nonverbally using a thumbs-up gesture for ‘nasal’ and a thumbs-down gesture for ‘not nasal’, which was monitored by the experimenter through the booth window. Responses were not recorded, as the purpose of the training was to confirm task understanding. Participants were required to correctly categorize the stimuli in three consecutive trials before proceeding to the experimental rating session.
Direct magnitude estimation with a modulus was used to scale perceived nasality (Bae et al., 2020; Brancamp et al., 2010; Velik et al., 2019; Whitehill et al., 2002; Zraick & Liss, 2000). Direct magnitude estimation was selected over interval-based scales because nasality functions as a prothetic continuum, for which ratio-level scaling may be better suited to capture the proportional increases in perceived nasality across the range of synthesized VP port sizes without the boundary constraints typical of interval scales (Whitehill et al., 2002; Zraick & Liss, 2000). Direct magnitude estimation with modulus involves listeners’ rating the perceived magnitude of a variable in reference to a standard stimulus with a known value (modulus). The stimulus synthesized with a 0.08 cm2 VP port size, representing the approximate midpoint of the experimental VP port size range (Weismer & Laures, 2002), was designated as the standard stimulus with the modulus value of 100. The DME task was administered using a paper-and-pencil response format with a customized scoring sheet. Participants were provided with written instructions and asked to record a numerical rating for each target stimulus using a value proportional to the modulus. For instance, the participant was told to assign 200 if the stimulus was perceived to be twice as nasal as the modulus or 50 if the stimulus was perceived to be half as nasal as the modulus.
The rating task was organized into five blocks of repeated standard-target comparisons. Each block consisted of six standard-target stimulus pairs (0.08–0.00, 0.08–0.04, 0.08–0.08, 0.08–0.12, 0.08–0.16, and 0.08–0.20 cm2) presented once each in randomized order. Participants completed five blocks, yielding 30 ratings in total. Stimuli were presented using prerecorded audio files, and the order of the six target stimuli was randomized within each block and varied across blocks to reduce potential order effects. A 5-s interval separated the standard and target stimuli, allowing listeners time to process the phrase-long standard stimulus and establish it as a perceptual reference, thereby supporting DME ratings based on comparison to a stable reference rather than immediate acoustic contrast. Participants had 10 s between trials to assign their rating of each stimulus relative to the standard.
Foreign-accented speech is known to increase listening effort and cognitive load relative to native-accented speech (Munro & Derwing, 1995; Schmid & Yeni-Komshian, 1999; Van Engen & Peelle, 2014). Because the synthetic listening stimuli carried foreign-accented traces, steps were taken to reduce attentional demands associated with lexical decoding while directing listeners’ attention to perceived nasality. Specifically, prior to the training session, listeners were verbally informed of the lexical content and instructed that they would repeatedly hear the phrase, a division of white light into many beautiful colors, throughout the experiment. The phrase was also presented orthographically on the scoring sheet. Although prior knowledge of the lexical content may influence perceptual processing (e.g., facilitating comprehension or increasing tolerance for variability), all stimuli shared identical lexical content, and any such effect would be expected to apply similarly across the listening stimuli. The training session also provided brief exposure to the speaker-dependent characteristics of the stimuli, which may have facilitated listeners’ early perceptual adaptation to accented speech (Bradlow & Bent, 2008). Each test stimulus was preceded by the standard stimulus with a modulus of 100, allowing listeners to anchor their ratings to a stable perceptual reference. Despite these measures, the presence of a foreign-accented quality represents a design constraint. It remains unclear whether listeners’ ratings reflect the physical variation in nasality alone or a composite percept in which nasality is colored by accent-related cues and other co-occurring acoustic consequences of VP opening (e.g., changes in stop consonant realization).
2.4. Measurements, Reliability, and Statistical Analysis
Arithmetic mean nasalance scores were obtained based on nasalance data for three standardized passages. In addition, a mean nasalance score for the phrase from the Rainbow Passage, a division of white light into many beautiful colors, was obtained separately, as this phrase matched the listening stimulus used in the perception task. Direct magnitude estimation ratings were processed in two stages. First, to account for the log-normal distribution of DME data (Schiavetti et al., 1994; Whitehill et al., 2002) and to stabilize variance at the individual level, a geometric mean was calculated for each participant across the five repeated trials for each stimulus condition. Second, these individual geometric means were averaged across participants using an arithmetic mean to derive group-level results. All subsequent statistical analyses were performed using the individual geometric means, with one value per participant per stimulus condition, as the primary dependent variable.
Intralistener reliability was assessed separately for each participant using a two-way mixed-effects consistency intraclass correlation coefficient, ICC (3, k), based on log-transformed DME ratings. For each participant, the five repeated rating blocks were treated as measurements and the six stimuli with varying synthesized VP port sizes as targets. The resulting coefficients indexed the reliability of each listener’s average ratings across the five blocks in their relative scaling of the six synthesized VP port size targets. The mean ICC (3, 5) across all participants was .958 (range: .539–.998), indicating excellent internal consistency overall according to the guidelines provided by Koo and Li (2016). Notably, 40 out of 41 participants exhibited excellent consistency (ICC > .75), further confirming that the internal ratio scale remained stable for the vast majority of listeners throughout the task. Interlistener reliability was assessed using a two-way random-effects, absolute agreement, average-measures model, ICC (2, k), based on the geometric means of the DME ratings. The resulting ICC coefficient was .993 (95% CI [.982, .999], indicating excellent interlistener reliability (Koo & Li, 2016). This high coefficient likely portrays broad agreement in scaling the ordered stimulus continuum.
A multivariate analysis of variance (MANOVA) was used to test between-dialect differences across three standardized reading passages. Data analysis of DME ratings included a repeated-measures analysis of variance (ANOVA) with dialect as the between-subject variable and synthesized VP port size as the within-subject variable. Statistical assumptions were evaluated by examining the normality of the distribution of raw scores within each factor level using Shapiro-Wilk tests and visual inspection of Q-Q plots. Although some conditions yielded significant Shapiro-Wilk test results, visual inspection confirmed that these corresponded to only modest positive skewness. Given the nearly equal group sizes and the established robustness of the F-statistic to mild nonnormality in balanced designs (Field, 2024; Schmider et al., 2010), the data were deemed suitable for parametric analysis. Sphericity was assessed with Mauchly’s test, and Greenhouse-Geisser corrections were used when the assumption was violated.
To explore potential relationships between individual listeners’ production and perception, Spearman’s rank-order correlations were conducted between nasalance scores for the phrase, a division of white light into many beautiful colors (from the Rainbow Passage reading), and DME ratings at each synthesized VP port size. Analyses were performed for all listeners combined and for each dialect group separately. Given the small sample size and potential influence of outliers, a nonparametric approach was adopted. All statistical tests were performed using SPSS Statistics (version 29, IBM Corp, Armonk, NY) at an alpha level of .05.
3. Results
3.1. Nasalance Production
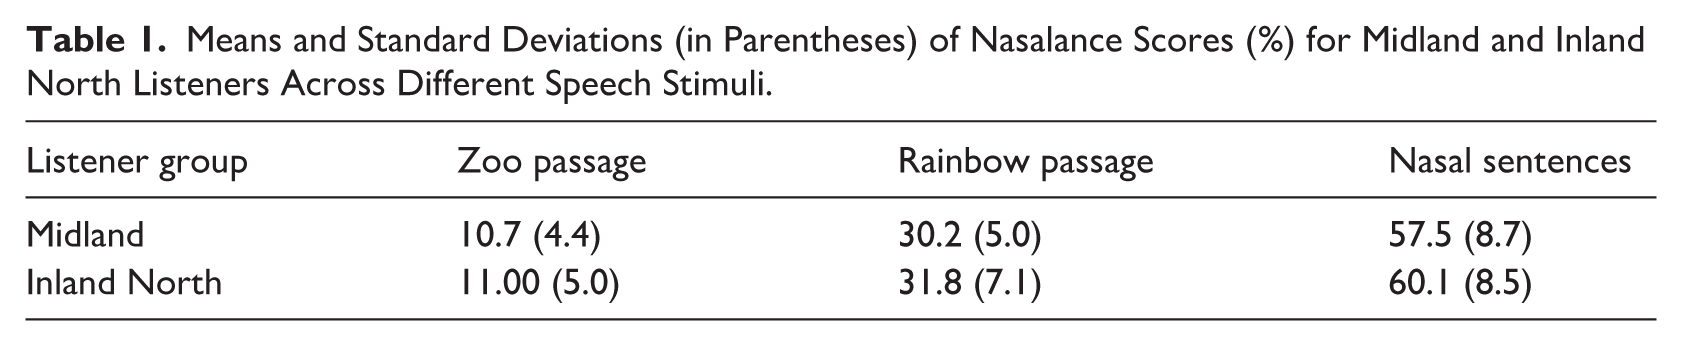
Table 1 summarizes the nasalance scores for Midland and Inland North listeners across three standardized passages (Zoo, Rainbow, and Nasal Sentences). The mean nasalance scores for Midland and Inland North listeners were highly similar across all passages, with Inland North listeners showing slightly higher nasalance values overall than Midland listeners. No statistically significant difference was found between dialect groups in nasalance scores, F(3, 36) = 0.979, p = .813, Wilks’s Lambda = .19.
Means and Standard Deviations (in Parentheses) of Nasalance Scores (%) for Midland and Inland North Listeners Across Different Speech Stimuli.
3.2. Nasality Perception
Figure 2 shows the mean DME ratings by Midland and Inland North listeners across different synthesized VP port sizes. Significant main effects were observed for both dialect (F(1, 39) = 6.442, p < .05, partial η2 = .142) and synthesized VP port size (F(2.167, 84.516) = 216.989, p < .001, partial η2 = .848) on DME ratings. Specifically, Inland North listeners (M = 103, SD = 52) assigned significantly higher DME ratings than Midland listeners (M = 92, SD = 42). Note that these standard deviations reflect variability across DME ratings spanning all synthesized VP port size conditions and should be interpreted in light of the wide range of values. For both groups, DME rating means increased as a function of synthesized VP port size: 30 (SD = 23) for 0 cm2, 59 (SD = 24) for 0.04 cm2, 99 (SD = 12) for 0.08 cm2, 118 (SD = 21) for 0.12 cm2, 134 (SD = 29) for 0.16 cm2, and 145 (SD = 30) for 0.20 cm2. Pairwise comparisons with Bonferroni corrections further indicated that the differences in DME ratings between all possible synthesized VP port size pairs were statistically significant (p < .05). Notably, a significant interaction effect between dialect and synthesized VP port size was observed, F(2.167, 84.516) = 3.371, p < .05, partial η2 = .08. As shown in Figure 2, between-dialect differences in DME ratings varied across synthesized VP port sizes. Pairwise comparisons with Bonferroni corrections revealed that between-dialect differences were statistically significant (p < .05) only for synthesized VP port sizes of 0.16 cm2 and 0.20 cm2, where the mean DME ratings for Inland North listeners were significantly higher than those for Midland listeners: 0.16 cm2 (Midland = 122, Inland North = 146) and 0.20 cm2 (Midland = 132, Inland North = 157).
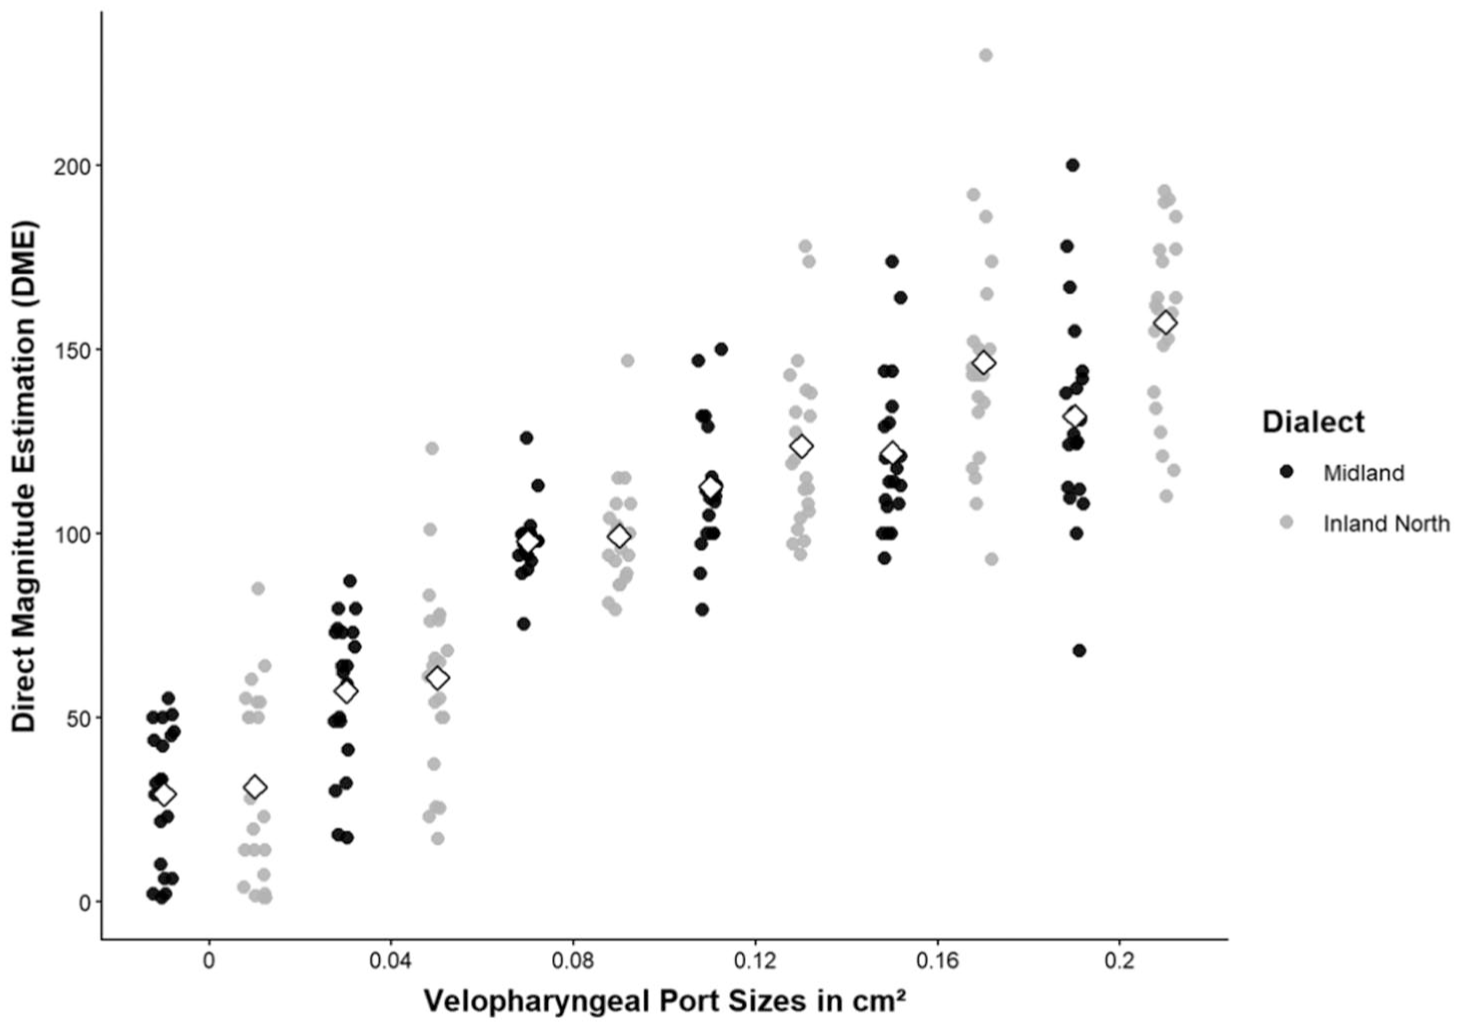
Direct magnitude estimation (DME) ratings by Inland North and Midland listeners across listening stimuli with varying synthesized velopharyngeal (VP) port sizes. Jittered dots represent individual listeners’ DME ratings, and diamonds indicate group means.
3.3. Production-Perception Link
Table 2 summarizes Spearman’s rank-order correlation coefficients between nasalance scores for the phrase, a division of white light into many beautiful colors, and DME ratings across synthesized VP port sizes for all listeners combined and separately by dialect group. A statistically significant correlation was observed only at the synthesized VP port size of 0.08 cm2 for Midland listeners (rs = −.525, p < .05). This negative correlation indicated that listeners with higher nasalance tended to assign lower DME ratings, whereas those with lower nasalance assigned higher DME ratings. In contrast, no significant correlation was observed for Inland North listeners (rs = .122, p = .599) at the same condition. Excluding one Inland North participant who exhibited comparatively high values for both nasalance and DME did not alter this pattern (rs = −.018, p = .941), indicating no meaningful association between production and perception for this group. No significant correlations were observed for other synthesized VP port sizes. Figure 3 displays a scatterplot of individual participants’ nasalance scores for the phrase and DME ratings at the synthesized VP port size of 0.08 cm2 for the two dialect groups, with DME values representing geometric means computed across five repeated trials per participant.
Spearman’s Rank-Order Correlation Coefficients Between Nasalance Scores (%) for the Phrase A Division of White Light Into Many Beautiful Colors and Direct Magnitude Estimation (DME) Ratings Across Synthesized Velopharyngeal (VP) Port Sizes for All Listeners and by Dialect Group.
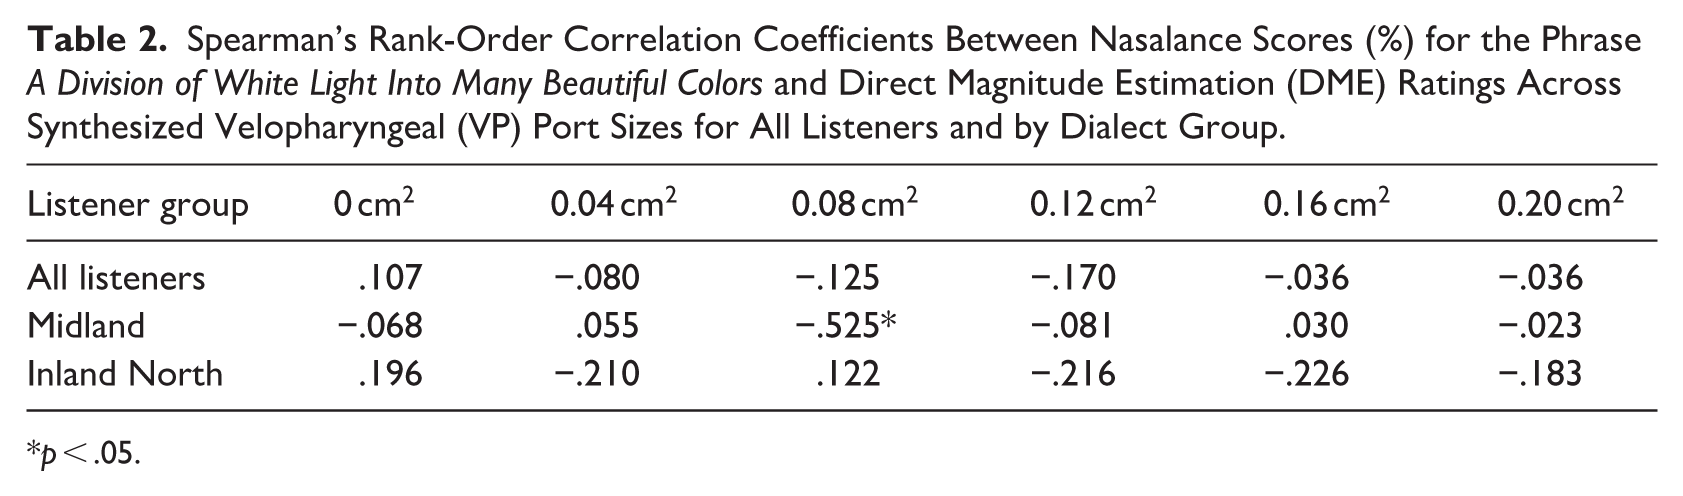
p < .05.
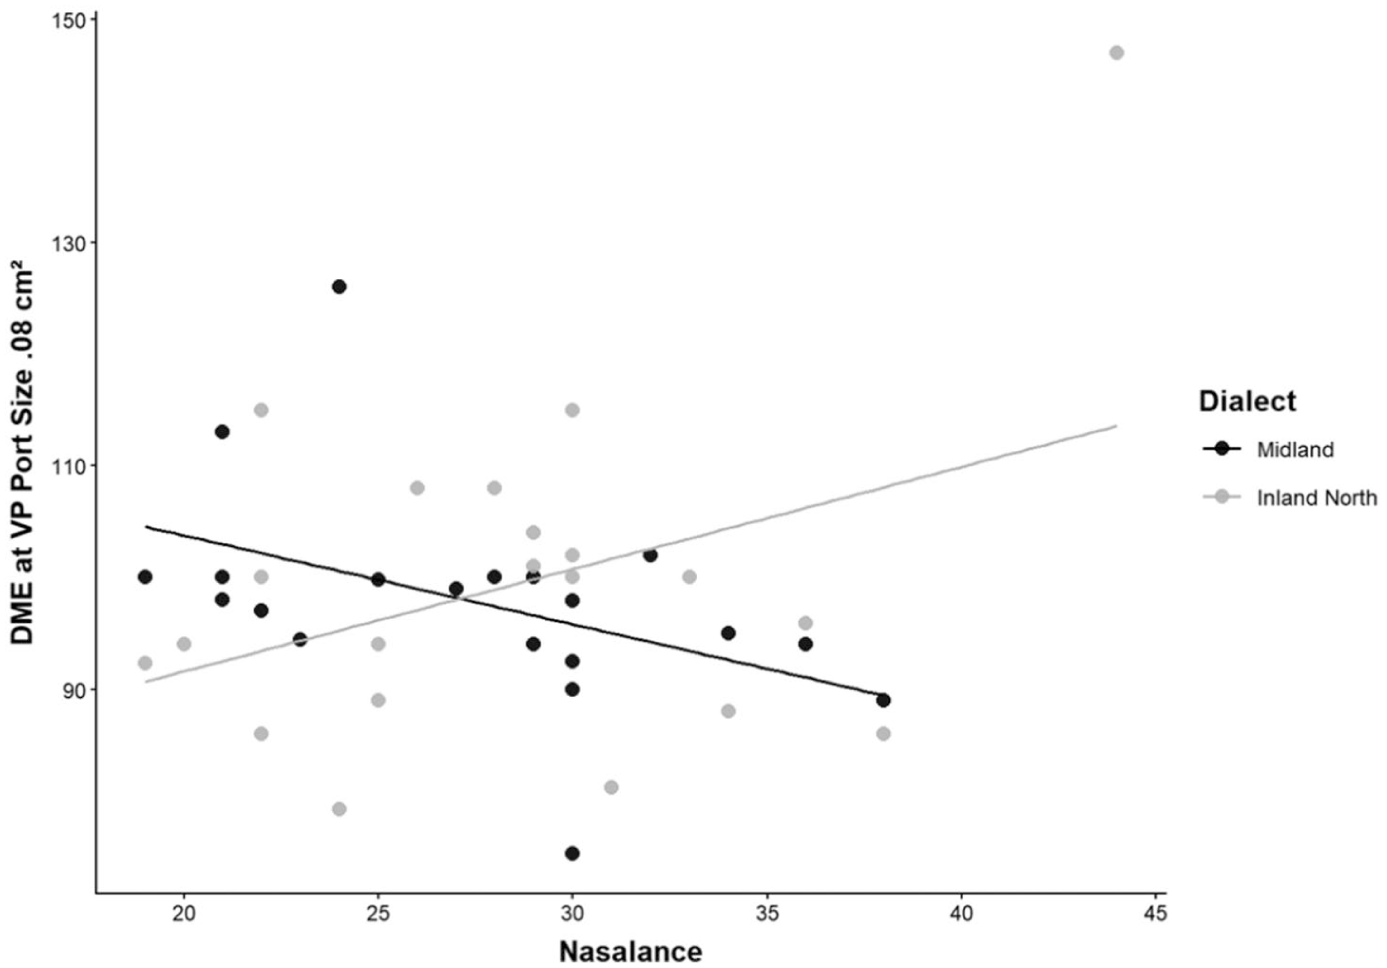
Scatterplot of individual participants’ nasalance scores for the phrase ‘a division of white light into many beautiful colors’ and corresponding direct magnitude estimation (DME) ratings at the synthesized velopharyngeal (VP) port size of 0.08 cm2. DME values represent geometric means computed across five repeated trials for each participant. Gray dots represent Inland North listeners, and black dots represent Midland listeners.
4. Discussion
This study examined how dialectal background and individual production patterns influence nasality perception in American English, focusing on the Midland and Inland North dialects. Three primary patterns emerged. First, no significant between-dialect differences were observed in nasalance scores, indicating comparable production patterns between the two dialect groups. Second, DME ratings increased systematically with synthesized VP port size for both dialect groups, with between-dialect differences reaching statistical significance for stimuli representing greater degrees of nasality. Third, a significant negative association between production and perception was observed only for the stimulus with a synthesized VP port size of 0.08 cm2 among Midland listeners (rs = −.525, p < .05), with no reliable associations observed for other conditions.
The absence of significant between-dialect differences in nasalance production was consistent with previous work reporting similar nasalance scores between the two dialects (Awan et al., 2015; Velik et al., 2019). Although the Inland North dialect has been described by speakers of other dialects as characteristically nasal (Hartley & Preston, 1999), the Inland North isogloss spans a broad geographic area surrounding the Great Lakes (Labov et al., 2006). Previous studies have reported Inland North nasalance data across multiple locations, including Michigan and urban centers such as Chicago, Cleveland, and Detroit (Awan et al., 2015; Velik et al., 2019). In the present study, participants were drawn primarily from Inland North regions adjacent to the Midland region, and many were residing in an Midland-dialect region. Such contact-based exposure may promote convergence in production over time. Evans and Iverson (2007) found that college students who relocated to a new dialect region showed more rapid adaptation of vowel production than of perception. Taken together, geographic proximity and ongoing dialect contact might have contributed to the comparable nasalance scores observed between the groups.
Listeners’ DME ratings increased systematically as a function of synthesized VP port size for both dialect groups, supporting the validity of the phrase-level synthetic stimuli in capturing graded nasality. Unlike isolated vowel stimuli (Bae et al., 2020; Bunton, 2015; Bunton & Story, 2012; Velik et al., 2019), the phrase-level stimuli used in the present study contained pressure consonants, making the acoustic consequences of increased VP port sizes more complex. As the synthesized VP port size increased, reduced intraoral pressure likely weakened oral pressure consonants, in some cases, resulting in nasalized realizations, consistent with prior work showing shifts in stop-nasal consonant identification over a range of VP coupling areas (Story & Bunton, 2021). That is, increases in synthesized VP port size were accompanied not only by increased nasal resonance in vocalic segments but also by changes in pressure consonant realization (e.g., segmental degradation). Therefore, listeners’ DME ratings likely portrayed an integrated response to multiple acoustic consequences arising from variations in synthesized VP port size.
In contrast to production data, perception data revealed significant between-dialect differences, with Inland North listeners assigning higher DME ratings than Midland listeners, particularly for listening stimuli with larger synthesized VP port sizes (0.16 and 0.20 cm2). Notably, these VP port sizes exceed the plateau reported by Bunton (2015), in which perceived nasality for isolated vowels approached an upper limit near 0.16 cm2. A key difference between the two studies lies in the nature of the stimuli (isolated vowels vs. phrase-level speech). The aforementioned converging cues to nasality (e.g., increased nasal resonance and phonetic shifts from oral stops to nasalized variants) might have allowed listeners to continue differentiating degrees of nasality even in a range where perception might otherwise plateau in isolated vowel contexts. Within this expanded cue space, Inland North listeners may be more responsive to these converging cues, which could partly account for the higher perceptual scaling of nasality compared with Midland listeners. This interpretation is consistent with prior work suggesting that perceptual judgments of nasality are shaped by experience-based calibration. Watterson, Lewis, et al. (2013) proposed that listeners accustomed to speech communities characterized by greater nasal resonance may interpret elevated nasality as a cultural distinction rather than as atypical resonance. A similar pattern was reported by Bae et al. (2020), in which Texas South listeners, who had higher nasalance scores than Midland listeners, also assigned higher DME ratings to identical listening stimuli compared with Midland listeners. Although between-dialect differences in nasalance were statistically nonsignificant in the present study, the observed perceptual differences are consistent with the idea that listeners’ perceptual scaling of nasality reflects long-standing, experience-based norms shaped by their speech community (Bae et al., 2020; Watterson, Lewis, et al., 2013), in line with exemplar-based accounts of speech perception (Johnson, 1997; Pierrehumbert, 2001). Importantly, prior work has shown that speech perception tends to remain more stable than production. Evans and Iverson (2004, 2007) demonstrated that perceptual representations remain fairly stable and require sustained, immersive experience to change. Specifically, Evans and Iverson (2007) tracked university students from a northern English dialect region over 2 years following their exposure to Standard Southern British English at university. Although these speakers showed significant phonetic accommodation in their vowel production toward southern norms, their perceptual vowel categories showed no reliable longitudinal change over the same period. This asymmetry provides a useful framework for interpreting the present findings. Although many Inland North listeners were residing in a Midland-speaking region (<3 years), their perceptual patterns of nasality remained distinct from those of Midland listeners. This suggests that perceptual differences across dialect groups may persist even after shifts in production. Notably, Inland North listeners showed numerically higher nasalance values than Midland listeners, although this difference did not reach statistical significance. It is possible that a larger sample would reveal small but statistically significant between-dialect differences. However, these production differences appear small in magnitude compared with the more pronounced perceptual differences observed. Taken together, these findings suggest a weak alignment between production and perception across dialect groups in the present sample, with comparable production patterns but divergent perceptual scaling, partly explained by the influence of dialect contact, which may reduce production differences while leaving perceptual representations relatively stable. These findings should be interpreted in light of the specific participant sample included in the present study and should not be assumed to represent the Inland North dialect region more broadly. Future work with listeners from geographically distinct Inland North regions (e.g., Chicago, IL; Madison, WI; or Buffalo, NY) beyond the Midland and Inland North contact area will be important for evaluating generalizability.
Beyond the group-level patterns, the present study also examined the relationship between individual listeners’ nasalance production and their DME ratings. A recognizable association was observed only for the stimulus with a synthesized VP port size of 0.08 cm2. This stimulus also served as the anchor in the DME task, such that judgments for the target stimulus with the same VP port size (0.08 cm2), made in reference to an identical standard, provided little external contrast to guide perceptual scaling. In this context, listeners were effectively required to evaluate whether the two stimuli were perceptually identical and, if not, to assign a proportional value relative to the modulus. In other words, the task may have engaged perceptual processes more similar to same-different comparison or fine-grained phonetic judgment, where production-perception relationships are more readily observed (Zellou, 2017) than the relative magnitude scaling required for trials with greater external contrast. Accordingly, the absence of stimulus contrast may have increased reliance on listeners’ individual internal reference for nasality, potentially linked to their own habitual production patterns, which could partly explain the association observed for the 0.08 cm2 stimulus.
The statistically significant negative correlation between nasalance and DME ratings within the Midland group indicates that higher nasalance was associated with lower DME ratings, and vice versa, for the stimulus with a synthesized VP port size of 0.08 cm2. Increased reliance on internal reference under minimal external contrast is consistent with listener-specific normalization processes, in which perceptual judgments are made relative to one’s own habitual nasal resonance rather than to an absolute acoustic reference (Johnson, 2005). However, the strength of the production-perception relationship differed by dialect group. Midland listeners, who were long-term residents within the Midland dialect region and reported limited exposure to other dialects, likely maintained a relatively stable mapping between their production patterns and perceptual norms. In contrast, no reliable association emerged for Inland North listeners, as many Inland North listeners were residing in a Midland dialect region, indicating ongoing dialect contact. In such contexts, speech production may adapt more readily than perceptual representations (Evans & Iverson, 2007). This potential mismatch, where production becomes more Midland-dialect-like through adaptive convergence while perception norms remain anchored to prior Inland North experience, might have weakened production-perception coupling, reducing the observable correlation.
More broadly, our findings extend exemplar and normalization frameworks of speech perception (Johnson, 1997, 2005; Pierrehumbert, 2001) to nasality, with perceptual judgments of nasality anchored to individualized, dialect-dependent internal references. From a sociophonetic perspective, nasal speech, ranging from gradient variation in typical speakers to clinically defined hypernasality, has been shown to elicit negative social evaluations (Bettens et al., 2020; Dewhurst, 2023; Hunt et al., 2006; Poyatos, 1991; Tye et al., 2024; Watterson, Mancini, et al., 2013). The present findings suggest that such evaluations may depend, in part, on listeners’ specific perceptual reference standards shaped by prior linguistic experience. Within the current task context, these internal references appear to function as relatively stable anchors for interpreting variation in nasality, particularly in the absence of strong external contrast. However, this stability can coexist with flexibility. Within an adaptive perceptual coding framework (Kleinschmidt & Jaeger, 2015), perceptual standards are expected to remain flexible, allowing listeners to recalibrate their judgments following exposure to novel input. From a clinical perspective, such recalibration is often achieved through structured listener training and exposure to calibrated reference stimuli (Chapman et al., 2016; Lee et al., 2009; Manicardi et al., 2023; Sell et al., 2009), suggesting that perceptual norms may be both experience-based and modifiable. Taken together, nasality perception may thus be both stable and adaptable, with perceptual judgments grounded in prior experience yet responsive to changing input. This dual property provides a foundation for future work examining how resonance differences are interpreted across speech communities and how perceptual norms may be systematically recalibrated.
In summary, the present findings showed a consistent pattern of perceptual differences between dialect groups. The use of phrase-level stimuli may have introduced multiple acoustic consequences of VP port opening, including changes in stop consonant realizations. Dialect contact, especially among the Inland North listeners residing in the Midland dialect region, may have contributed to reduced production differences, whereas perceptual representations remained relatively stable. Within these constraints, the observed pattern is most consistent with listener-specific perceptual calibration shaped by dialect experience. These interpretations should be considered preliminary and dependent on the current sample and experimental design.
There are several limitations in the present study. First, gradient rating methods such as DME require conscious, metalinguistic judgments and may not fully capture phonetically driven perceptual processes (Zellou, 2017). Accordingly, whether the higher DME ratings among Inland North listeners compared with Midland listeners reflect differences in internal standards for nasal speech warrants further investigation using finer-grained perceptual measures. Ongoing work in our laboratory addresses this question using complementary identification and discrimination paradigms designed to capture perceptual thresholds and sensitivity more directly. Second, listeners’ DME ratings likely portrayed an integrated response to multiple acoustic consequences arising from variations in synthesized VP port size. The synthesized listening stimuli also carried a persistent foreign-accented quality. Although informing listeners of the lexical content was intended to reduce cognitive load (Van Engen & Peelle, 2014) and minimize attention shifts toward the accent, the foreign accent remains a potential confound. Listeners may attribute acoustic deviances to speaker identity (Niedzielski, 1999), such that ratings might have captured a composite percept where nasality and foreign accent were not fully separable. Although the systematic relationship between synthesized VP port size and DME ratings suggests listeners successfully tracked the intended nasality cues, the influence of the foreign accent on the absolute magnitude of the ratings cannot be entirely ruled out. Future work using stimuli optimized for American English characteristics and controlled segmental properties would improve ecological validity. Third, the relatively small sample size (N = 41) remains a limitation. Larger and more geographically distinct samples will help evaluate the robustness of the dialectal effects and their generalizability across wider regional varieties of American English.
5. Conclusion
In summary, the present study examined how dialectal background and nasalance production patterns relate to nasality perception among Midland and Inland North listeners. Although nasalance measures did not differ significantly between dialect groups, nasality ratings diverged systematically, with Inland North listeners assigning higher DME ratings than Midland listeners, particularly for stimuli representing greater degrees of nasality. These findings suggest a weak alignment between production and perception across dialect groups, partly explained by the influence of dialect contact, which may reduce production differences while leaving perceptual representations relatively stable. A production-perception relationship emerged only for the stimulus with a synthesized VP port size of 0.08 cm2 and only among Midland listeners, suggesting that its strength may depend on conditions that limit external contrast and on listener-specific factors influencing production-perception mapping. Together, these findings extend exemplar and normalization accounts of speech perception to suprasegmental features such as nasality. Future research employing larger and more diverse samples, complementary perceptual paradigms, and more naturalistic synthetic stimuli will help clarify how production patterns and dialect experience jointly shape different perceptual dimensions of nasality.
Supplemental Material
sj-wav-1-las-10.1177_00238309261462541 – Supplemental material for Dialectal and Individual Influences on Nasality Perception: Evidence From Midland and Inland North
Supplemental material, sj-wav-1-las-10.1177_00238309261462541 for Dialectal and Individual Influences on Nasality Perception: Evidence From Midland and Inland North by Monica O’Neill, Sarah Bolt, Mindy Agranoff, Sami Shaffer and Youkyung Bae in Language and Speech
Supplemental Material
sj-wav-2-las-10.1177_00238309261462541 – Supplemental material for Dialectal and Individual Influences on Nasality Perception: Evidence From Midland and Inland North
Supplemental material, sj-wav-2-las-10.1177_00238309261462541 for Dialectal and Individual Influences on Nasality Perception: Evidence From Midland and Inland North by Monica O’Neill, Sarah Bolt, Mindy Agranoff, Sami Shaffer and Youkyung Bae in Language and Speech
Supplemental Material
sj-wav-3-las-10.1177_00238309261462541 – Supplemental material for Dialectal and Individual Influences on Nasality Perception: Evidence From Midland and Inland North
Supplemental material, sj-wav-3-las-10.1177_00238309261462541 for Dialectal and Individual Influences on Nasality Perception: Evidence From Midland and Inland North by Monica O’Neill, Sarah Bolt, Mindy Agranoff, Sami Shaffer and Youkyung Bae in Language and Speech
Supplemental Material
sj-wav-4-las-10.1177_00238309261462541 – Supplemental material for Dialectal and Individual Influences on Nasality Perception: Evidence From Midland and Inland North
Supplemental material, sj-wav-4-las-10.1177_00238309261462541 for Dialectal and Individual Influences on Nasality Perception: Evidence From Midland and Inland North by Monica O’Neill, Sarah Bolt, Mindy Agranoff, Sami Shaffer and Youkyung Bae in Language and Speech
Supplemental Material
sj-wav-5-las-10.1177_00238309261462541 – Supplemental material for Dialectal and Individual Influences on Nasality Perception: Evidence From Midland and Inland North
Supplemental material, sj-wav-5-las-10.1177_00238309261462541 for Dialectal and Individual Influences on Nasality Perception: Evidence From Midland and Inland North by Monica O’Neill, Sarah Bolt, Mindy Agranoff, Sami Shaffer and Youkyung Bae in Language and Speech
Supplemental Material
sj-wav-6-las-10.1177_00238309261462541 – Supplemental material for Dialectal and Individual Influences on Nasality Perception: Evidence From Midland and Inland North
Supplemental material, sj-wav-6-las-10.1177_00238309261462541 for Dialectal and Individual Influences on Nasality Perception: Evidence From Midland and Inland North by Monica O’Neill, Sarah Bolt, Mindy Agranoff, Sami Shaffer and Youkyung Bae in Language and Speech
Footnotes
Acknowledgements
The authors thank Dr. Peter Birkholz and Kristen Eckert for early contributions to synthetic stimulus development and Melike Baspinar for assistance with subject recruitment and data coding.

Ethical Considerations
This study was approved by the Institutional Review Board at the Ohio State University.
Consent to Participate
Written informed consent was obtained from all participants prior to participation.
Author Contributions
Monica O’Neill contributed to the conceptualization of the study, data collection and analysis, and manuscript writing. Sarah Bolt contributed to data collection and analysis and manuscript editing. Mindy Agranoff contributed to the conceptualization of the study, stimulus development, data collection, and manuscript editing. Sami Shaffer contributed to data collection and manuscript editing. Youkyung Bae contributed to the conceptualization of the study, overall project supervision, data analysis, and manuscript writing.
Funding
The authors received no financial support for the research, authorship, and/or publication of this article.
Declaration of Conflicting Interests
The authors declared no potential conflicts of interest with respect to the research, authorship, and/or publication of this article.
Data Availability Statement
Supplemental Material
Supplemental material for this article is available online.
References
Supplementary Material
Please find the following supplemental material available below.
For Open Access articles published under a Creative Commons License, all supplemental material carries the same license as the article it is associated with.
For non-Open Access articles published, all supplemental material carries a non-exclusive license, and permission requests for re-use of supplemental material or any part of supplemental material shall be sent directly to the copyright owner as specified in the copyright notice associated with the article.
