
Abstract
When human remains are found, with no evidence of identity, facial approximation can be a useful technique to employ. The reconstruction of the ante-mortem appearance can reproduce the likely features of the face, starting from the skull, based on the overlying soft-tissue thickness. Over the years, many techniques have been developed to achieve soft-tissue thickness measurements, one of which is based on the use of cone beam computed tomography. This study aimed to review the status of this technique and to evaluate heterogeneity among studies undertaken in this field, with particular regard to determination of landmarks, sex and body mass index.
Introduction
The personal identification of human remains is an important issue in forensic investigation. Where no circumstantial evidence is available, the most precise comparative techniques may fail because of the difficulty comparing unknown remains with possible familiar material. 1 In these cases, a possible option to reach a positive identification is to re-create the ante-mortem appearance of the face using facial reconstruction techniques. 2 Forensic facial reconstruction (FFR) is a method used to rebuild the face from a skull with the aim of identifying the deceased. 3 It presupposes that the bone surface conditioned the facial physiognomy. So, it is dependent on the estimated soft-tissue thicknesses (STT) over some anatomical sites of the skull. 4 However, one of the problems associated with FFR is the reliance on the use of these average facial STTs, as well as the difficulty in estimating these values. 5 Over the years, different techniques have been developed in order to achieve increasingly precise STT measurements based on medical imaging, including radiography, ultrasound, magnetic resonance imaging, computed tomography (CT) and cone beam CT (CBCT). 6 Although in the literature there are reviews of different techniques for STT measurement,7,8 no reviews have been carried out on CBCT. CBCT is a potentially low-dose imaging technique in which cone-shaped X-ray beam moves in a helical progression to acquire multiple image slices, while the detector makes a circle around the patient. Then, reconstructed images are achieved through software that provides images in three orthogonal planes (axial, sagittal and coronal) and in 3D reconstruction. CBCT is capable of providing accurate submillimetre resolution images, and this has implications for optimal visualisation of the structures and measurement of tissues.9,10 Therefore, the purpose of this work was to verify the status of CBCT use in STT measurements and to explore possible sources of heterogeneity among studies in this field.
Data collection
Seven studies with a total of 530 records were found. The searches were carried out until 4 September 2019 using the following databases: PubMed, Google Scholar, Cochrane Library and Google Scopus. The search criteria were keywords for FFR, CBCT and soft-tissue thickness ((cone beam computed tomography) AND soft tissue thickness) AND forensic facial reconstruction). Finally, a final search was conducted in the references lists of the selected articles.
The studies were selected according to the following inclusion criteria: study conducted in vivo; publication in forensic, anthropology and maxillofacial journals; utilisation of CBCT only; and choice of bone landmarks. Exclusion criteria comprised: sample with facial abnormalities, age <18 years and sample composed of individuals undergoing maxillofacial surgery.
Data were collected and tabulated. The following information was recorded: first author of the study, location, ancestry, sample number and method of the bone landmarks’ identification used in the study.
Discussion
As seen in Table 1 and according to the literature, 23 a consensus on a set of standard landmarks that are used to guide an accurate forensic facial approximation has yet to emerge. Most studies taken into consideration in this review used the De Greef 12 method of choosing landmarks. Description of the landmarks according to De Greef et al. are detailed below.
Descriptive analysis of the studies in the review.
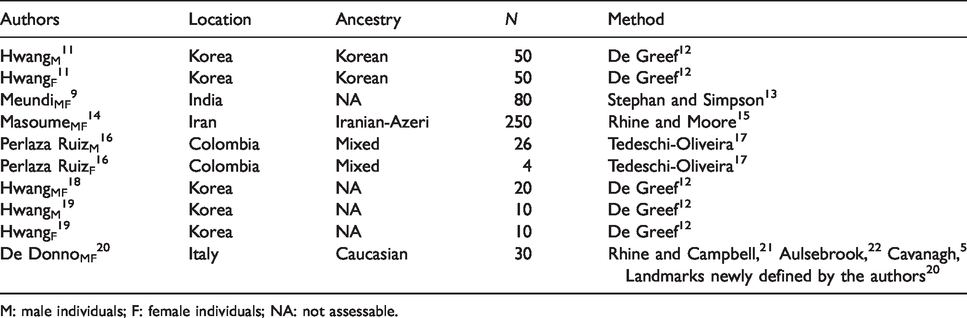
M: male individuals; F: female individuals; NA: not assessable.
Midline landmarks:
Supraglabella – most anterior point on the midline Glabella – cross-point between the midline and supraorbital line Nasion – the midpoint of the fronto-nasal suture End of nasal – junction between bone and cartilage of the nose Mid-philtrum – centred between the nose and mouth on the midline Upper lip – midline on the upper lip Lower lip – midline on the lower lip Chin–lip fold – midline centred on the fold chin, below the lips Mental eminence – centred on the most anteriorly projecting point of the chin Beneath the chin – the vertical measure of the soft tissue on the most inferior point of the chin
Bilateral landmarks:
Frontal eminence – centred on pupil, at the most anterior point of the forehead Supraorbital – centred on the pupil, just above the eyebrow Lateral glabella – junction of the frontal, maxillary and lacrimal bones on the medial bone of the orbit Lateral nasal – side of the bridge of the nose on the Frankfurt horizontal plane Suborbital – centred on the pupil, just under the infra-orbital margin Inferior malar – centred on the pupil, just interior to the zygomatic process Lateral nostril – next to the most lateral point of the alar border Naso-labial ridge – the prominence either side of the philtrum Supracanina – vertically lined up with the cheilion, on the horizontal level of the mid-philtrum Subcanina – vertically lined up with the cheilion, on the horizontal level of the chin–lip fold Mental tubercle anterior – the most prominent point on the lateral bulge of the chin mound Mid-lateral orbit – vertically centred on the orbit, next to the lateral orbital border Supraglenoid – root of the zygomatic arch just anterior to the ear Zygomatic arch – the most lateral curvature of the zygomatic bone Lateral orbit – lined up with the lateral border of the eye on the centre of the zygomatic process Supra-M2 – the cheek region, lateral: lined up with the nasal base; vertical: lined up beneath the lateral border of the eye Mid-masseter – middle of the masseter, the halfway point between the supraglenoid and the gonion Occlusal line – the border of the masseter, on vertical level of the cheilion Sub-M2 – below the second molar on horizontally lined up with supra-M2 Gonion – at the angle of the mandible Mid-mandibular angle – inferior border of the mandible, vertically lined up with supra-M2
Different methods were used for STT measurements. Hwang11,18 used specific software (Skull Measure; CyberMed, Seoul, Korea) to measure the distance between soft tissue and the corresponding hard tissue using the ‘perpendicular to bone’ manner selected in the programme. On the contrary, Hwang 19 used the same software, but different methods for STT measurement were taken into consideration: ‘perpendicular to bone’, ‘perpendicular to skin’ and ‘direct measurement’ (the distance between a point on the bone and a point on the skin). Statistical analysis showed that the ‘direct measurement’ method and ‘perpendicular to skin’ method had a lower reproducibility than the ‘perpendicular to bone’ method. Meundi 9 used the OnDemand 3D software (CyberMed) to measure the distance between the bone landmark and the corresponding point on the soft tissue, using the hard- and soft-tissue display tool to identify the points. Masoume 14 used the Image WorkNNT viewer v2.21 to identify the anatomical landmarks. Ruiz 16 acquired CBCT digital images with iCATVision software to locate and measure soft tissue. Lastly, De Donno 20 used the Image Tool of the ILUMA® CBCT scanner, and the soft-tissue measurements were taken as follows: first, each landmark was identified on the bone surface; then, a line was drawn perpendicular to the tangent to the landmark and extended up to the facial profile. The STT measure corresponds to the distance from the bone to the skin.
Furthermore, the studies differ from each other for the localisation of the bilateral landmarks. In Masoume 14 and Hwang, 19 the side of the measurements was not defined. In Hwang 18 and De Donno, 20 the measurements were taken on the right and left side. In Hwang 11 , Meundi 9 and Perlaza Ruiz, 16 CBCT scans were examined on both the right and left side in order to assess any differences, but with a discrepancy in the results. Although in most cases no significant differences were found between the right and left STT measurements, Perlaza Ruiz 16 found statistically significant values for zygomatic arch, supraglenoid, occlusal line and sub-M2. For these points, thicker soft tissues were found for the left side of the face. The authors associated this variation possibly with the masticatory function.
Differences were also assessed between males and females. In Hwang 11 , Meundi 9 and Perlaza Ruiz, 16 statistically significant differences were noted for some landmarks, mainly located in the midline, especially those corresponding to the lip area, with thicker soft tissues in men. Only in two cases were tissues thicker in women: the lateral orbit in Hwang 11 and the supramentale in Perlaza Ruiz. 16 Although the single craniofacial landmarks may differ, even at a statistically significant level, there is no uniformity among the studies. So, as so far as assessed in the literature for other techniques of STT measurements,24,25 the differences between males and females are of little practical meaning for craniofacial identification.
Only two studies14,16 from this review took body mass index (BMI) into consideration in data analysis. Both showed a positive correlation between landmarks and BMI for oral, orbital and zygomatic regions: STT values increased when BMI increased. Furthermore, in Perlaza Ruiz 16 significant differences were also found for masseteric, mentonian and parotid regions. Finally, Perlaza Ruiz 16 underlined that nasion and rhinion landmarks presented greater thickness values for subjects in the health weight range than those who were obese, probably due to traction exerted on the facial tension lines by the other anatomical points.
Conclusion
It is important to underline that since no reviews have been carried out on CBCT, only studies on CBCT values were evaluated. One of the most obvious issues is that there is not a unique way of choosing landmarks. So, further studies should focus on the evaluation of the best method for the identification of landmarks. This will also allow a reliable comparison of the results obtained in different studies. Furthermore, there is a lack of ancestry in these studies. There are no studies on the application of CBCT on Negroid ancestry, and there is only one study 20 on the application of CBCT in the Caucasian population. In any study, it would be useful to broaden the sample for better results. Moreover, some authors compared their measurements to those of other ancestry. Hwang 11 compared the obtained results on a Korean population to the De Greef study 12 on a Caucasian population. The comparison showed higher values in De Greef’s study, indicating thicker soft tissue in Koreans. Nevertheless, the authors underlined that a different tool was used for ST measurement in De Greef’s study. So, it is necessary to undertake a comparison between CBCT databases of STT measurements in different ancestries.
Therefore, a unique method of landmark identification, larger samples and additional ethnic data should improve the reliability of the soft-tissue values used in facial reconstruction. It is also important to underline that no author has stratified the sample according to age groups. Therefore, it would be interesting to observe any possible differences of STT measurement in different age classes. So, even if it is difficult to assess and predict a unique and correct STT value for each landmark, more and more studies are necessary to obtain acceptable results in facial reconstruction.
Footnotes
Acknowledgements
This article was presented in the form of a primary study 20 at the 43th Italian National Meeting SIMLA 2018 which was held on 18–20 September 2018 in Verona, Italy. It received an award for best work presented at the meeting.
Declaration of conflicting interests
The authors declared no potential conflicts of interest with respect to the research, authorship and/or publication of this article.
Funding
The authors received no financial support for the research, authorship and/or publication of this article.