
Abstract
The previous Labour government pledged to abolish child poverty and introduced a range of welfare reforms that emphasised the role of work as the primary route out of poverty. This culminated in the Child Poverty Act (2010) which commits all future governments to the abolition of child poverty. This paper examines New Labour's record on child poverty and examines the factors responsible for its change. While the welfare reforms of the late 1990s did increase work among families with children, this didn't translate into large falls in child poverty. Those entering work still relied on substantial increases in government benefits to lift them over the poverty line. The current coalition government has reaffirmed its commitment to the Child Poverty Act and is also emphasising the role of work. The lessons of the past decade cast severe doubt on whether the current coalition government strategy of promoting work will be any more successful in reducing child poverty. With planned benefit cuts in the pipeline we could well experience some substantial increases in child poverty over the coming years.
1. Introduction
One of the last pieces of legislation to be passed by the outgoing Labour government was the Child Poverty Act (2010). This Act was the culmination of many years commitment to the abolition of child poverty, which began with Tony Blair's Beveridge Lecture in March 1999 where he set out New Labour's child poverty target. This was subsequently driven forward by Gordon Brown, whose welfare reforms focussed on work as the key route out of poverty for low income families. The Child Poverty Act, which received cross-party support, committed future governments to the abolition of child poverty. In April this year the coalition government reaffirmed its commitment to this Act when it published its National Strategy for tackling child poverty. Again, increasing work is at the centre of these reforms, with the Secretary of State for Work and Pensions, Iain Duncan Smith, pushing forward welfare reform to promote employment as the best route out of poverty.
This paper examines New Labour's record on child poverty. It sets out the strategy implemented to tackle child poverty and outlines the main changes in child poverty over the past decade. It then examines the impact of the welfare reforms introduced by New Labour on child poverty and asks what factors were important determinants of changing child poverty since the late 1990s. Finally, it asks whether we can learn from the past decade as the new coalition government sets out its own strategy to tackle child poverty.
Specifically, changes in child poverty are decomposed into different factors: demographic change, changes in wages and work, and changes in benefits and taxes. While the welfare reforms of the late 1990s did increase work among families with children, this didn't translate into large falls in child poverty. Work itself had a modest role in reducing poverty and those entering work relied on substantial increases in government benefits to lift them over the poverty line. Demographic and wage changes over this period actually worked to increase child poverty, as they drove up underlying inequality. Child poverty would have fallen much more were it not for these increases in inequality. These findings cast severe doubt on whether the current coalition government strategy of promoting work will be any more successful than the policies of the previous government in reducing child poverty. This, coupled with planned benefit cuts, suggests that we could experience some substantial increases in child poverty over the coming years.
The next section reviews the motivation for the child poverty targets and the reforms introduced by New Labour. Section 3 then examines the impacts of these reforms on the labour market and on child poverty. Section 4 outlines the decomposition methodology and results. Section 5 examines the prospect for future changes in child poverty under a new government.
2. The child poverty strategy
2.1 The child poverty target
When the New Labour government came to power in 1997 it inherited a strong macroeconomy with growing employment and average incomes. But it also inherited a society that had experienced almost two decades of rising inequality. Some 3.4 million children lived in relative income poverty. This was one in four of all children in Britain. There was a strong feeling in the new government that something needed to be done about child poverty.1 There was more and more evidence that growing up in poverty could severely limit a child's life chances in terms of educational and employment opportunities and could increase anti-social behaviour (Waldfogel, 2010). The new evidence to emerge on social mobility at this time added to the debate on equality of opportunity for poor children. Furthermore, public support had shifted in favour of tackling this rise in inequality and child poverty (Hills, 2002). The majority view was that those that could work should, but that parents with young children should not be forced to work.
The initial commitment to the abolition of child poverty made by New Labour was with reference to relative poverty. A child is deemed to be poor under this definition if they live in a household whose (equivalised) income is less than 60 per cent of the contemporary median income. With this relative measure the poverty line can change from year to year with changes in median incomes. To reduce relative poverty it is not enough just to raise the incomes of the poor. Their incomes have to rise faster than median incomes. A commonly used alternative is an absolute measure of poverty. This compares the household incomes of children to a fixed (real) income threshold. Typically, 60 per cent of median income from a given year is used to define the threshold. Absolute poverty will fall if the real incomes of poor children are growing, irrespective of median income growth. Both measures have their merits. Absolute poverty tells us whether real incomes are growing. Relative poverty tells us about the distribution of incomes between middle income households and poor households.
The relative target set by New Labour has proved to be a tough target to meet. If underlying inequality is increasing, then achieving poverty reductions requires a substantial redistribution towards poor children. However, the adoption of a relative poverty target ensures that economic growth is shared by all. The previous two decades had seen a sustained period where income growth was very unequal and this provided the motivation for the relative child poverty target.
Later on in their spell in office the Labour government shifted to a broader array of poverty measurement. These measures were still largely based on income. The Child Poverty Act (2010) has four key poverty targets: a relative income target, an absolute income target, a combined measure of material deprivation and relative income and a measure of persistent poverty. The measures of material deprivation were introduced to capture broader measures of the quality of life of children beyond income measures. They include indicators of whether children have access to an outside space, whether they have leisure equipment such as a bicycle, whether they have friends over and whether they celebrate special occasions. The measure of persistent poverty identifies children who have been in relative income poverty in three out of the past four years. The adoption of these additional indicators was an attempt to enrich the measure of disadvantage beyond the simple snapshot of income poverty.
2.2 The welfare reforms
The drive to tackle child poverty in the newly elected Labour government was clear but what policies should be adopted? There were a number of factors behind the growth in poverty observed in the 1980s and 1990s (Dickens and Ellwood, 2004). While unemployment was not particularly high and was falling following the early 1990s recession, the distribution of work across households had changed dramatically over the past decades. The percentage of children living in households with nobody in work had trebled since the late 1970s and now stood at 20 per cent (Gregg and Wadsworth, 2011). Children in these households faced a very high poverty rate.
Inequality among those in work had also been increasing throughout the 1980s (Machin, 2011). Real wages had been growing at the bottom of the pay distribution but they lagged far behind the growth seen at the median and the top of the distribution. This contributed to a rise in relative poverty and a growth in children living in poor families who had someone in work. A final key factor in this growth in child poverty was demographic change. The percentage of children growing up in single parent households grew from 13 per cent in 1979 to 23 per cent in 1997 (Waldfogel, 2010).
Increasingly the evidence suggested that the interaction of the benefit system with a high level of workless households and high wage inequality meant that work incentives were very low for those considering entering work. This was particularly true for single parents and those with children who were unlikely to be much better off in work than on benefits. Thus the focus of reform was on the benefits system.
New Labour's strategy was to have three key strands: making work pay, providing out of work support to families with children, and investing in children in the longer run (Waldfogel, 2010). As stated in the introduction, there was an emphasis on “making work pay” for those that could work. Policies such as the Working Families Tax Credit, the National Minimum Wage, National Insurance reforms and various New Deal programmes were all introduced in the late 1990s with the aim of promoting work amongst low income families with children. In addition, part of the aim of the new National Childcare Strategy was to increase the availability of quality, affordable childcare. These policies were comprised mostly of “carrots” rather than “sticks” and there was little in the way of forcing people into work. However, there was a recognition that not everyone can work. Government benefits for those not working were also increased. This was achieved through generous increases in Child Benefit and the introduction of the Child Tax Credit, which was payable irrespective of work status. The final component of the anti-poverty strategy was to invest for the long term in children. Free universal nursery places were offered to pre-school children from the age of three years,2 parental leave rights were extended and Sure Start services were introduced in low income areas. For school age children, a class size cap of 30 was introduced along with the literacy and numeracy hour. The Education Maintenance Allowance was also introduced to induce 16–17 year olds to stay on at school.3
The anti-poverty strategy cost money and represented a substantial redistribution towards families with children. Hills (2003) estimated that by 2003 families with children were about £1,200 a year better off than in 1997 in terms of taxes and benefits. This aggregates up to £9bn a year or approximately 1 per cent of GDP. The coalition government's figures suggest that some £150bn have been spent on tax credits between 2004 and 2009 (HM Government, 2011).
3. Impacts of the reforms
3.1 Labour market impacts
Given these substantial policy interventions designed to tackle child poverty and to “make work pay” it is crucial to examine the evidence on what happened over Labour's term in office. Before we look at the child poverty figures let us turn our attention to those factors that are likely to impact upon poverty: work, wages, demographic change and benefits.
The welfare reforms of the late 1990s were successful in increasing employment among households with children. Figure 1 shows the per cent of children in workless households for couple and single parent households from 1997–2010. About 54 per cent of children of single parents were living in households with no work in 1997. This fell some 10 percentage points to 44 per cent by 2005, and has remained at this level even going into the recession in 2008/9. This is a remarkable increase in employment among British single parents. Of course, the strong economy meant that employment would have increased anyway, but the general consensus is that the government reforms played a major role in increasing work among this group (See Brewer et al., 2006). Work also increased among couples with children. Figure 1 also presents the workless household rate for this group (right-hand scale). This fell from 8 per cent to just over 6 per cent by 2005 but has risen since as the recession struck. Worklessness also fell in households without children but the most dramatic fall was among single parent households (Gregg and Wadsworth, 2011).
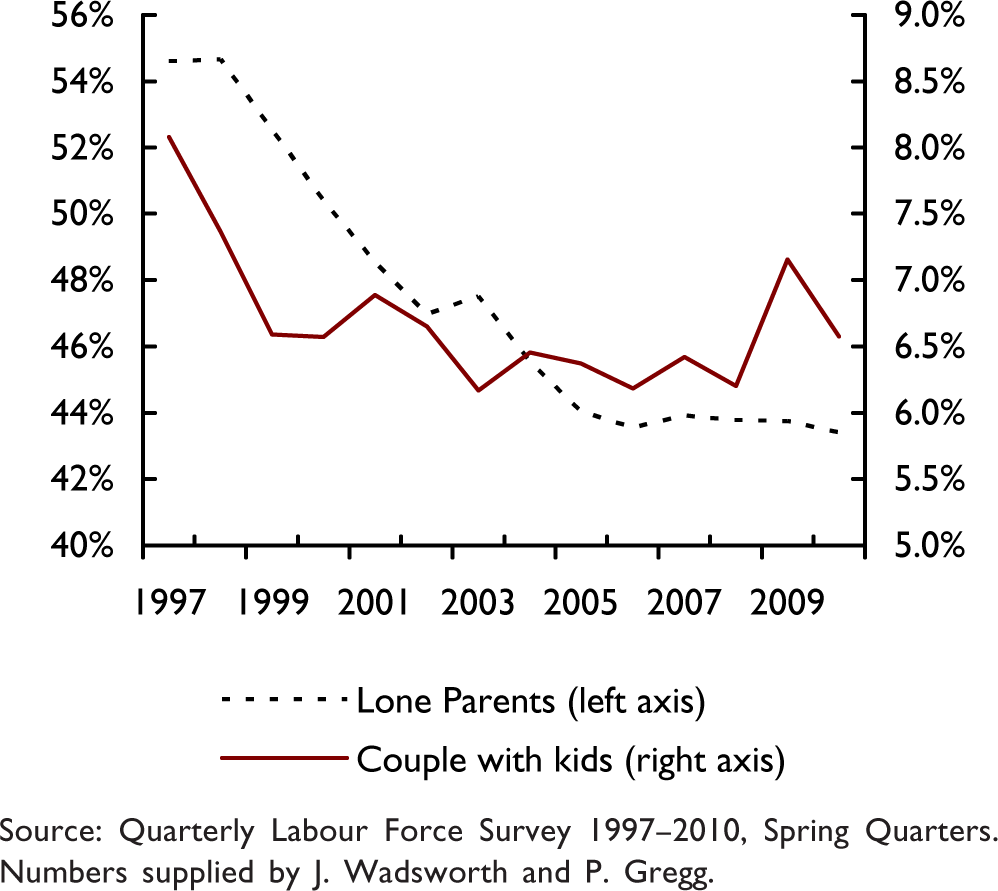
Children in workless households
After decades of rising wage inequality, the situation changed from the late 1990s. The introduction of the National Minimum Wage (NMW) helped to raise wages at the bottom of the distribution. Figure 2 presents real hourly wages at the 10th, 50th and 90th percentiles for the period 1997–2010 from the Annual Survey of Earnings and Hours (ASHE). Real hourly wages grew at all percentiles over this period, but what is striking here is that the 10th percentile grew faster than the median and even faster than the 90th percentile. In terms of hourly wage differentials, the UK experienced a compression of pay differentials for the first time in decades. Since the National Minimum Wage only directly affects about 5 per cent of workers, the impacts at percentiles below the 10th are even greater, with the differential between the 5th and 50th falling even faster. Another key point to notice from this figure is that real median hourly wage growth has been essentially flat since about 2003. This may well have implications for changing poverty rates since then.
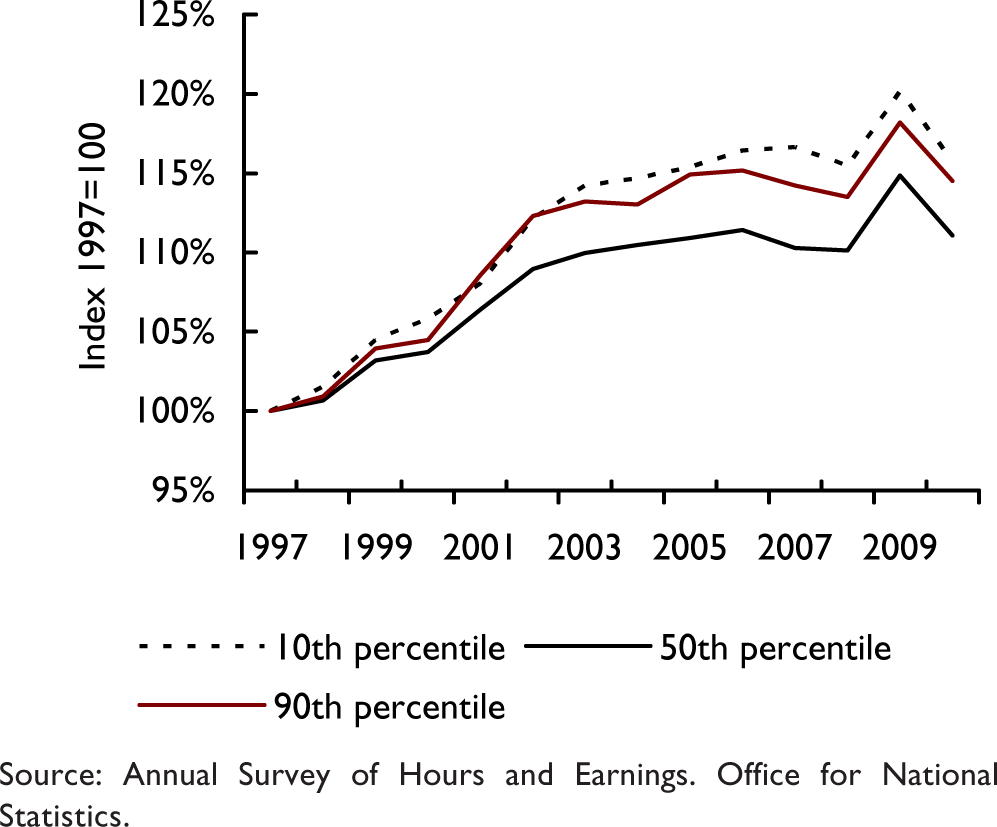
Real hourly wages 1997–2010
The story on wages is somewhat different if one examines weekly wages instead, as hours of work are changing in different ways at the bottom and top of the pay distribution. Median real weekly wages grew up to 2003 but have since been unchanged. In contrast to hourly wages, weekly pay differentials in the bottom half of the pay distribution have been unchanged over this time period. Wages at the 90th percentile have diverged further (Machin, 2011). The NMW is likely to have contributed to wage compression at the bottom of the hourly pay distribution, and may have stemmed the rise in weekly differentials.
The final factor that is likely to have a large impact on child poverty is government benefits. The welfare reforms increased benefits for families with children who are both in and out of work. Table 1 presents the real mean weekly benefit receipt by household type and by the earnings level of the household. Results are presented for couples with and without children and single adults with and without children, and for households with zero earnings, under £150 a week, £150-£300 a week and over £300 a week. Benefits for households with children are substantially higher. The mean benefit amount for a single parent who is not working in 2007–9 is £245, which is close to the relative poverty threshold for a single parent with one child. Benefits for those out of work have increased substantially since 1997. Workless single parents have experienced a real increase in their benefits of 17 per cent, while workless couples with children had a 9 per cent real increase.
Average benefit receipts by household type and earnings (per week)
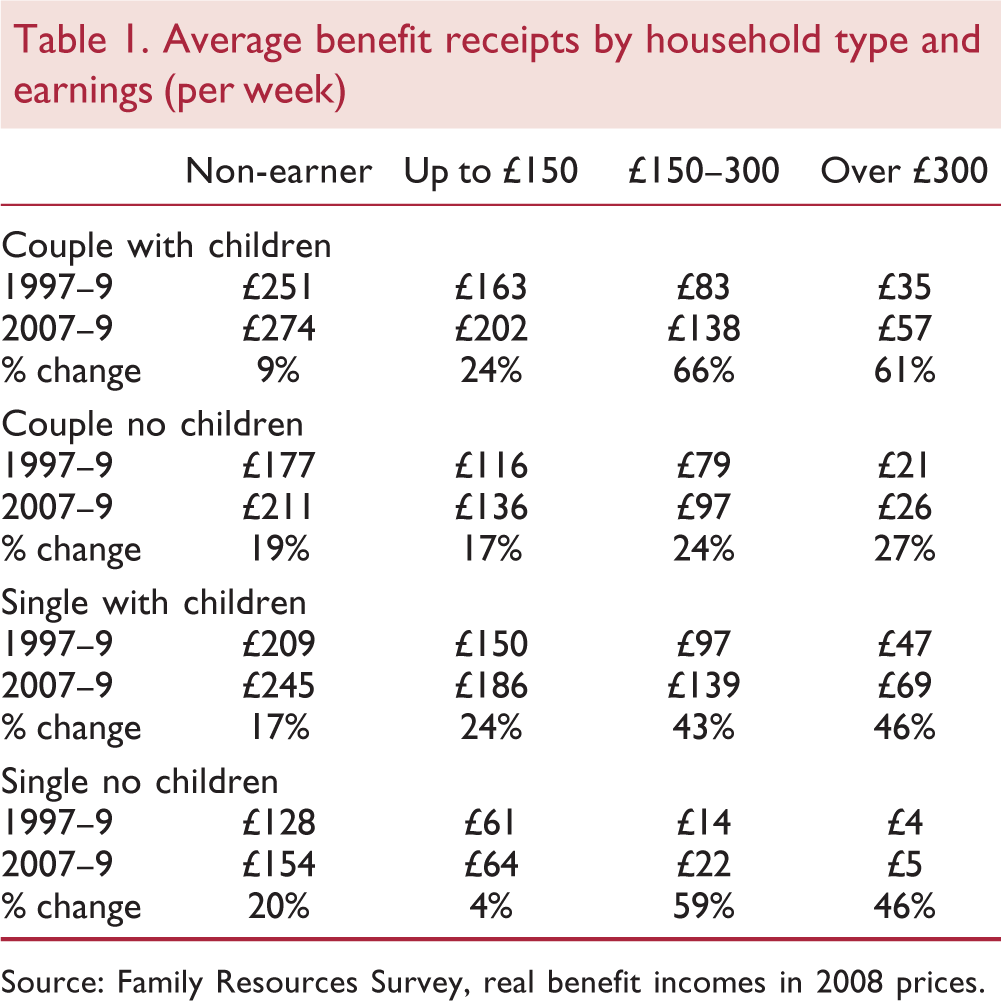
Source: Family Resources Survey, real benefit incomes in 2008 prices.
But the most striking finding in this table is the substantial increases in benefits to those working households with children. These increases tend to extend some way up the earnings ladder. Couples earning under £150 a week saw a 24 per cent real increase in their inwork benefits, while those in the £150-£300 band received a real increase of 66 per cent. Among single parents in these two earnings brackets, real benefits increased by 24 and 43 per cent respectively. The welfare reforms under Labour provided substantial increases in benefits, particularly for those in work.
3.2 Impact on child poverty
The period 1997 to 2010 saw increases in work, falls in wage inequality at the bottom and increasing generosity of benefits. So what happened to child poverty? Figure 3 presents relative and absolute child poverty for the period 1996/7 to 2009/10. Relative poverty here is defined in terms of 60 per cent of contemporary median income. Absolute child poverty is defined in terms of 60 per cent of the real median 1998/9 income. We see that child poverty fell, but not by as much as had been hoped. Over the period relative child poverty fell from 26.7 per cent to 19.7 per cent, or by some 800 thousand children. These falls are of course welcome but poverty among children would have to fall another 900 thousand in just one year to achieve the Labour government's target of halving child poverty over ten years (Jin et al., 2011). Much of the progress over this period was made up to 2004/5 when there was a big drive to reduce child poverty and substantial resources were put into increases in benefits for families with children. However, from 2004/5, progress on relative poverty stalled and it actually increased again up to 2007/8. The government's priorities had changed somewhat with a greater emphasis on public services such as education and health. But once again progress on child poverty picked up and the last two years in office saw further falls of 100 and 200 thousand respectively.
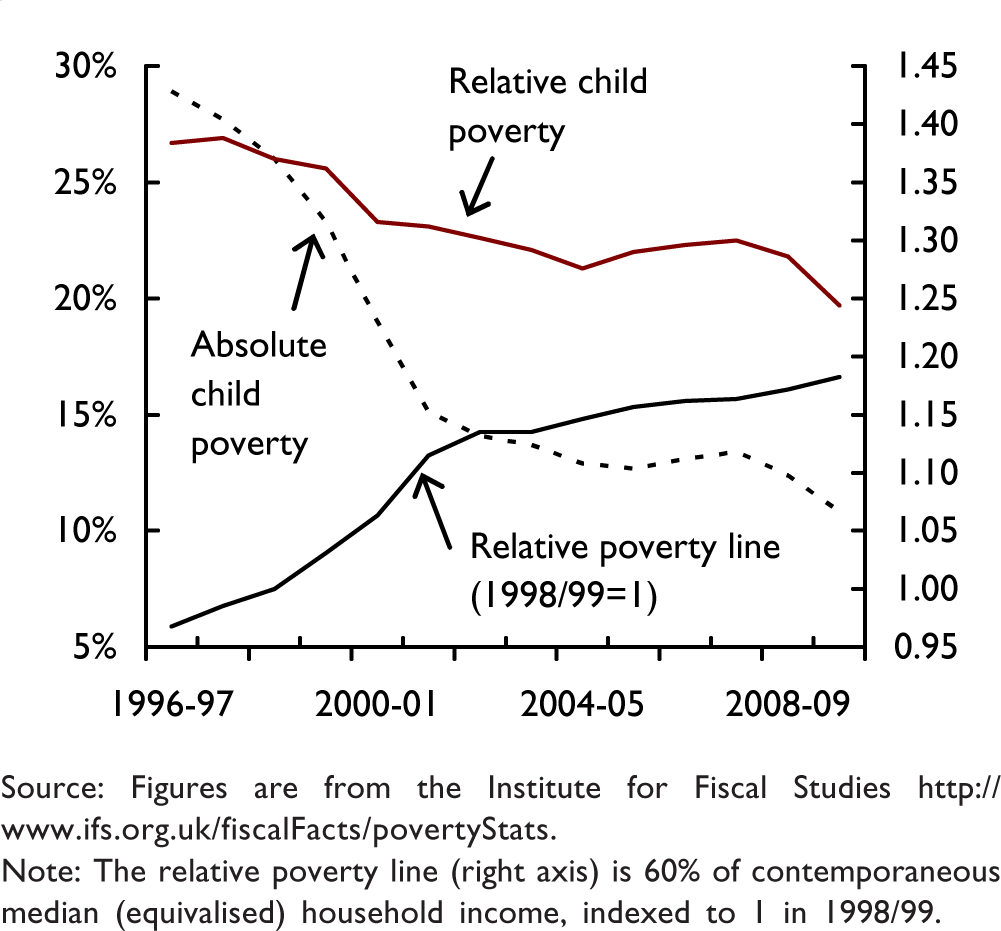
Child poverty rates
Part of the problem for New Labour was the strong growth in average real incomes over this period. With a relative poverty threshold the incomes of the poor have to rise faster than the middle classes for measured poverty to fall. This did happen over this time period but not by enough to meet the stringent targets set by Labour. However, in contrast to the period from 1979 to 1997, when relative child poverty rose sharply, the story here is very different. If we focus on absolute poverty we see a much larger fall from 28.9 per cent in 1996/7 to 10.8 per cent in 2009/10. This reflects a substantial increase in the real incomes of the poor over this period.
How do these falls compare across household types? Figure 4 presents relative and absolute child poverty rates for children living in couple or single parent households. Perhaps not surprisingly the poverty experience of children in single parent households is very different from that in couple households. In 1996/7 nearly half of all children in single parent households were living in relative income poverty. This equates to about 1.5 million children. This poverty rate has seen an impressive fall over this period. The pattern of fall reflects that in figure 3 for overall poverty. Most of the fall occurred up to the mid-2000s. It then rose slightly but in the last year to 2009/10 registered an impressive 6 percentage point drop from 34 to 28 per cent. Absolute poverty among children living with single parents fell even faster as real income grew strongly. Between 1996/7 and 2009/10 the number below 60 per cent of the 1998/9 median had fallen from 52 per cent to 12 per cent. Poverty rates among children in couples are somewhat lower but the gap between these groups has narrowed as the fall has been more muted here. Between 1996/7 and 2009/10 relative poverty fell from 21 per cent to 17 per cent while absolute poverty fell from 22 per cent to 10 per cent among children in couple households. Given these different changes for children living in different household situations we may expect to see different factors affecting the falls observed here.
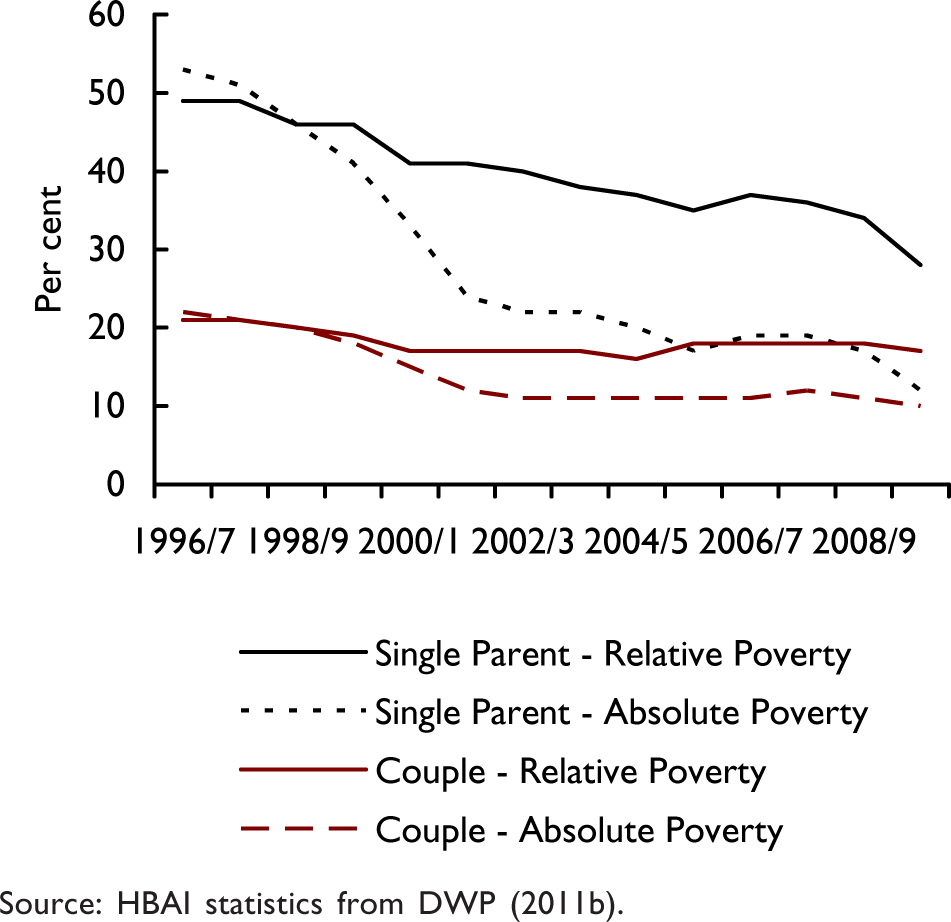
Child poverty by household type
Finally, let us look at the broader measures of poverty introduced in the Child Poverty Act. The measure of material deprivation which captures quality of life measures for children is combined with a low income measure. A score from 0 to 100 is awarded for material deprivation on each measure (0 being deprived and 100 not). An aggregate score of less than 25 combined with low relative income (now defined on 70 per cent median incomes) is used to create an overall index. This is reported in the first column of table 2. We have data from a baseline of 1998/9 and then every year from 2004/5 to 2009/10. The broader measure of childhood experience shows a fall from the late 1990s. In 1998/9 21 per cent of children were materially deprived. This fell to 17 per cent by 2004/5 and has since remained relatively unchanged. This fall suggests that the income improvements seen over this period have translated into real improvements in children's lives.
Broader measures of child poverty
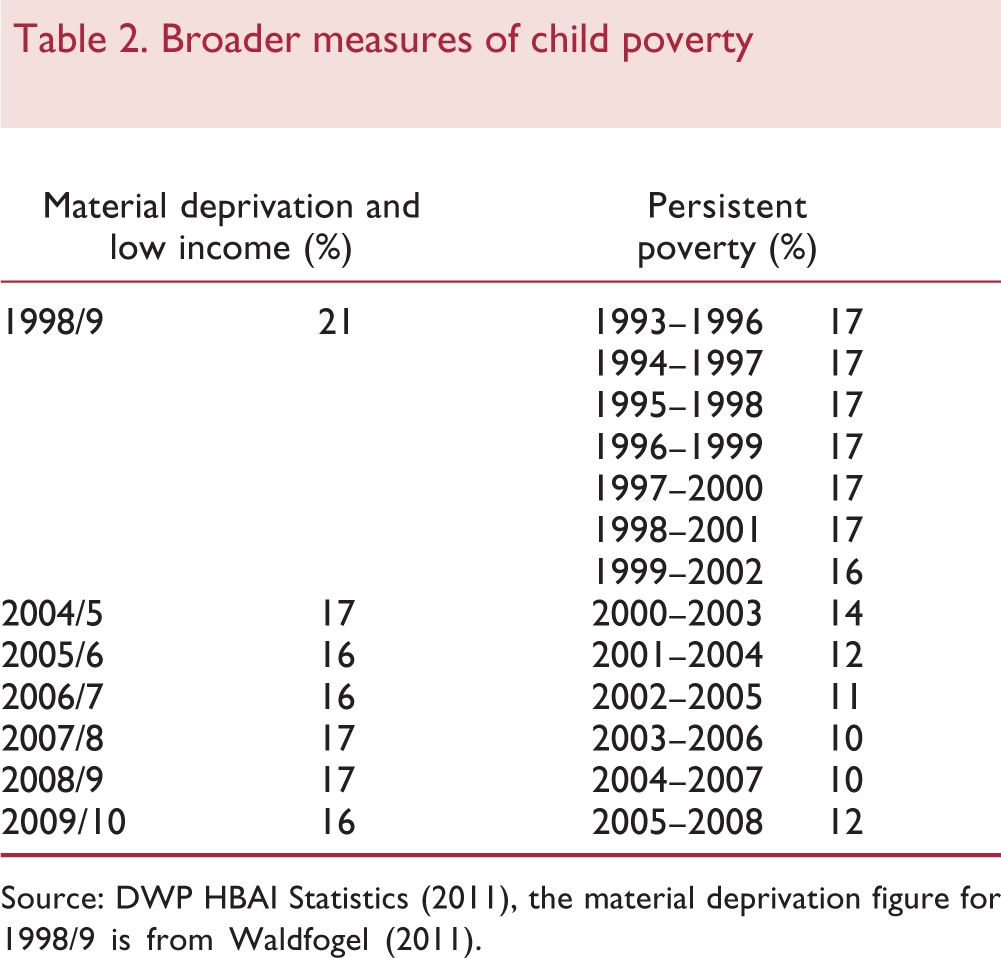
Source: DWP HBAI Statistics (2011), the material deprivation figure for 1998/9 is from Waldfogel (2011).
The second column of table 2 then presents the persistence of poverty measure. This is reported over a 4-year window as it reports the percentage of children in relative income poverty in three out of the past four years. The data for this come from the British Household Panel Survey, which tracks the same households over time. Given the smaller sample sizes in the BHPS, there may be an issue of sampling variability impacting upon the results. However, the broad picture is one of improvement in terms of persistent poverty among children. In the mid-1990s 17 per cent of children had experienced three years of poverty out of the past four years. By the late 2000s this had fallen to 10–12 per cent, indicating substantial improvements.
4. Factors affecting poverty
4.1 Decomposition methodology
Over the decade or so from 1997 we have seen large changes in work patterns among families with children, some reversal in wage inequality and substantial increases in benefits accruing to households with children. Why then have we only experienced modest falls in relative child poverty? The welfare reform package was predicted to reduce child poverty by much more. But these estimates largely ignore other changes in the labour market. In order to better understand these changes in child poverty I decompose changes into the major factors that affect family incomes. This enables one to estimate the contribution to child poverty of each of these factors. When the focus is on relative poverty, these factors can affect the poverty rate through two key mechanisms: by changing the incomes of the poor and by shifting the poverty threshold through changing median incomes. For example, increased wages may raise the incomes of the poor, reducing poverty, but may also shift up the poverty threshold, thus increasing poverty.
The method of decomposition employed builds on Dickens and Ellwood (2004). Total household income is comprised of income from employment, government benefits, other income, minus taxes. Employment income is, in turn, comprised of the hours worked multiplied by the wage rate for each adult in the household. The accounting identity below describes total incomes.
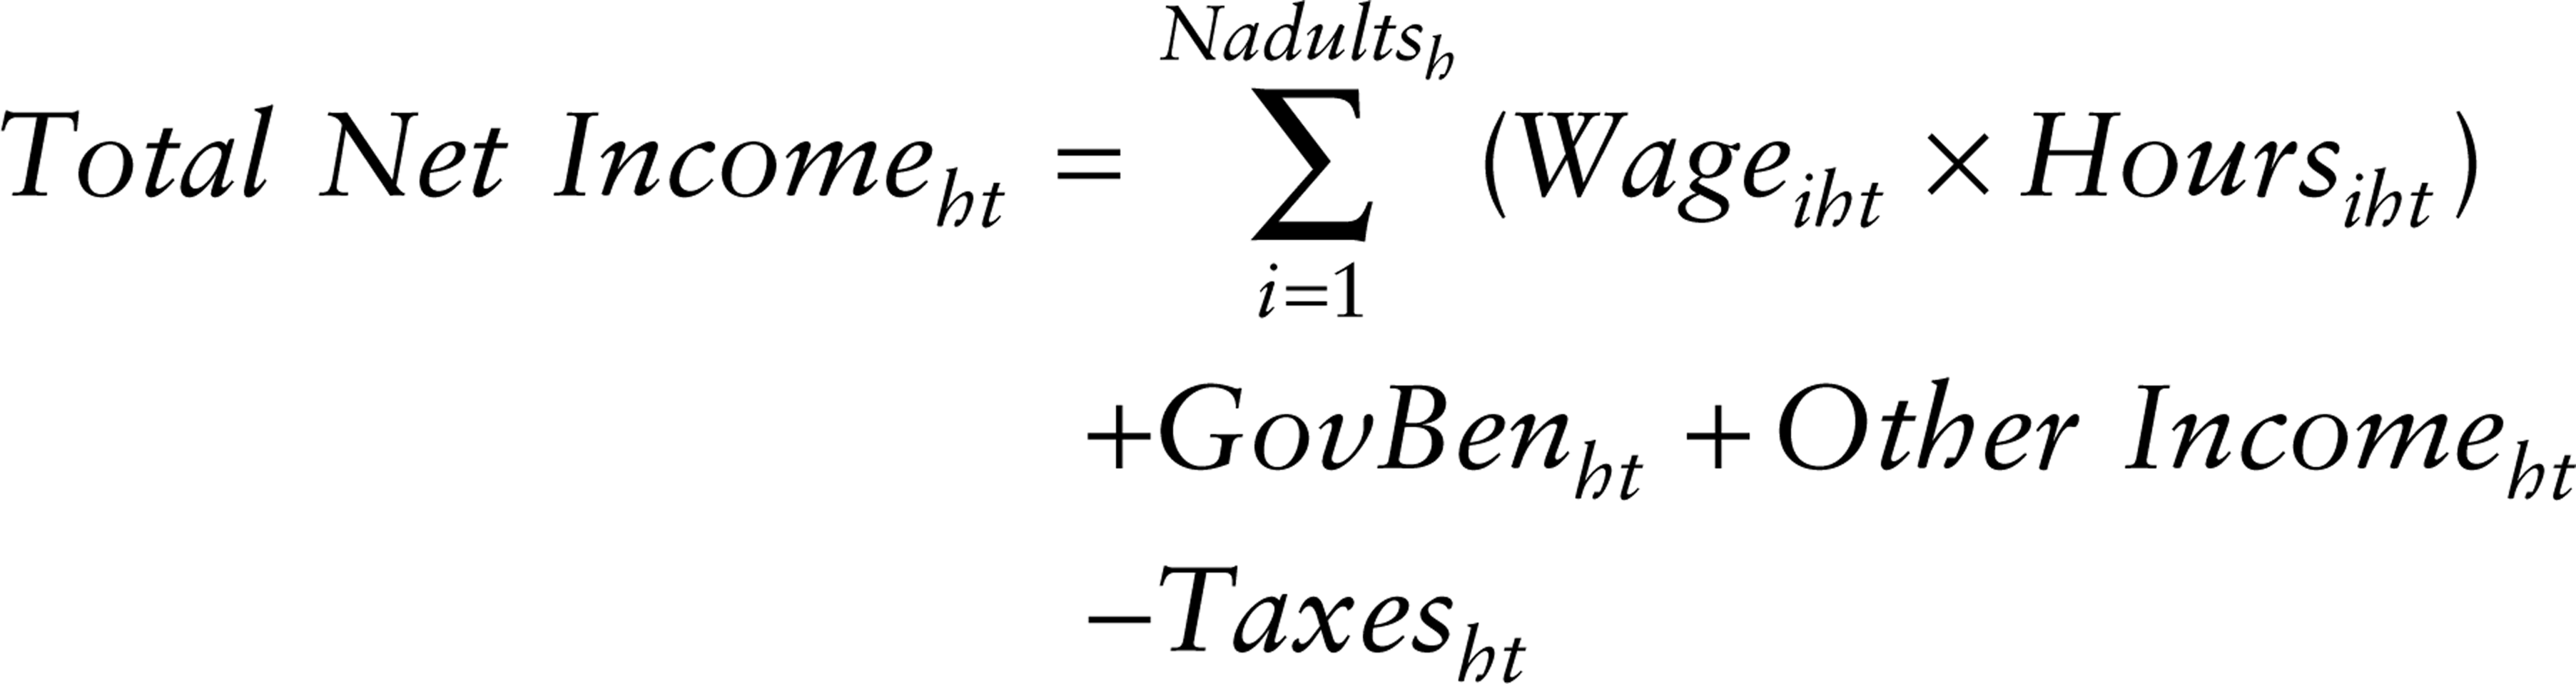
Separate models are estimated for wages, work participation, hours worked, benefits and taxes. Regression models for each of these factors are estimated for each year from 1997/8 to 2008/9 using data from the Family Resources Survey. These models then allow one to predict wages, work, benefits and taxes for each individual i in each household h and year t. Furthermore, one can also predict wages, work, benefits and taxes in each year t given some base year s specification for each factor. For example, one can estimate what household income and poverty would have been in 2007/8, given the wage structure from 1997/8. We can do this by predicting wages for those individuals in our sample in 2007/8 but using the parameters (and residuals) of the wage equation that we estimate in 1997/8. We can do the same with work. We predict the work status of those in 2007/8 using the parameters from the 1997/8 work equation. This allows one to ask questions such as “what would household income and poverty be in 2007/8, given the wage structure from 1997/8 or the work structure from 1997/8?”, and so on for all of the other factors. As such we can get an estimate of the contribution to changing poverty from each of these factors in turn.4
The decomposition approach is additive. I start by holding everything fixed to the base year, 1997/8. Then an individual's demographic characteristics, such as education, age and household type, are allowed to change to their actual 2008/9 structure. These will impact upon wages, work, benefits and taxes, holding fixed the underlying models for these factors. Changes in poverty here are assigned to changing demographics, arising from changing distribution of education, age and also household types. Next, both demographics and wages are allowed to change to their actual 2008/9 structure, while work, benefits and taxes are held fixed at their 1997/8 structure. This tells us the contribution of changing wages to child poverty. In fact, I allow wage effects to arise separately through median wage changes and then wage distribution changes. The other factors — work, benefits and taxes — are then changed to their 2008/9 structure in turn. Each time a different factor is changed to the actual 2008/9 structure, household incomes, the poverty threshold and the child poverty rate are recalculated. This approach provides us with an estimate of the contribution of each factor towards changing child poverty between 1997/8 and 2008/9.
4.2 What drove changes in child poverty?
Using the approach outlined above, table 3 presents the contribution to changing child poverty between 1997/8 and 2008/9 for relative and absolute child poverty. Both relative and absolute child poverty are 26.2 per cent in 1997/8. By 2008/9 relative child poverty had fallen to 21.1 per cent and absolute child poverty to 10.5 per cent.5 The results show some of the factors working to reduce child poverty and some of those increasing it. In fact, the same factors can have different impacts upon the relative and absolute measures of poverty as some factors may also impact upon median incomes which will change the relative poverty line.
Factors affecting changes in relative and absolute child poverty: 1997/8–2008/9
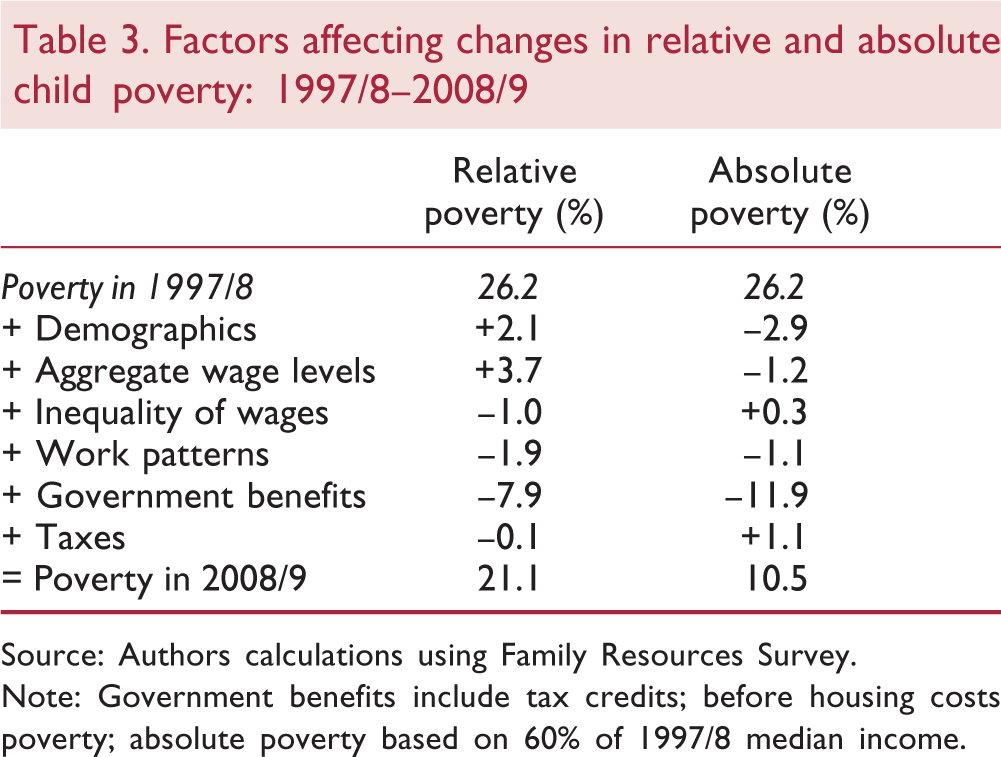
Source: Authors calculations using Family Resources Survey.
Note: Government benefits include tax credits; before housing costs poverty; absolute poverty based on 60% of 1997/8 median income.
Demographic changes have conspired to raise relative poverty; the relative poverty rate would have been 2.1 percentage points higher had only individuals% characteristics changed since 1997/8, and all other factors had remained at their base level. Changes in characteristics will impact upon wages and work patterns and possibly on benefit and taxes to some extent. The projected increase in child poverty here suggests they have changed in such a way that has favoured the median income household more than the poor. For example, while, in general, education has increased, there is a disparity in who obtains more education. This may well result in higher wage differentials or greater work propensity between middle income and poor households. The proportion of children in single parent households did not change very much over this period so is not likely to have had much of an effect on child poverty. The impact of demographic changes on absolute poverty is quite the reverse. Absolute child poverty would have been 2.9 percentage points lower due to demographic change. This suggests that while changes in characteristics such as education have raised the incomes of the poor, they have increased median incomes faster.
The second factor is wages. Here the decomposition breaks down wage changes into median growth and distributional changes in wages. The median component assumes all those in work receive the growth in median wages over this time period. The distributional component then adds in the actual wage change at all points in the distribution. The increases in median wages, that we observed in figure 2, have pushed relative child poverty upwards by 3.7 percentage points. It seems likely that the mechanism here is that median wage growth raises the relative poverty threshold. Median wage growth is likely to increase the income of the middle class households by more than poor households since they are more likely to contain a worker.
Changes in inequality of wages have worked to reduce relative child poverty by a modest amount of 1 percentage point. The faster growth in 10th percentile hourly wages compared to median we observed in figure 2 benefited the poor more than middle class households, reducing child poverty. Much of this change can probably be attributed to the National Minimum Wage.
The next factor is work. We saw in figure 1 a significant drop in the number of children in workless households, particularly among single parent households. This translated into a 1.9 percentage point fall in relative poverty and a 1.1 percentage point fall in absolute poverty. So despite these increases in work, we do not see a substantial impact on child poverty. What this is telling us is that the sort of jobs that those in poor households have been getting over the past decade or so do not pay enough on their own to raise households over the poverty line. This is disappointing, since the New Labour strategy, and now that of the coalition government, is to reduce poverty through increases in work. This strategy is likely to fail without improving the wages obtained or pay progression in these jobs.
The big driver of reduced child poverty is government benefits. Changes to the benefit regime reduced relative poverty by 7.9 percentage points and absolute poverty by 11.9 percentage points. The increased generosity of benefits we observed in table 1 resulted in increased incomes for households with poor children. Note the figure here captures both changes in in-work and out-ofwork benefits. So while work alone may not push a household over the poverty line, work plus tax credits does. Furthermore, increased out-of-work support to families with children has also pushed many above the poverty line. The large fall in relative child poverty suggests that the benefit changes have been well targeted.
Finally, tax changes (other than tax credits) have had a modest impact on child poverty. There have been a number of changes in taxes since 1997 which have reduced the burden of direct taxes on low income households. The basic rate was cut in 1999 and 2007 and the lower rate reduced to 10 per cent, although this was later scrapped. The overall impact we would expect is not clear as these changes will also impact on median incomes. The estimated impact of tax changes is minus 0.1 percentage points on relative poverty and plus 1.1 percentage points on absolute poverty.
The results here show the overall impact of these factors on child poverty between 1997/8 and 2008/9. However, we saw in figure 3 that the inroads made into reducing child poverty varied from year to year. In particular, most of the fall in child poverty occurred up to 2004/5 after which it increased slightly for a few years before falling again. Figure 5 presents results from performing the same decomposition on relative poverty for each year, compared to the base year of 1997/8. This allows us to see which factors were impacting upon child poverty in different years. The figure reports the overall change in relative child poverty for each year compared to the 1997/8 rate, and the contribution of each factor to that change. Factors with bars above zero are working to raise child poverty, while those below are reducing it.
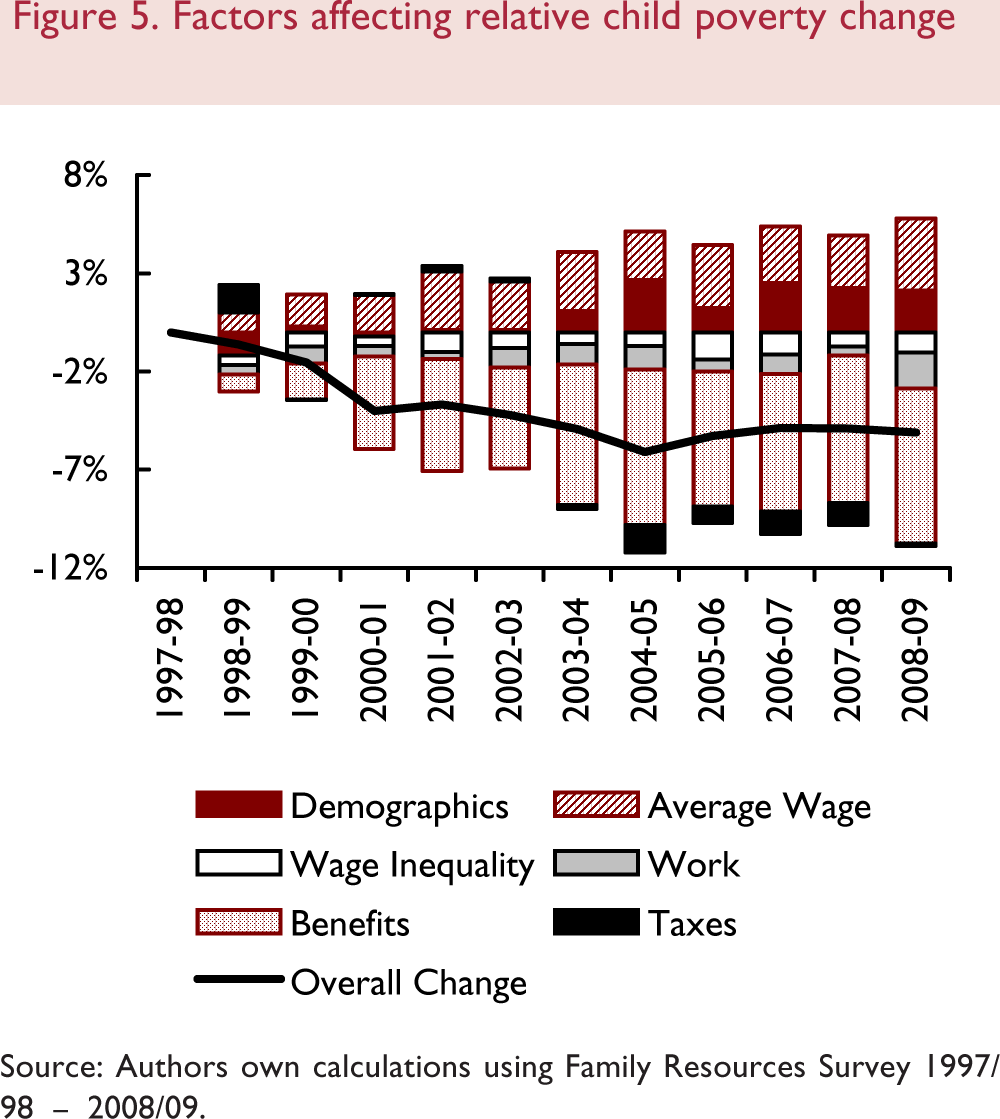
Factors affecting relative child poverty change
Right from the late 1990s median wage growth was pulling up the child poverty rate. In figure 2 we saw strong growth in real median wages up to about 2003, after which point real growth stalled. This increase in median wages has driven up the difference in incomes between the poor and middle income households. The contribution of median wage growth to child poverty has remained at this level since about 2002/3 as median growth has flattened. Change in government benefits has been the big factor pushing down child poverty. The role of benefits increased each year up to about 2004/5, with substantial increases in the generosity of Tax Credits and Child Benefits. After this point, the government appeared to ease up in the fight against child poverty and the role of benefits has remained constant since then. However, beginning in the mid-2000s, demographic changes have been pulling up child poverty. This is why we see increases in relative poverty up to 2007/8.
4.3 Poverty decompositions by household type
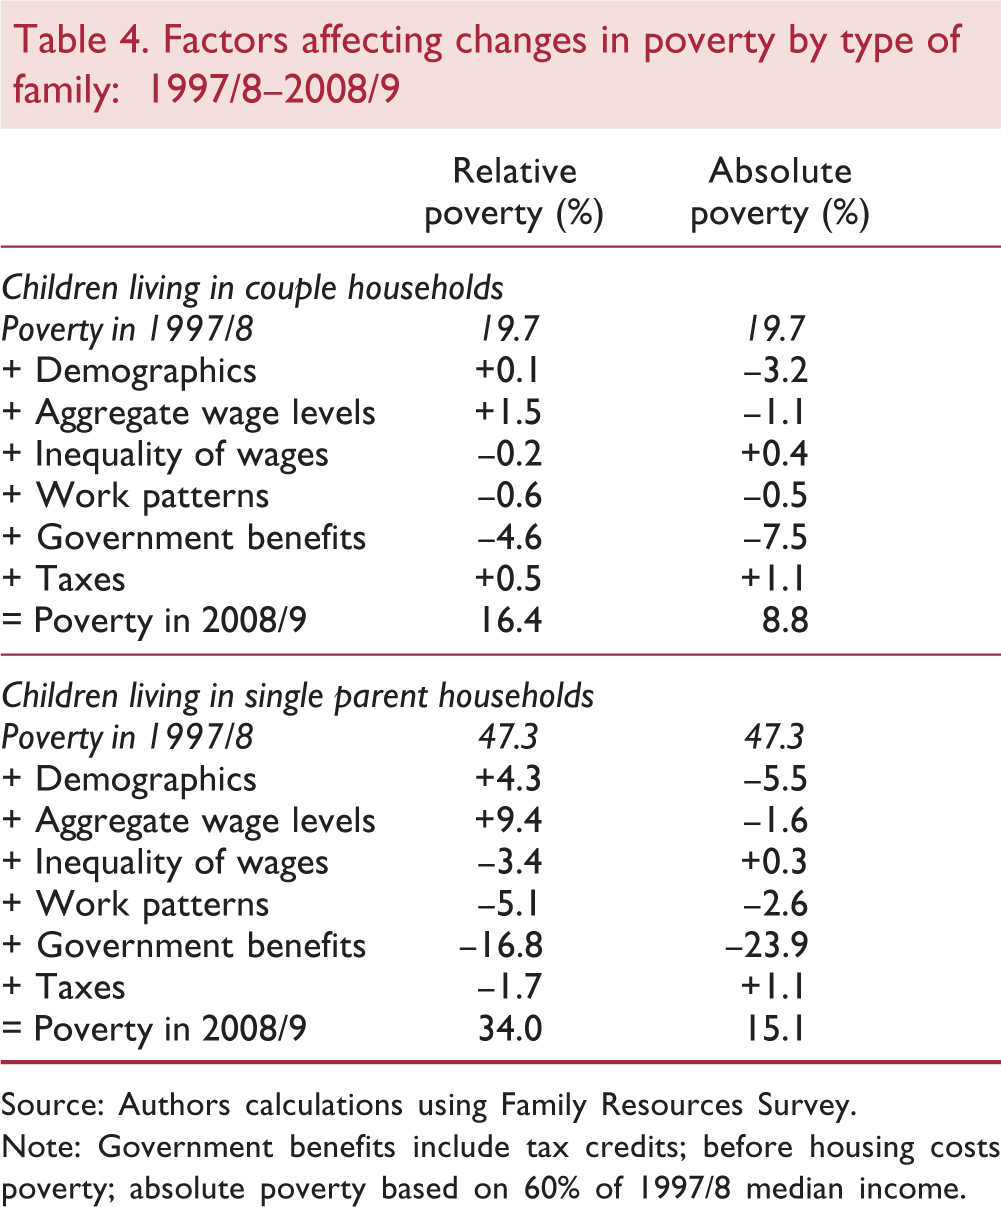
We saw above how poverty rates had fallen by most for the children of single parents with a dramatic fall from almost 50 per cent in 1996/7 to 28 per cent in 2009/10. In addition, work patterns changed most sharply for single parents, with a 10 percentage point increase in their employment rate. Consequently, one may well expect the role of the different factors on child poverty to be different for single parent and couple households. Table 4 reports results from this decomposition for children in these two household types.
Factors affecting changes in poverty by type of family: 1997/8–2008/9
Source: Authors calculations using Family Resources Survey.
Note: Government benefits include tax credits; before housing costs poverty; absolute poverty based on 60% of 1997/8 median income.
We do indeed see some striking differences between children in single parent households and those living with couples. Among children in couples we see a modest overall drop in relative poverty from 19.7 per cent to 16.4 per cent. Average wage growth is pushing up poverty among this group by 1.5 percentage points but the other factors are not having much impact at all. Only changes in government benefits play a role here, reducing child poverty by 4.6 percentage points. The increased generosity of in-work and out-of-work benefits we observed in table 1 is responsible for this fall.
Among children in single parent households we see much larger changes. The relative child poverty rate has fallen by 13 percentage points. Relative child poverty in single parent households would have fallen by more than this, were it not for the offsetting effects of demographic change and average wage increases. These two factors drove up relative poverty by 4.3 percentage points and 9.4 percentage points respectively. Changes to hourly wage inequality have helped to reduce relative child poverty among this group by 3.4 percentage points. Interestingly, the work changes we have seen among this group do seem to have had an impact reducing relative child poverty by about 5 percentage points. This suggests that job creation among single parents has had a substantial impact on child poverty. However, on its own it would have only reduced child poverty from 47 per cent to 42 per cent. Once again the major impact comes from government benefits. The greater generosity of benefit payments to single parents has reduced the relative child poverty rate among these households by 16.8 percentage points.
These falls in relative poverty represent large changes in the real incomes of poor children living in single parent households. But with a relative poverty measure incomes have to rise faster than the median so that overall poverty falls are dampened down. These substantial real income rises mean that the absolute measure shows a dramatic fall of over 30 percentage points. Now demographic change, wages and work all help to bring absolute poverty down. But the main driver of reduced poverty is again increased benefit payments, contributing a huge 24 percentage points to this fall.
4.4 Implications of these decompositions
There is no doubt that the real incomes of children in poor households have risen substantially during Labour's spell in office, as witnessed by the substantial fall in absolute child poverty. This alone should perhaps be seen as a significant achievement. Poverty rates in the US are defined in absolute terms with reference to a subsistence bundle of goods. The US has not experienced anywhere near these sorts of falls in poverty (Waldfogel, 2010). However, New Labour made a commitment to abolish relative child poverty, and this is a much harder task to achieve. Economic growth and increases in educational attainment tend to raise average incomes by more than the incomes of the poor. To some extent those on low incomes are running up the down escalator. They have to run hard just to stand still and fight much harder to close the gap with the middle classes if average incomes are rising.
The decompositions presented here help us to understand what might have happened to child poverty had the government not implemented the welfare reforms we saw in the late 1990s. We saw that the combined impacts of benefit and tax changes reduced relative child poverty by some 8 percentage points. The counterfactual suggests that without these reforms the poverty rate in 2008/9 would have actually risen to 29 per cent rather than fallen to 21 per cent. This translates to an extra 1 million children in poverty. The numbers for children in single parent households are even greater. The impact of tax and benefit changes led to an 18.5 percentage point fall in relative child poverty. Had the reforms not been introduced then poverty would have risen to 52 per cent due to the impact of demographic and wage changes. This would have left an extra 600,000 children in single parent households in poverty in 2008/9 than we actually had. Note that since these estimates only capture the direct impact of tax and benefit changes on income they are likely to understate the overall effect on child poverty. Tax and benefit reforms had an indirect effect in that they undoubtedly also increased work, which in turn helped to reduce child poverty. This indirect effect is not captured in these counterfactuals. The implications from these counterfactual exercises are that future efforts to tackle child poverty cannot ignore underlying changes in inequality. The lessons here may well be important for the coalition government in their drive to meet the targets set out in the Child Poverty Act.
5. Prospects for the future
5.1 How to measure poverty
The current coalition government now faces an uphill task to achieve significant reductions in child poverty whilst also making inroads into the fiscal deficit. The previous Labour government devoted significant financial resources to tackling child poverty. This has probably got them about half way to achieving their target of halving relative child poverty by 2010/11 but still leaves another 900,000 children to go. Their performance on absolute poverty was much better. This more than halved over their period in office. The realisation that the relative poverty targets are incredibly difficult to meet is probably partly responsible for the shift to a broader set of measures in the Child Poverty Act of 2010. But the shift is also in recognition of the fact that targeting children to get them just over an arbitrary poverty line may not be the most efficient way to raise childhood experiences and life chances. The introduction of the persistence measure and the material deprivation measure were designed to capture this to some degree.
The current government has taken this shift away from pure income measures of poverty further still. The Child Poverty Strategy published earlier this year argues that income measures of child poverty, “do not tell the full story about the causes and consequences of childhood disadvantage.” The argument is made that the Labour government was fighting the symptoms of poverty rather than the causes. It makes the commitment to tackle the “root causes of poverty and not just the symptoms” by “recognising the importance of the context in which a child is raised…”. Consequently, the current measures will be extended to include other indicators of childhood disadvantage and life chances. In terms of income measures, the four key indicators set out in the Child Poverty Act are retained but in addition a further indicator of severe poverty is introduced. Four new indicators of family circumstances are also introduced: the proportion of children in workless households, the proportion in a working poor household, the proportion of 18–24 year olds in education or training and the proportion of 18–24 year olds who are NEETS (Not in education, training or employment). In addition, a range of indicators of life chances has also been proposed. These are designed to measure longer-term indicators of disadvantage, for example, the birth weight gap between high and low social classes, progression in education, teenage pregnancy, youth offending and family structure, etc.
The introduction of broader measures of childhood experience must be welcomed as they enrich our knowledge. However, there is a danger that these measures detract from income as an important factor in children's lives. The previous targets had at their heart a belief that income alone may not be sufficient to raise the quality of children's lives but that a good quality of life requires a good standard of living. Indeed, we have seen that increases in income have resulted in lower levels of material deprivation among children. Furthermore, there is evidence that income poverty does matter to outcomes and is not itself just a symptom of past failings. For example, Waldfogel (2010) and Dickerson and Popli (2011), show that income poverty impacts upon early cognitive development. Gregg et al. (2006) find that the welfare reforms of the previous government raised expenditure of children's goods such as clothing, fresh fruit, books, etc. And Gregg et al., 2009) report improvements in outcomes of school attendance, mental wellbeing and aspirations for adolescents living with single parents. So, while the new indicators set out in the Child Poverty Strategy are a welcome addition, there does already appear to be significant evidence that income matters to outcomes. Consequently, while the coalition government's assertion that income poverty may be a symptom of a parent's own poor childhood experience, there is a substantial amount of evidence to show that income poverty in childhood has a causal impact on outcomes for future generations.
5.2 Routes out of poverty
Similar to the welfare reforms of the previous Labour government, the new strategy also has employment growth at its heart. In the introduction to the Strategy document, Ian Duncan Smith states that, “work, not welfare, is the best route out of poverty for those who are able to work”. The introduction of the new Universal Credit is designed to promote work by increasing incentives. The new system combines a large number of different benefits into a single benefit. Universal Credit reduces the rate at which benefits are withdrawn as earned incomes increase. This will both raise incomes directly, as households should be better off at a given earned income, and may raise income through increased work participation and hours. It is also hoped that the simplification of benefits will lead to a greater take-up of benefits individuals are entitled to, thus raising incomes further. The government estimates the introduction of the Universal Credit will reduce child poverty by some 350,000 (HM Government, 2011).
However, some caution is required here in placing too much weight on work as the key route out of poverty, particularly relative income poverty. Firstly, the results above suggested that the substantial reforms of the last government did increase work among households with children, but that these didn't translate into large reductions in poverty as earnings alone were not enough to push significant numbers over the poverty threshold. Only for single parents, whose employment rate increased by 10 percentage points, did we see impacts of work changes on relative poverty. Secondly, the child poverty landscape has changed somewhat with a greater proportion of children in poor families who have someone in work. The HBAI figures for 2009/10 show that 55 per cent of poor children are in households where someone is in work. This compares with 43 per cent in 1996/7. Poverty has become more associated with work. This means that the scope to increase work further among those on low incomes may be more difficult now than in 1997. Many of those poor children in non working households are in single parent households. In addition, a substantial proportion of these have a large number of children or have younger children (Dickens, 2011). This is likely to limit the scope for increasing work as childcare becomes more of a barrier to entering work. For those poor children in working households most are in couple households often with only one adult in work. This may suggest some scope to increase work through the addition of a second earner. However, a high proportion of these households also have young children or a large number of children. In addition, the Institute for Fiscal Studies estimates that the introduction of Universal Credit is likely to reduce work incentives among second earners which may further hinder efforts to reduce poverty through work (Brewer, Browne and Jin, 2011).
5.3 Medium-term projections for child poverty
The cornerstone of the coalition government's child poverty strategy is the introduction of Universal Credit. The government's own predictions from this are that increased entitlements due to the lower withdrawal rate, and higher take-up due to simplification will result in a 350,000 fall in relative poverty. The increased generosity of benefits arising from the full implementation of Universal Credit is estimated at £2bn. On these terms the coalition government's strategy is not so different from that of New Labour, who also increased benefit generosity to target child poverty through increases in tax credits and child benefit.
However, in contrast to the previous government, the coalition government is also implementing a large number of other changes to the benefit system that in general will reduce the benefits of those on low incomes. Child Benefit and Tax Credits face real-term cuts. There are planned cuts to Housing Benefit with the introduction of a cap. Also, benefits are to be up-rated in line with the Consumer Price Index (CPI) rather than the generally faster growing Retail Price Index (RPI). The IFS estimates that these changes will result in higher child poverty over the years to come (Brewer et al., 2011). Relative child poverty is actually projected to fall over the next year as we enter a period of falling real median incomes, which shift down the poverty threshold. But as the proposed benefit cuts kick in, the estimates are that it will rise up to 2.9 million (22.0 per cent) in 2015 and up to 3.2 million (24.4 per cent) by 2020. Because real median incomes are falling faster than the incomes of the poor, we find ourselves in the unusual situation where absolute poverty is set to rise faster than relative poverty. The IFS estimates that an extra 800,000 children will fall below the absolute poverty threshold by 2015, and in doing so will experience a real terms fall in their living standards.
The Child Poverty Act (2010) commits the government to a set of child poverty targets to be achieved by 2020. These currently include the four indicators outlined above. One of these is the attainment of a relative poverty rate below 10 per cent. The current raft of coalition government policies with regard to benefits is likely to increase relative child poverty over the next few years, making this target harder to achieve. One ray of hope for getting closer to the relative poverty target is that the continuing rise in underlying inequality, which we have seen in the UK for the past decades, is finally slowing down. Stagnant real wages since the mid-2000s may reduce the rate of growth of the relative poverty threshold making poverty reductions easier. What is not yet clear is how the coalition government's proposed new indicators of child disadvantage are to be incorporated into the child poverty targets for 2020. While these new measures are welcome, it would be a mistake to water down the significance of the relative income measure and allow the gains made over the past decade on child poverty to erode away.
Footnotes
1
2
Provision was initially for 12.5 hours per week for 38 weeks of the year for 4 year olds only. It was extended to 3 year olds in 2004 and was extended to 15 hours in 2010.
5
Note this is slightly different from the Official HBAI numbers. The figures here are for Great Britain, while the official numbers are for the UK. In addition, I do not have access to council tax information that is used to derive net income in the official figures.