Abstract
Against the background of the increasing services content of many manufactured goods, the paper attempts to assess the role of (domestically and internationally) purchased service inputs for the relative export performance of countries in a particular manufacturing industry. It estimates an empirical model of export market shares for EU15 countries and twelve disaggregated manufacturing industries over the period 1995 to 2007. Whereas most traditional explanations are based on the influence of relative costs and technology-related variables, this paper emphasises the importance of services as a determinant of both product quality and the sectors' productivity. The service linkage variables are based on national input–output tables. The analysis finds a positive and highly significant impact of services on export market shares of manufactured goods. Distinguishing between domestically-sourced service inputs and imports results in a robust and highly significant impact of international service linkages, while the analysis finds no impact of domestic service linkages.
1. Motivation
With a share of about 70 per cent of total employment, the service sector is the largest and most important sector in developed economies. Many services are also vital intermediate inputs for other goods and services and thus can have a significant impact on the productivity and growth of many other sectors of the economy, as well. Services are also increasingly used as an instrument of product differentiation. Hence, competition takes place less and less on the basis of the manufactured good itself, but on the package of services that comes with the good (planning, consulting, maintenance and repair, personal instruction and training, etc). As a result, manufactured goods are increasingly exported as system packages with a high service content to enhance market success.
Falk and Jarocinska (2010) survey the literature and provide statistical evidence of an increasing services content of manufactured goods. This paper presents new evidence on the increased use of purchased services in manufacturing which is based on Eurostat input–output tables. The key focus of the analysis, however, is to assess the role of services in the relative export performance of a country in a particular manufacturing industry. The analysis is related to the corresponding technology and trade literature, as well as that concerned with quality and trade. This paper adds a new dimension by focusing on the role of services used in manufacturing industries. Conceptually one may think of two main routes through which services may impact on export performance. First, services tied to and supporting the production process of manufactured goods may raise labour productivity and have a cost reducing effect. Second, services may adopt a ‘product supporting’ role (marketing, distribution, transportation, maintenance and repair, personal instructions and training for the customers, etc.) and be used as an instrument for product differentiation. This second role is the focus of the paper and we interpret the services content of manufactured goods as similar to an increase in (perceived) quality, in the sense that additional service inputs shift the demand curve for a good to the right. We also test for a differential impact across different types of service inputs and distinguish between knowledge-intensive service industries (KIBS) and other service categories as well as domestically sourced and imported service inputs. Static as well as dynamic versions of the empirical model are estimated. We apply ordinary least squares (OLS) and robust regression on long differences of the variables in logs and additionally apply the fixed effects estimator as well as system GMM to check the robustness of the results.
The remainder of the paper is organised as follows. The next section starts with a short review of the literature. Section 3 outlines the theoretical background and section 4 introduces the empirical model and describes the data used. Section 5 presents some descriptive statistics on the service content of manufactured goods in the EU15. Section 6 discusses the empirical results and the final section concludes with a summary of the most important findings.
2. Related empirical literature
The analysis of this paper is related to the technology and trade literature, as well as that concerned with quality and trade. In the empirical literature, relative export performance is usually explained by measures of relative costs/prices (unit labour costs) and measures reflecting technological advantages (R&D spending, innovation counts, patents). Fagerberg (1996) gives an overview of some of the earlier empirical works in the field. Most of this work suggests that differences in the technological capabilities of countries, technological spillovers from intersectoral linkages, and the international diffusion of innovation and technology are important non-price determinants of trade flows and relative export performance (e.g. Fagerberg, 1988; Magnier and Toujas-Bernate, 1994; Amable and Verspagen, 1995; Laursen and Meliciani, 2000; Wakelin, 1998; Salim and Bloch, 2009). To the author's knowledge, this literature has not so far considered the direct role of service inputs or service linkages on trade performance.
Landesmann and Pfaffermayr (1997) argue that research and development (R&D) enables a country to reach a better position in the quality spectrum of products offered on international markets. Works by Brooks (2006), Verhoogen (2008), Manova and Zhang (2009), Hallak and Sivadasan (2008) or Crozet et al. (2009), which are all based on firm-level data, establish a clear link between product quality and exporter performance; high-quality-producers export to more markets, charge higher prices, and sell more in each market. Overall, this literature's focus is on vertically differentiated trade – that is, quality specialisation within sectors. Again, none considers the possible role of services as a quality shifter.
Windrum and Tomlinson (1999) examine the impact of knowledge intensive services on productivity, but not on export performance. In particular, they measure the impact of material and knowledge inputs (from knowledge-intensive services) on productivity, specifying a labour based production function. This relationship is estimated for the UK, the Netherlands, Germany, and Japan. They find that while the UK experienced the strongest growth of service activities among the compared countries, the spillover effects of knowledge intensive industries on output and productivity is significant and higher in all of the other countries. It is highest in Japan. This result is explained by the strong linkages between services and non-services in all of these countries but the UK. From this, the authors conclude that “it is important to distinguish between a general increase in the representation of services within a national economy, and the degree of integration between services and other economic activity” (p. 14).
Others do not directly measure the service content of manufactured products, but focus on the impact of trade liberalisation in the service sector and spillovers from FDI inflows into the service sector on the performance of downstream users of services in manufacturing sectors. Arnold et al. (2006) again focus on productivity and base their calculations on firm level data from the Czech Republic. They find strong correlations between service sector reform and productivity in manufacturing sectors that rely on services as intermediate inputs – as well as a positive significant relationship between foreign presence in the service sector and the performance of downstream manufacturing.
Francois and Wörz (2008) examine the impact of business service openness and imports and total FDI inflows into the service sector on manufacturing export performance for a sample of 30 OECD countries in the period 1994 to 2004. They observe that manufacturing exports push indirect exports of producer services – in the form of inputs into manufactured goods – and further find that the service intensity of exports per capita increases with the income of countries. While they find no significant effects of service imports and business service openness on total manufacturing exports, their results do show a significant and positive impact of increased business service openness and imports on exports of technology-intensive manufacturing sectors like machinery, motor vehicles, chemicals, and electrical equipment. The impact of increased business-service imports is negative for labour-intensive industries like textiles, clothing, and leather, and there is no impact on resource-intensive industries.
3. Theoretical background
The econometric analysis in this paper is based on a specification of the export demand model that was first motivated by Fagerberg (1988) and further elaborated by others (Amable and Verspagen, 1995; Magnier and Toujas-Bernate, 1994) and was derived along the lines of the monopolistic competition models of the new trade theory models of Krugman (1983, 1989). It also builds on more recent theoretical work by Hallak (2006), Baldwin and Harrigan (2007), and Crozet et al. (2009), which explicitly takes account of product quality as a determinant of exporter performance. While the earlier literature specifically focused on the role of technology embedded in products and underscored the strategic role played by R&D rivalry between countries in international trade, the latter literature treats product quality in a broader sense, referring to all tangible and intangible features that influence consumers' economic valuation (Hallak and Schott, 2008). Let us briefly establish the theoretical framework guiding the empirical analysis.
The theoretical framework considered is based on the monopolistic competition model, with a Dixit-Stiglitz structure of preferences and quality included as a utility shifter. Worldwide consumer preferences for varieties (i) within a differentiated goods sector (j) are described by the following CES subutility index:
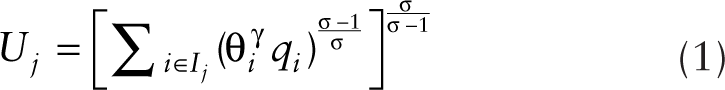
Ij is the set of varieties available in sector j and the terms qi and θ i denote the quantity and the quality of variety i in sector j. As in Hallak (2006), γ is a parameter reflecting the intensity of consumer preferences for quality, and σ>1 is the elasticity of substitution between varieties. Subutility Uj enters the total Cobb-Douglas type utility function with bj as the parameter determining the relevant budget shares. We will denote world expenditure on all varieties i in sector j by Ej which is given by multiplying the budget share by world income bj Y.
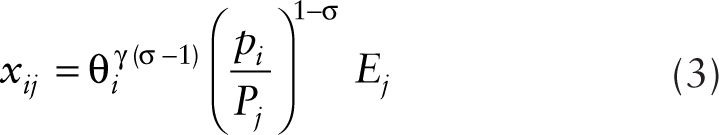
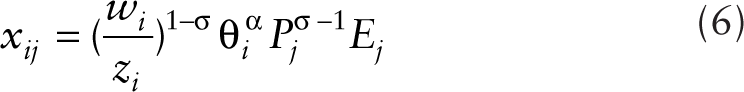
Under consumer utility maximisation, the value of world exports of variety i within a specific manufacturing sector j is given by:
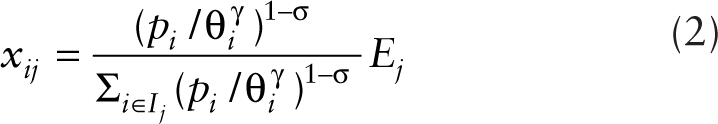
where pi denotes the price of variety i. If we denote the CES aggregate price index in the denominator in (2) with Pj, we have:
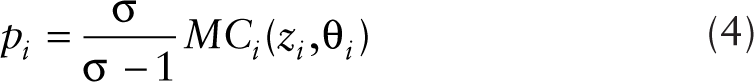
The production side of the model assumes monopolistic competition among producers. Producers are heterogeneous with respect to physical productivity zi in producing variety i. Furthermore, it is assumed that the marginal cost of production depends on the quality of the good produced; marginal cost is thus given by MCi(zi, θ i ). Profit maximisation within the framework of the assumed Dixit-Stiglitz CES preferences leads to prices for each variety that are a constant mark-up on marginal cost:
Thus, with constant mark-up pricing, quality impacts prices only indirectly via its effect on costs. If we denote the factor price index as wi, unit costs of production are given by wi/zi. Then, as in Johnson (2009), we assume the following functional form of the marginal cost function:

where β is the elasticity of costs with respect to quality. Combining (4) and (5) and inserting them into the export demand equation (3) gives export values for variety i within sector j as:
Where α = (σ–1)(γ–β) and is the elasticity of export values with respect to quality. We will assume that α>0 and, since σ>1, this implies that the marginal valuation of quality by consumers (γ) exceeds the marginal cost of quality to producers (β) and is a prerequisite that investment into quality pays off.
Below, we consider different countries (k) producing varieties in sector j for the world market. If country k produces Njk varieties in sector j and we assume that varieties in a given country enter symmetrically into equation (6), we can multiply (6) by the number of varieties to obtain the total value of exports of country k in sector j as a function of market size, costs, quality and world expenditure on goods of sector j:
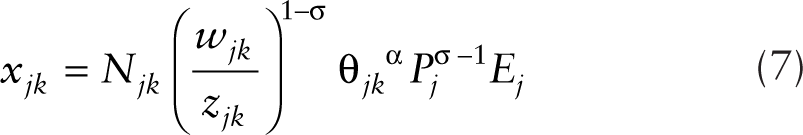
4. Econometric model and data
Equation (7) forms the basis for the empirical specification that relates country k's export market share in industry j to relative cost measures and measures of relative qualities. The model also suggests that the export market shares are determined by market size and competition effects captured by the relative number of firms. Note that within a given market – which is the world market in this paper – both the expenditure variable (Ej) and the price index (Pj) drop out of the calculation of country k's market share. Empirically, a measure of relative unit labour cost will proxy cost competitiveness. Furthermore, since product quality is not directly observable in trade data, in the empirical translation of the model, we will proxy quality by the innovative activity within a sector, which is an indicator most often suggested in the literature to be a crucial determinant of product quality. Most importantly, however, this paper will also add the service content of manufactured goods as an additional proxy for product quality and technological competitiveness. The main research question to be examined is whether manufacturing-sector service linkages contribute positively to the relative export performance of countries. The Eurostat input–output tables will be used to derive proxies for service linkages. For any given industry we assume that the market size and competition parameters are captured by fixed effects and common time effects as it is very hard to arrive at reliable measures of changes in competition at the country-industry-time level. 1
The main empirical model can thus be represented by the following equation:

where γjk and δt are country-industry fixed effects and common time effects, respectively. The error term ∊jkt, has zero mean and constant variance.
The left-hand-side variable, XMSjkt, measures the export market share of country k in industry j at time t. The data were taken from the UN COMTRADE database. The export market share for a particular industry is calculated by dividing the current dollar values of world exports of each country by the sum of the industry's exports for all countries in the sample. 2 RULCjkt denotes relative unit labour costs and proxies cost competitiveness. Unit labour costs are calculated by dividing labour compensation (in current USD) by value added in constant prices. The data on labour compensation and value added are taken from the OECD STAN and EUKLEMS databases. RPATjkt proxies technological competitiveness or innovation output. Following most of the literature on innovation, the patent counts data are taken from the United States Patent and Trademark Office (USPTO). Besides patents, R&D expenditures as an input into innovation have been commonly used in the literature. However, R&D indicators turned out not to be very robust in explaining trade performance and measures of innovative output, such as patents, have been seen as a superior measure for product quality, as they better signal whether past research was successful (Greenhalg et al., 1994 and the discussion in Carlin et al., 2001). We therefore preferred to use patents over R&D measures in this paper. 3
Finally, RServjkt measures the interconnectivity between the manufacturing sectors and the service sectors based on the Eurostat input–output tables. The service linkage variable captures all deliveries of services s to the manufacturing sector j. It is defined as follows:

where y js tk is a vector of purchases of intermediate service inputs of type s by sector j in country k at time t and y js tk is a vector of total output of industry j at time t in country k.
As we suggested in the introduction, a higher service intensity of a manufactured good is interpreted as similar to an increase in quality, in the sense that, like higher quality, additional service inputs shift the demand curve for a good to the right. One might think of a number of ways in which services may increase the quality or technology content of manufactured products. Many services (marketing, distribution, transportation, maintenance and repair, personnel guidance and customer training, etc) may be used as an instrument of product differentiation, thereby increasing the quality or perceived quality of the good in question. Other services series are important carriers and producers of knowledge and contribute to the diffusion of technology across sectors and countries. Specialised software, planning and product engineering, co-ordination, management and transportation services improve and bolster highly automated production processes and facilitate specialised, customised solutions as well as fragmented production processes that are outsourced across borders.
As is usual in the literature, all right-hand-side variables are measured relative to a weighted sample mean over the countries in the sample at any given time (denoted by ‘R’). The weighted sample average is constructed using the export market share of the jth industry in the kth country in 2000 as weights.
Tables A1 and A2 in the appendix provide more information on the definitions and the main data sources of the variables used in the econometric exercise.
List of variables(a)
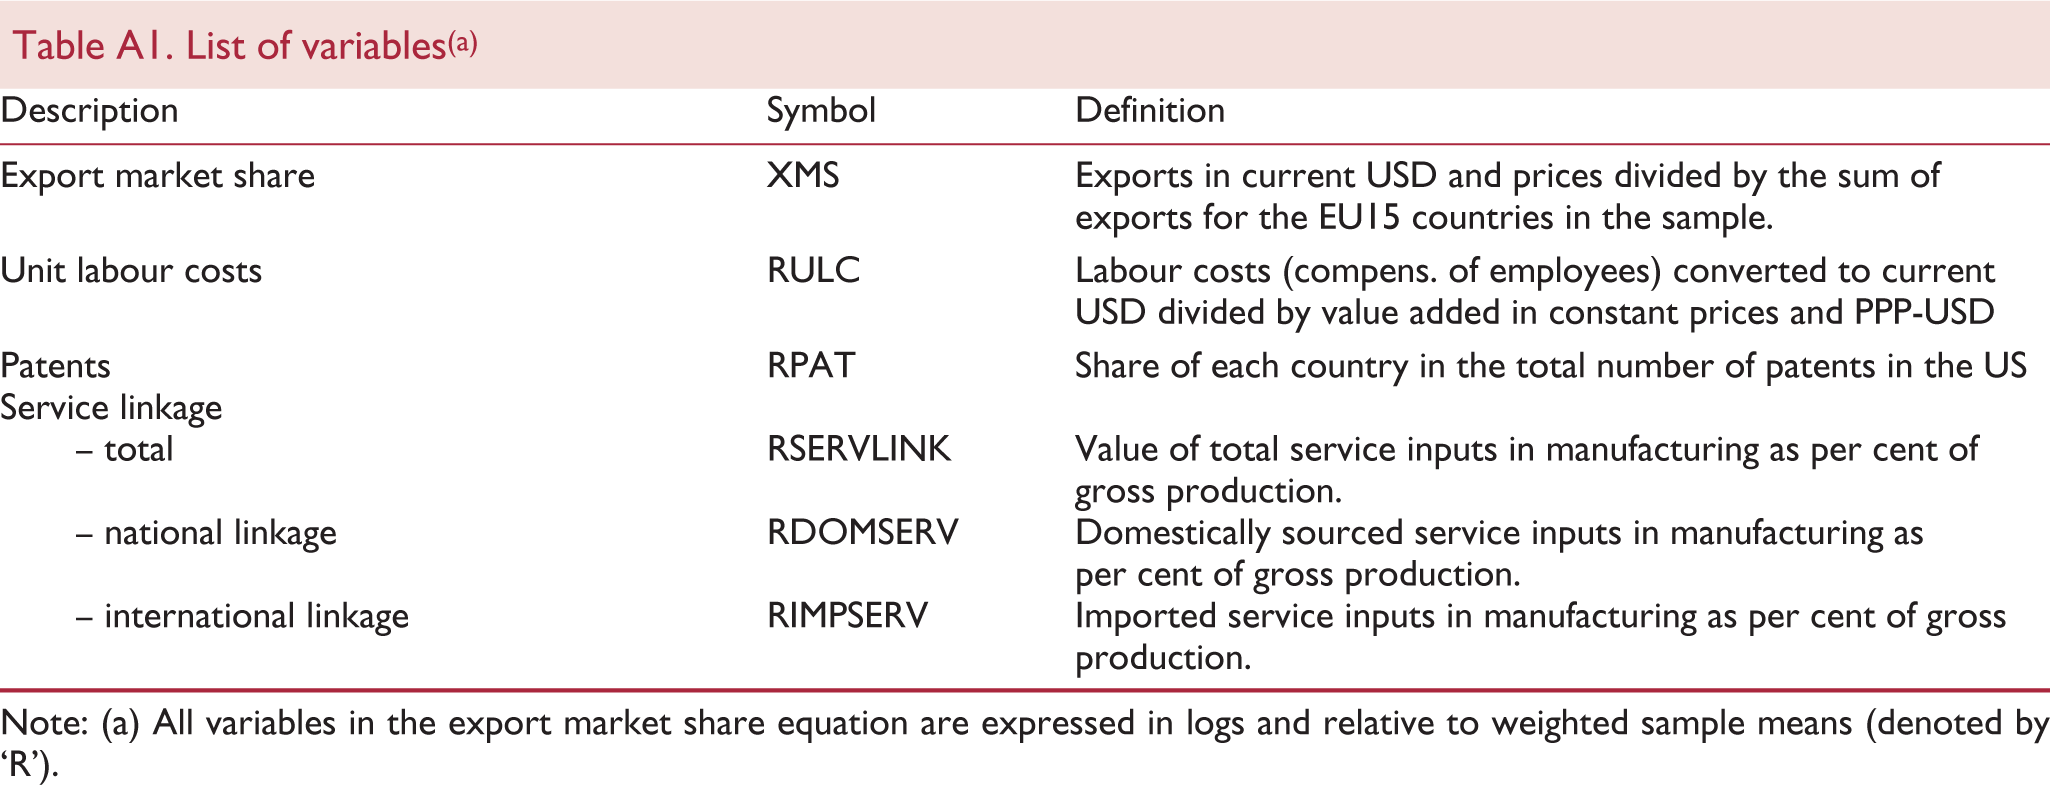
Note: (a) All variables in the export market share equation are expressed in logs and relative to weighted sample means (denoted by ‘R’).
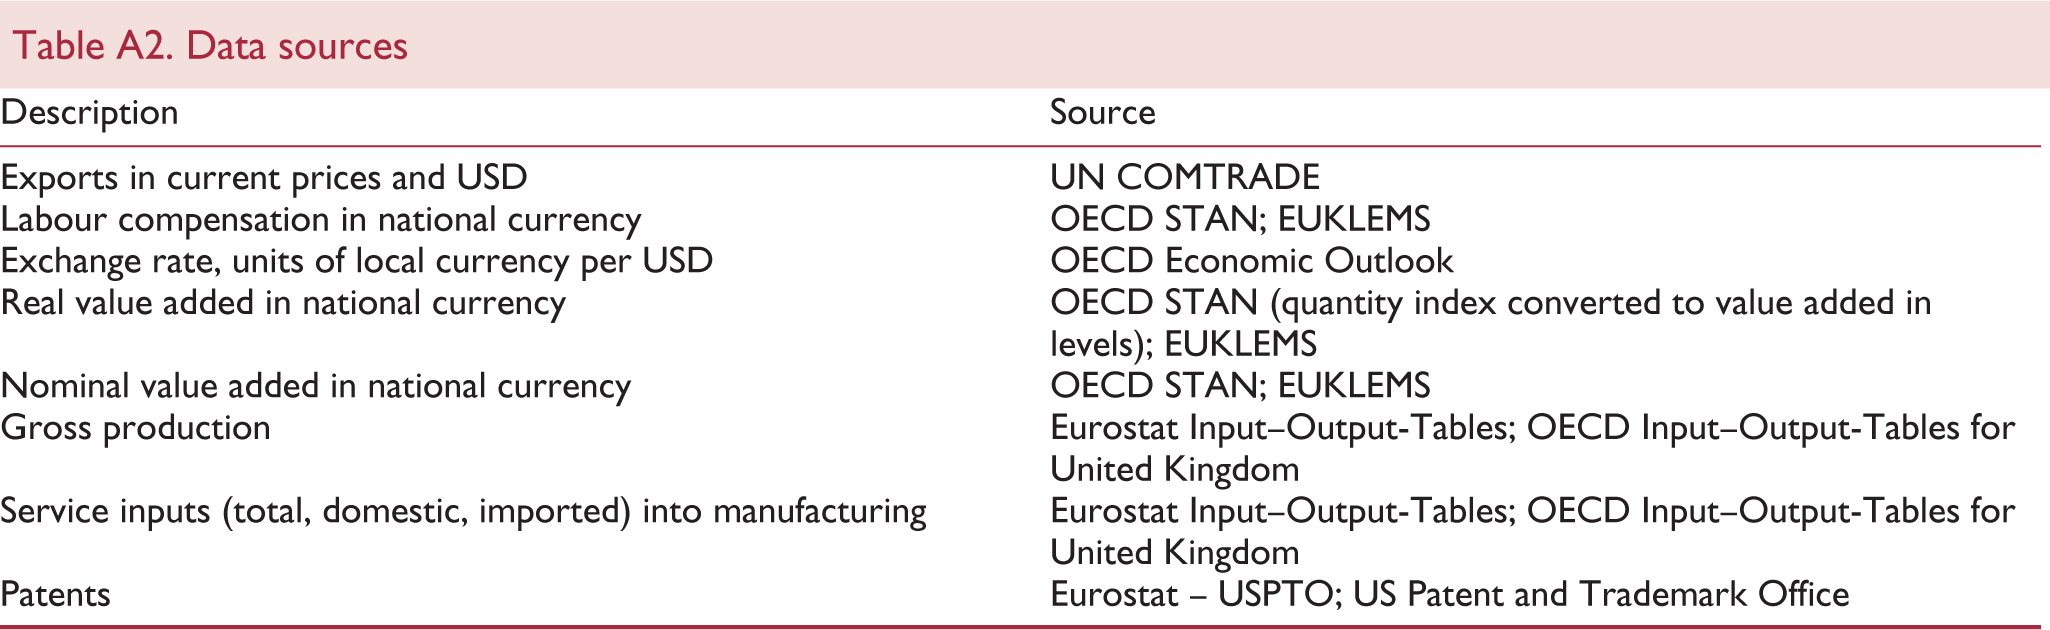
Data sources
In the empirical section of this paper, the basic model specification in (8) is modified in several ways. First, whenever possible, we distinguish between the impact of purchases of service inputs from domestic suppliers (national service linkages) versus international purchases of services (service imports; international service linkages). Then, we estimate the models separately for purchases of knowledge-intensive service industries (KIBS) to test for a possible differential impact on exports. 4 KIBS are expected to play a key role as knowledge and ideas become an important factor in shaping competitiveness, diminishing the role of material inputs. However, some of the more knowledge-intensive services and services that are more closely tied to the production processes of manufactured goods (e.g. computer services, software services, R&D, technical testing, etc.), may have a productivity increasing impact and thus affect export demand mainly indirectly, through costs and prices. On the other hand services may adopt a product-supporting role (marketing, distribution, transportation, maintenance and repair, personnel guidance and customer training, etc.) and be used more directly as instruments of product differentiation. These services might be thought of as having a direct impact on export demand. Empirically, the available data do not allow a clear distinction between efficiency-enhancing and product-supporting services, making difficult the interpretation of the impact of KIBS.
Furthermore, as we will explain in more detail, we will adopt a number of different specifications and regression techniques depending on the different types of input–output data that are available in the Eurostat data. First, we are able to use data from symmetric input–output tables (SIOT) which allow for a distinction between imported services and services purchased from domestic sources, but are available for a set of thirteen EU15 countries only and only for three points in time − 1995, 2000 and 2005. 5 Second, we derive time series information for the years 1995–2007 for purchases of service inputs for the sample of the thirteen EU15 countries from the USE tables. However, these data do not allow us to distinguish between imported and domestic service linkages.
Using SIOT data which generate information only for points in time we will estimate the fixed effects model as given in (8), but we will also estimate a model in differences by OLS:
or

Estimation in differences will eliminate all time-invariant characteristics and fixed effects at the country and industry level. Country or industry dummy variables are added to control for differences in trends that are specific to a particular country or industry and we test for their joint significance at every stage. Furthermore, we include the initial (log) level of market shares in 1995 (XMSjk0). This coefficient should signal possible convergence in competitive positions between either countries or industries. These models in differences will be estimated by OLS but will be re-estimated using the robust regression method to check the robustness of the results.
Applying the data from USE tables we will be able to exploit more fully the time-series information in the data and it will also allow us to specify a dynamic model which includes the lagged dependent variable. This seems especially important since important persistence effects are to be expected with respect to exports and export market shares. There are high sunk costs that exporters have to bear to set up distribution and service networks in the partner countries they are exporting to. Within the EU sticky behaviour seems even more important, since trade relationships between countries are affected not only by past investments in export oriented infrastructure, but also by the accumulation of invisible assets such as political, cultural and geographical factors. Thus, past exports are very likely to influence current exports. One might also expect some sluggishness in the response of market shares to changes in the other variables. For instance one might see slow responses to cost changes as companies are reluctant to lose market share. So we also include the lags of the other variables in the model. 6
The dynamic model takes the following form:
The dynamic specification of the model, however, warrants the use of dynamic panel data techniques proposed in the literature, since the ordinary fixed effects estimator is biased and inconsistent, because the lagged endogenous variables are correlated with the error term due to the presence of the time-invariant country-industry fixed effects. One way to overcome this econometric problem is to apply the first differenced generalised method of moments estimator (Arellano and Bond, 1991). The model is thereby transformed into first-differences to eliminate the unobserved time-invariant fixed effects, and then the right-hand-side (endogenous) variables in the first differenced equations are instrumented using the level of the series lagged two periods or more.
However, when the time series are persistent, the first-differenced GMM estimator has been shown to be poorly behaved and biased. In such a case more plausible results can be achieved by using the system GMM estimator suggested by Arellano and Bover (1995) and Blundell and Bond (1998). Since exports are a highly persistent series we will apply the system GMM estimator to estimate the empirical specifications outlined in (12). System GMM will not only help to better model the dynamics involved but will also help to deal with some problems of endogeneity with respect to the other variables used. Probably the most worrisome aspect is the assumption that RULC can be treated as exogenous. Feedbacks from exports to productivity and wages (if firms make higher profits due to exports) are very likely.
5. Descriptive analysis of the data
Before estimating the econometric models presented in the last section it is useful to summarise the major patterns in the data. Since it is the explicit aim of the paper to investigate the impact of service linkages on export performance we will mainly focus on the differences in the extent to which countries use services inputs in manufacturing and how these patterns vary across industries and over time. The paper will also have a short look at the major trends in the other variables.
Based on symmetric input–output tables for the years 1995, 2000 and 2005, we construct several different measures of services outsourcing to examine the extent to which service activities are interlinked with the rest of the domestic economy. We first distinguish between indicators comprising overall service inputs, imported service inputs and service inputs delivered from domestic suppliers. Then we calculate the same indicators pertaining to knowledge intensive business services (KIBS) including computer services, management and consulting services, research and development, and other business services. The main data sources are the Eurostat input–output tables for EU countries and the OECD input–output statistics for the UK. Throughout the paper, we use purchased service inputs as a per cent of gross output to measure the strength of the service linkage of the manufacturing sector. The following tables and figures summarise the data. We get a number of interesting results.
First, in table 1 we find an increasing share of purchased intermediate service inputs of the manufacturing sector in the EU15. The service share in total gross output increased from 14.8 per cent in 1995 to 17.9 per cent in 2005 for the average EU15 country. Growth in the shares has slowed down in the second half of the period from 2000–2005.
Purchased service inputs in EU15 manufacturing (percentage shares of purchased service inputs in total gross output)
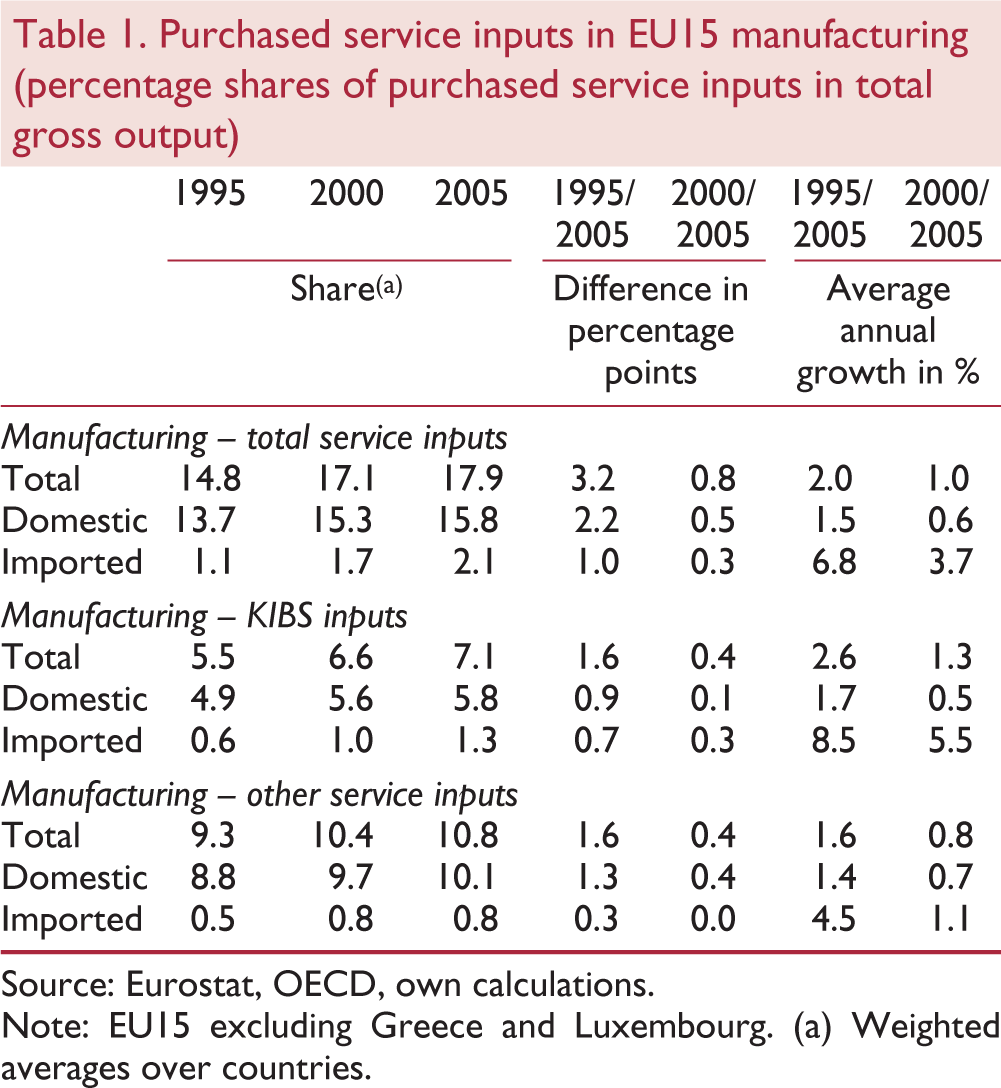
Source: Eurostat, OECD, own calculations.
Note: EU15 excluding Greece and Luxembourg. (a) Weighted averages over countries.
Table 1 also distinguishes between domestically purchased service inputs of manufacturing and imported service inputs. We see that the lion's share of service inputs used in manufacturing comes from domestic sources, while the share of imported service inputs is still very small, accounting for 2.1 per cent of total output.
Finally, table 1 reveals some interesting differences between the structure of demand of domestically sourced service inputs and imported intermediate services within the EU15. While in the purchases of domestic services other services dominate, KIBS account for a larger share in imported service inputs. At the same time, KIBS are clearly driving the overall increase in imported service inputs in the manufacturing sector while both types of services contribute about equally to the growth in domestically demanded inputs.
However, a look at the individual countries reveals not only a large variation in the change of the share of purchased services but also the level of purchased services and we find Ireland in particular to be a very specific case. Figure 1 reveals the exceptionally high linkages of manufacturing to the service sector in Ireland where the share of service inputs as a per cent of total production is close to 40 per cent and well above the respective shares in the other EU15 countries. At the same time it is the country with the highest share of imported services (30.6 per cent) and the highest share of KIBS inputs in total manufacturing output (26.4 per cent). As a country with a high share of inward foreign direct investment, Ireland turns out to be a very specific case where most of the service inputs are purchased across the border, indicating Ireland's specific role within the production network of multinational enterprises. This is one possible explanation, another – which we will come to later on, is that Ireland more than other countries is specialised in manufacturing sectors that contribute significantly more than other sectors to the demand and increase in intermediate demand growth for services (KIBS).
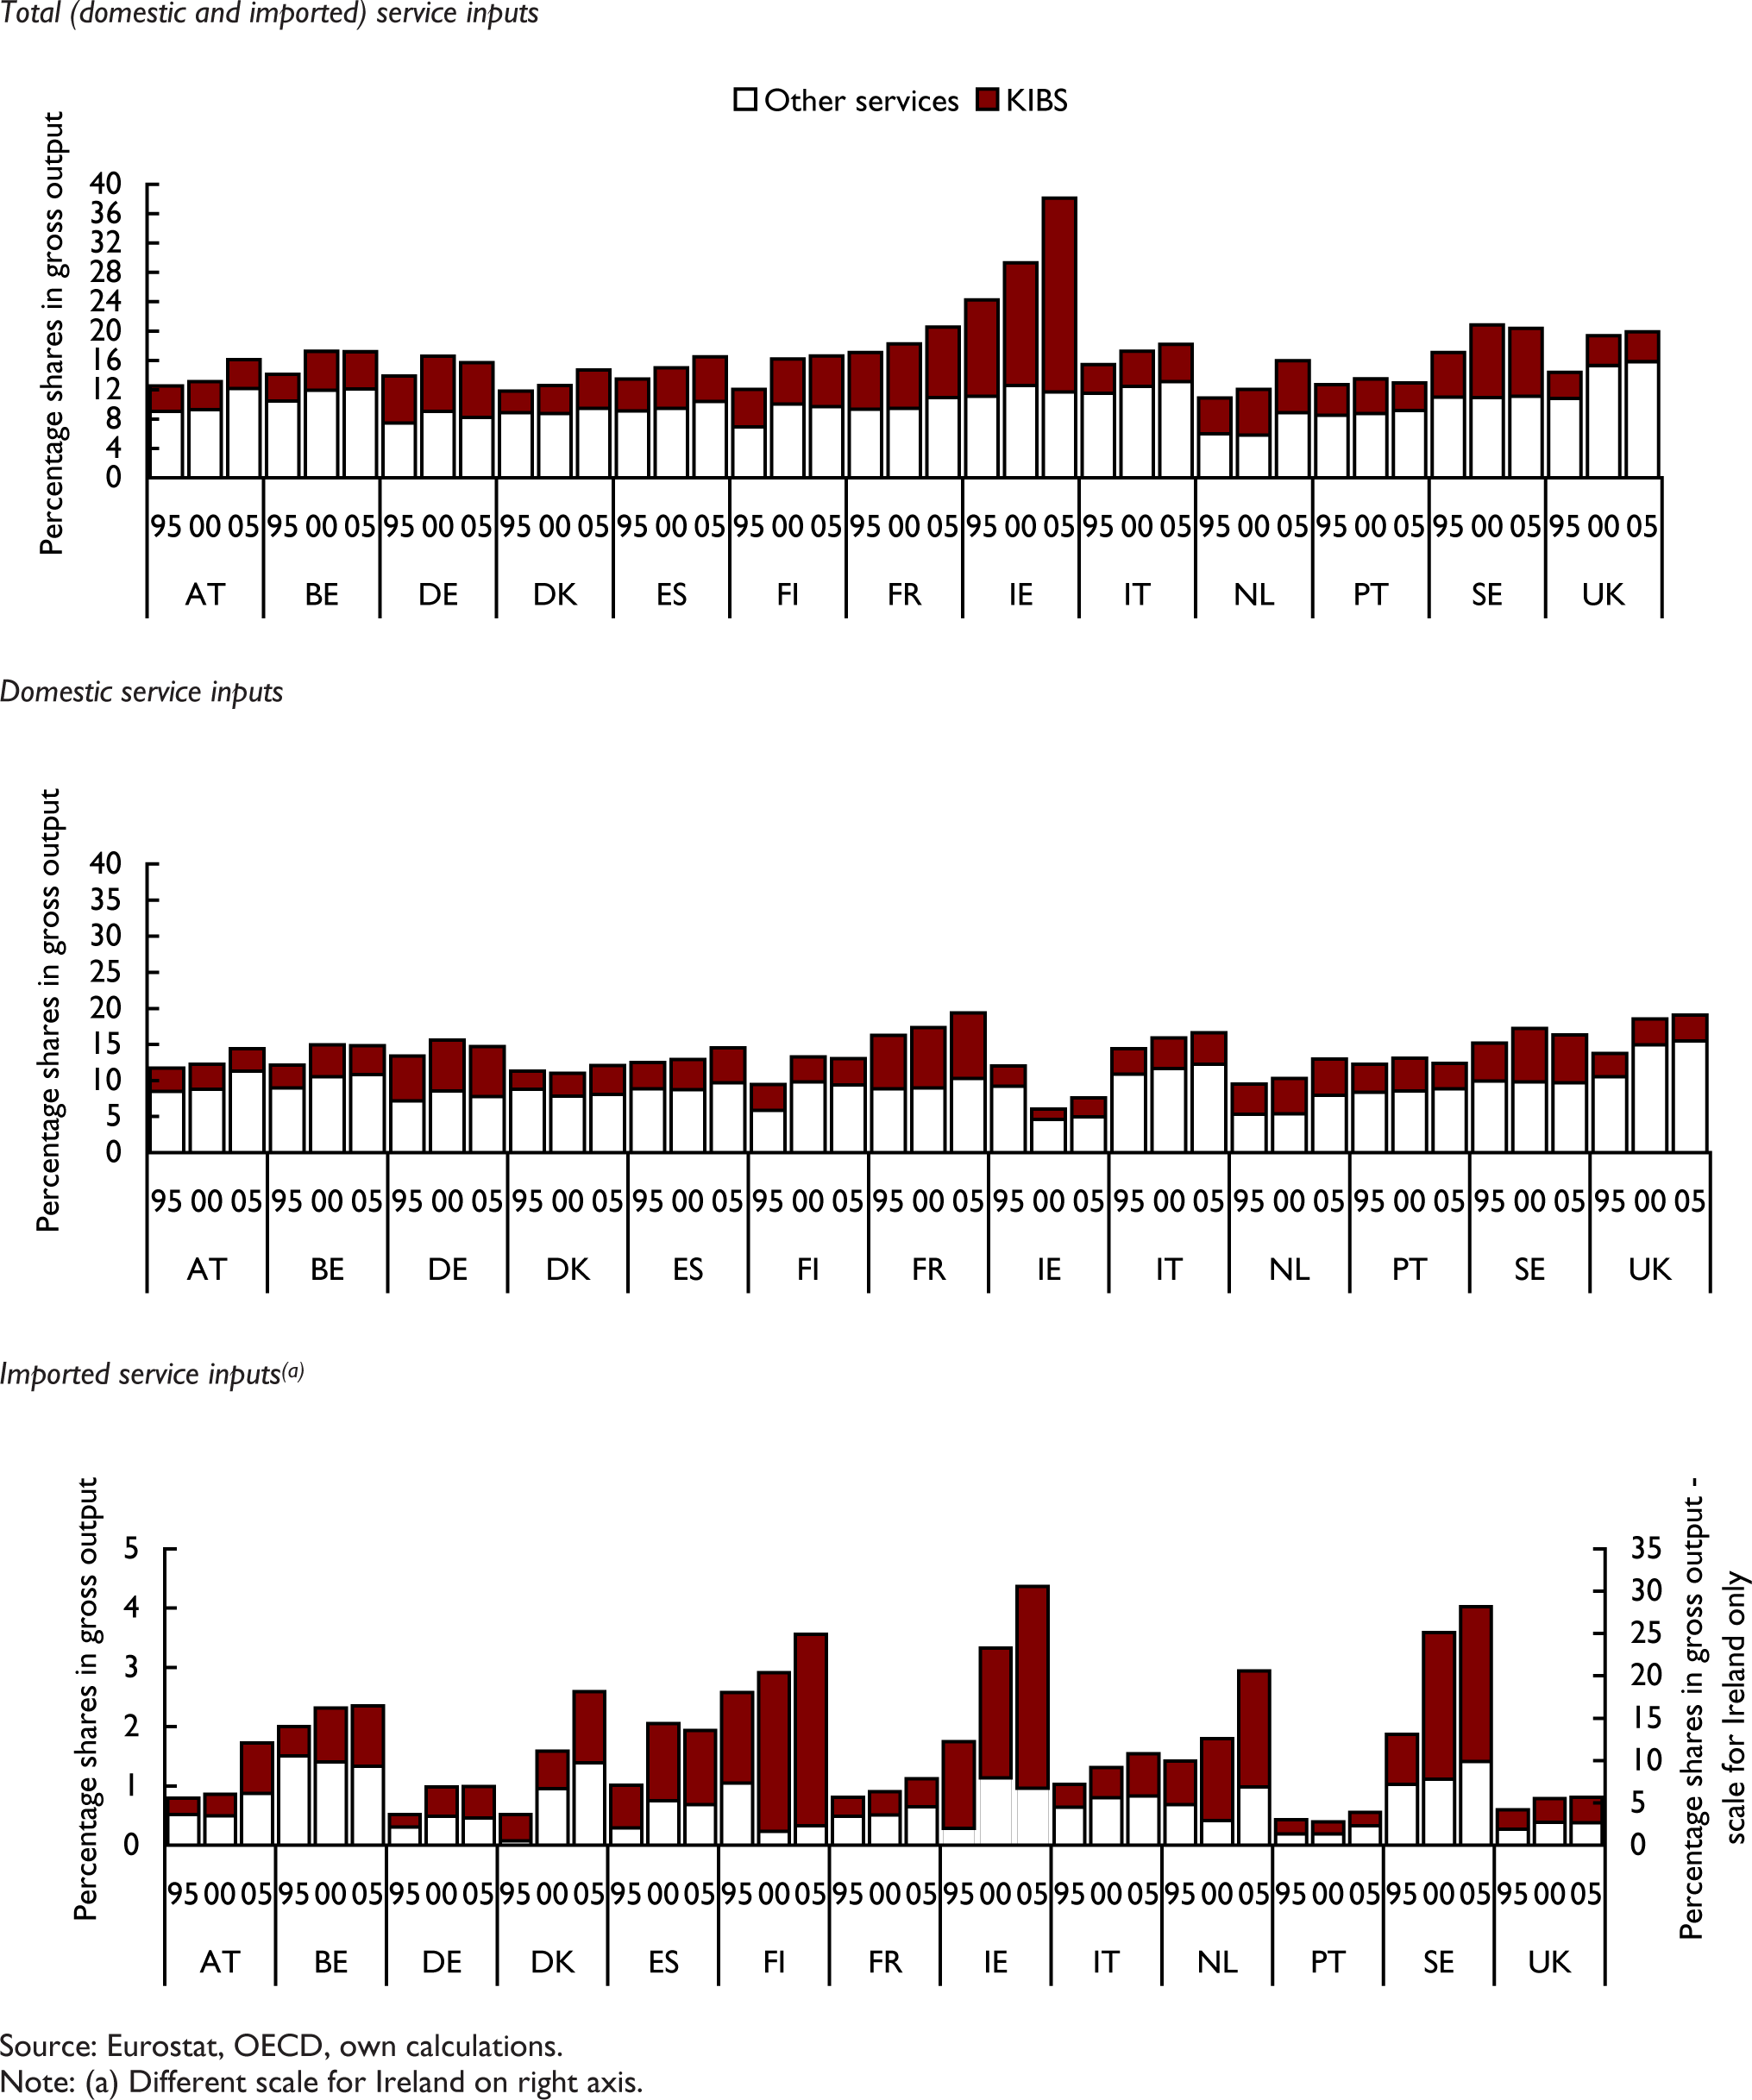
Purchased service inputs in manufacturing in EU15 countries
From the rest of the countries considered, linkages to the service sector were most intense in Sweden, the UK and France, with purchased service inputs reaching a share of about 20 per cent. Portugal has the lowest share of purchased service inputs.
All EU15 countries increased their services input shares in manufacturing gross output in the period 1995 to 2005. Ireland, the UK, the Netherlands and Finland stand out as countries with the highest increases in service input shares. While for the majority of the EU15 countries growth in service inputs share slowed down in the second half of the period, we find accelerated growth between 2000 and 2005 for Austria, Denmark, France, Ireland and the Netherlands. Again, Ireland turns out to be specific as its service linkage growth concentrates on KIBS and imports. In most of the EU15 countries the overall increase in the services share in manufacturing is driven by increasing purchases of domestic services. KIBS drive the overall result in about half of the countries, especially so in Sweden and Germany; in the other half of the EU15 countries the overall growth pattern is driven by other service inputs. Growth in other services has been strongest in the UK, Austria, the Netherlands and Finland.
Analysing the data along industries (table 2 and figure 2) we find above average shares of purchased service inputs in total manufacturing production in 2005 for the following sectors: paper, paper products and printing (NACE 21–22); chemicals (NACE 24); office machinery and computers; electrical machinery and apparatus; radio, TV and communication equipment; medical, precision and optical instruments (NACE 30–33); non-metallic mineral products (NACE 26); and food, beverages and tobacco (NACE 15–16). With the exception of non-metallic mineral products these are mainly technology and knowledge driven or marketing driven industries (Peneder, 2001).
Share of purchased service inputs in EU15 manufacturing output by industry in 2005
Source: Eurostat, OECD, own calculations.
Notes: (a) Weighted average over EU15 countries (excluding Greece and Luxembourg). (b) Industries are defined as above (below) average when the share is higher (lower) than the average plus (minus) (1/2)∗ standard deviation.
Purchased service inputs in EU15 manufacturing by industry
The most important KIBS users in the EU15 countries are the chemical sector, the office and electrical machinery and medical instruments sectors (NACE 30–33) and the paper and printing industry (figure 2). The latter is at the same time an above average user of other services together with the non-metallic mineral industry and the wood and wood products industry.
Industries with above average use of service inputs are also the industries for which we observe the most dynamic growth in the share of intermediate services over the period 1995 to 2005. At the same time these industries are also the most intensive users of imported service inputs, with the sole exception of the non-metallic minerals industry which mostly relies on domestic service inputs. Imports have been the most important growth component only in the paper and printing sectors, the chemical industry and the sophisticated machinery industries (NACE 30–33) and the growth pattern of those imports in those industries in turn were mainly driven by a growing use of KIBS imports. The rest of the industries' growth pattern was determined in large part by an expansion in the share of other service inputs and domestically sourced services.
The industry pattern of services demand is quite stable across the EU15 countries. However, we can expect industry effects to explain to some extent the overall strength of service linkages across EU15 countries and expect countries with a higher production share in above average service using manufacturing industries to have higher linkages of manufacturing to the service sectors. Calculating Spearman rank correlations and Kendall rank correlations confirms the significance of industry effects in explaining the use of service inputs in manufacturing across EU15 countries 7 (see also Guerrieri and Meliciani, 2005).
Finally, figure 3 presents trends over the period 1995 to 2005 of the other major variables used in the analysis for each of the selected EU15 countries. Looking first at the market share dynamics (vertical axis of figures) we find that Spain achieved the highest increase in market shares. Austria, Belgium, Ireland and Germany also substantially increased their shares. The Netherlands and Denmark nearly held their export market shares, while these fell for the rest of the countries considered.
Trends in export market shares, RULC and patents, 1995–2005
Overall, the figures reveal a negative correlation between market share trends and trends in relative unit labour costs (horizontal axis of figure) and a positive correlation with relative technology content as measured by the number of patents granted in each of the countries. Portugal is a clear outlier with the highest trend growth in patents, starting from a low level in 1995, and a significant fall in export market share.
In a more detailed look at individual countries, we find that for Austria, Germany and Ireland the increase in export market shares correlated with an increase in the relative technology position and a decline in relative costs. Spain's positive export performance was accompanied by a deteriorating relative cost position but increasing patenting activity. Portugal and Italy also experienced a deterioration of their relative cost position and an increase in patents granted, but saw their market shares decline. In Sweden and France the fall in export market shares came with a fall in relative technology position but an improving cost position, while in the UK the declining relative export position was accompanied by both a worsening of relative unit labour costs (strong trend increase) and a decline in patenting activities.
6. Estimation results
The econometric analysis uses a panel of thirteen EU countries 8 and thirteen NACE 2-digit industries – depending on the input–output data used – covering either the years 1995, 2000 and 2005 or the time period from 1995 to 2007 (twelve years). The descriptive analysis in section 5 revealed the very special case of Ireland so that we purposely excluded it from the sample in the regression results displayed here. We re-estimated the coefficients including Ireland with and without interaction terms and will highlight the effects as we discuss the results. Additionally, one industry – manufacturing of coke and refined petroleum products – had to be dropped from the original panel because of extreme and erratic fluctuations in the data (concerning output in particular) which produced some severe outliers. The cross-section dimension of the panel is thus determined by twelve countries and twelve industries.
Table 3 presents OLS regression results for the specification in differences, given in (10) and (11). Close inspection of the data reveals the presence of some outliers. We cope with this problem throughout the analysis by re-estimating the model using robust regression, which is an iterative, weighted-least-squares method of controlling for outliers (not shown). The results turned out to be relatively consistent across estimation techniques. Using robust regression changed the coefficients on relative unit labour costs and domestic service linkages, but had no impact on their significance levels.
Estimation results – OLS regression differenced specification (SIOT data)
The upper panel reports results from the specification with country dummies. Including country dummies implies that the estimated coefficients are derived from the variation between industries (within countries). The lower panel presents the estimates derived from the specification with industry dummies which in turn are based on variations between countries (within industries).
The results for the service linkage variable in the specification with country dummies suggest a clear positive impact of total linkages and international service linkages, while the effect of domestic linkages turns out to be insignificant and not precisely estimated. The coefficients can be interpreted as elasticities and a 1 per cent change in the growth of imported services leads to a 0.1 per cent higher growth of export market shares. Based on the estimated elasticities of export market shares evaluated at sample means one can provide an indication of the magnitude of the different sources of market share dynamics. According to these calculations, the observed change in international service linkages from 1995 to 2005 amounted to 4 per cent and accounted for an increase of market shares of 0.4 per cent. The strongest positive impact in the period considered came from the observed expansion of patenting activities which accounted for an increase in export market shares of 4 per cent over the whole period. The average impact of relative unit labour costs was rather low and insignificant.
The table further distinguishes between the impact of linkages to the KIBS sectors and the rest of the service sectors. Interestingly we find a positive, but only marginally significant impact for the combined effect, but no impact of the separated coefficients for domestic and imported KIBS inputs. The coefficient on imports of other service inputs is positive and highly significant.
Inferring from the variation between countries within the same industry (industry dummy specification) basically produces the same results with one exception. Total KIBS and imported KIBS exert a significant positive influence on export competitiveness. Overall, the explanatory power of the model is much lower and the industry effects are not significant.
All other control variables in the model have the expected signs and with the exception of RULC are highly significant. The negative coefficient on initial relative exports implies that a lower export share of a country relative to its competitors in a specific industry in 1995 results in stronger relative growth of the share and vice versa. It signals convergence of the competitive positions between countries (industry dummy specification) and of the industry structure of relative exports of a country (country dummy specification). 9
These regressions in differences suffer from some shortcomings which we will try to overcome using different estimation techniques. In a first step, fixed effects regression should be able to better exploit the panel structure of the data. Table 4 displays the estimates from fixed effects regression of the model in levels as given in equation (8) with data from the Eurostat SIOT tables covering the three points in time 1995, 2000 and 2005. The cross-section dimension of the models is determined by twelve countries and twelve industries (144 groups).
Estimation results – Fixed Effects Model (SIOT data)
Source: Own calculations.
Notes: (∗∗∗), (∗∗), (∗) denote significance at the 1 per cent, 5 per cent, and 10 per cent level, respectively; all variables are in logs. Dependent variable is log export market share.
Using the SIOT information for the three points in time, we again find a significant impact of total services and imported services only. This resembles the outcomes we had first seen in the regressions with the differenced data. Distinguishing between KIBS inputs and other service inputs we find positive impacts from both types of imports, while domestic inputs exert no impact. 10
Finally, we apply data from the Eurostat USE tables which provide time series information for total service inputs (from national and international sources) for the years 1995 to 2007. Table 5 summarises the results for the service linkage variables from a fixed effects regression of the empirical model specified in (8).
Estimation results – Fixed Effects (USE tables)
Source: Own calculations.
Notes: (∗∗∗), (∗∗), (∗) denote significance at the 1 per cent, 5 per cent, and 10 per cent level, respectively; all variables are in logs. Dependent variable is log export market share.
The results from the fixed effects model confirm the significant and positive impact of overall service linkages on export performance. They also corroborate the positive impact of other service inputs but do not support any significant impact of KIBS inputs into manufacturing.
Since previous empirical findings suggest that different industries are not likely to be equally sensitive to quality versus cost factors we test for this possibility by running two separate regressions for two broad industry groups, one comprising the NACE sectors 24, 30, 32, 33 and 34 summarising technology driven, medium-skill to high-skill intensive sectors; and the other including the remaining manufacturing industries. 11 Applying data from Eurostat USE tables substantially extends the database and allows us to split the sample for the regressions, accordingly. The results are summarised in the lower panels of table 5 and appear to be consistent with expectations on the relative importance of the different factors of competitiveness in the different sectors. In particular, cost factors are of no relevance for market shares in the high-tech industries while patents and service linkages turn out to be highly significant. Additionally, splitting the linkage variable by the type of service purchased we find a significant impact of KIBS linkages and no impact from interactions with other service sectors. On the contrary, market shares in low-tech industries are mainly driven by relative unit labour costs while patents also play a role and only other service inputs are relevant.
Table 6 presents the results for the dynamic model specified in equation (12). The results from system GMM estimations are very much in line with the fixed effects regressions, the impact of services on export market shares remains positive and significant. We applied the two-step robust variant of system GMM. Thus, significance levels of the coefficients are based on Windmeijer (2005) corrected robust standard errors that control for any pattern of heteroskedasticity. To avoid instrument proliferation (Roodman, 2009) the lags used in GMM-style instruments is limited to five. Both the Arrelano-Bond test for no second-order serial correlation as well as the Hansen test of over-identifying restrictions confirm the validity of the instruments implying that the estimates are consistent. The database is still too small to run meaningful sample split dynamic panel estimations. We cannot therefore repeat the analysis by industry type.
Estimation results – System GMM (USE tables)
Source: Own calculations.
Notes: (∗∗∗), (∗∗), (∗) denote significance at the 1 per cent, 5 per cent, and 10 per cent level, respectively; all variables are in logs. Dependent variable is log export market share.
7. Conclusions
This paper has focused on the interaction between manufacturing industries and the service sector in determining countries' relative export performance in a particular manufacturing industry. It built on the theoretical and empirical literature on vertically differentiated trade while adding a new dimension: the role of services as a determinant of (perceived) product quality.
The descriptive analysis on input–output data indeed corroborated evidence of an increasing service intensity in manufacturing industries of EU15 countries. The data also revealed a number of other interesting results. Imported services account for a very small share in total output, while the lion's share of services inputs comes from domestic sources. At the same time, the overall increase in the services share in manufacturing is driven by increasing purchases of domestic services, although growth in imports has been most dynamic. We also found that the structure of domestically purchased services and imported services differs. KIBS account for a larger share in imported services by manufacturing industries while purchases of domestic services are more strongly concentrated on other services. Industries with the highest production share of services were found to be the more technology, knowledge and marketing driven industries, including the paper and printing sector, the chemical industry, the office, medical and electrical machinery industry, the food and beverages industry as well as the non-metallic mineral sector. For these industries we also observe the most dynamic growth in the share of service inputs. They are also the industries with highest shares in imported services. The industry pattern of services demand is quite stable across the EU15 countries. The industry structure of countries thus explains to some extent the differences across countries in the use of service inputs.
On the basis of a sample of twelve disaggregated manufacturing industries in twelve EU countries the econometric analysis found strong evidence of a positive and robust influence of service inputs on countries' relative manufacturing export performance. Thus, while price/cost competition and innovative activity are crucial to the explanation of international trade, market success is further driven by service inputs such as good product marketing, efficient distribution and transportations systems, etc.
Specifically, the analysis found strong service-linkage effects of ‘product-supporting services’ used as a means of product differentiation to raise perceived product quality. Meanwhile, as both creators of technology and important transmitters of technology and information, the subgroup of knowledge-intensive business services (KIBS) is interpreted also as affecting production efficiency, an effect which might in part be taken up by the cost term. The direct positive impact of KIBS was not robust across specifications and estimation techniques, which might be due to some extent to this efficiency-enhancing role which is in part captured by the relative cost term. Additionally, however, we found evidence that the magnitude and the significance of the KIBS linkages differs across manufacturing industries. Sample split regressions showed a positive and significant impact of total service inputs and KIBS inputs in the technology driven, high-skilled labour intensive industries within the manufacturing sector but not in the other manufacturing industries. This resembles findings in Francois and Wörz (2008) showing a positive and significant impact of increased business service openness on exports of technology intensive industries. Finally, the results on the impact of relative unit labour costs and patenting activity were found to be very much in line with expectations on the relative importance of the different factors of competitiveness in the different sectors. Export market shares in technology driven industries are thus mostly affected by the sectors' own innovative activities, while international competitiveness in low-tech, low-skilled industries is driven mostly by relative costs.
Distinguishing between domestically sourced service inputs and imports, the analysis found a clear positive and highly significant impact of international service linkages on countries' export market shares in manufacturing, while it did not find a significant effect of domestic linkages. Thus, growing international service linkages – most likely service linkages to the export market – are more important than national linkages in promoting export competitiveness. Multinational firms and intra-firm trade might play an important role in this process. It might also reflect better access to internationally traded service inputs, which may be available in higher quality. The results clearly point to the importance of further internationalisation of service functions and further services liberalisation also in favour for the manufactured goods trade.
The study leaves open some important issues for future research. First, international service linkages are likely to be most closely connected to the activities of multinational firms. Hence, the role of FDI is presumably quite crucial. While the main limiting factor at present is the availability of FDI data at the disaggregated sector level, future work should look more closely at the role of multinational enterprises to further check the robustness of the results concerning the international service linkage term. Furthermore, bilateral trade data could also help to establish a clearer link between cross-border purchases of services and the export performance in a specific market.
In future work it might also be interesting to analyse the role of in-house services, i.e. services performed within firms. The paper concentrated on purchased service inputs only, but looking at manufacturing firms one finds that the share of service functions performed within the manufacturing firms is increasing as well. The inclusion of in-house services would help to analyse such questions as to whether it is better to outsource services and purchase them from outside the firm or to keep those functions within the firm. To do this, however, one needs employment data that are disaggregated by functional activities. These data are not yet readily available.
Footnotes
1
Country-industry-level indicators of product market regulation published by the OECD are not available for all the years considered in the analysis.
2
Such market share calculations take no account of exports from non-EU15 countries, which have been growing strongly in some categories. Since for most countries outside the EU15, and especially most of non-OECD countries, no reliable data on costs and technology variables at the level of disaggregation chosen in the paper or input–output tables are available, and the explicit aim of the paper is to investigate the comparative export performance of the group of EU15 countries, this should be a good approximation. The EU15 countries accounted for 35 to 40 per cent of total world exports, including intra-EU-exports.
3
Additionally, investment in fixed capital has been used as a measure of ‘embodied technological change’ in new machinery and turned out to influence export performance significantly (e.g. Carlin et al., 2001). We re-estimated the models by including a measure of relative investments in machinery (taken from EUKLEMS database) as a further control for technology factors. We found a significant impact of investment and found the coefficients on the service linkage variables to be very robust to the inclusion of this additional control variable.
4
KIBS comprise the NACE sectors: 72 (computer and related activities), 73 (research and development) and 74 (other business activities) throughout the paper.
5
The thirteen EU countries include: Austria, Belgium, Finland, France, Germany, Italy, Ireland, Netherlands, Norway, Portugal, Spain, Sweden, United Kingdom.
6
We experimented with different lag structures of the variables and lags of one period produced the most significant results.
7
Spearman rho=0.1278, p-value=0.0013; Kendall tau-a=0.0852, Kendall tau-b=0.0854, p-value=0.0014.
8
See note 5.
9
Re-estimating the model including Ireland and interaction variables that account for the special situation in the country produces the same results. Including Ireland without further controls generally increases the coefficients as well as their significance levels, especially with respect to manufacturing linkages to KIBS. It also raises the impact and significance of domestic total services and domestic other services.
10
The fixed effects regression results are robust to the inclusion of Ireland.
11
This classification is based on Peneder (2003, ![]() )
)
Appendix
Country and country groups abbreviations
| EU15 – following thirteen countries (Greece and Luxembourg are missing) | |
| AT | Austria |
| BE | Belgium |
| DE | Germany |
| DK | Denmark |
| ES | Spain |
| FI | Finland |
| FR | France |
| IE | Ireland |
| IT | Italy |
| NL | Netherlands |
| PT | Portugal |
| SE | Sweden |
| UK | United Kingdom |