
Abstract

The forecasts for the world and the UK economy reported in this Review are produced using NIESR's model, NiGEM. The NiGEM model has been in use at the National Institute for forecasting and policy analysis since 1987, and is also used by a group of about 40 model subscribers, mainly in the policy community. Most countries in the OECD are modelled separately, and there are also separate models of China, India, Russia, Brazil, Hong Kong, Taiwan, Indonesia, Singapore, Vietnam, South Africa, Turkey, Estonia, Latvia, Lithuania, Slovenia, Romania and Bulgaria. 1 The rest of the world is modelled through regional blocks so that the model is global in scope. All models contain the determinants of domestic demand, export and import volumes, prices, current accounts and net assets. Output is tied down in the long run by factor inputs and technical progress interacting through production functions, but is driven by demand in the short to medium term. Economies are linked through trade, competitiveness and financial markets and are fully simultaneous. Further details on the NiGEM model are available on http://nimodel.niesr.ac.uk/.
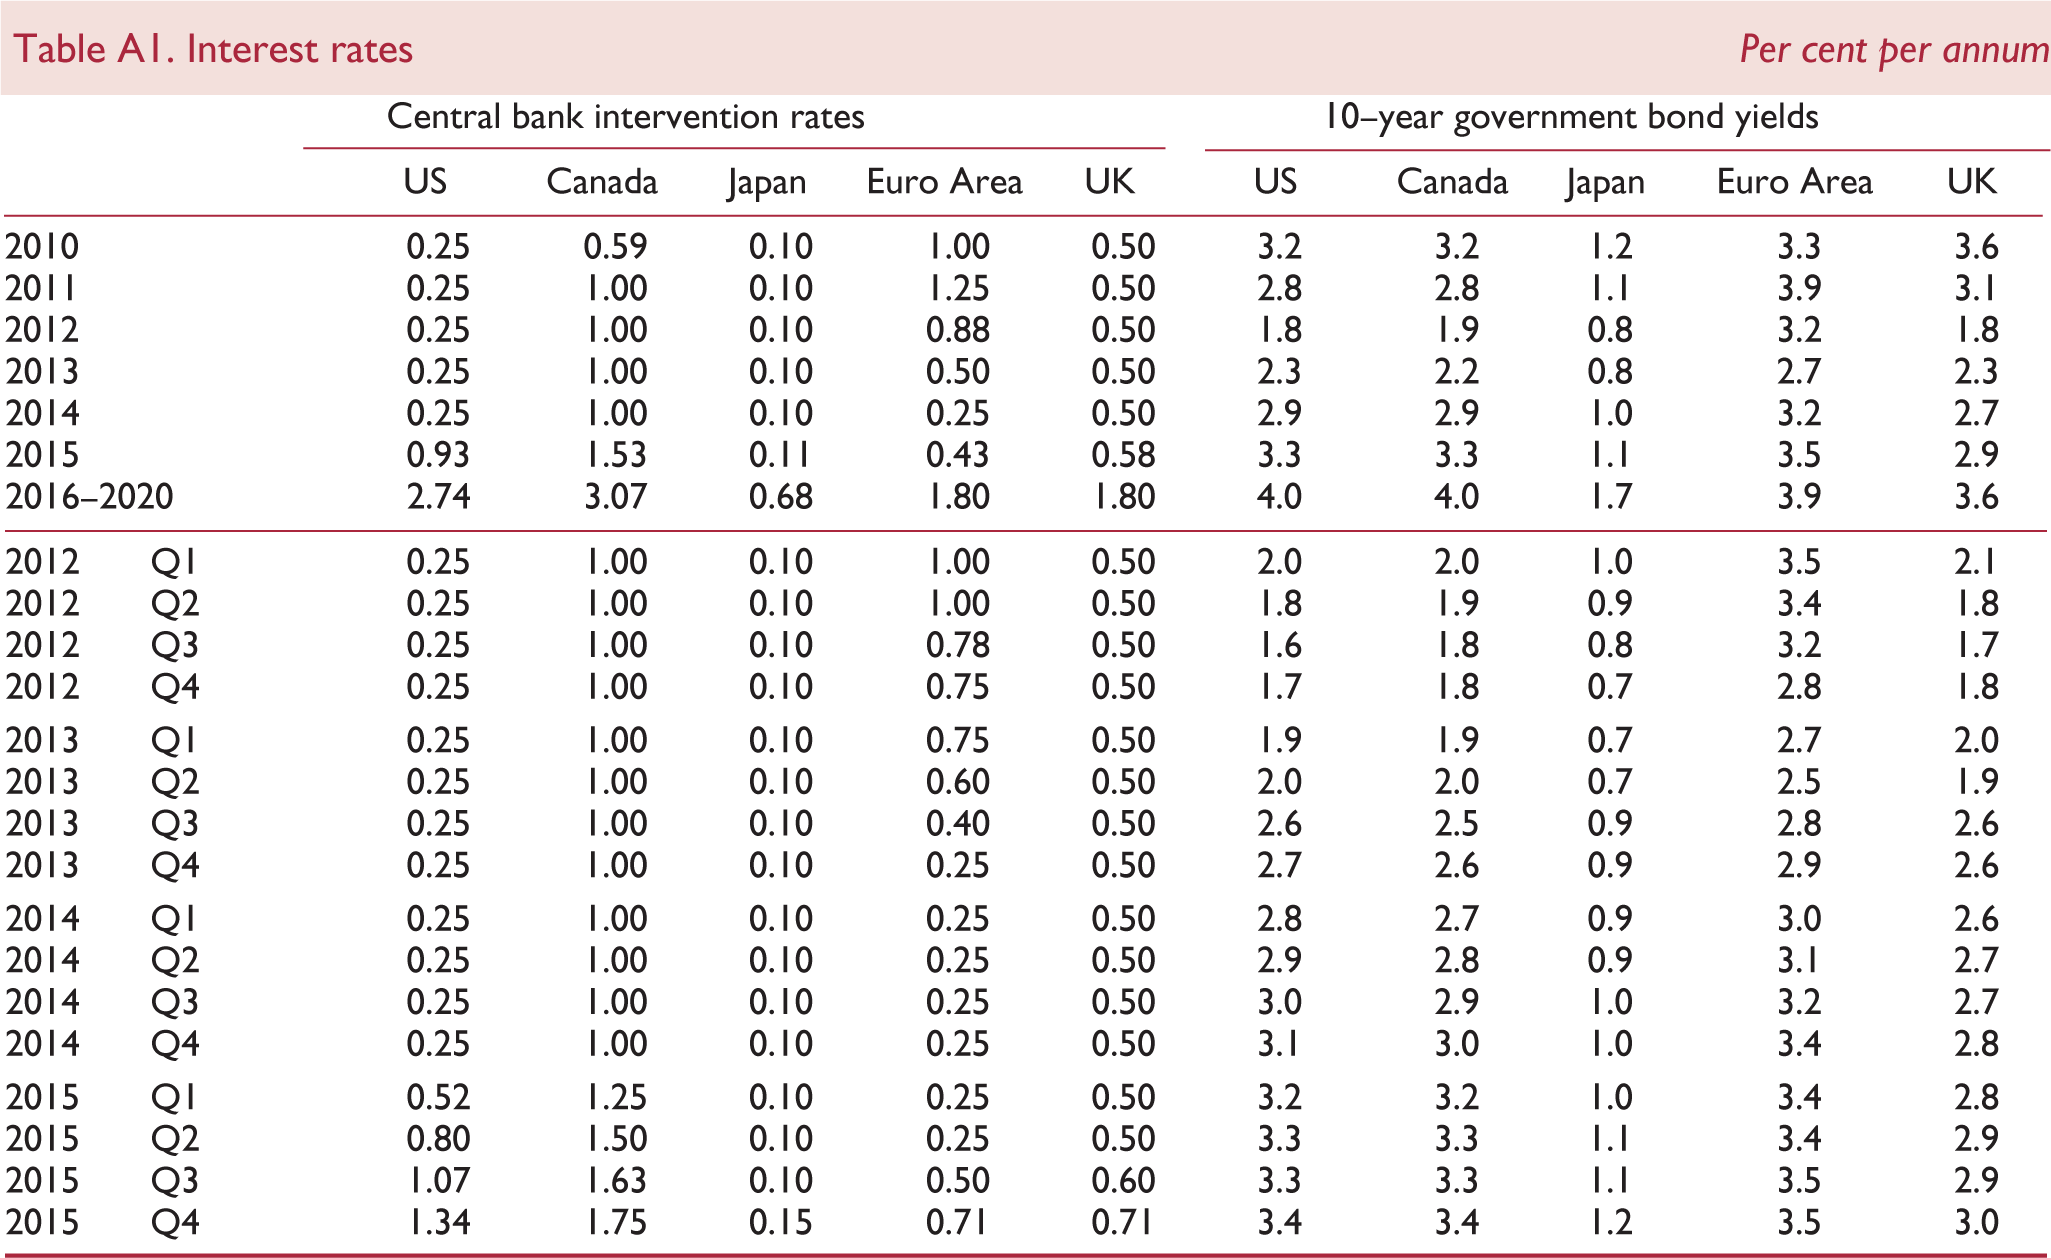
The key interest rate and exchange rate assumptions underlying our current forecast are shown in tables A1–A2. Our short-term interest rate assumptions are generally based on current financial market expectations, as implied by the rates of return on treasury bills of different maturities. Long-term interest rate assumptions are consistent with forward estimates of short-term interest rates, allowing for a country-specific term premium in the Euro Area. Policy rates in the major advanced economies are expected to remain at extremely low levels at least until the end of 2014. The ECB cut interest rates in the Euro Area by 25 basis points in May 2013. We are currently projecting a further 25 basis point cut by the end of September, partly as a reaction to rising global bond yields, which have effectively tightened financial conditions in the depressed economies of the Euro Area. The Reserve Bank of Australia and Bank of Korea have also introduced a 25 basis point interest rate cut since May, while the central bank of Hungary has reduced rates by 50 basis points and the National Bank of Poland has reduced rates by 75 basis points in three steps. By contrast, tightening measures have been introduced in several emerging market economies in response to inflationary and financial market pressures, including China, Brazil, Indonesia, Turkey and India.
Interest rates Per cent per annum
Nominal exchange rates
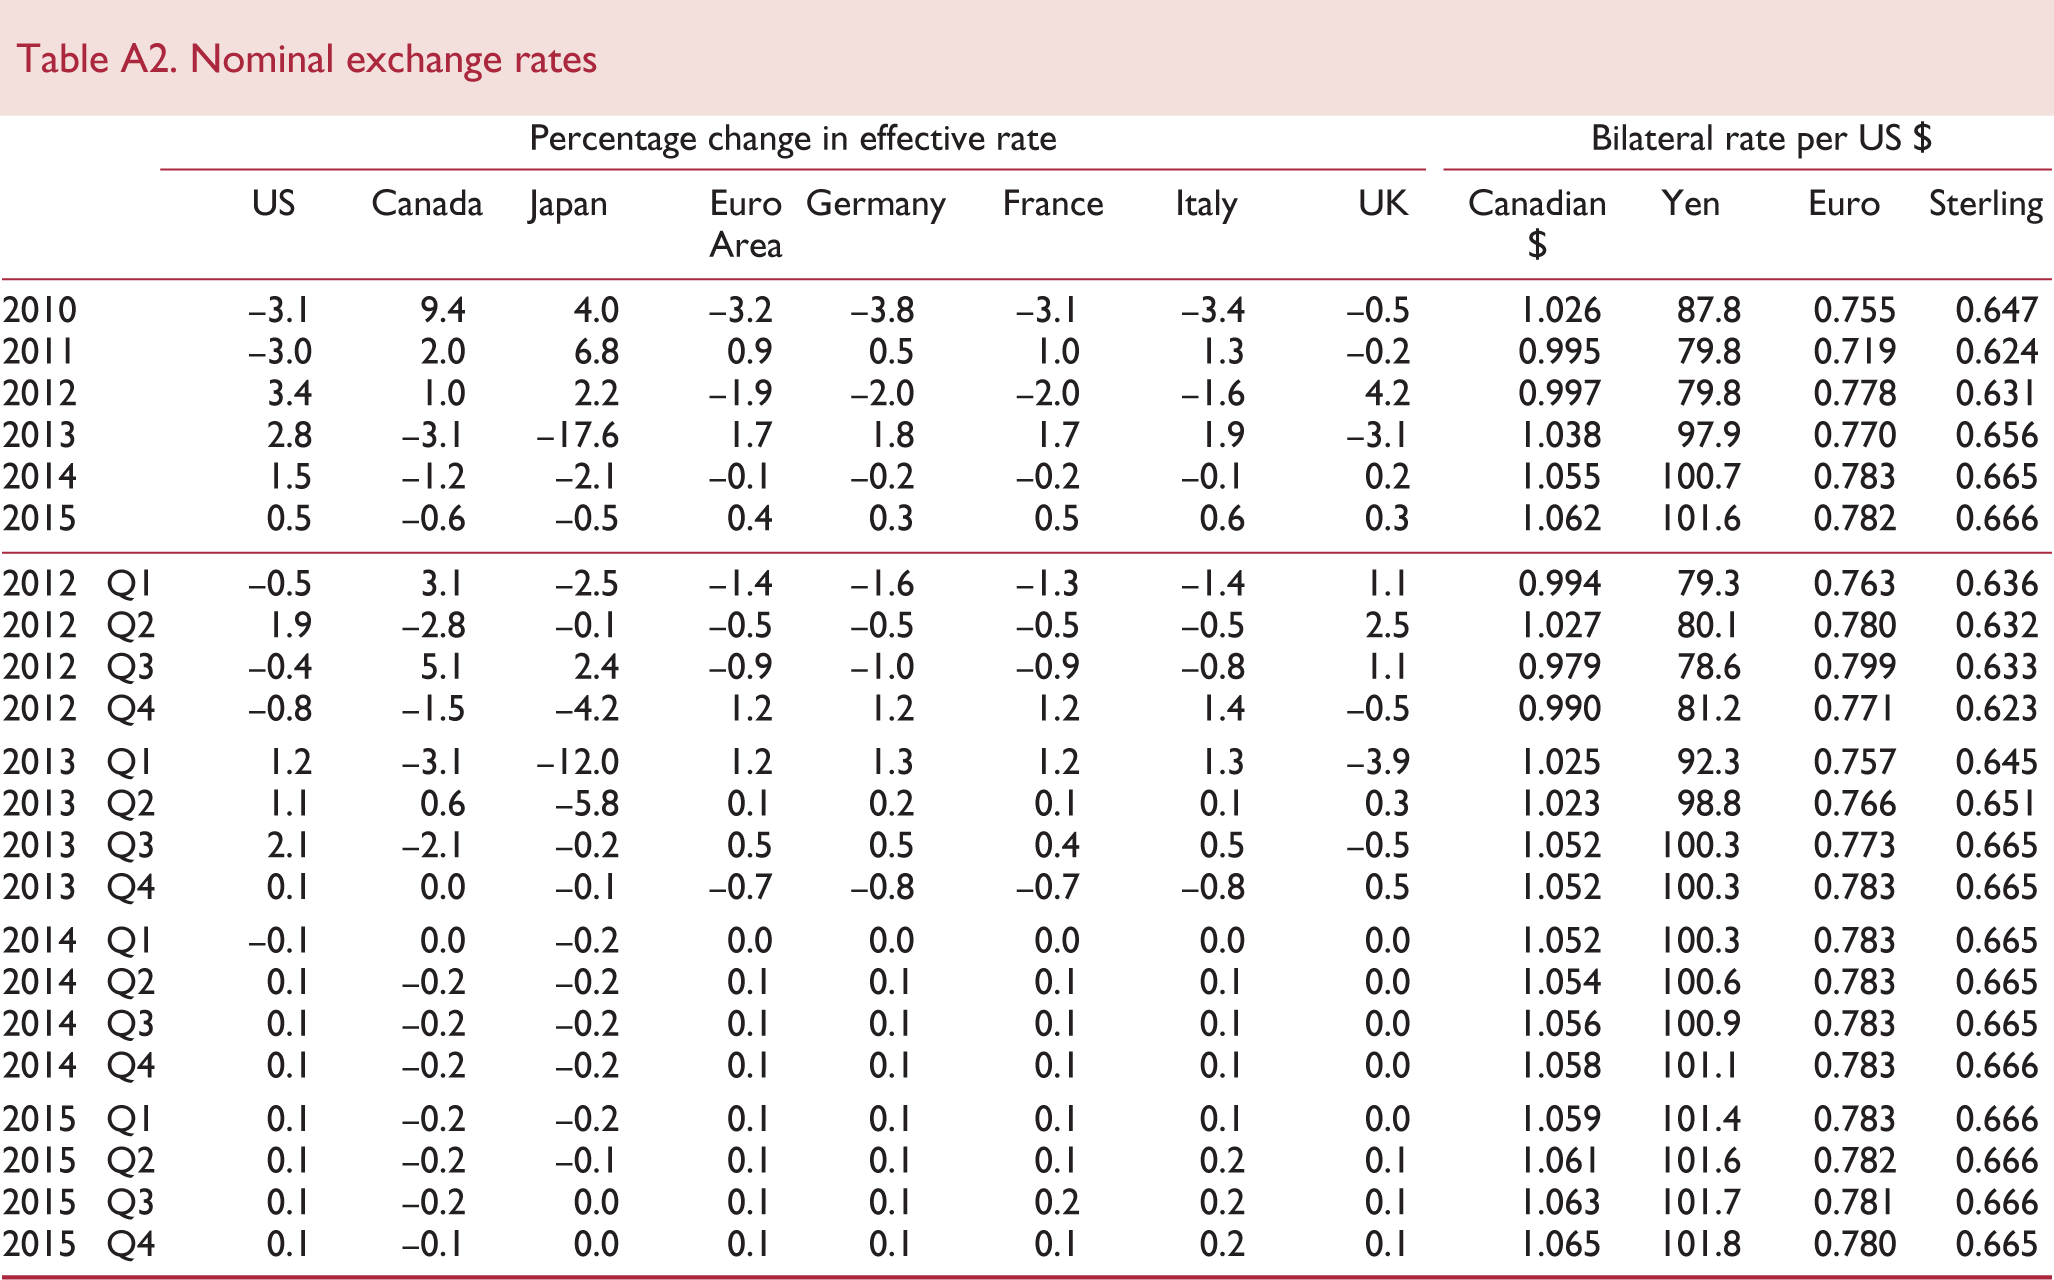
Interest rates in the US and Canada are expected to begin to rise in early 2015, preempting rate rises in Europe and Japan by 2–3 quarters. This is broadly consistent with the interest rate path signalled for the US by the Federal Open Market Committee (FOMC), which has stated that it plans to keep the target range for the federal funds rate unchanged at least as long as the unemployment rate remains above 6½ per cent. At its most recent meeting in June 2013, the FOMC announced that it would continue quantitative easing measures, but has signalled a move towards a gradual tapering of QE, subject to continued improvements in the labour market. Global financial markets reacted strongly to the change in stance, putting upward pressure on global bond yields and triggering a temporary drop in global share prices. The move is in contrast to the looser stance adopted by the ECB and especially the radical loosening measures introduced by the Bank of Japan at the beginning of April 2013. The slant, if not the specifics, of the Japanese measures was widely anticipated following the election of Prime Minister Shinzo Abe in December 2012, and can largely explain the sharp depreciation of the yen since December.
Figure A1 illustrates the recent movement in, and our projections for, 10-year government bond yields in the US, Euro Area, Japan and Canada. The rise in government bond yields started in early May 2013, well in advance of the June statement by the FOMC. While yields have drifted down marginally since their recent peak in early July, the level of bond yields in the UK and the US is expected to be about 50 basis points higher in 2014 than anticipated three months ago, and up by about 15 basis points in Japan. In the Euro Area, average bond yields are broadly unchanged, as the recent rise in yields in Germany is offset by a narrowing of spreads over Germany in the vulnerable economies of Greece, Portugal, Spain, Ireland and Italy. Box A in the World Overview section quantifies the macroeconomic impact of the recent movement in long rates using NiGEM simulations.
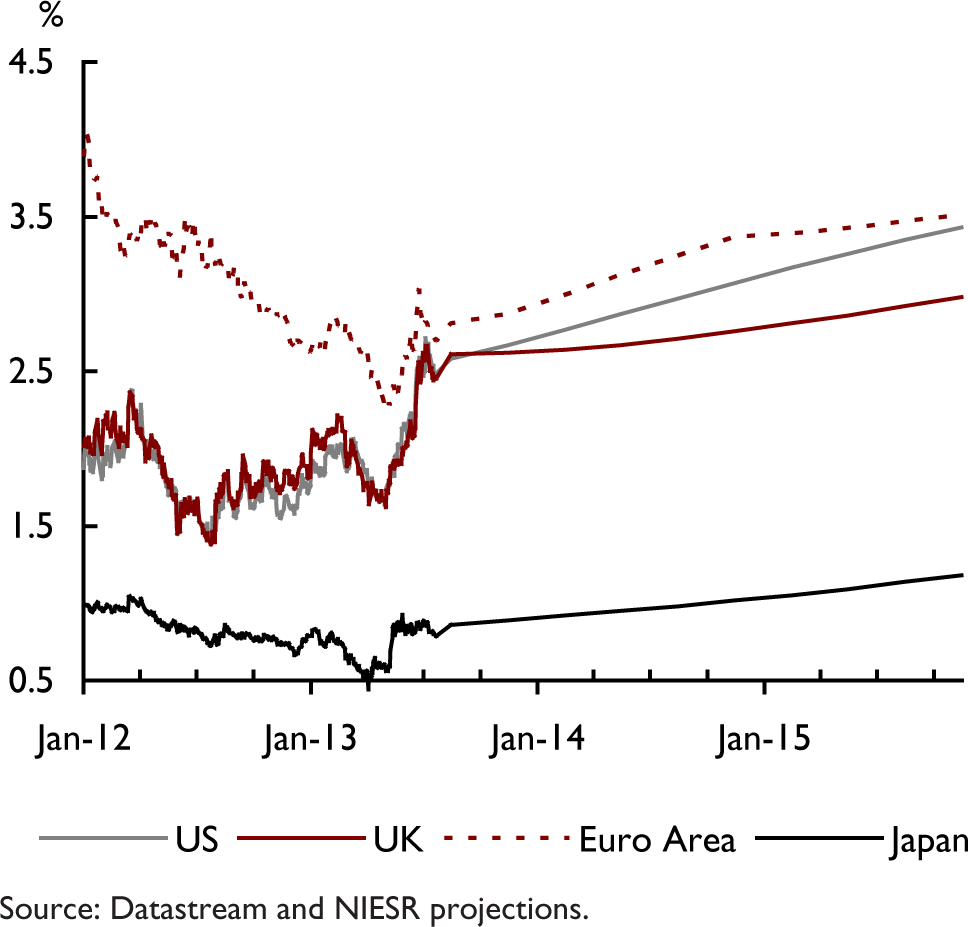
10-year government bond yields
Figure A2 depicts the spread between 10-year government bond yields of Spain, Italy, Portugal, Ireland and Greece over Germany. Sovereign risks in the Euro Area have been a major macroeconomic issue for the global economy and financial markets over the past two years. The final agreement on the Private Sector Involvement in the Greek default in February 2012 and the Outright Money Transactions (OMT) introduced by the ECB in August 2012 brought some relief to bond yields in the vulnerable economies last year. There was surprisingly little reaction to the Cyprus crisis in Spring 2013, although there has been some recent upward pressure on yields in Portugal in particular, related to uncertainty over the fiscal austerity programme, parts of which were declared unconstitutional. In our forecast, we have assumed spreads remain at current levels until the end of 2014, and start to recede in 2015 in all Euro Area countries. The implicit assumption underlying this is that the Euro Area continues to hold together in its current form and progress is made towards establishing a banking union.
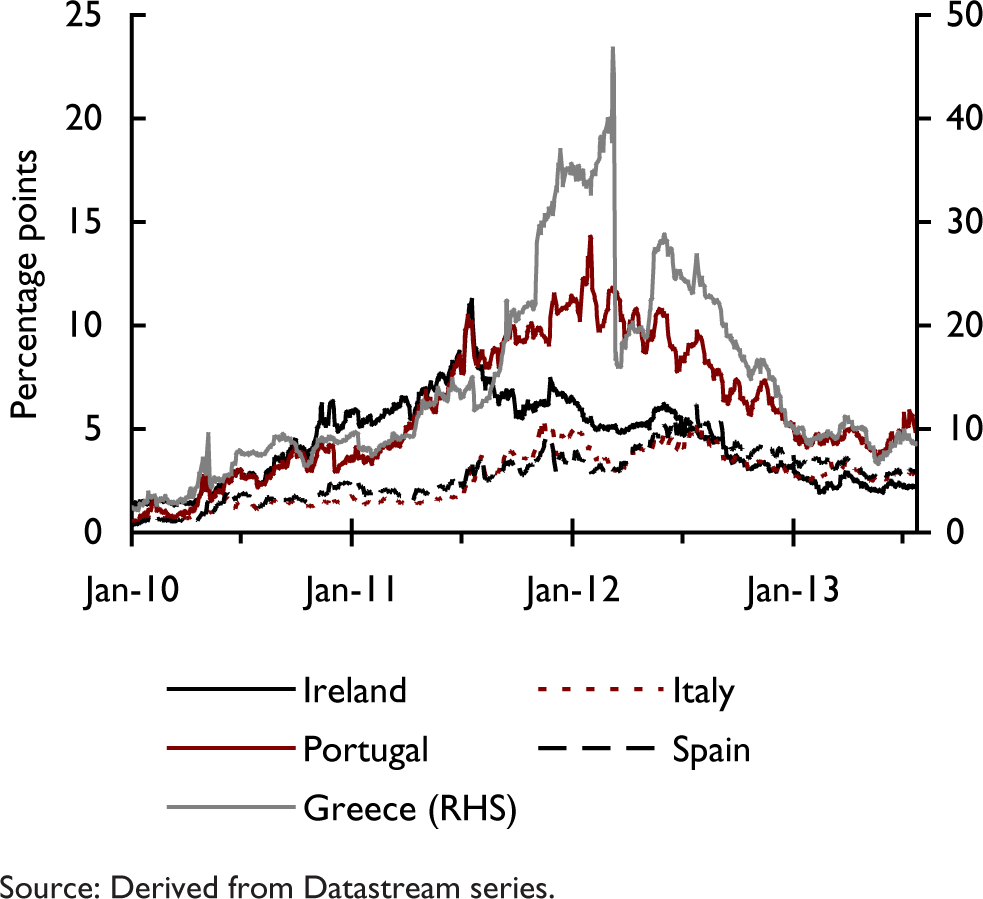
Spreads over 10-year German government bond yields
Figure A3 reports the spread of corporate bond yields over government bond yields in the US, UK and Euro Area. This acts as a proxy for the margin between private sector and ‘risk free’ borrowing costs. Private sector borrowing costs have risen more or less in line with or less than the observed rise in government bond yields since May, illustrated by the stability of these spreads in the US and Euro Area and a marginal decline in the UK. Our forecast assumption is for corporate spreads to remain at current levels until the end of 2014, and then recede gradually by 30–40 basis points from 2015. Nominal exchange rates against the US dollar are generally assumed to remain constant at the rate prevailing on 11 July 2013 until the end of March 2014. After that, they follow a backward-looking uncovered-interest parity condition, based on interest rate differentials relative to the US. We have modified this assumption for the Euro Area and China. For the euro, we have assumed that the anticipated interest rate cut in the second half of this year will lead to a modest depreciation of the currency of about 0.7 per cent in effective terms. For China we have assumed that the exchange rate target continues to follow a gradual appreciation against the US$, of about 3½ per cent in 2014, 3 per cent in 2015 and 2¾ per cent in 2016.
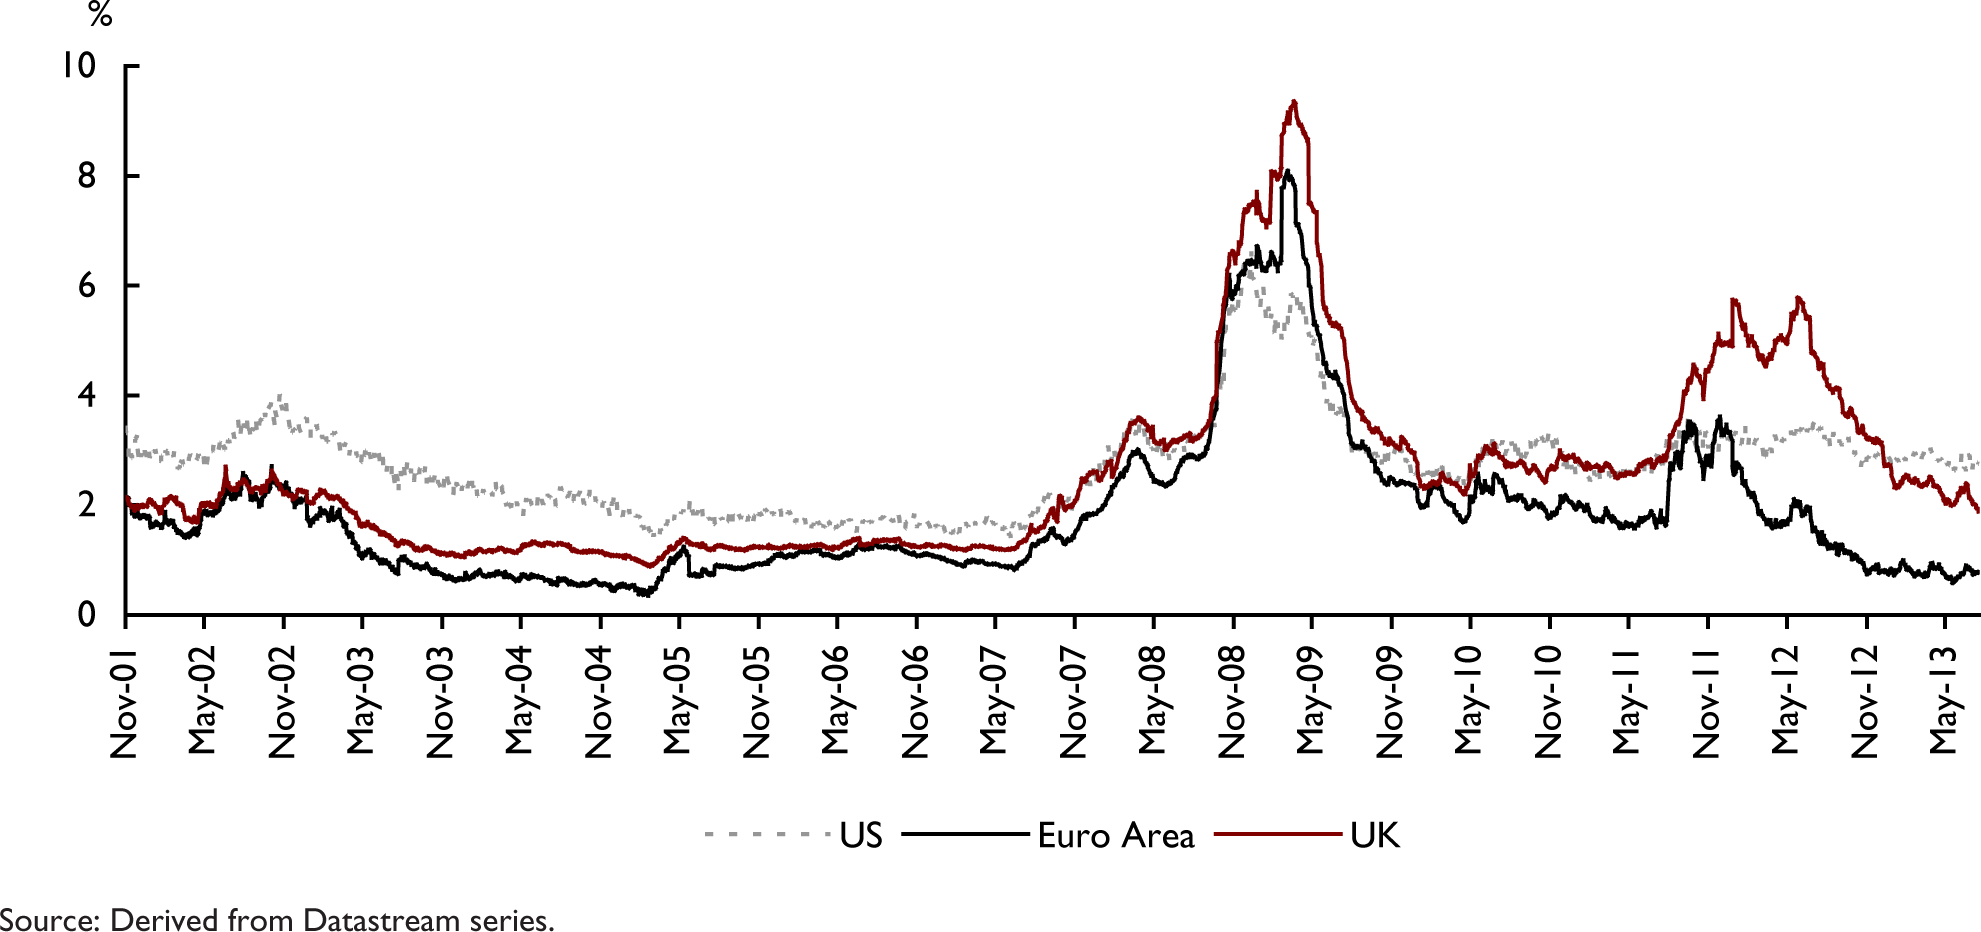
Corporate bond spreads. Spread between BAA corporate and 10-year government bond yields
Our oil price assumptions for the short term are based on those of the US Energy Information Administration, who use information from forward markets as well as an evaluation of supply conditions, and are reported in table 1 at the beginning of this chapter. The price of oil has come down marginally since the start of the year, although the most recent movements in July have been upward. Our forecast assumption is for a modest decline in oil prices in 2014 of about $5–6 per barrel. Over the medium term, oil price growth will be restrained in part by the rise in new extraction methods for oil and gas, especially in the US (see the discussion in February 2013 National Institute Economic Review).
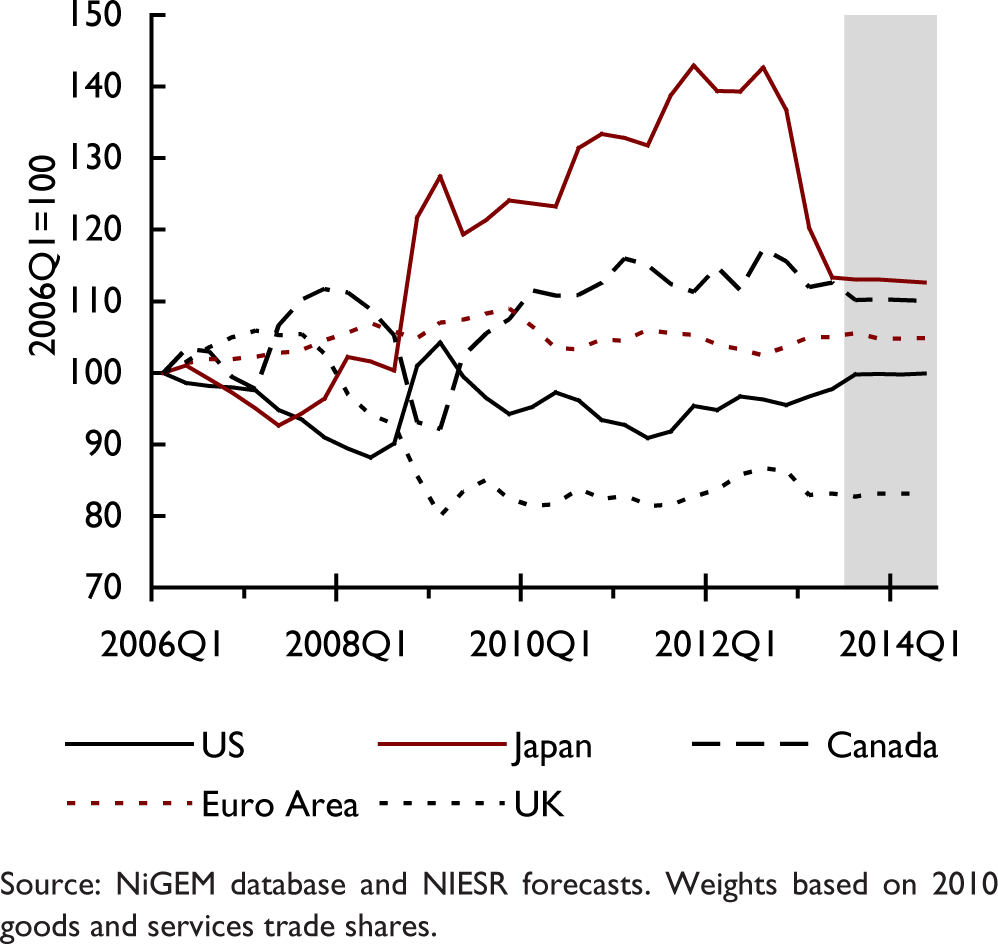
Effective exchange rates
Our equity price assumptions for the US reflect the expected return on capital. Other equity markets are assumed to move in line with the US market, but are adjusted for different exchange rate movements and shifts in country-specific equity risk premia. Figure A5 illustrates the key equity price assumptions underlying our current forecast. Global share prices dropped in reaction to the signals from the Federal Reserve that it may begin to taper QE, but these declines were short-lived and major equity markets have more or less recovered. Share prices in some of the more vulnerable economies of the Euro Area, however, remain depressed relative to their position in the first quarter of 2013 (Greece, Portugal, Spain, Slovenia). The most significant gains have been in Japan. Since the end of 2012, share prices in Japan have jumped by more than 50 per cent, mirroring the exchange rate movements over the same period.
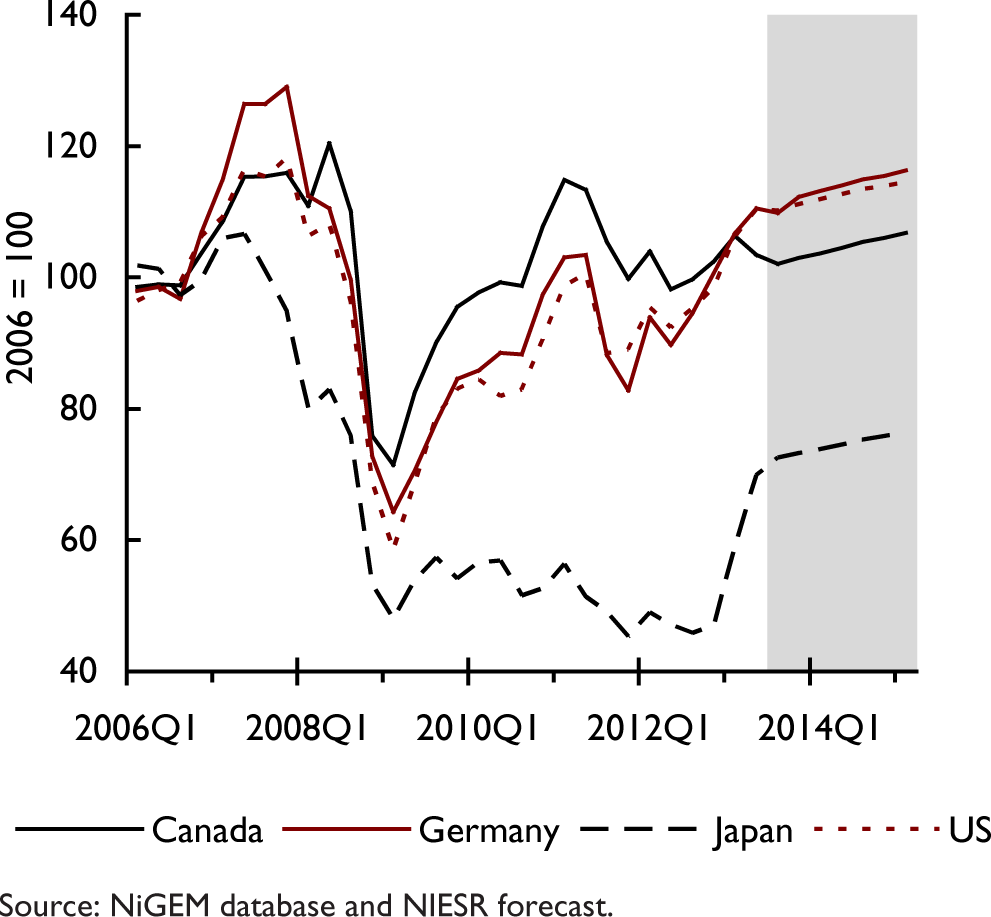
Share prices
Fiscal policy assumptions for 2013–14 follow announced policies as of 1 July 2013. Average personal sector tax rates and effective corporate tax rate assumptions underlying the projections are reported in table A3. Our forecast also incorporates planned/enacted VAT rate rises in 2013–14 for Canada, Finland, France, Italy and Japan, and a decline in Ireland. Government spending is expected to decline as a share of GDP between 2012 and 2014 in most countries reported in the table, with the exceptions of Germany and Greece. We expect the burden of government interest payments to rise in the vulnerable Euro Area economies of Ireland, Spain, Greece, Portugal and Italy, as well as in the UK. Recent policy announcements in Portugal, Spain, Italy and elsewhere, suggest that the commitment to fiscal austerity in Europe may be waning. A policy loosening relative to our current assumptions poses an upside risk to the short-term outlook in Europe. For a discussion of fiscal multipliers and the impact of fiscal policy on the macroeconomy based on NiGEM simulations, see Barrell, Holland and Hurst (2013).
Government revenue assumptions
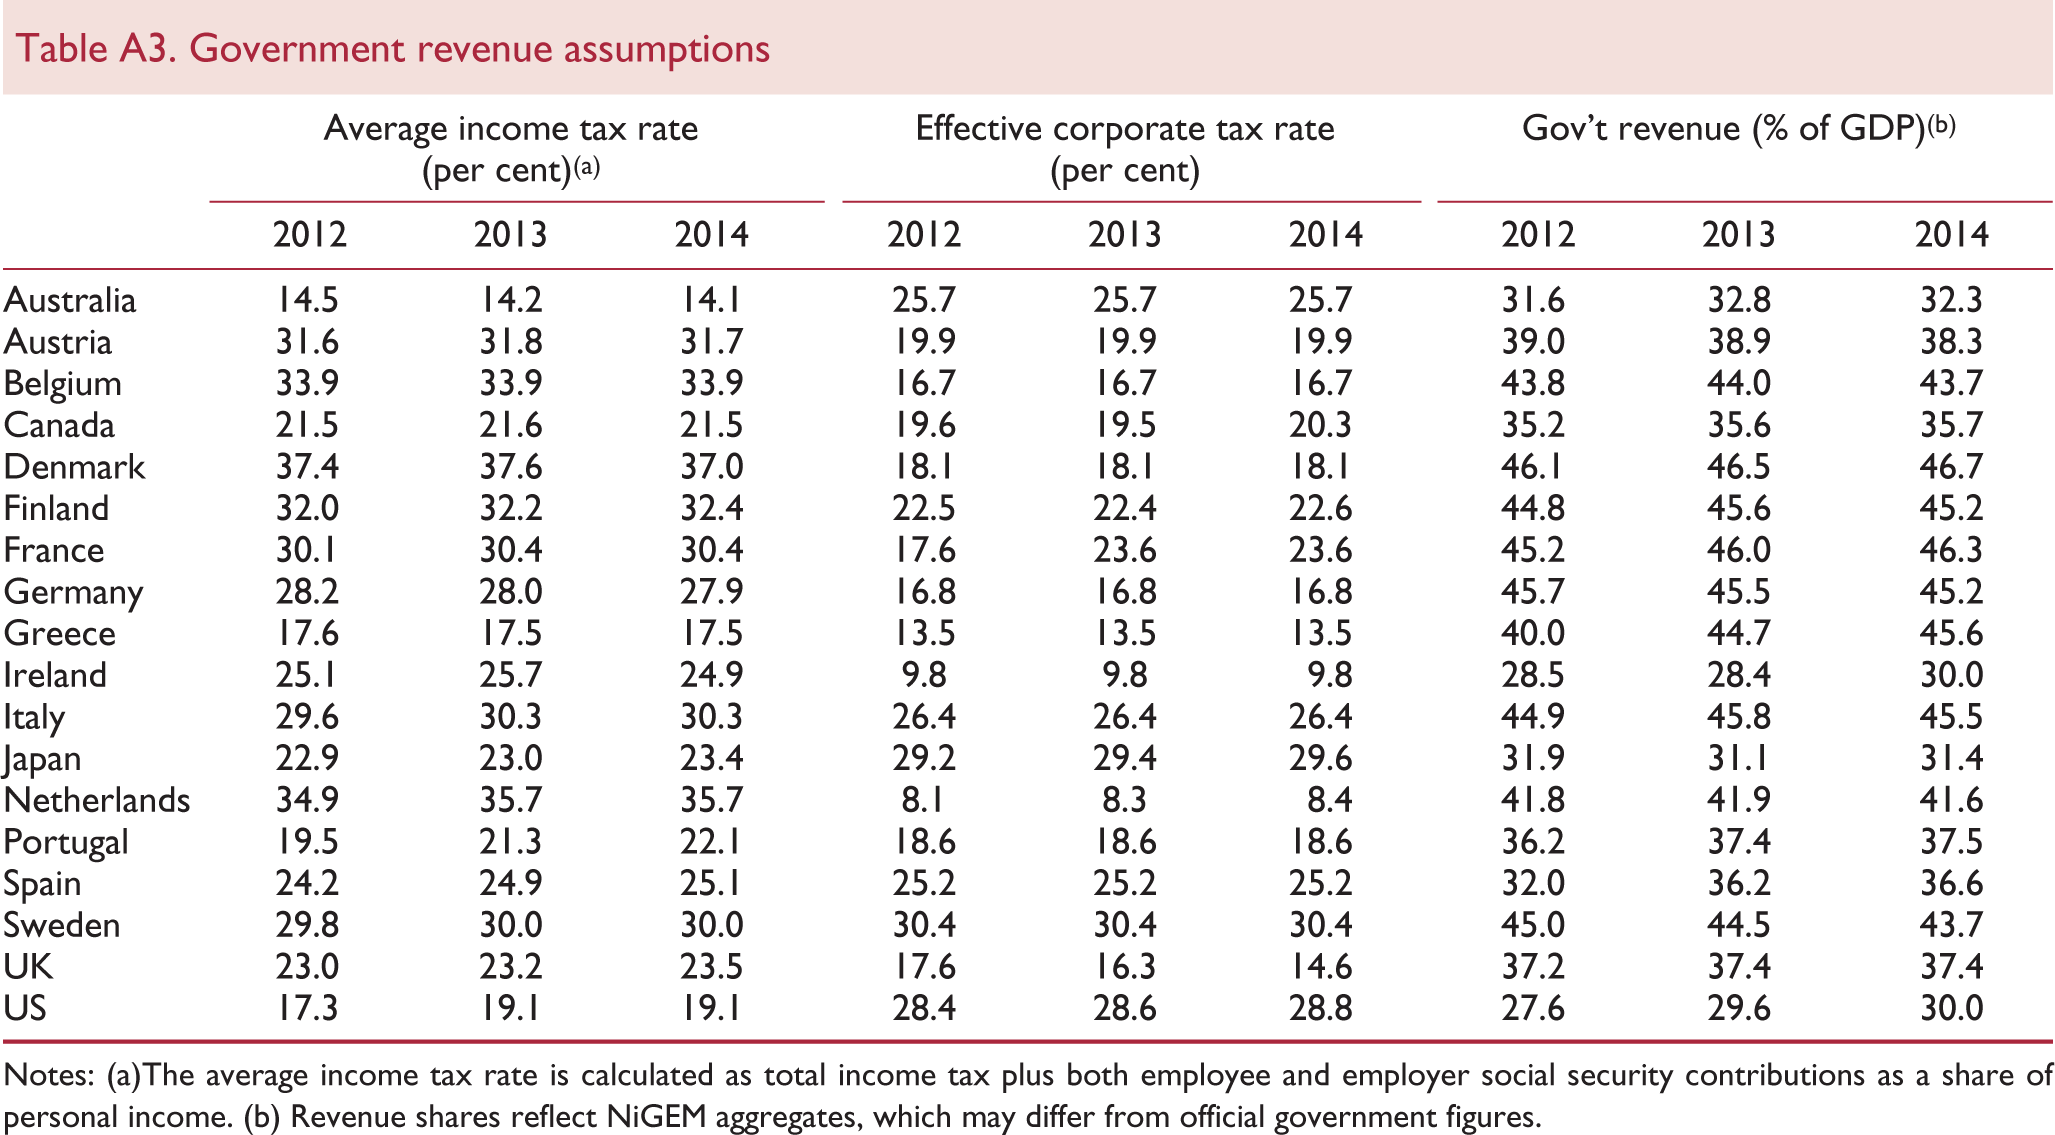
Notes: (a)The average income tax rate is calculated as total income tax plus both employee and employer social security contributions as a share of personal income. (b) Revenue shares reflect NiGEM aggregates, which may differ from official government figures.
Government spending assumptions(a)
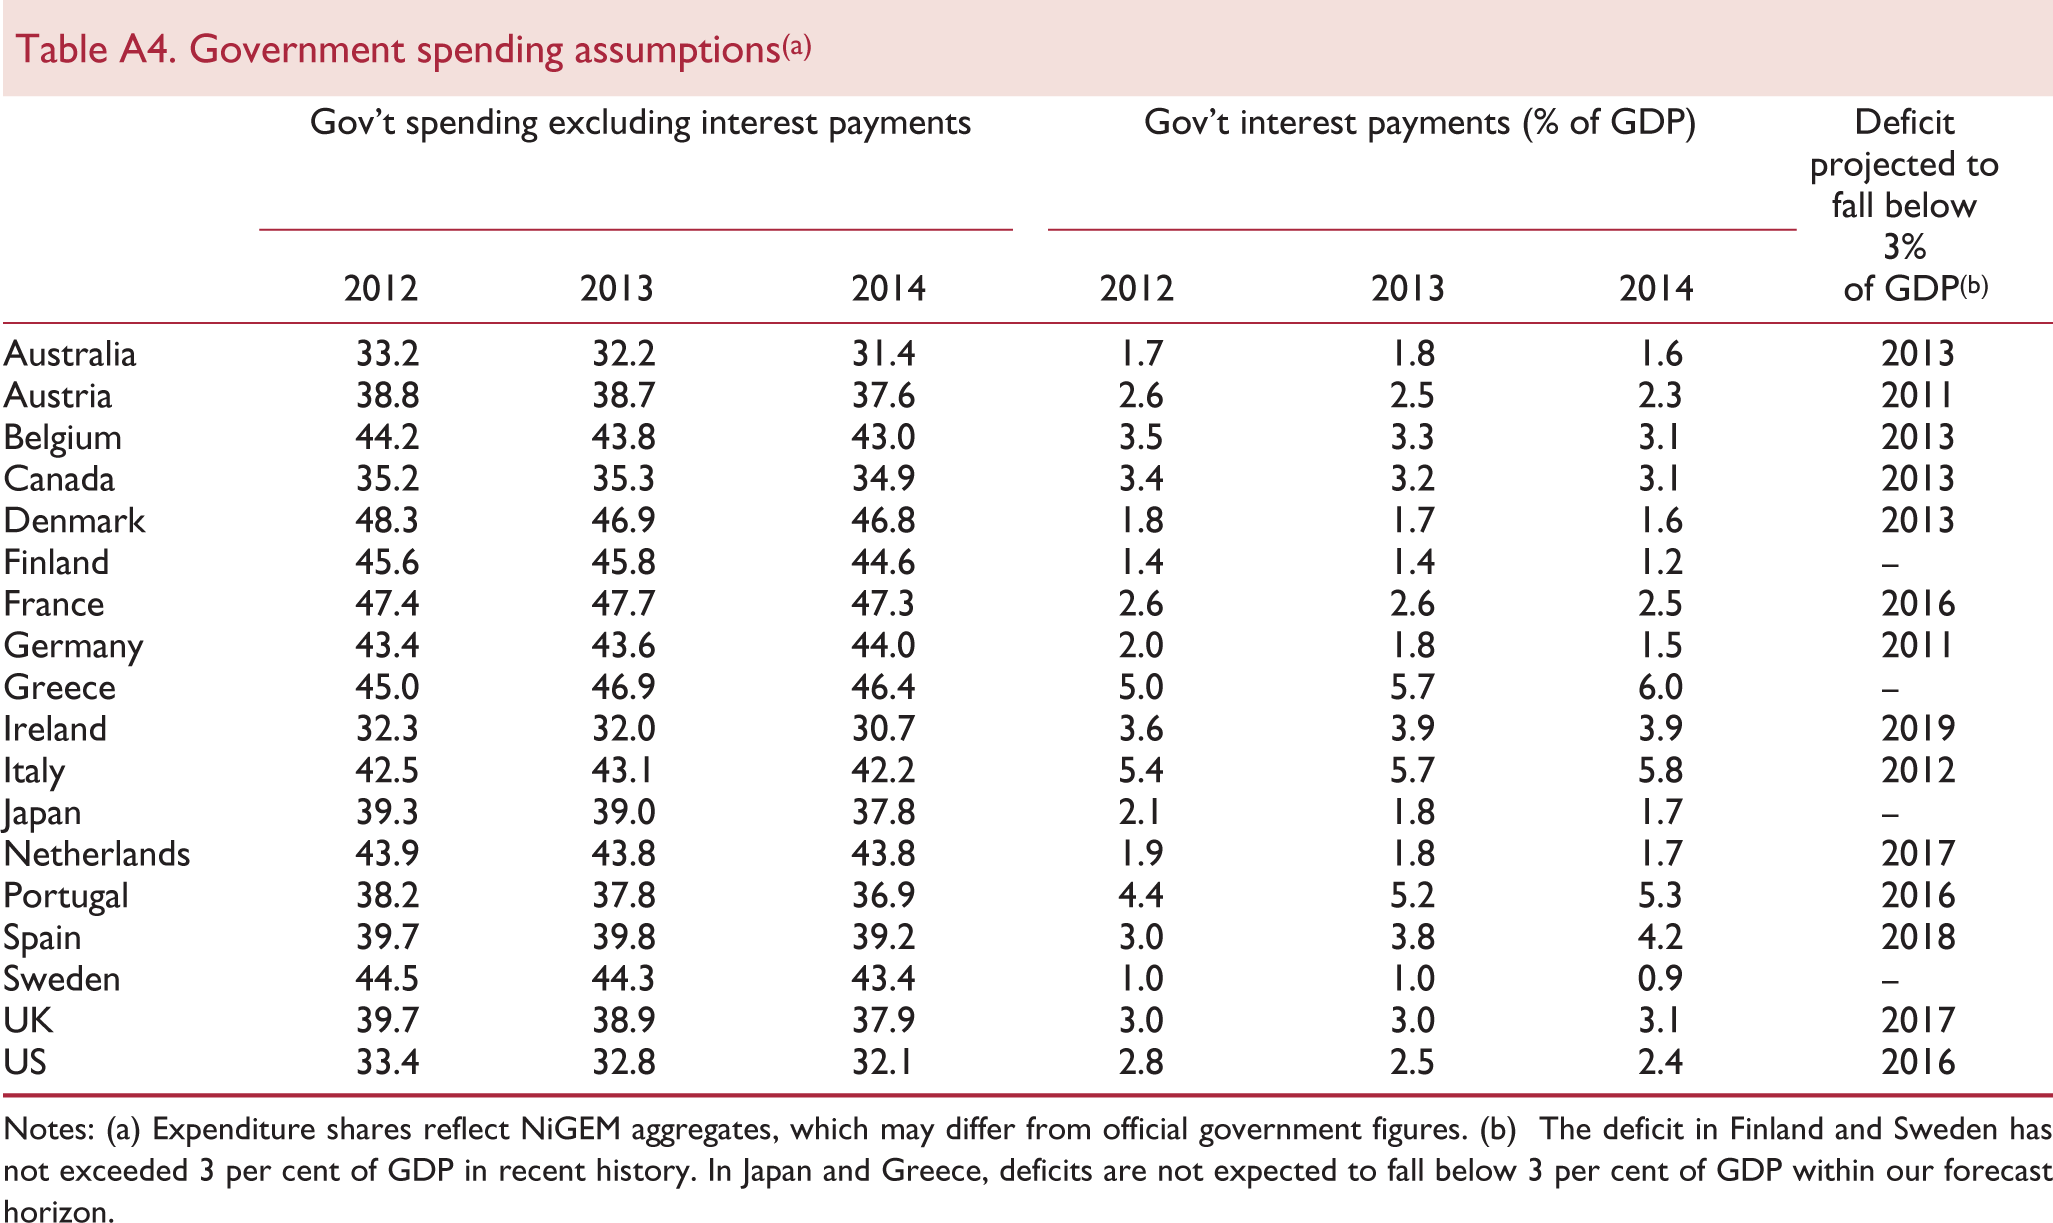
Notes: (a) Expenditure shares reflect NiGEM aggregates, which may differ from official government figures. (b) The deficit in Finland and Sweden has not exceeded 3 per cent of GDP in recent history. In Japan and Greece, deficits are not expected to fall below 3 per cent of GDP within our forecast horizon.
Footnotes
1
Indonesia, Singapore, Vietnam and Turkey were all added as separate country models within NiGEM in July 2013.