
Abstract
Research on anti-immigrant attitudes in the United Kingdom in the past has focused primarily on feelings of prejudice driven by local concentrations of ethnic minorities. The immigration debate, however, has arguably changed since the EU expansions and the economic crisis of the past decade. This paper tests whether public support for immigration restriction is empirically driven by factors such as resource scarcity and economic stagnation, skill supply of native and immigrant workers, and the origin of immigrants from poorer countries within and outside the EU. Survey data from the European Social Survey between 2002 and 2010 are matched with regional level indicators calculated using the UK Labour Force Surveys. Findings suggest that support for immigration restriction is higher in regions where more immigrants are unemployed, but lower in regions where more natives are unemployed for longer than a year. Both the origin and ethnicity of the immigrant population appear to play a role in immigration policy preferences among native respondents.
1. Introduction
The UK coalition government's promise in 2011 to reduce net immigration from its then current 250,000 to “tens of thousands” by the next general election, came as a response to popular concerns over the impact of immigration in the United Kingdom. Public policy has been under increasing pressure to limit immigration inflows on the grounds of competition over limited job opportunities, mismatch between skill demand and supply, slow economic growth and incurring costs on the tax and welfare system.
Previous research on the contextual sources of natives’ attitudes towards immigrants and ethnic minorities in the UK has focused primarily on feelings of threat or prejudice and the composition of the population at the local level in terms of ethnicity (Schaefer, 1975; Dustmann and Preston, 2001; Bowyer, 2009). Existing literature has seldom addressed natives’ support for imposing immigration restrictions, nor other salient elements of the current immigration policy debate, namely, immigration from the EU, job scarcity, skill supply and economic growth. This paper contributes to the empirical literature by testing to what extent natives’ favour for restricting immigration to the UK is driven by the current economic climate, the supply of skill in the labour market, and the composition of the population in terms of both country of birth and ethnicity. Also, analysis here focuses on the years between 2002 and 2010, which can be of particular interest for immigration policy preferences in the United Kingdom and have not been examined previously. On the one hand, they coincide with the EU expansions of 2004 and 2006, which opened up the UK's borders to citizens of twelve European countries and triggered a somewhat new debate about the dangers of immigration coming from within Europe. On the other hand, the London bombings of July 2005 also reignited the issue of controlling immigration from countries outside Europe. Finally, the 2008 economic crisis generated a great deal of attention to the issue of resource scarcity and the UK's ability to accommodate a growing immigrant population.
The empirical analysis draws on survey data from the five rounds of the European Social Survey, between 2002 and 2010. The sample includes UK-born respondents who are resident across the twelve Government Office regions of the United Kingdom and do not belong to an ethnic minority. Preferences over immigration policy are measured using three survey questions that ask respondents how many immigrants from different origin countries and ethnic groups should be allowed to come and live in the UK. Indicators of regional conditions are calculated using the UK Labour Force Surveys and matched with each respondent based on their region of residence and year they participated in the survey. The calculation of the regional measures using the individual level dataset of the UK Labour Force Survey facilitates the construction of nationally representative indicators that vary over time. It also enables the calculation of measures that are more relevant to the scope of this analysis, such as the unemployment rate and average skill supply separately among natives and among immigrants, as well as indicators that distinguish between the country of birth and ethnicity of the population.
2. Immigration and attitudes towards immigrants in the UK
In the UK, the industrial expansion following the Second World War and its subsequent need for low-skilled labour contributed to a large inflow of ethnically diverse populations, mostly from the former colonies in Asia and the Caribbean, into an otherwise ethnically homogenous country (Dustmann and Frattini, 2013). Despite these inflows being welcomed at first, the oil crises of the 1970s led to a halt in economic growth and a significant increase in unemployment, during which time most immigrants settled in the UK and were joined by their families. Although many former immigrants from the Commonwealth acquired British nationality, visible racial and cultural differences with the predominantly white British population often blur the line that separates ethnic minorities with British nationality and immigrants.
Empirical literature on natives’ anti-immigration attitudes in the United Kingdom dates back to the 1970s (Schaefer, 1973; Elkin and Panning, 1975; Schaefer, 1975; Studlar, 1977, 1978). Studlar (1978) argues that the ‘coloured’ immigration issue of the General Election in 1970 gave a distinct advantage to the Conservatives, who were seen by voters as more likely to keep immigrants out. The debate has remained largely the same since then, although it has now extended to the economic dangers of a sudden surge of immigrants from the new EU member states, with full working rights, freedom of movement and access to the welfare system. Studies have found no strong evidence to support the claim that there are overall negative effects from immigration on the level of unemployment, wages and skill distribution in the UK workforce (Dustmann et al., 2005). Nevertheless, the prevailing assumption is that the revival of anti-immigration attitudes is a response to the current economic climate and the pressures of increasing immigration. In this paper, the objective is to test the expectation that preferring immigration restriction is driven by local concentrations of immigrants from poorer European or non-European countries, rising unemployment and the share of natives and immigrants with high and with no qualifications.
Studies that try to identify contextual sources of anti-foreigner sentiments in the United Kingdom have focused primarily on ethnic prejudice driven by local concentrations of ethnic minorities. Elkin and Panning (1975) find that prejudice towards immigrants from Southeast Asia and the Caribbean is highest among native respondents with no previous contact with immigrants despite being aware of their presence in the neighbourhood. Schaefer (1975) however finds that prejudice is higher in towns where residents have greater personal experience with immigrants. He finds that respondents in Southwest and Northwest England exhibit the highest levels of prejudice, whereas residents of the Southeast exhibit the lowest. One of the more recent studies on racial attitudes in England finds that members of the white English population do not view all ethnic minority groups as equally threatening. The probability of expressing prejudice increases with the relative size of population from Pakistan and Bangladesh, while it decreases with the size of black population (Bowyer, 2009). Ford and Goodwin (2010) study the determinants of support for the British National Party (BNP) between 2002 and 2006 and find evidence that immigration is perceived by supporters of all parties, although overwhelmingly among BNP voters, as one of the top three problems facing Britain today. Finally, Crawley et al. (2013) focus on regional variations of attitudes towards refugees throughout Great Britain and find evidence that those living in London and Scotland have more tolerant views towards refugees, compared to those living in other regions.
The conflicting findings in the literature may be a result of changes in attitudes over time or variations in the way attitudes towards immigrants and ethnic minorities are measured. However, divergent results may also be driven by differences in geographical focus across studies that range from small areas such as wards or districts, to larger geographies such as constituencies and regions (Bowyer, 2009). Dustmann and Preston (2001) argue that location decisions of natives are partly driven by existing attitudes towards minorities, who tend to cluster in particular neighbourhoods more than others. As a consequence, analyses based on small geographical areas are likely to identify more positive attitudes within areas with more immigrants.
Analysis here focuses on regions of the UK, which are large enough to minimise the underestimation of anti-immigration attitudes associated with the location decisions of native respondents. Another advantage of focusing on regions is that smaller geographical areas provide for less robust aggregated measures compared to regions, due to the limited sample size available in surveys to calculate the indicators. At the regional level, the Labour Force Survey allows for the calculation of more reliable and nationally representative indicators that vary over time and account for unemployment and skill supply separately for immigrants and natives. Finally, analysis at the regional level can include demographic indicators separately for the origin and ethnicity of the population. Native respondents’ attitudes towards recent immigrants might be partly informed by the presence of existing minority ethnic groups, that are likely to include second and third generation immigrants. It should be noted, however, that despite their advantages, the large size of UK regions entails that measures of the relative size of immigrant population are probably less representative of respondents’ immediate locality and, therefore, not ideal for addressing the impact of close inter-group contact.
3. Theoretical framework
The theoretical framework in this paper follows the rational-conflict literature and focuses on contextual sources of individual anti-immigration opinion. Rational explanations build upon the calculation of material and non-material costs and benefits of immigration for the native population, both at the individual and aggregate level. Racism and prejudice are interpreted as group bias resulting from group conflict, which previous literature traces in two types of competition. One is labour market competition and argues that individual preferences over immigration policy reflect the individual's interests deriving from his or her labour market status (Bonacich, 1972; Borjas, 1999; Slaughter and Scheve, 2001). The other is competition as a function of the group's social position, which suggests that prejudice is a result of collective threat and emerges as groups develop a sense of social position relative to one another (Blumer, 1958). The ‘dominant’ or majority group, in this case the native population, develops the view that certain resources or accepted practices belong exclusively to them (Bobo, 1983; Quillian, 1995).
In line with rational-based explanations of anti-immigration opinion, a large amount of existing research focuses on the influence of the context in which the individual resides. Different surrounding conditions in terms of resource availability and presence of immigrants may trigger different evaluations of the impact of immigration, as well as change the level of saliency of those consequences for the native population as a whole (Hopkins, 2011). Therefore, the perceived impact of immigration is assumed to be a function of the actual circumstances surrounding the individual (Middleton, 1976; Studlar, 1977; Quillian, 1996; Stein et al., 2000; Branton and Jones, 2005; Wagner et al., 2006; Tolsma et al., 2008; Rustenbach, 2010).
Intergroup conflict theory is an extension of rational competition theories and looks at aggregate levels of competition between natives and immigrants. Since the native group's privileges are seen as being threatened by the immigrant group, then the more scarce the resources and the larger the immigrant group, the bigger the aggregate threat (Rowthorn and Coleman, 2004). These explanations largely assume that industrialised developed countries, such as the UK, mostly attract poor or unskilled immigrants who come seeking to improve their economic prospects by taking resources which are unavailable in their home country, rather than contributing to the local workforce (Citrin et al., 1997; Facchini and Mayda, 2009). These types of immigrants are seen as more likely to accept lower wages, thus creating a downward pressure on native workers’ wages. Immigrants from poorer countries are also seen as more likely to abuse or rely on the welfare system, to which they have not contributed, causing taxes to rise (Hainmueller and Hiscox, 2010). Finally, by increasing labour supply and changing the skill structure of the workforce, immigrants from both richer and poorer countries are seen as contributing to native unemployment (Dustmann et al., 2005).
On the basis of conflict theory, the following theoretical expectations can be formed. Natives in regions with more immigrants and higher native unemployment will be more likely to support restriction of all types of immigration. Those in regions with a better performing economy are expected to hold less restrictionist views on immigration, since a growing economy will be seen as capable of absorbing immigrants with fewer adverse effects on natives (Borjas, 1999). Natives in regions where a larger share of immigrants are unskilled or unemployed are expected to show increased support for immigration restrictions, due to competition over limited resources. A larger share of highly skilled immigrants is expected to increase competition for highly skilled jobs and thereby increase support for imposing border restrictions.
Previous findings from cross-national research partly confirm these expectations. Higher percentages of non-western and low-educated immigrant population have been found to increase feelings of threat from immigration (Schneider, 2007). With respect to economic conditions, the literature finds that a higher GDP per capita and higher annual economic growth are associated with less anti-immigration attitudes (Schneider, 2007; Billiet et al., 2014). Existing studies also find conflicting evidence in terms of unemployment, which seems to have a very small and sometimes negative impact on anti-immigration opinion (Rustenbach, 2010). However, recent findings indicate that, while a higher unemployment rate among natives is related to less negative views on immigration, a higher immigrant unemployment rate is associated with increased feelings of threat (Markaki and Longhi, 2013).
Contrary to intergroup conflict, the literature on intergroup contact expects that a larger share of immigrants over the population will eventually lead to more positive attitudes towards immigrants. Contact theory posits that more immigrants increase the chances for contact and exposure between immigrants and natives. Increased contact between natives and immigrants increases intergroup familiarity, decreases group differences and, consequently, reduces feelings of threat (Semyonov and Glikman, 2009; Wessel, 2009; Johnston et al., 2010). Previous literature following this framework has used the share of immigrants relative to the native population as a measure of intergroup contact (Stein et al., 2000; Bowyer, 2009). However, recent studies focusing on the contact hypothesis argue that a larger share of immigrants over the population may only reduce feelings of threat under certain conditions of contact between natives and immigrants (Christ et al., 2010; Barlow et al., 2012). These findings suggest that the share of the immigrant population resident in an area is not a sufficient proxy for increased contact, in the absence of measures related to each respondent's quality and quantity of contact with immigrants. The contact hypothesis cannot be fully tested in this paper, since the European Social Survey does not supply information on personal contact with immigrants across all survey rounds. Nonetheless, if a very large share of immigrant population reverses feelings of threat among natives due to familiarity, then support for immigration restriction may have an inverted U-shaped association with the relative size of immigrant population. Therefore empirical analysis here accounts for a possible non-linear relationship between the share of immigrants in the region and support for immigration restriction.
4. Data and measurement
The empirical analysis in this paper uses individual survey data from the European Social Survey (ESS), with the addition of regionally aggregated indicators computed from the UK Labour Force Survey (LFS). The ESS is a large-scale biennial cross-sectional survey conducted in many countries in Europe. The sample of respondents used in this paper is pooled from the five rounds of the survey, between 2002 and 2010, and focuses on respondents resident in the United Kingdom who are native-born and do not belong to a minority ethnic group. The final sample contains approximately 7,900 individuals.
4.1 Dependent variables
Preferences over immigration policy are measured with three dependent variables. The first is concerned with how many immigrants the respondent thinks should be allowed into the country ‘from the same race or ethnic group as the majority of the UK's population’. The second directs the question to immigrants of ‘a different race or ethnic group from the majority of the population’, while the third refers to restricting immigration ‘from poorer countries outside Europe’. The three question items are as follows:
1
Now […] to what extent do you think [the UK] should allow people of the same race or ethnic group as most [UK] people to come and live here? Allow many/ some/ a few/ none How about people of a different race or ethnic group from most [UK] people? Allow many/ some/ a few/ none How about people from the poorer countries outside Europe? Allow many/ some/ a few/ none
For ease of interpretation, the original questions are recoded into binary variables with 0 for allow ‘many’ and ‘some’ and 1 for allow ‘a few’ and ‘none’. Effectively, the dependent variables are set in a way as to identify intentions of restricting immigration, either partially (a few), or entirely (none) from particular ethnic groups and origins. The first measure's reference to ethnically similar immigrants is likely to be understood by the respondents as referring to ethnically white immigrants, while the second measure is likely to be understood as referring to immigrants who are not ethnically white. Although these two questions refer to the ethnicity or race of immigrants, irrespective of origin, it is likely that respondents associate certain ethnicities with particular origins. For example, some respondents may associate ethnically similar immigrants as originating from high-income and perhaps English speaking nations such as the USA, Canada, or Australia. On the other hand, considering the political climate in the UK regarding the expansions of the EU, respondents are likely to associate the question with immigration from Poland, Bulgaria, or other low-income countries in Central, Eastern, and Southern Europe. The difference in interpretation may pose a problem if, for instance, a respondent supports restriction of immigration from Poland but not from Canada. Nonetheless, this discrepancy is likely to introduce larger errors, leading to an underestimation of relationships, rather than overestimation. The third dependent variable explicitly refers to the origin of immigrants as coming from poorer countries outside Europe. 2 It is likely that this measure prompts respondents to state their opinion on restricting immigration from low-income countries in Africa, Asia or Latin America. Summary statistics on the three measures are shown in table 1.
Summary statistics for individual level variables
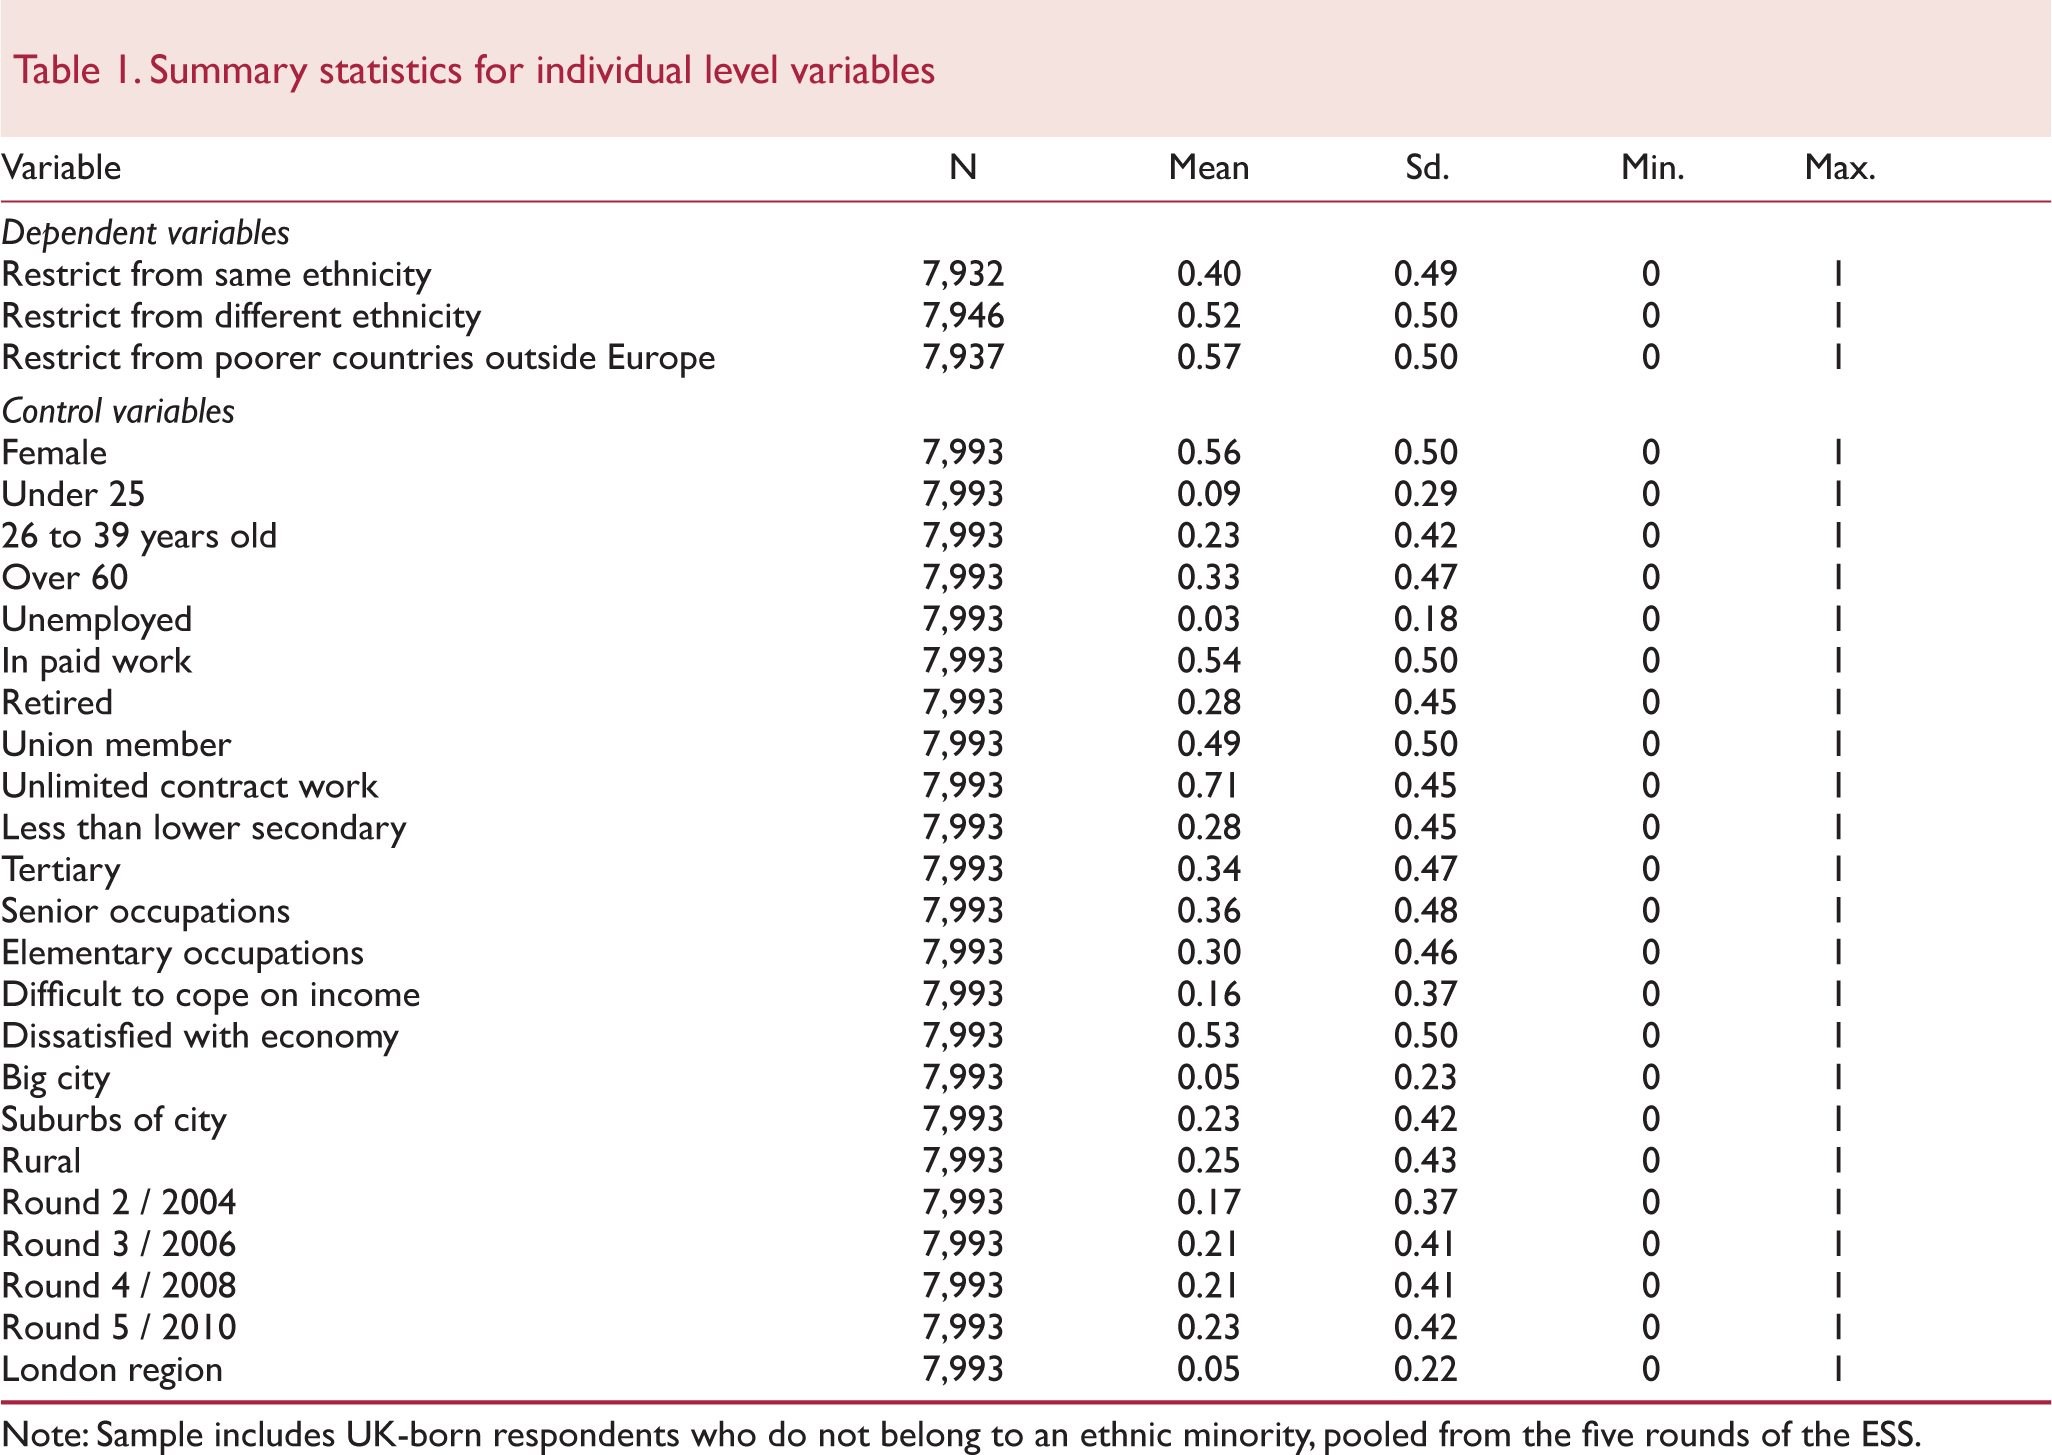
Note: Sample includes UK-born respondents who do not belong to an ethnic minority, pooled from the five rounds of the ESS.
4.2 Explanatory variables - individual level
Model specifications include a wide range of individual level controls. Variables that account for respondents’ demographic characteristics include gender, age in four categories (up to 25, 26–39, 40–59 and above 60) and dummy variables for individuals who stated that they reside in big cities, suburbs of big cities or rural areas, in comparison to those living in smaller cities and towns. Educational attainment is measured using an ESS derived variable with standardised categories for less than lower secondary education, lower secondary, upper secondary and tertiary education. An ESS variable on the respondent's working status is entered as dummies for ILO unemployed, retired and in paid work individuals, leaving all other inactive as a reference category. Labour market status is operationalised using various measures. The ISCO-88 (International Standard Classification for Occupations) is used for the classification of ten major occupation categories from managers and senior officials to elementary occupations. Occupations are recoded into two binary variables, one for managers, senior officials and technicians and one for those in elementary occupations, operation and processing and sales/customer services, with individuals in personal services, skilled trades and administration as the reference category. A dummy variable on whether the individual's job contract is unlimited in contrast to limited or no contract work is included as an indicator of job security. A dummy for union/trade organisation membership is also entered in the analysis. In terms of perceptions, economic pessimism and income dissatisfaction are operationalised with two dummy variables; the first asks respondents to state how satisfied they are with the current state of their country's economy from 0 extremely dissatisfied to 10 extremely satisfied (0–4 recoded as 1 and 5–10 as 0) while the other asks whether the respondents are finding it difficult or coping comfortably on their present income (1-living comfortably and 2-coping are recoded as 0, 3-difficult to cope and 4-very difficult are recoded as 1). Summary statistics on the individual level controls are shown in table 1.
4.3 Explanatory variables – regional level
This paper focuses on the impact of regional conditions and includes a wide range of indicators aggregated from the UK Labour Force Survey (LFS), in addition to figures of annual growth in GDP calculated by Eurostat. The LFS is a large-scale quarterly survey carried out by the Office for National Statistics to 60,000 private addresses in the UK. Its purpose is to provide current information on the labour market, such as unemployment rates, median wages and other statistics that can be used to evaluate and develop labour market policies.
Regional indicators at the NUTS1 3 level are calculated for each year that the ESS is conducted to allow respondents to be matched based on the Government Office region of residence and the round in which they participated in the survey. The variables are constructed by aggregating the corresponding individual level measure from the LFS with the use of population corrective weights, supplied with the survey for this purpose. Measures are based on the LFS for October to December, which most closely matches the fieldwork dates of the ESS.
Demographic variables
A series of indicators related to the composition of the population is included in the models to account for the share of immigrants in the respondent's region and survey round, while controlling for the impact of ethnicity and origin. The percentages of white and non-white immigrants encompass all groups of foreign-born who are ethnically white or non-white, regardless of country of origin. The percentages of black and Southeast Asian population also include people born in the UK. Due to the country's history of immigration from the Commonwealth, this distinction allows the estimations to better identify whether existing ethnic minorities that include older immigrants influence natives’ attitudes towards new immigrants. Respondents in the LFS who are born outside the UK are classified as immigrants. The LFS question on country of birth is used to calculate the percentage of the total population born in poorer countries within Europe and the percentage of population born in poorer countries outside Europe. Variables based on ethnic groups are computed using an LFS question on ethnicity. All indicators in this category have the region's weighted population as the denominator. The list of measures related to the demography of the population, along with summary statistics, are shown in table 2.
Summary statistics for regional variables
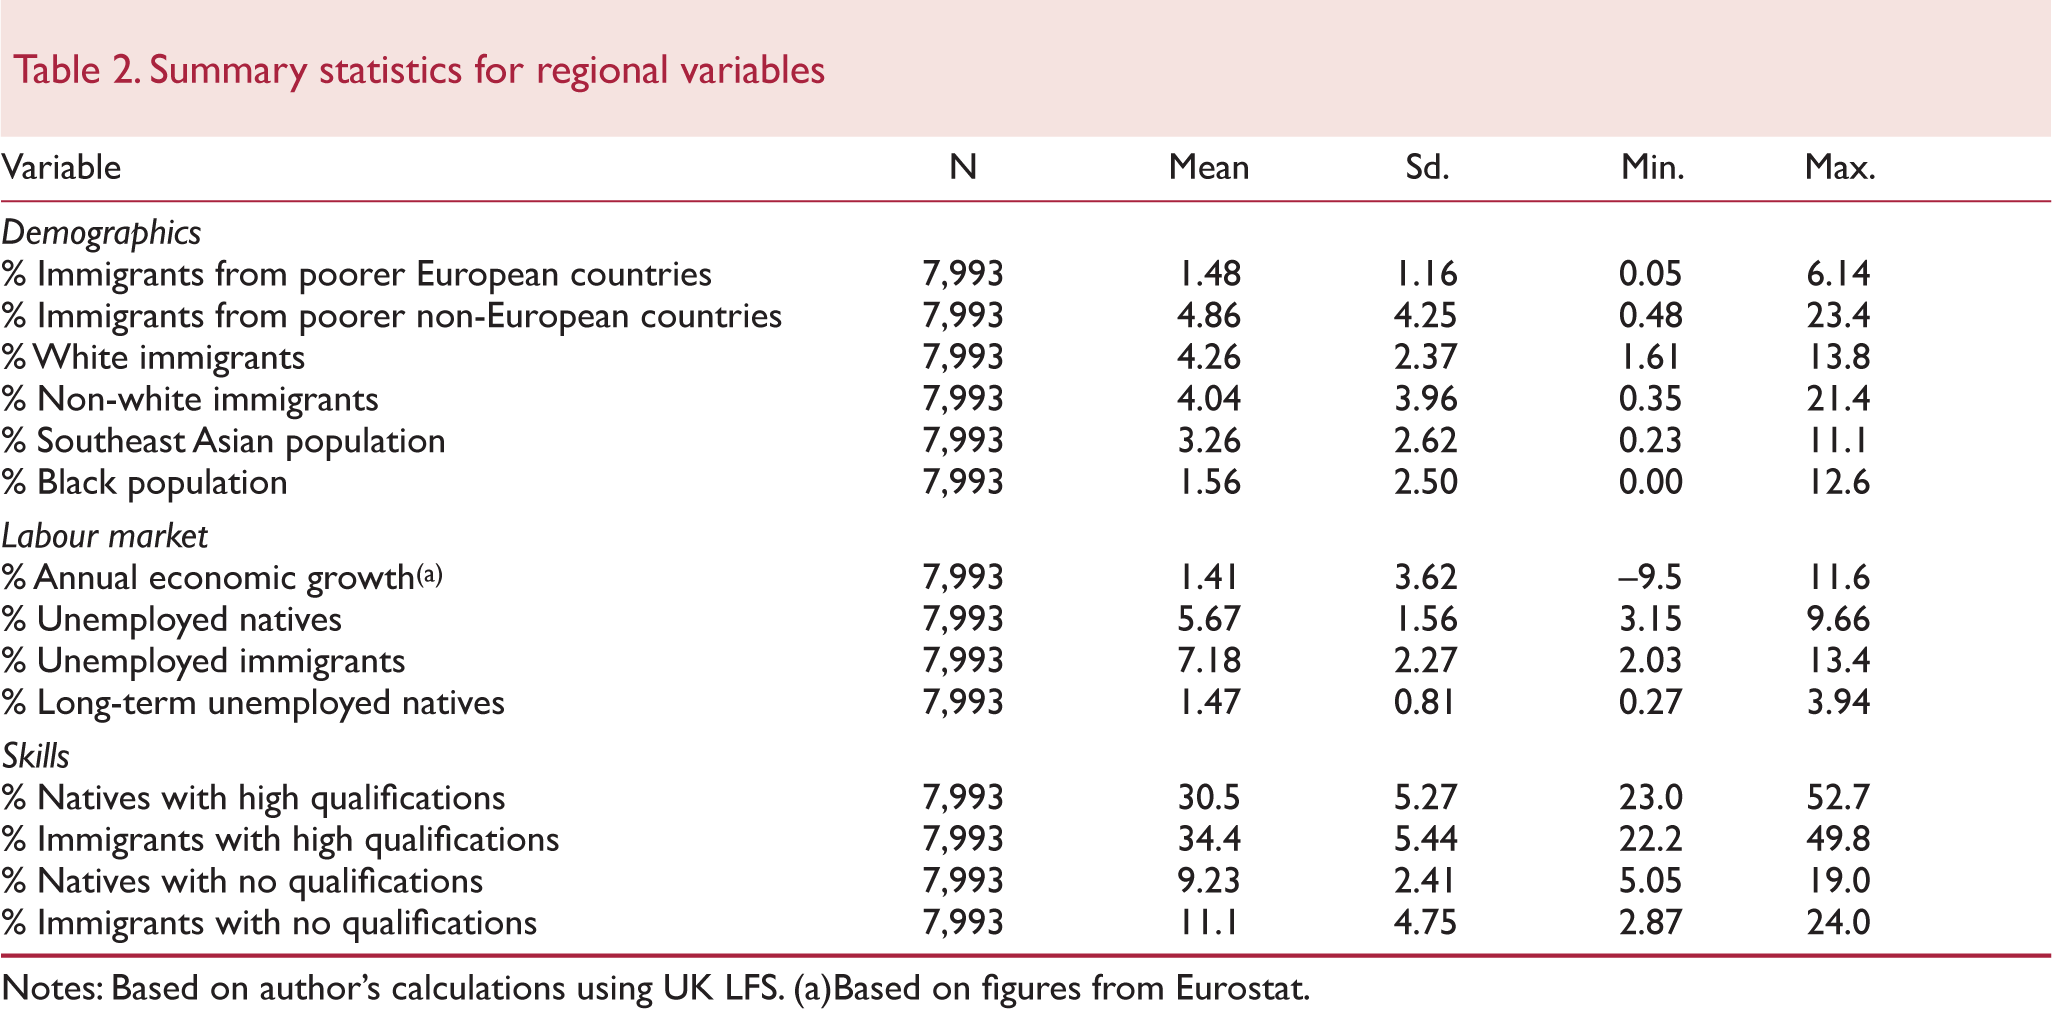
Notes: Based on author's calculations using UK LFS.
Based on figures from Eurostat.
Labour market variables
With respect to the current conditions of the labour market, measures of job scarcity and economic growth are included in the analysis. The unemployment rates for natives and immigrants are calculated based on the ILO standardised method for assigning unemployment status and correspond to the percentage of economically active natives and immigrants in that region and year who are unemployed. These are included to establish whether natives’ favour for immigration restriction is rooted in the limited availability of jobs in the region. However, to get a better account of regional job scarcity, the percentage of natives unemployed for more than a year is also included. The percentage of economically active native population that is unemployed for more than a year is computed using an LFS derived variable on duration of ILO unemployment. In this category of indicators the denominator is the total economically active population of either natives or immigrants in the region, depending on the variable. Finally, as a way to account for the likely fluctuations of economic conditions across regions between 2002 and 2010, analysis also includes annual economic growth, taken from Eurostat. It corresponds to the percentage change in gross value added in the region's economy since the previous year. 4 The set of regional indicators relating to the labour market is shown in table 2.
Skills variables
Measures of skill supply are included in the model specifications and correspond to the percentages of economically active natives and immigrants with either high or no qualifications. Qualification levels are assigned based on a standardised derived LFS variable on obtained qualifications. High qualifications correspond to degree or equivalent and higher education. Summary statistics are shown in table 2.
5. Empirical models
Empirical models are estimated using logit regressions, with six specifications for each dependent variable. In order to address the downward bias of standard errors in models that estimate the impact of aggregate variables on micro-units (Moulton, 1990), standard errors are clustered by region and year.
The estimations model the probability of a native respondent i preferring that immigration should be limited to few or no immigrants as a function of individual and regional level predictors, via the latent variable R∗irt as in equation (1).

A respondent prefers to restrict immigration if R∗irt is greater than zero. Separate models are estimated for each of the three observed binary measures of immigration policy preferences. The model specifications include individual level controls and regional indicators X'. The set of individual level control variables, as defined in section 4, remain the same across all model specifications. Due to high collinearity and relatively limited variation of the aggregate variables (60 clusters), the regional level measures vary by specification. For each dependent variable, the first specification focuses on the impact of immigrants’ origin and includes the percentages of immigrant population from poorer countries in and outside Europe, and their quadratic terms, to test for the predicted non-linear relationship between the relative size of immigrant population and natives’ opinions on immigration (Model 1). The second specification focuses on the impact of immigrants’ ethnicity and includes the percentages of white and non-white immigrants, and their quadratic terms (Model 2). The third specification focuses on existing ethnic minorities in the region, including native-born population. This specification includes the percentage of the region's population identifying themselves as ethnically Southeast Asian and the percentage of population identifying themselves as ethnically black (Model 3). The fourth specification focuses on the impact of labour market conditions and includes the unemployment rates of immigrants and natives, alongside annual economic growth (Model 4). The fifth specification focuses on the impact of skill supply in the region and includes the percentages of natives and immigrants with high qualifications and no qualifications (Model 5). The sixth and final model combines the statistically significant predictors of the previous five specifications on each of the dependent measures (Model 6).
6. Results and analysis
Overall, findings indicate that support for limiting incoming immigration is associated with the characteristics and conditions of immigrants, rather than the condition of natives in the region. Results are in agreement with the expectation that restrictionist views among natives are likely driven by concerns over economically vulnerable immigrants, i.e. unskilled and unemployed, draining local resources. Moreover, results confirm the prediction that the relative size of immigrant population is likely to impact individual preferences over immigration policy in a non-linear way. However, estimations also suggest that the direction of this impact is heterogeneous depending on the origin and ethnicity of immigrants and existing ethnic minorities in the region. Results for the estimated Models 1 to 6 are shown in tables 3 to 5.
Restrict immigration from same ethnicity
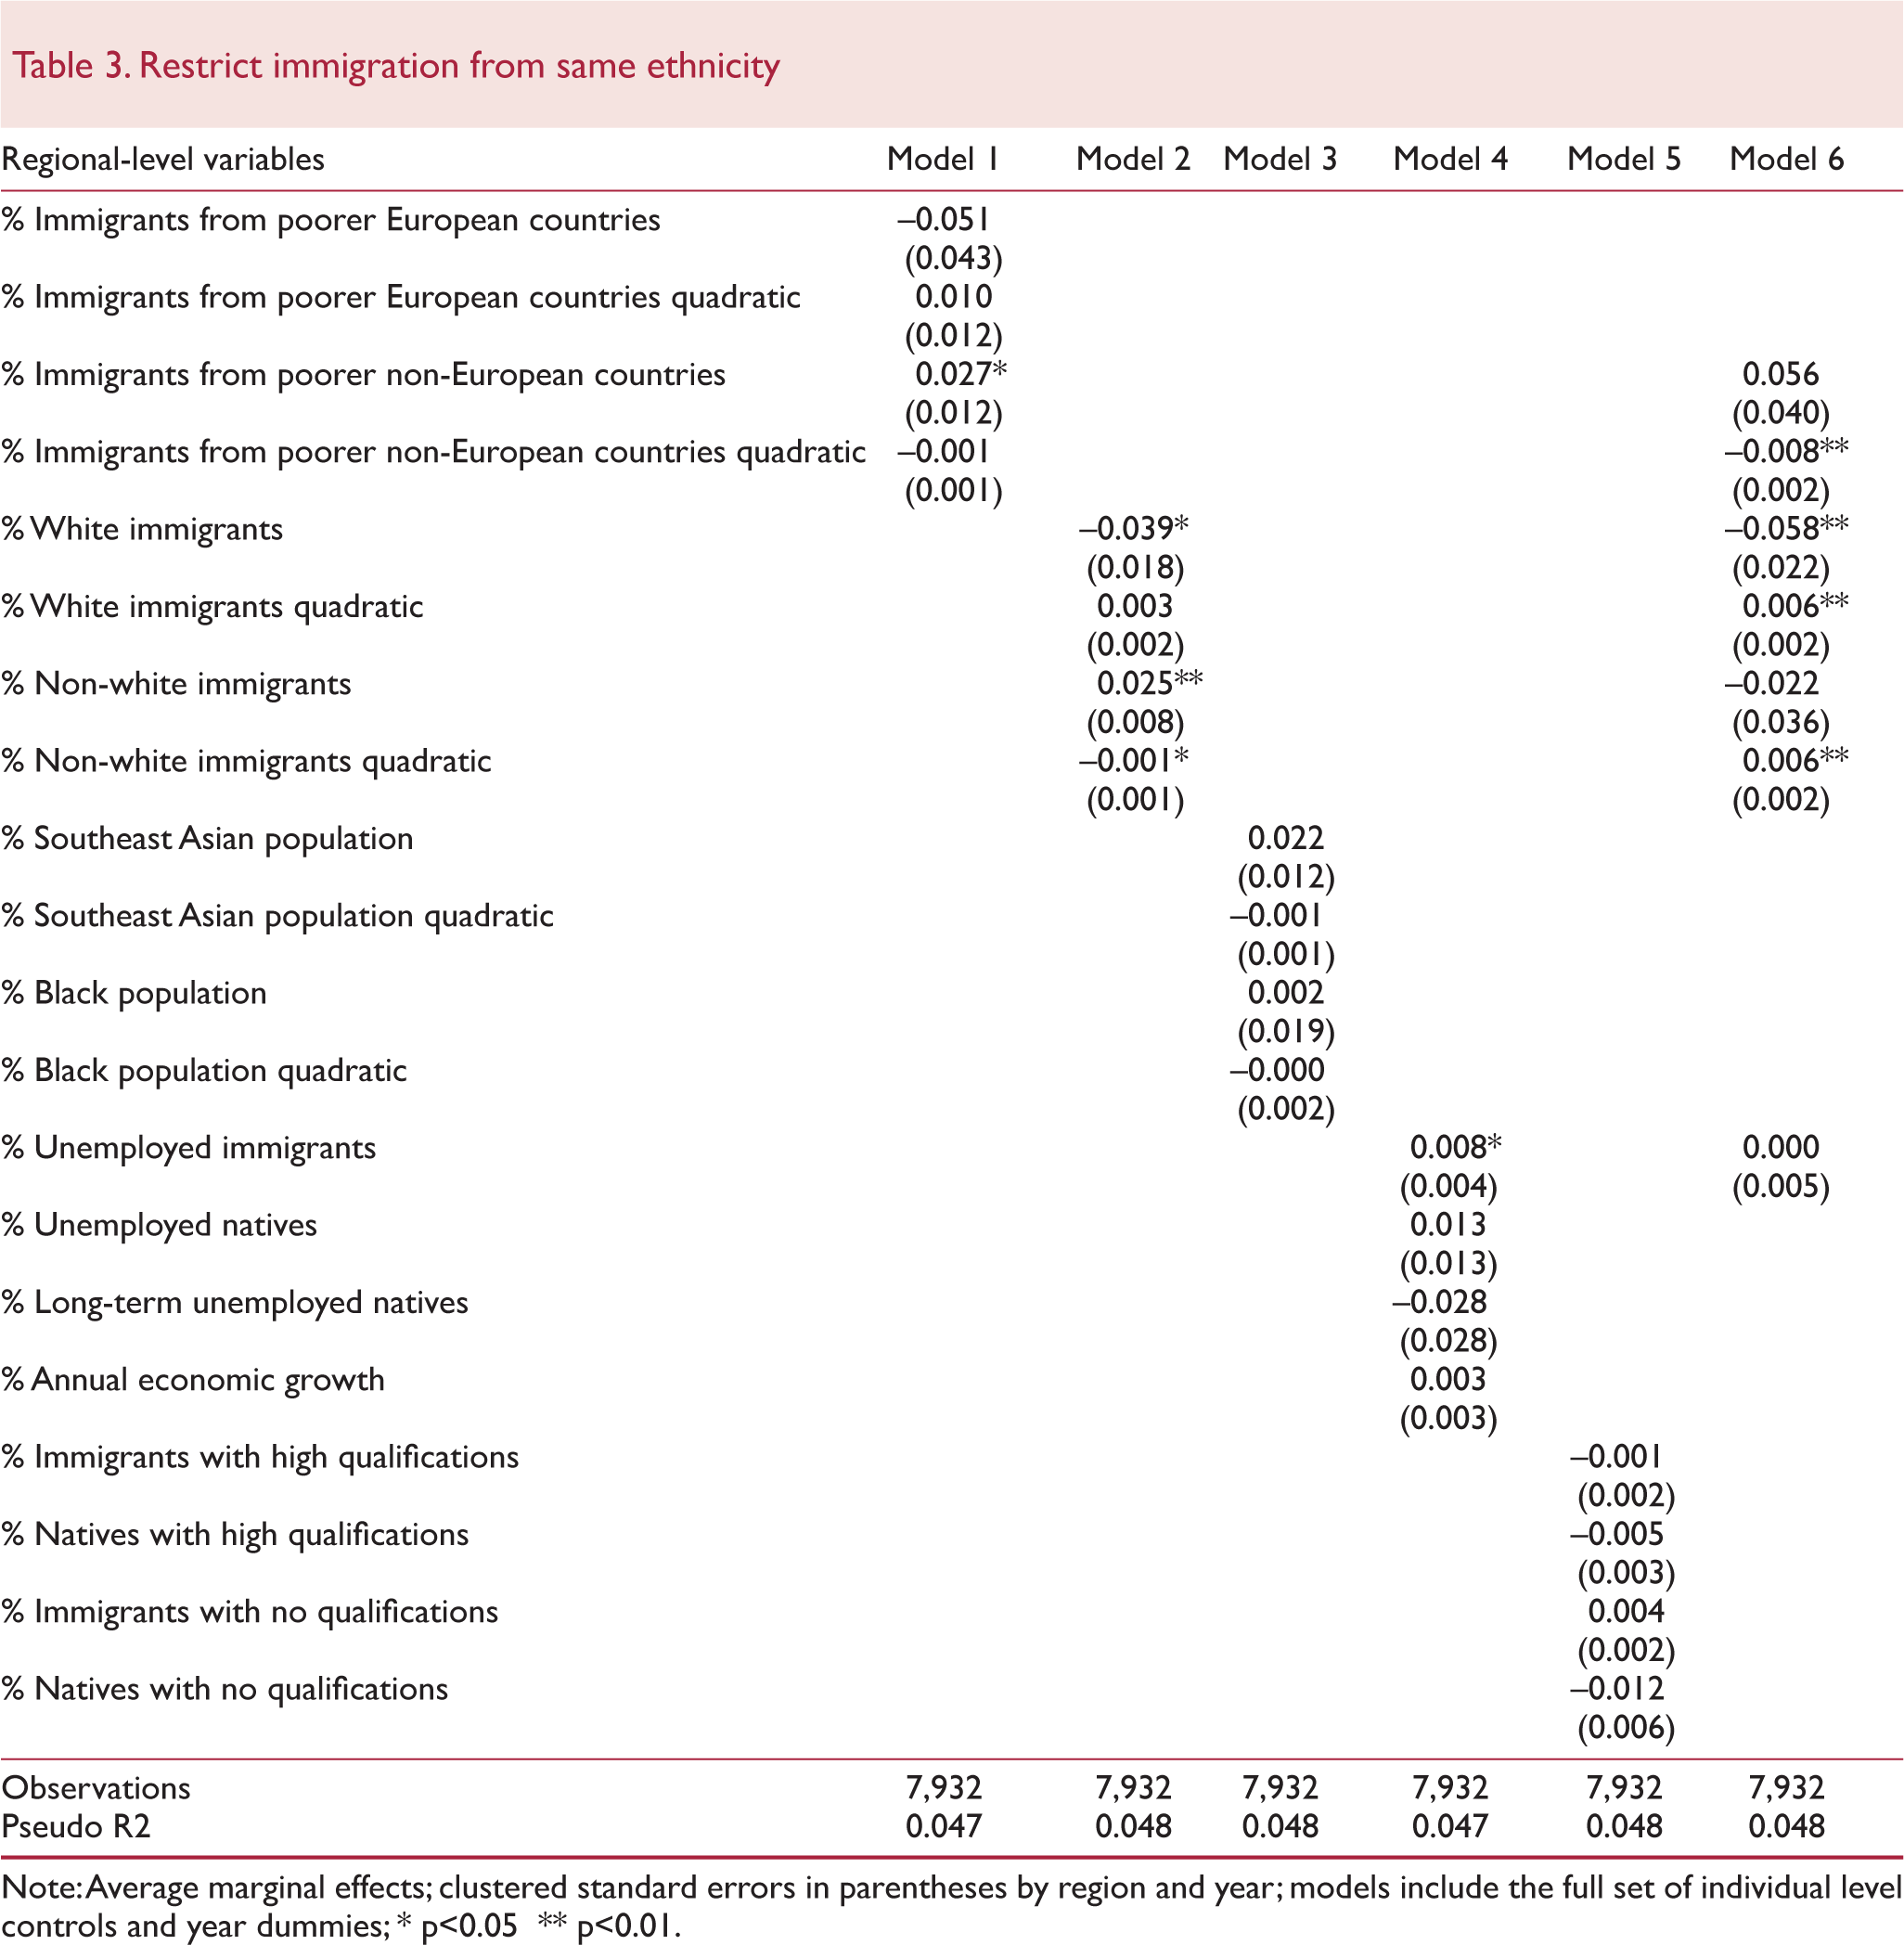
Note: Average marginal effects; clustered standard errors in parentheses by region and year; models include the full set of individual level controls and year dummies;
p<0.05
p<0.01.
Restrict immigration from different ethnicity

Note: Average marginal effects; clustered standard errors in parentheses by region and year; models include the full set of individual level controls and year dummies;
p<0.05
p<0.01.
Restrict immigration from poorer countries outside Europe
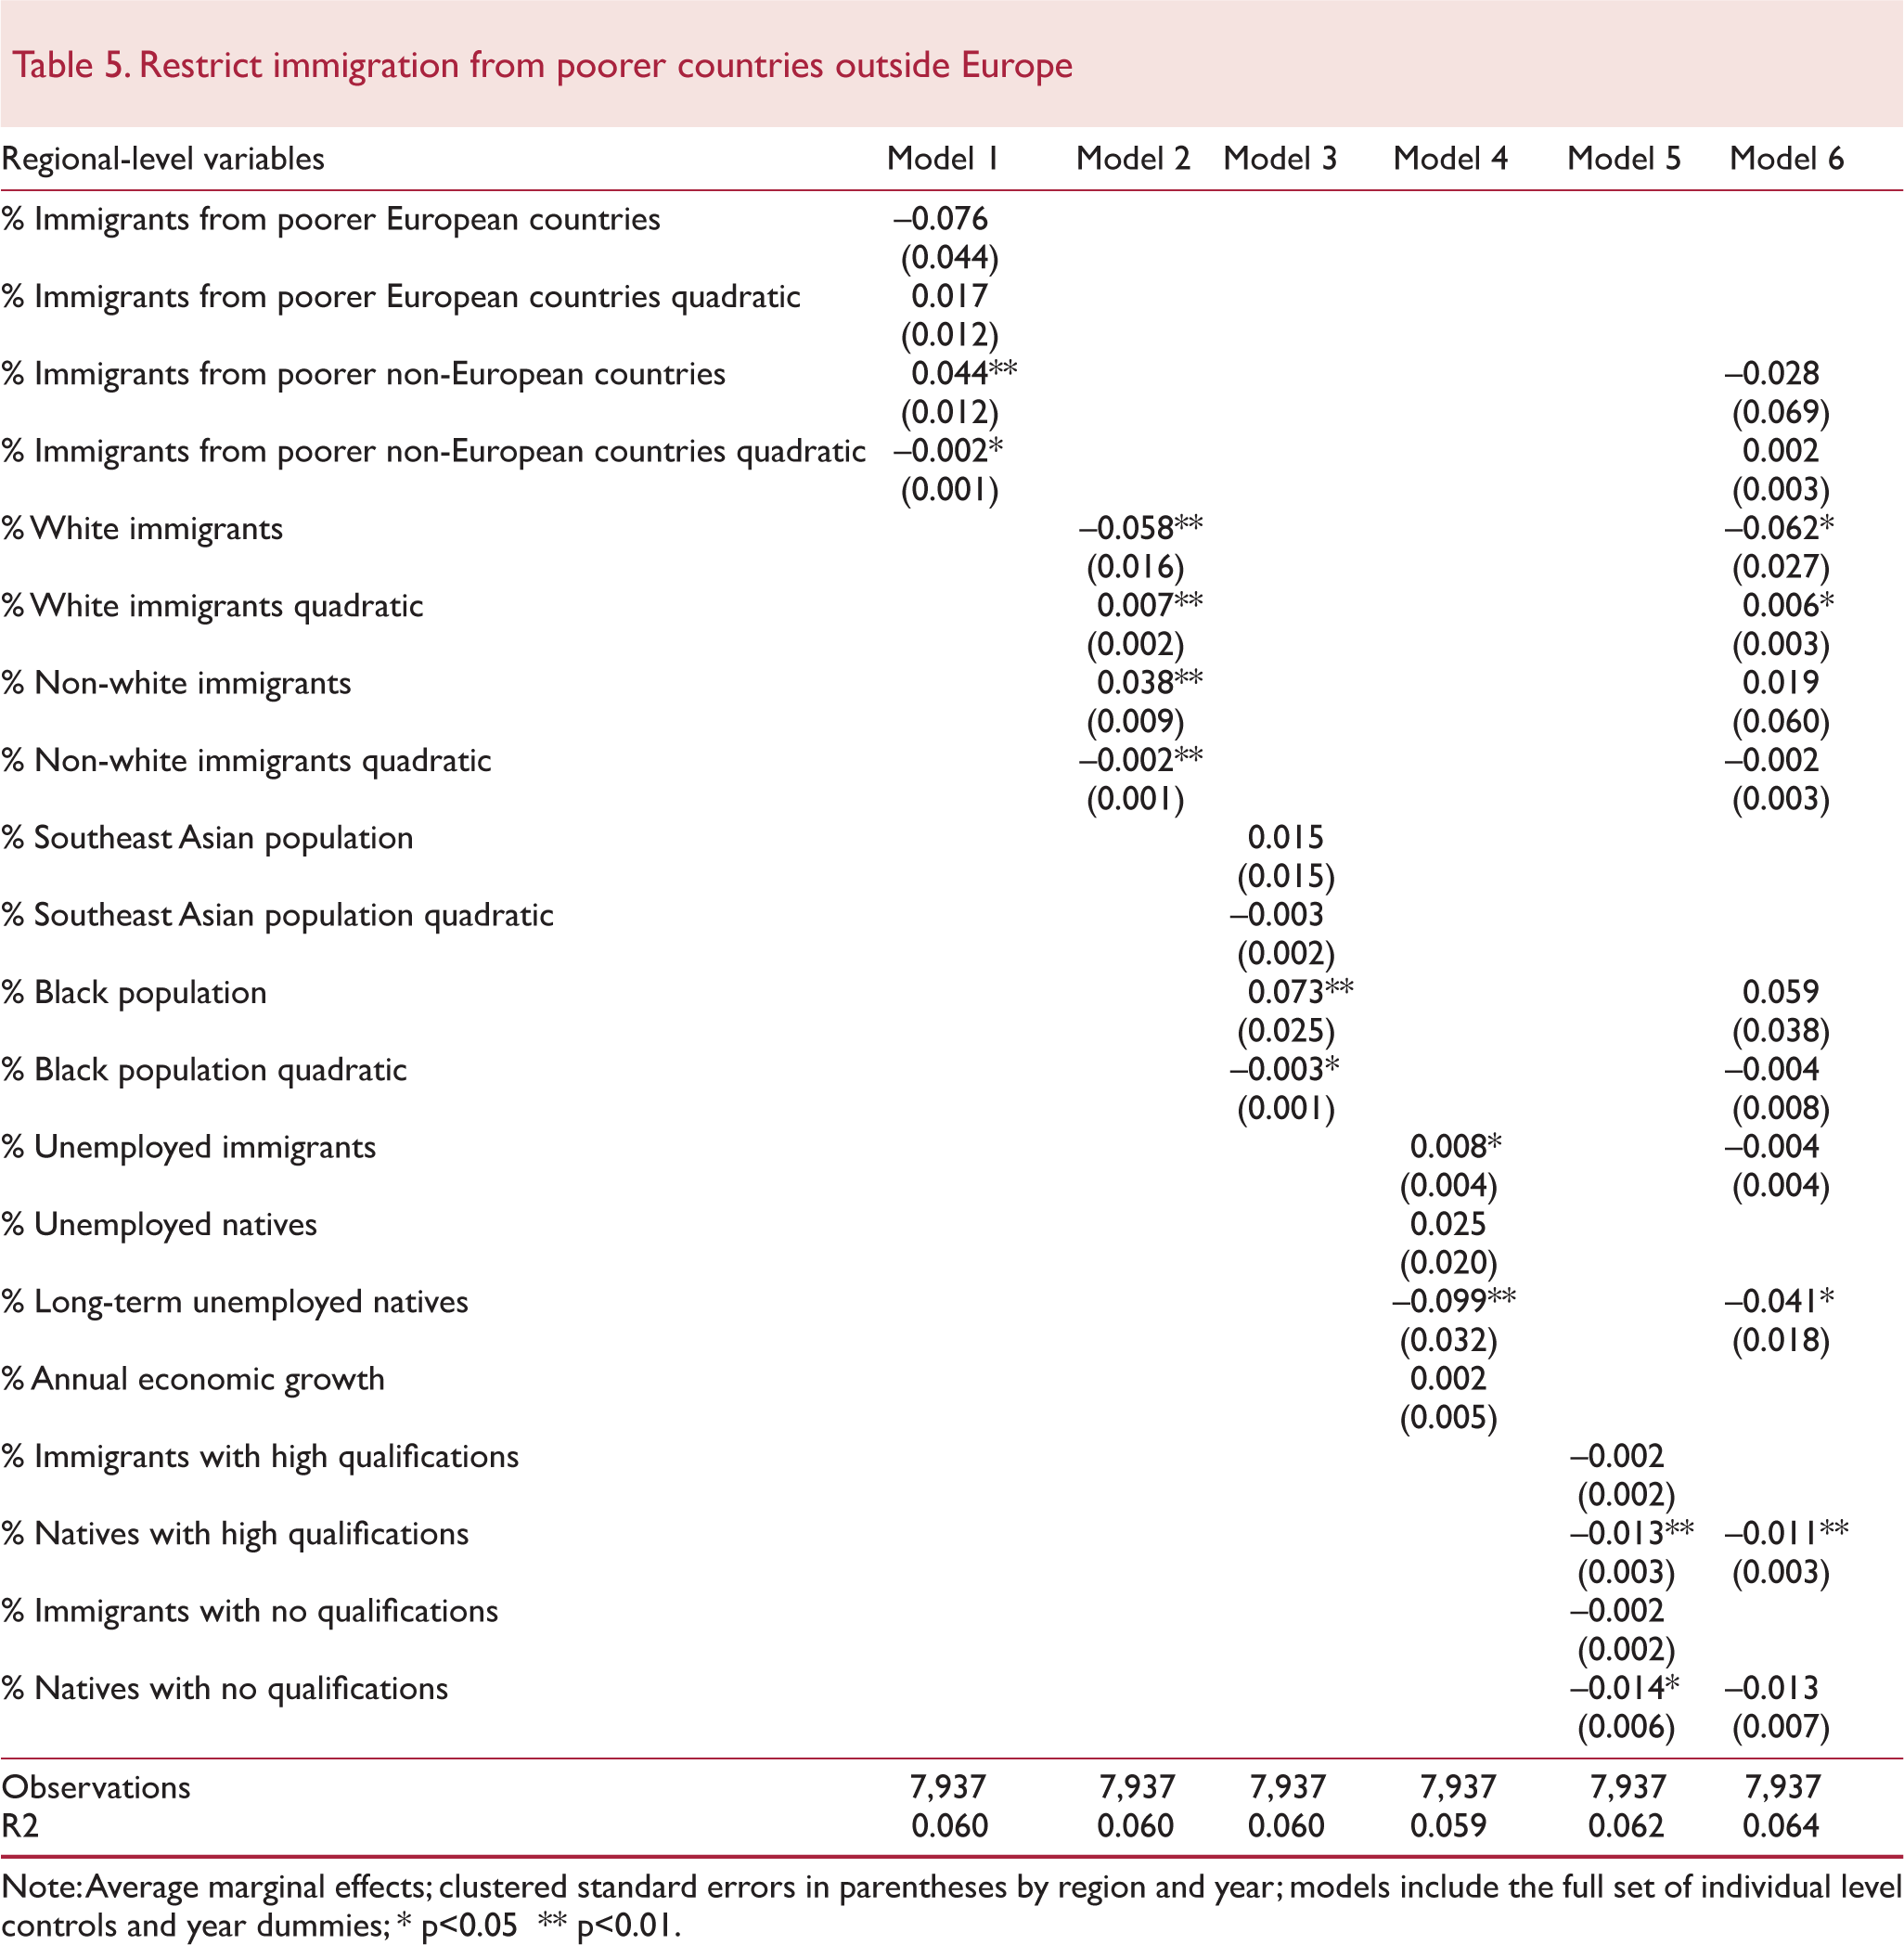
Note: Average marginal effects; clustered standard errors in parentheses by region and year; models include the full set of individual level controls and year dummies;
p<0.05
p<0.01.
With respect to the origin of immigrants in the region, findings provide evidence that white native-born respondents are more likely to support restriction of immigration in regions with a higher percentage of immigrants from poorer countries outside Europe. Other things held constant, for every point increase in the region's percentage of immigrants from poorer countries outside Europe, a respondent is between 2.7 and 4.4 per cent more likely to support immigration restriction (Model 1, tables 3–5). However, in regions where that immigrant group exceeds 8 or 9 per cent of the total population, respondents are 0.2 per cent less likely to express the view that only few or no immigrants be allowed to come and live in the UK. The estimated impact of the percentage of immigrants from poorer countries within Europe is very small and does not retain statistical significance. However, it suggests a U-shaped relationship with support for restriction, the opposite to the estimated impact of the size of immigrants from poorer non-European countries. Results are consistent across the three dependent variables, although the estimated marginal effects are closer to zero in the preference question referring to ethnically similar immigrants.
The second specification focuses on the impact of immigrants’ ethnicity on immigration policy preferences (Model 2, tables 3–5). The percentage of white immigrant population shows a U-shaped association with the probability of preferring to limit immigration. In the opposite direction, an inverted U-shaped relationship is found between non-white immigrants in the region and support for immigration restriction. For every point increase in the percentage of white immigrants in the region, respondents are 3.9 per cent less likely to favour immigration control. In the two policy questions referring to ethnically dissimilar immigrants (table 4) and those from poorer countries outside Europe (table 5), this is reversed to a 0.2 per cent decrease in preferring restriction, in regions with more than 9 per cent white immigrant population. A 1 percentage point increase in the region's non-white immigrant population is expected to increase the chances of favouring restriction of immigration by 2.5 per cent for ethnically similar immigrants, 3.6 per cent for ethnically dissimilar immigrants, and 3.8 per cent for those from poorer non-European countries. However, respondents who live in regions with more than 9 or 10 per cent non-white immigrants are approximately 0.2 per cent less likely to support restriction.
The third specification focuses on the role of the relative size of Southeast Asian and black population in the region, to test whether existing ethnic minorities drive support for restriction of future immigrant inflows, as well as directly compare results with Bowyer's findings (Bowyer, 2009). Results suggest that a larger relative size of black population in the region is associated with a higher probability of supporting restriction of immigration by 3.8 per cent in the case of ethnically dissimilar immigrants (table 4), and by 7.3 per cent for immigrants from poorer non-European countries (table 5). However, the chances of supporting restriction in particular from poorer countries outside Europe decrease by 0.3 per cent for those in regions with more than 12 per cent of ethnically black population. The turning point of the curve appears to be at the highest percentage compared with the other demographic indicators. On the other hand, the relative size of Southeast Asian population in the region is not statistically associated with a higher or lower probability of holding restrictionist immigration policy views, in any of the models.
These results are not in agreement with findings by Bowyer (2009) that natives are less likely to hold anti-immigration attitudes in localities with a larger share of black population. Nonetheless, findings appear in agreement with Bowyer's overall conclusion, that natives in England do not view all ethnic minorities as equally threatening (Bowyer, 2009). A possible extension of this inference might be that natives in the United Kingdom do not view all immigrants as equally welcome. Still, the difference here is not identified between concentrations of black and Southeast Asian population, but between white/European immigrants versus non-white/non-European immigrants. These findings support expectations of contact theory, insofar as ethnic and racial familiarity with the minority group is associated with less negative views among natives. White immigrants could be seen as ethnically similar, while non-white and non-European immigrants may become more familiar as the relative size grows very large and facilitates inter-group contact. Contact theory, however, cannot explain why respondents are more likely to support restriction of immigration when white immigrant population grows beyond a certain size relative to the native population. If a large relative size of ethnically similar immigrant population is perceived as more likely to compete directly with natives in the workforce, results may support predictions of intergroup conflict theory, which highlights resource and labour market competition as sources of opposition to immigration.
The fourth model tests the impact of labour market conditions on the three dependent variables. With regard to the current performance and capacity of the regional economy, findings do not confirm the expectation that fluctuations in economic growth drive more or less restrictionist views on immigration policy. Annual economic growth in the region and the unemployment rate among natives show no statistically significant association with any of the policy preference questions. Respondents in regions with a higher long-term unemployment rate among natives are found less likely to support restriction of immigration. For every point increase in the rate of long-term unemployed natives in the region, native respondents are 6.7 per cent less likely to support immigration restrictions if immigrants are ethnically dissimilar to the native population, and 9.9 per cent less likely, if immigrants are from poorer non-European countries. However, for every percentage point increase in the unemployment rate of immigrants in the region, white native-born respondents are 0.8 per cent more likely to support immigration restriction of ethnically similar and dissimilar immigrants, and 1.2 per cent more likely in the case of immigrants from poorer countries outside Europe (Model 4, tables 3 to 5). This is in agreement with existing cross-country research and supports the expectation that the economic conditions among immigrants, rather than among natives in the region, play a role in immigration-related concerns among native respondents (Markaki and Longhi, 2013).
The fifth model across the three dependent variables focuses on the role of highly skilled and unskilled population. Results show that every point increase in the percentage of highly skilled natives in the region is associated with a decrease of 1 per cent in favour of restriction, thus rejecting the expectation that regions with highly skilled natives would foster competition with immigrants over highly skilled occupations. Furthermore, for every percentage point increase in unskilled natives in the region, respondents are 1 per cent less likely to favour limiting immigration. This does not confirm the prediction that a larger share of natives who have no qualifications would increase support for restriction, on the basis of competition over low-skilled or manual occupations.
6.1 Robustness tests
This section discusses the robustness of the empirical findings to changes in estimation methods, alternative measurements for the dependent variables, and to the omission of London and the Southeast from the analysis. Results for these tests are shown in Appendix tables A1–9.
For the first robustness test, the six specifications on each dependent variable are estimated using OLS, rather than logit, with clustered standard errors. Findings remain robust to the change in estimation method, while the value of the statistically significant coefficients tends to be slightly larger using OLS. For the second robustness test, the six specifications per dependent variable are estimated using ordered logit regressions on the original question items with four categories, again with clustered standard errors. The estimated impact of the regional predictors remains in the same direction, and in most cases, predictors gain statistical significance. Moreover, when considering the intercepts in the fitted models, the first cut-point intercept is negative, while the other two are positive, thus supporting the choice of constructing the measures by grouping the third, ‘few’, and fourth, ‘none’, categories.
For the third robustness test, the empirical models are estimated using logit regressions identical to the main estimations, but after omitting respondents from the Southeast and the Greater London region. Overall, findings related to the role of labour market conditions and skill supply on support for immigration restriction both remain unchanged. However, the regional variables associated with the relative size of immigrant population are no longer statistically significant predictors for the first dependent variable, restricting immigration from the same ethnicity. For the dependent variable that refers to immigration control for ethnically dissimilar immigrants, the quadratic terms for the demographic predictors also lose statistical significance. This may be due to small sample sizes once the respondents from the two regions are excluded. Moreover, considering that London and the Southeast are the two regions of the UK with the highest proportion of foreign-born population, perhaps these two regions mostly drive the non-monotonic impact of the size of immigrant population on support for immigration control. Nonetheless, results for the third dependent variable, restriction of immigration from poorer countries outside Europe, remain robust to the exclusion of these two regions.
7. Conclusions
This paper focuses on measures of regional conditions as sources of public support for restricting immigration to the United Kingdom. Empirical analysis uses individual survey data from the European Social Survey, between 2002 and 2010, matched with measures of regional conditions calculated using the UK Labour Force Survey. This study finds empirical evidence that native respondents in the United Kingdom are more likely to support the restriction of immigration in regions where a larger share of immigrants is economically vulnerable by being unemployed, possibly seen as more likely to burden the welfare state at the expense of the native population. In contrast to popular expectations, however, findings do not confirm the hypotheses that economic stagnation and rising unemployment within the native population are associated with increased support for immigration restriction.
The relative size of immigrants over the population remains a key factor in immigration restriction preferences. Evidence here suggests that the relative size of immigrant population in the region can impact support for restriction in either a U-shaped or an inverted U-shaped way, depending on the origin and ethnicity of the population. To extend Bowyer's (2009) conclusions, evidence indicates that natives in the UK do not view all immigrants as equally welcome. Results seem to support the idea that ethnic similarity to white immigrants initially fosters less favour for immigration restriction, but this can quickly be reversed if the relative size of the immigrant group keeps increasing and intergroup competition becomes more salient. On the other hand, evidence could suggest that ethnic dissimilarity between the majority of native population in the UK with non-white immigrants and immigrants from poorer countries outside Europe possibly triggers more support for restriction, at first. But when more than one in ten residents in a region are immigrants, continuous contact between natives and immigrants may act to reduce intergroup conflict and support for the restriction of future immigration.
The predicted non-linear relationship between the relative size of immigrant population and opposition to immigration to a degree reconciles the divergent findings of previous studies that, in some cases, identify more negative attitudes in areas with more immigrants, but more positive attitudes in others. However, natives’ concerns over increasing immigration to the UK appear to be, not only cultural, but also associated with perceptions about the conditions of unemployment and poverty among immigrants. Further research is needed to clarify these relationships and strengthen these claims, especially using smaller geographical areas and longitudinal data.
Footnotes
1
The exact wording of the questions changes slightly across the five rounds of the ESS. The first round in 2002 includes a rotational module focused on immigration, with a large number of questions that are omitted in following rounds.
2
In the first round of the ESS, respondents are initially asked about immigrants from poorer countries in Europe, which possibly makes this distinction more explicit. This question is omitted from 2004 onwards, coinciding with the EU expansion of 2004 that extended working and movement rights to citizens of ten countries in Eastern and Southern Europe. This question may prompt respondents to think about the European Union rather than Europe as a Continent.
3
The NUTS1 classification refers to the Eurostat Nomenclature of Territorial Units for Statistics, which in the United Kingdom is represented by nine government office regions for England plus Wales, Scotland and Northern Ireland.
4
Data are publicly available from Eurostat and were extracted on 11 June, 2012. Values are assigned with a one-year lag.
Appendix tables A1 – A9 – Results for section 6.1,Robustness tests
Restrict immigration from poorer countries outside Europe – without London and Southeast
| Regional-level variables | Model 1 | Model 2 | Model 3 | Model 4 | Model 5 | Model 6 |
|---|---|---|---|---|---|---|
| % Immigrants from poorer European countries | −0.070 | |||||
| (0.080) | ||||||
| % Immigrants from poorer European countries quadratic | 0.012 | |||||
| (0.026) | ||||||
| % Immigrants from poorer non-European countries | 0.093∗∗ | −0.105 | ||||
| (0.027) | (0.126) | |||||
| % Immigrants from poorer non-European countries quadratic | −0.008∗∗ | 0.008 | ||||
| (0.003) | (0.015) | |||||
| % White immigrants | −0.109∗∗ | −0.037 | ||||
| (0.039) | (0.066) | |||||
| % White immigrants quadratic | 0.014∗∗ | 0.003 | ||||
| (0.005) | (0.008) | |||||
| % Non-white immigrants | 0.069∗∗ | 0.069 | ||||
| (0.021) | (0.118) | |||||
| % Non-white immigrants quadratic | −0.007∗ | −0.007 | ||||
| % Southeast Asian population | (0.003) | −0.005 | ||||
| (0.016) | (0.015) | |||||
| % Southeast Asian population quadratic | 0.000 | |||||
| (0.002) | ||||||
| % Black population | 0.163∗∗ | 0.055 | ||||
| (0.061) | (0.113) | |||||
| % Black population quadratic | −0.041 | 0.004 | ||||
| (0.022) | (0.039) | |||||
| % Unemployed immigrants | 0.010 | −0.004 | ||||
| (0.005) | (0.006) | |||||
| % Unemployed natives | 0.023 | |||||
| (0.021) | ||||||
| % Long-term unemployed natives | −0.100∗∗ | −0.047∗ | ||||
| (0.034) | (0.018) | |||||
| % Annual economic growth | 0.001 | |||||
| (0.005) | ||||||
| % Immigrants with high qualifications | −0.003 | |||||
| (0.003) | ||||||
| % Natives with high qualifications | −0.015∗∗ | −0.014∗∗ | ||||
| (0.003) | (0.003) | |||||
| % Immigrants with no qualifications | −0.002 | |||||
| (0.003) | ||||||
| % Natives with no qualifications | −0.010 | −0.018 | ||||
| (0.007) | (0.010) | |||||
|
|
||||||
| Observations | 6,402 | 6,402 | 6,402 | 6,402 | 6,402 | 6,402 |
| R2 | 0.062 | 0.063 | 0.062 | 0.061 | 0.066 | 0.067 |
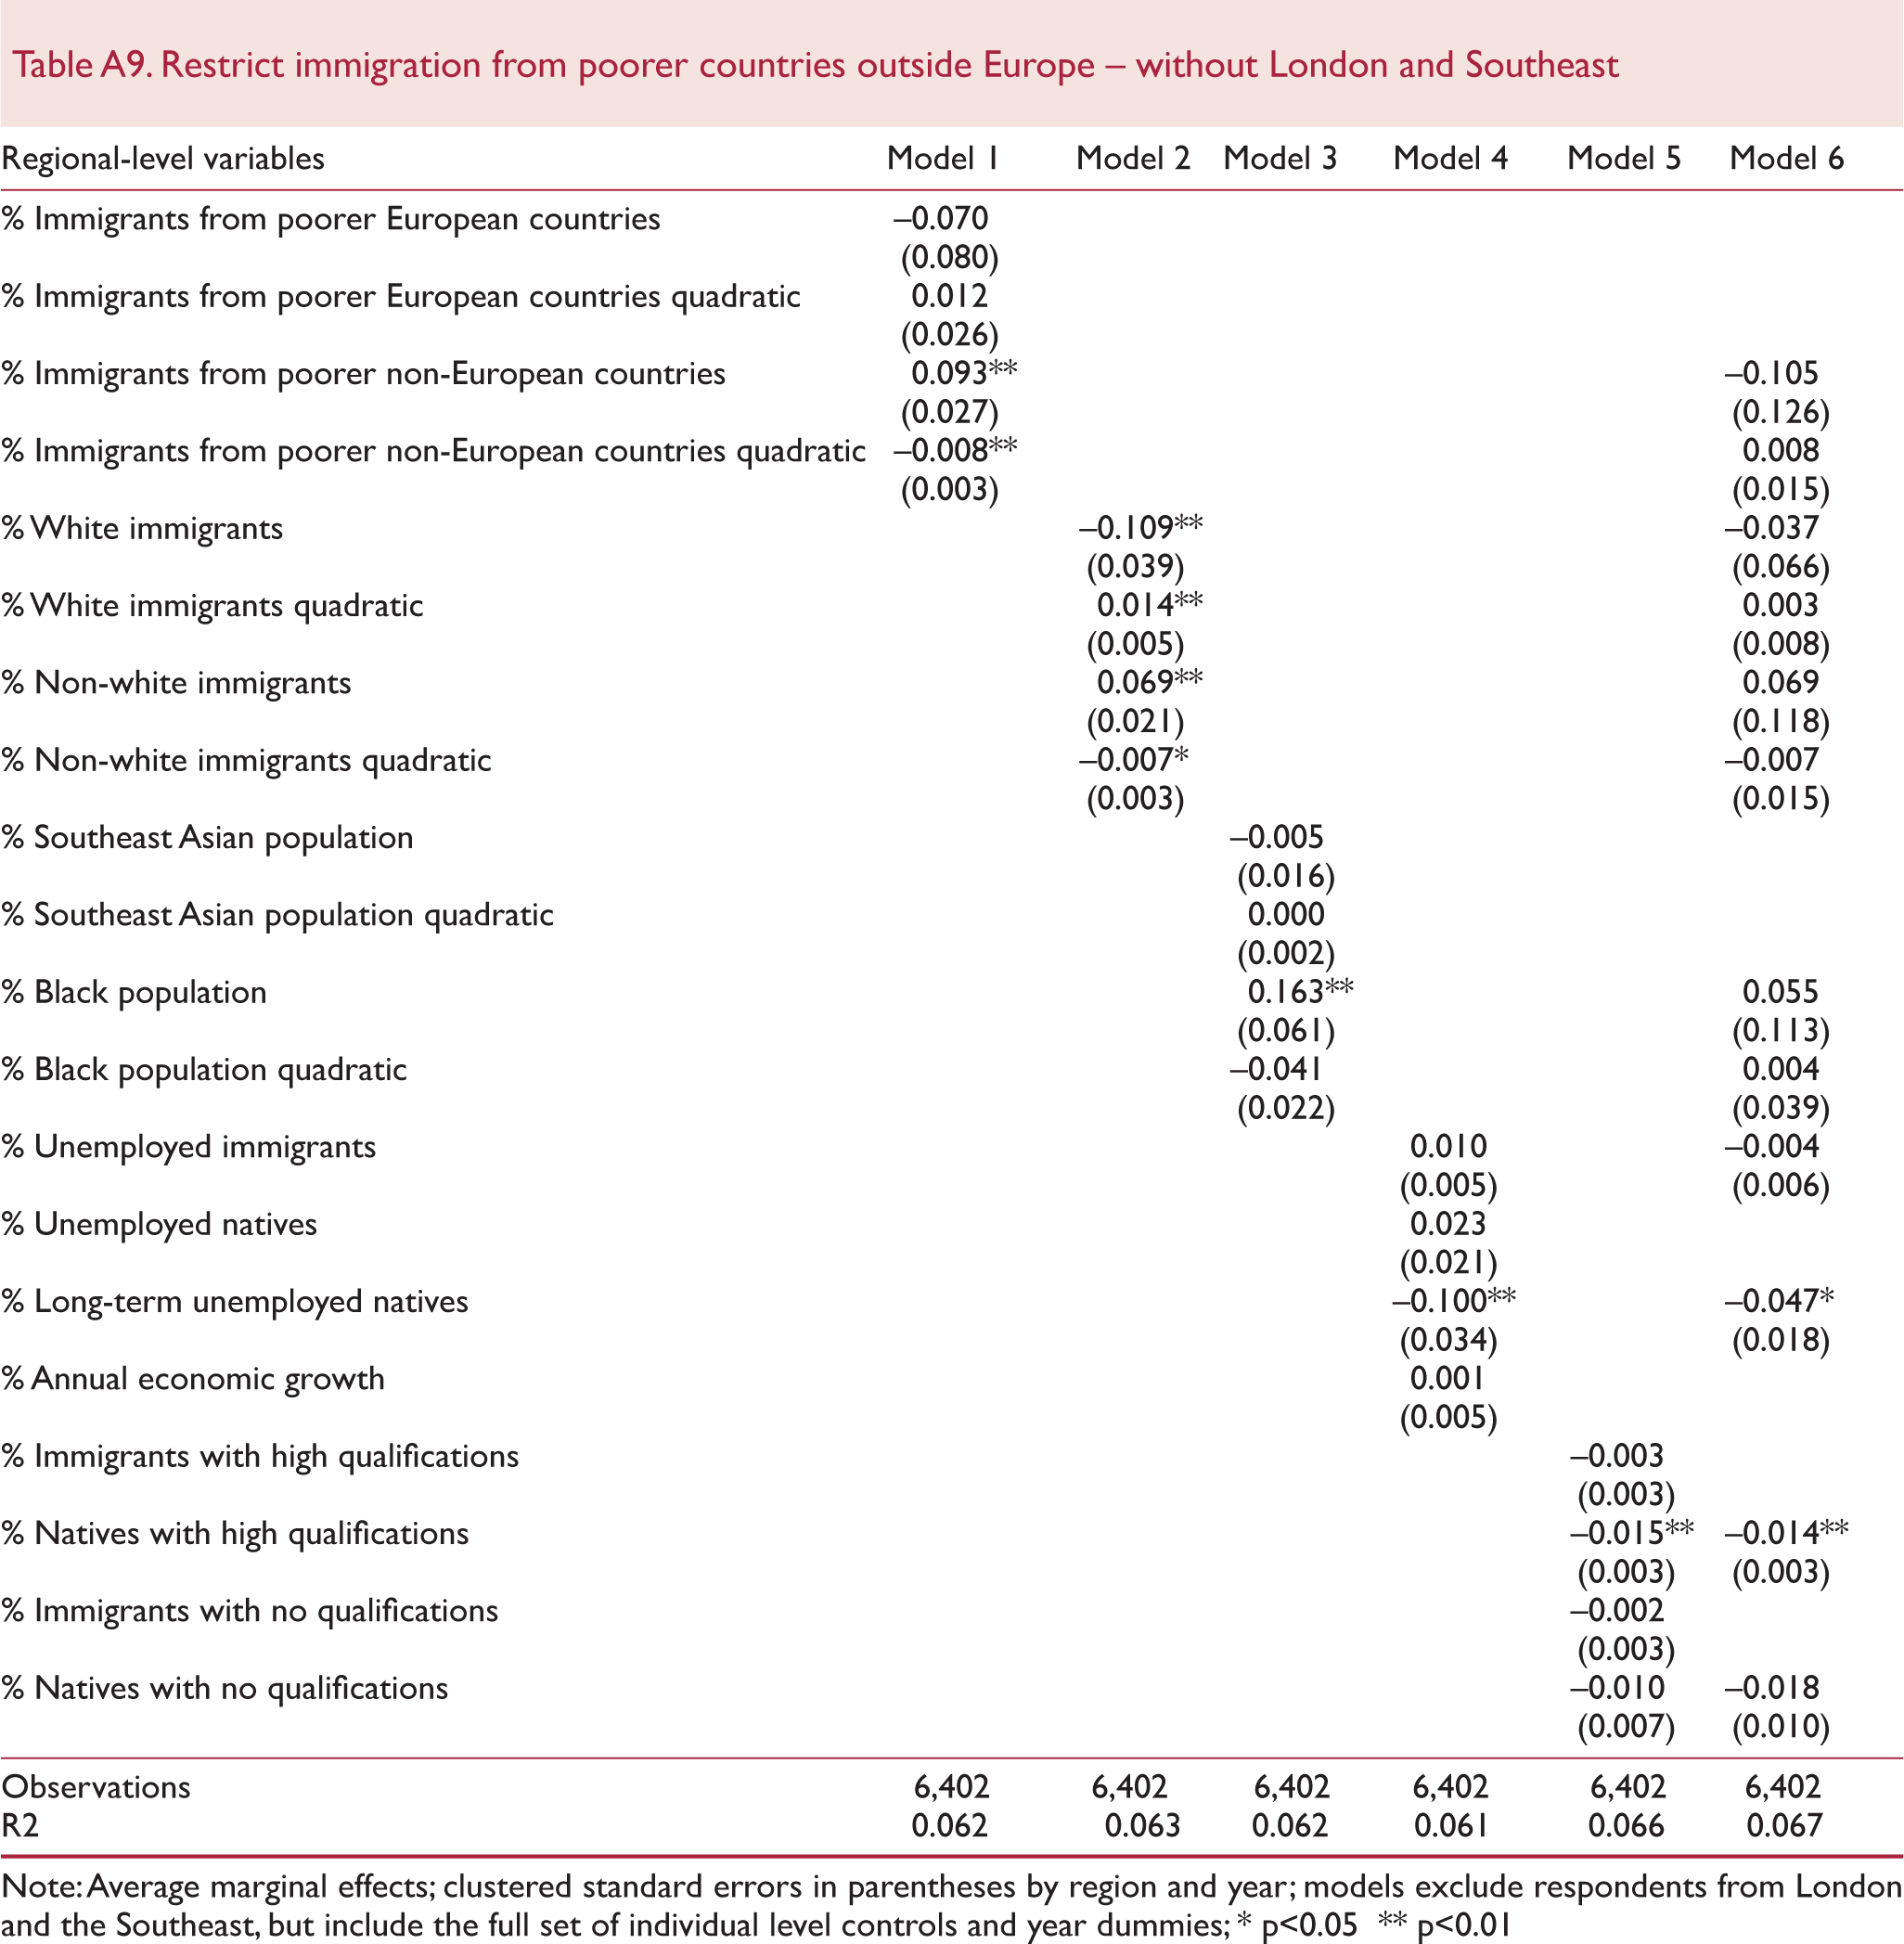
Note: Average marginal effects; clustered standard errors in parentheses by region and year; models exclude respondents from London and the Southeast, but include the full set of individual level controls and year dummies;
p<0.05
p<0.01