
Abstract

The forecasts for the world and the UK economy reported in this Review are produced using the National Institute's model, NiGEM. The NiGEM model has been in use at NIESR for forecasting and policy analysis since 1987, and is also used by a group of about 40 model subscribers, mainly in the policy community. Most countries in the OECD are modelled separately, and there are also separate models of China, India, Russia, Brazil, Hong Kong, Taiwan, Indonesia, Singapore, Vietnam, South Africa, Turkey, Estonia, Latvia, Lithuania, Slovenia, Romania and Bulgaria. The rest of the world is modelled through regional blocks so that the model is global in scope. All models contain the determinants of domestic demand, export and import volumes, prices, current accounts and net assets. Output is tied down in the long run by factor inputs and technical progress interacting through production functions, but is driven by demand in the short to medium term. Economies are linked through trade, competitiveness and financial markets and are fully simultaneous. Further details on the NiGEM model are available on http://nimodel.niesr.ac.uk/.
The key interest rate and exchange rate assumptions underlying our current forecast are shown in tables A1–A2. Our short-term interest rate assumptions are generally based on current financial market expectations, as implied by the rates of return on treasury bills and government bonds of different maturities. Long-term interest rate assumptions are consistent with forward estimates of short-term interest rates, allowing for a country-specific term premium in the Euro Area. Policy rates in the major advanced economies are expected to remain at extremely low levels at least in the first half of 2015. The Reserve Bank of Australia and the Mexican central bank reduced interest rates through 2013 by 50 and 100 basis points respectively and, while the Reserve Bank of Australia has since kept rates unchanged, the Mexican central bank cut them by a further 50 basis points in July 2014. The Bank of Korea has lowered its policy interest rates by 50 basis points since August in two steps. The central bank of Sweden reduced interest rates by 50 basis points in July 2014, the first reduction since December of last year. The central bank of Turkey cut its policy rate by 175 basis points in three rounds between April and July this year, and has kept rates unchanged since. Both the central banks of Hungary and Romania have lowered their interest rates. Since last summer, the Romanian Central Bank has reduced its interest rate by 225 basis points in eight steps. The central bank of Hungary brought them down by 365 basis points in nineteen rounds since the beginning of 2013. The central bank of Poland lowered interest rates by 50 basis points – the first time since last summer. In contrast, several emerging market economies have tightened monetary policy in response to inflationary and financial market pressures, most notably in Brazil, Indonesia, India, Russia and South Africa. After raising interest rates in the first quarter of this year, India, Brazil and Russia have kept their interest rates unchanged, while in South Africa interest rates were increased by a further 25 basis points. The central bank of New Zealand has increased its policy rate by a total of 100 basis points, in four steps since the beginning of 2014. 1
Policymakers in the US and UK are expected to begin to raise interest rates in the first half of 2015, pre-empting rate rises in the Euro Area by four quarters. For the US, this is broadly consistent with the interest rate path signalled by the Federal Open Market Committee (FOMC). In March the FOMC replaced its quantitative threshold with qualitative guidance, emphasising that it did not indicate a change in policy intentions, but rather was adjusting guidance due to the proximity of the unemployment rate to the 6½ per cent threshold of its original forward guidance policy. Instead of a single threshold (the 6½ per cent unemployment rate), the FOMC will take into account a wide range of data (consistent with its objectives of maximum employment and an inflation rate of 2 per cent per annum) when determining the path of the federal funds rate. However, despite changes in its guidance, the FOMC expects the target range for the federal funds rate to remain unchanged for a “considerable time after the asset purchase program ends”. 2 This message has been reiterated in the minutes of subsequent committee meetings.
At the meeting in December 2013, the FOMC announced a phased reduction in the pace of its asset purchases, by $10 billion a month starting in January 2014. The FOMC has consistently implemented this policy decision in each month since then. On 29 October the Fed confirmed that its ‘QE3’ programme of asset purchases of $15 billion was ending in October.
In contrast, the ECB is introducing additional rounds of balance sheet expansion. In September, the ECB announced further steps to increase monetary stimulus, following the measures announced in early June (see our August Review). After cutting its key interest rates in June, the ECB further lowered them in September. Benchmark interest rates were reduced by 10 basis points: the main refinancing rate to 0.05 per cent, the rate on the marginal lending facility to 0.30 per cent, and the rate on the deposit facility (and on excess reserves) to −0.20 per cent. As foreshadowed in June, Draghi announced that the Eurosystem of central banks would start purchasing a broad portfolio of ‘simple and transparent’ asset-backed securities (ABS) with underlying assets consisting of claims against the Euro Area's non-financial private sector (residential mortgages as well as business loans), under an ABS purchase programme (ABSPP). At the same time, the Eurosystem would purchase a broad portfolio of euro-denominated covered bonds issued by Euro Area monetary financial institutions under a new covered bond purchase programme (CBPP3). Details of these programmes were announced in early October: the purchases will begin in the fourth quarter and last for two years; the rules that determine which assets are acceptable as collateral in the ECB's monetary policy operations will guide the eligibility of assets for purchase; and risk–mitigating measures will be used to support the eligibility of covered bonds from Cyprus and Greece. These measures add to the targeted long-term refinancing operations (TLTROs) announced in June, which began in September. All these measures are intended to support the provision of credit to the real economy and the ECB's forward guidance on interest rates.
Interest rates Per cent per annum
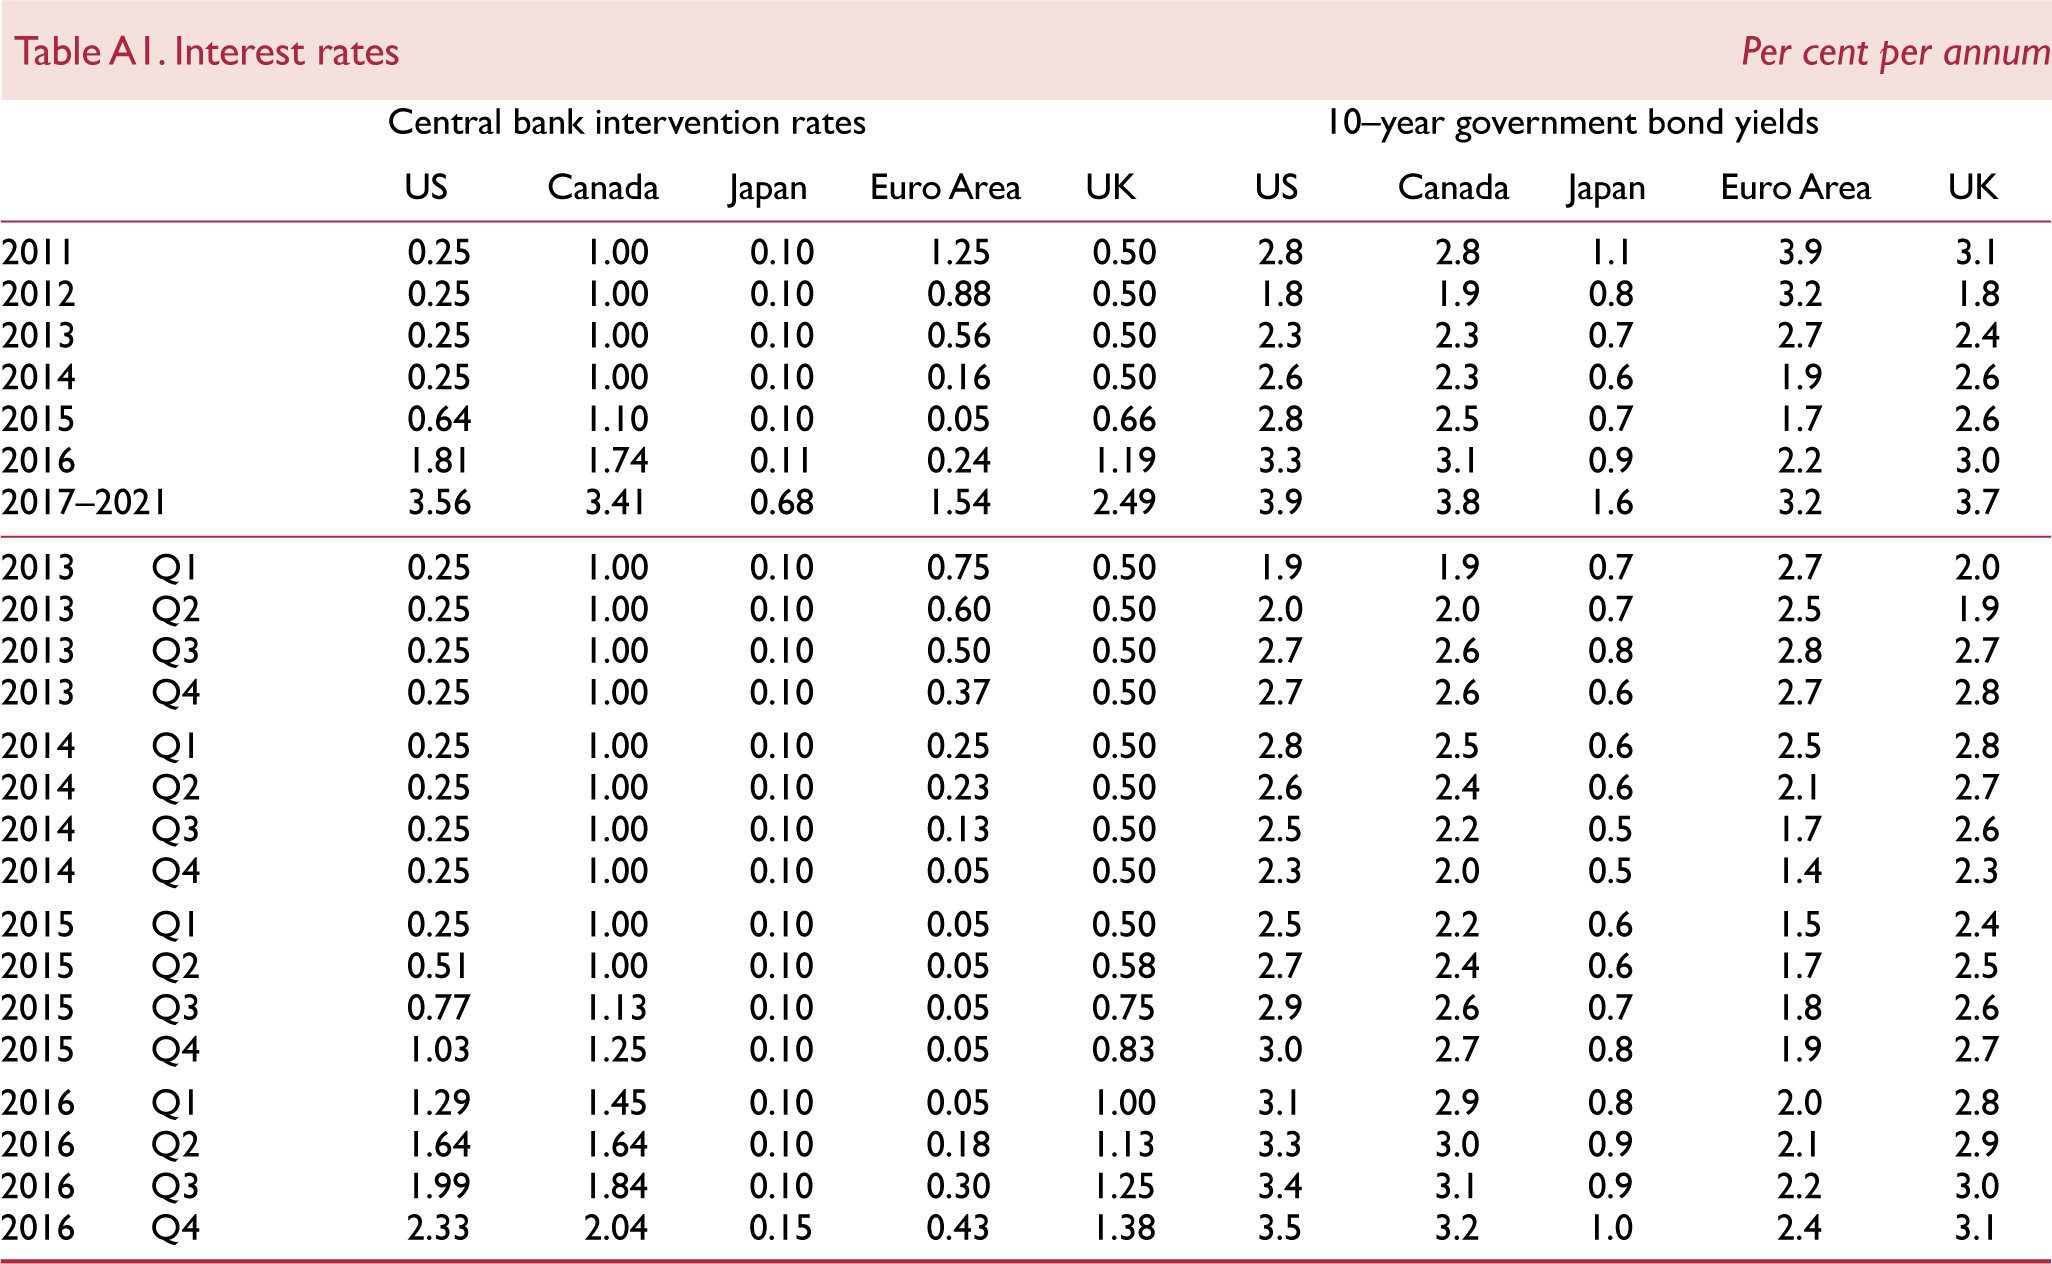
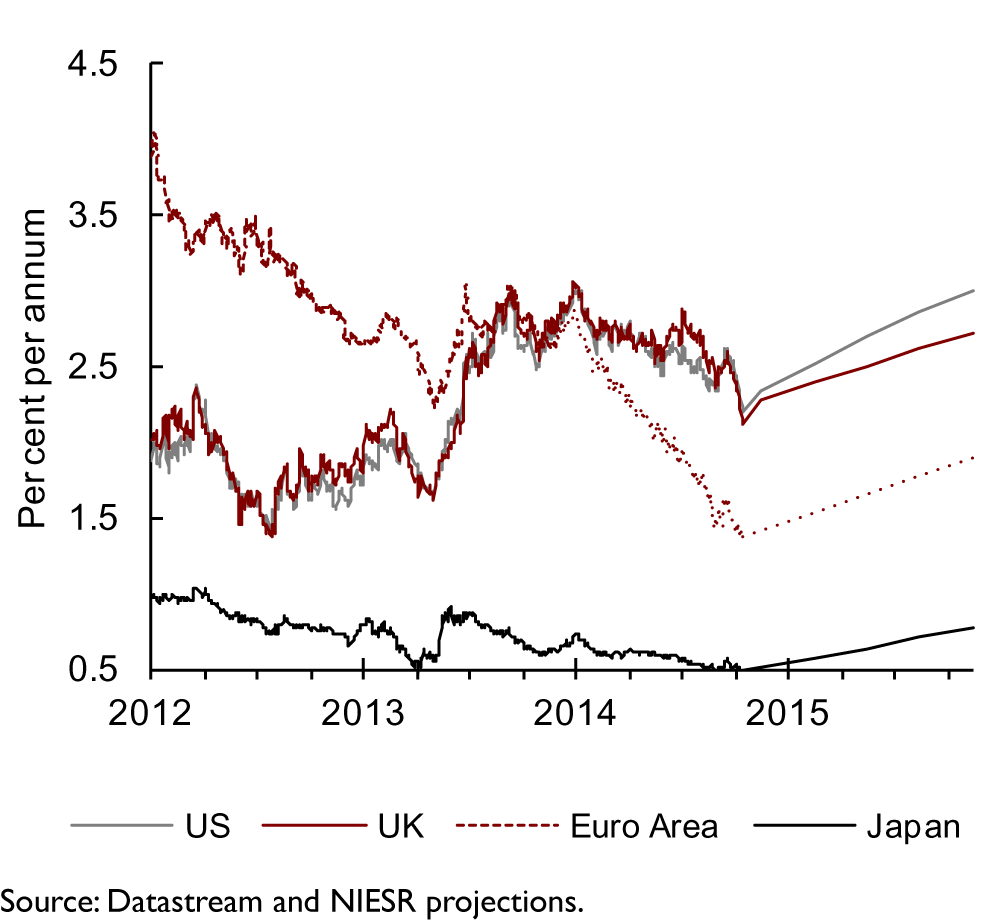
Figure A1 illustrates the recent movement in, and our projections for, 10-year government bond yields in the US, Euro Area, the UK and Japan. Government bond yields in the US, Euro Area and the UK picked up towards the end of December 2013, but have drifted down since, with the largest reduction in bond yields materialising in the Euro Area. Convergence in Euro Area bond yields towards those in the US, observed since the start of 2013, reversed at the beginning of this year. Since February 2014, the margin between Euro Area and US bond yields started to increase, reaching about 100 basis points (in absolute terms) in August and September. The expectations for bond yields throughout the remainder of 2014 and 2015 are lower than expectations formed just three months ago, for the US, Euro Area, UK and Japan. However, while the expectations for yields in Japan are marginally lower, by about 10 basis points, expectations of yields in the US, Euro Area and the UK have fallen by more: by approximately 30 basis points in the US and in a range of 40–55 basis points in the Euro Area and the UK.
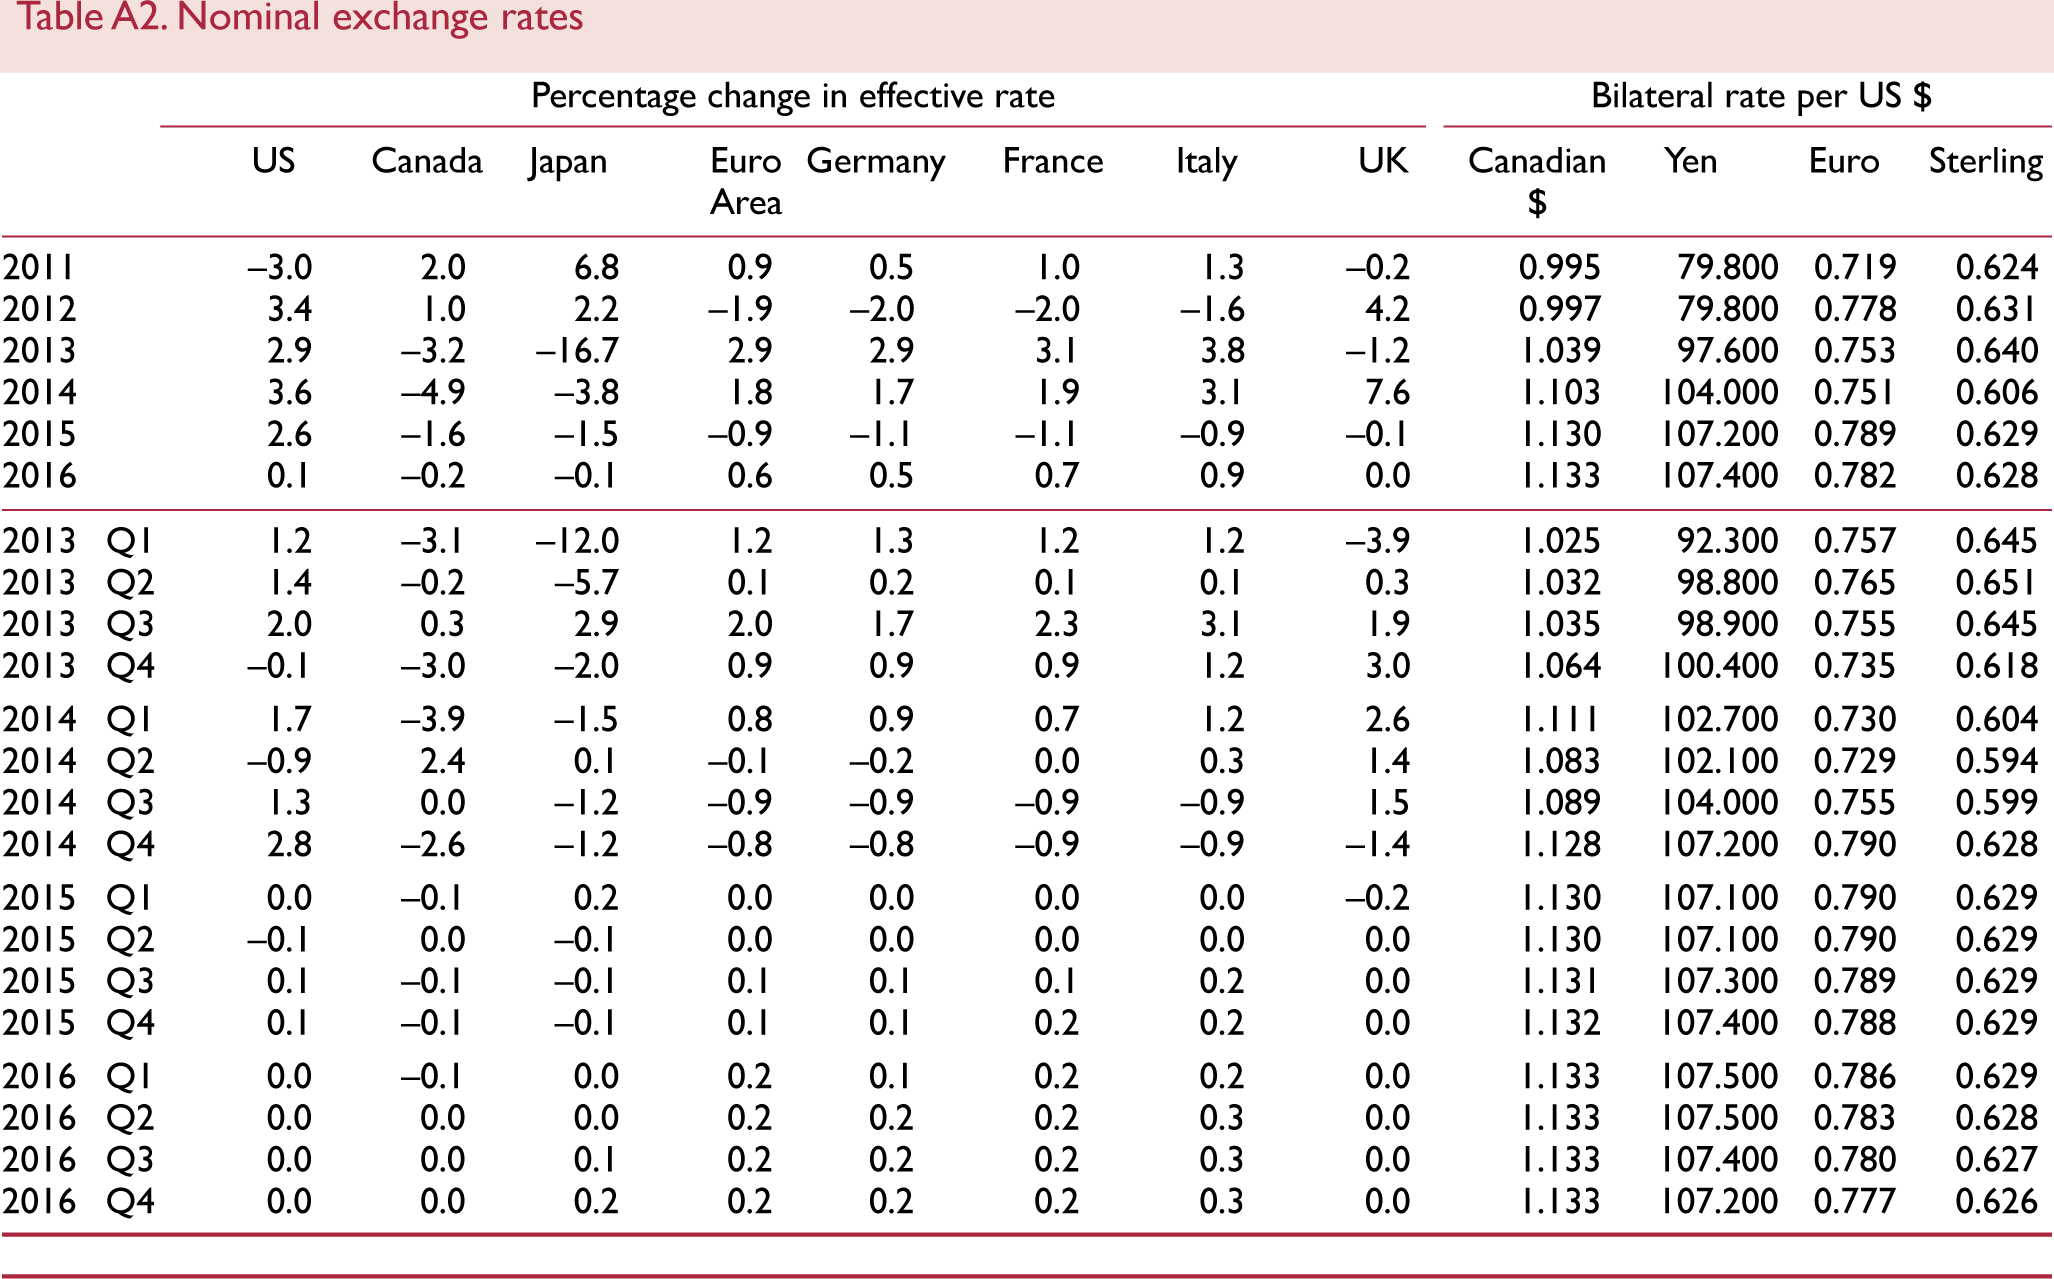
Nominal exchange rates
10-year government bond yields
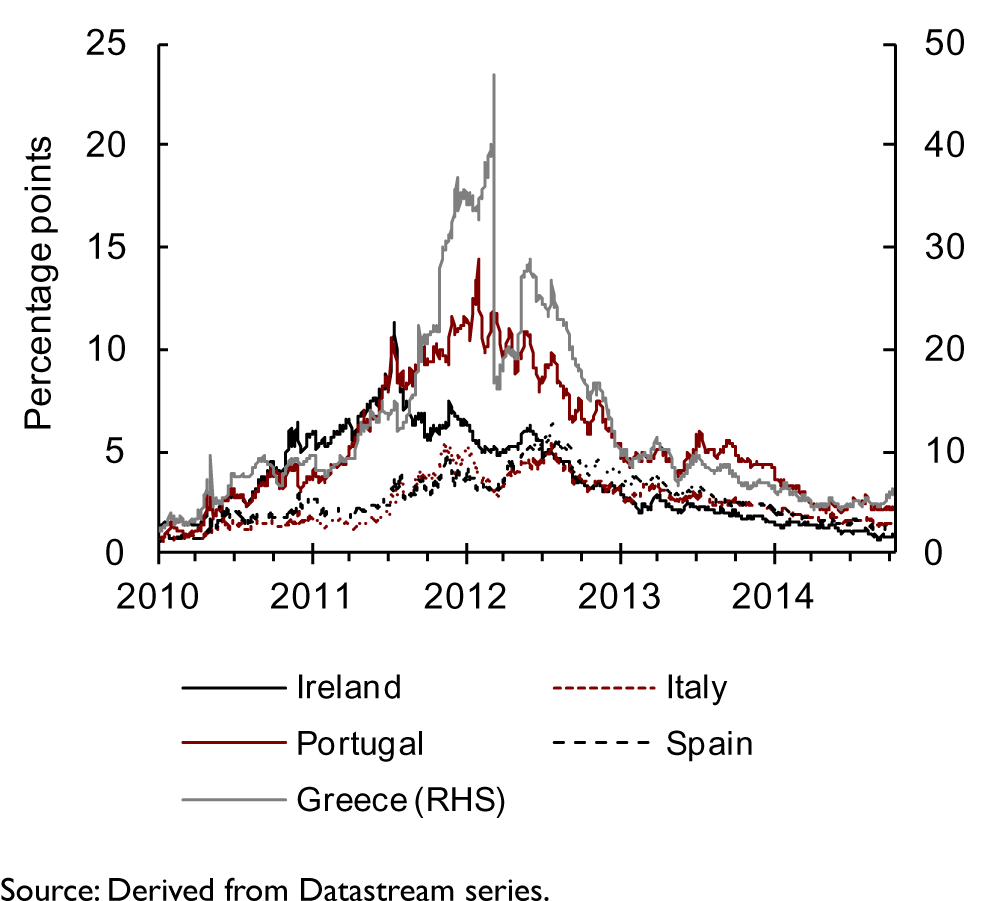
Spreads over 10-year German government bond yields
Government revenue assumptions
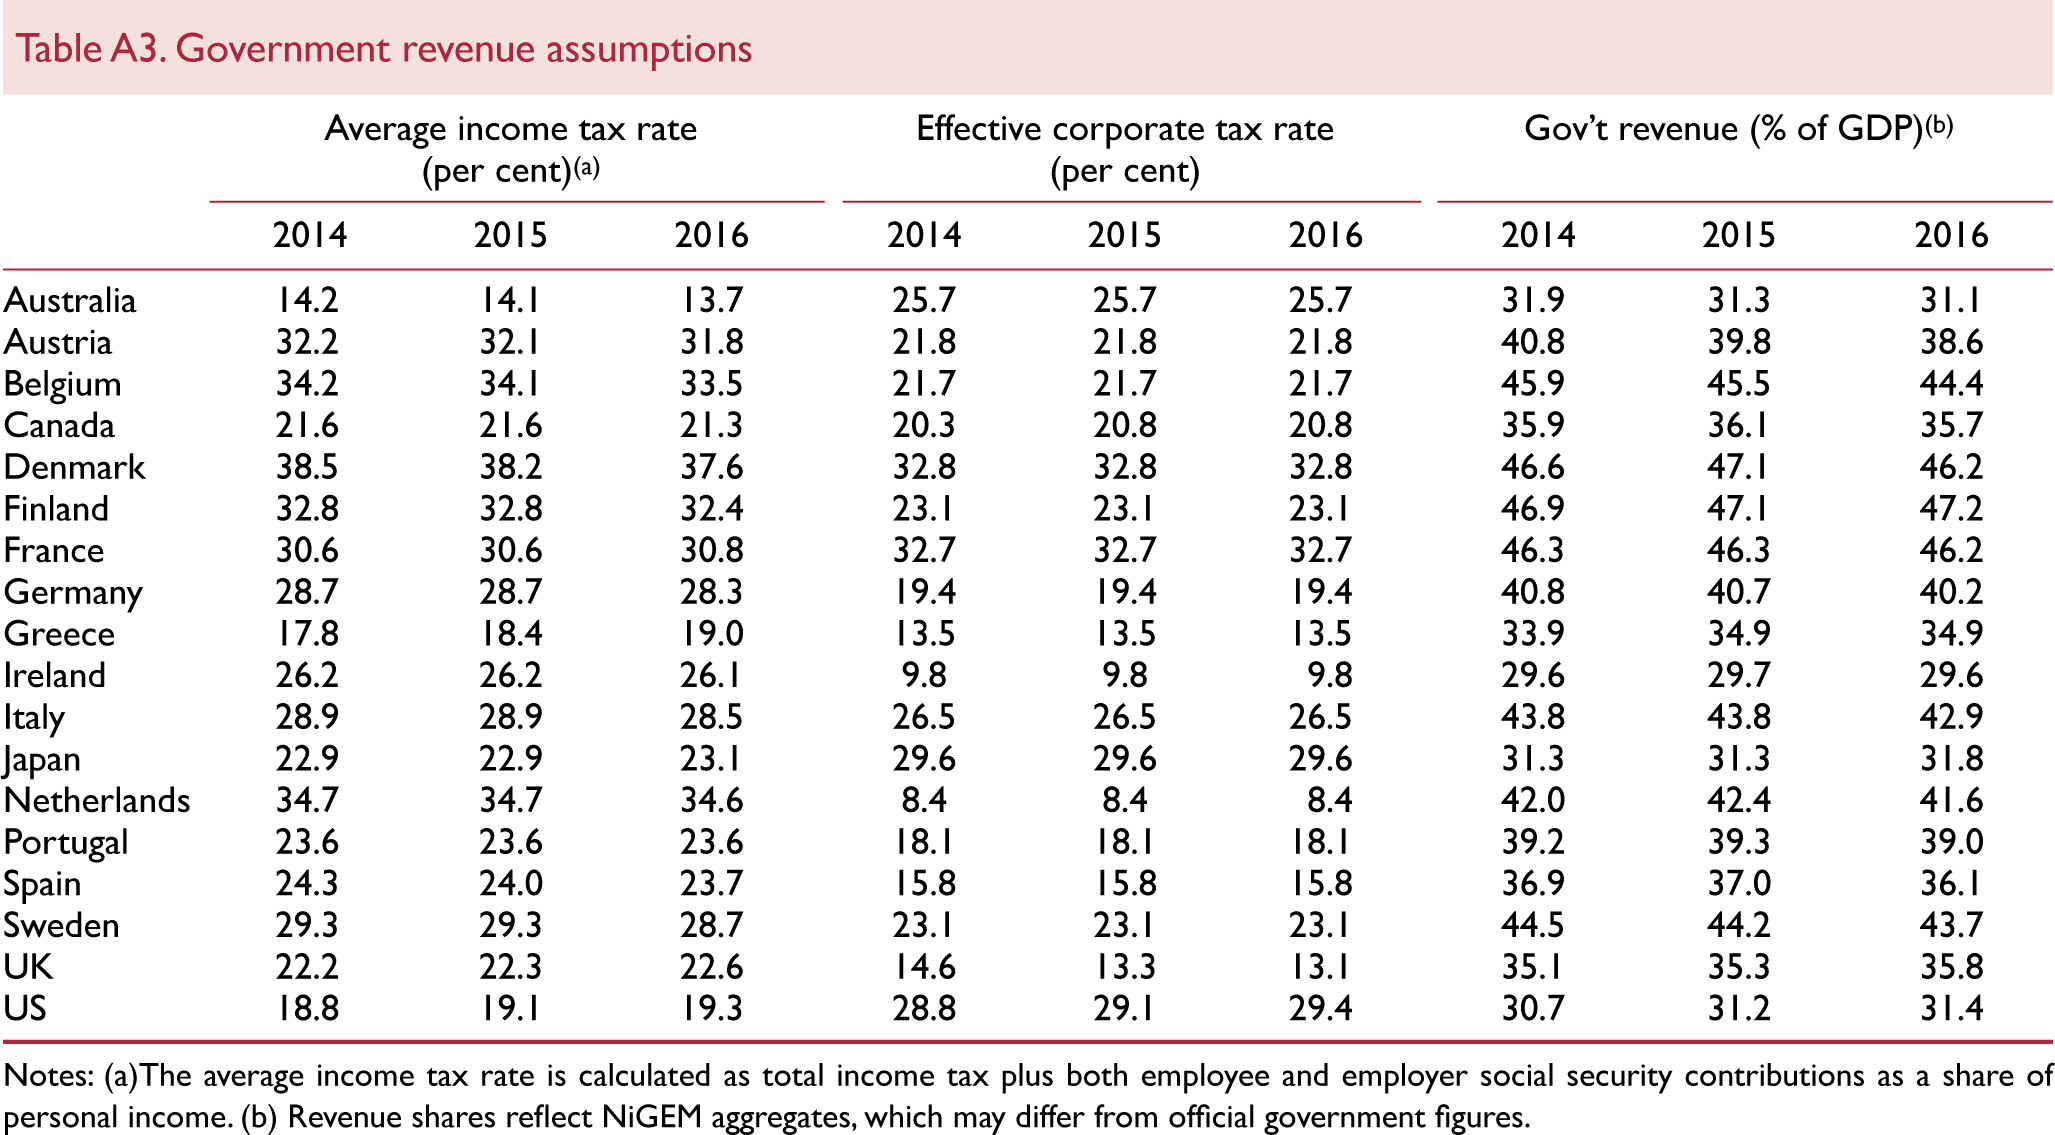
The average income tax rate is calculated as total income tax plus both employee and employer social security contributions as a share of personal income.
Revenue shares reflect NiGEM aggregates, which may differ from official government figures.
Sovereign risks in the Euro Area have been a major macroeconomic issue for the global economy and financial markets over the past three years. Figure A2 depicts the spread between 10-year government bond yields of Spain, Italy, Portugal, Ireland and Greece over Germany. The final agreement on Private Sector Involvement in the Greek government debt restructuring in February 2012 and the potential for Outright Money Transactions (OMT) announced by the ECB in August 2012 brought some relief to bond yields in these vulnerable economies. During summer 2013 there was some upward pressure on yields in Portugal, related to uncertainty over its fiscal austerity programme, parts of which were declared unconstitutional by the Portuguese Constitutional Court. However, better than expected GDP figures for the second quarter of 2013 calmed the financial markets somewhat and bond spreads narrowed. In June 2014, as foreshadowed in preceding weeks by its officials, the ECB announced a number of measures aimed at providing additional monetary accommodation and at supporting bank lending to the private sector, with the ultimate aim of increasing aggregate demand and raising inflation nearer to the target of ‘below, but close to, 2 per cent’. Sovereign spreads have changed little in most cases from late July 2014, the most notable exception being a marked widening of Greek spreads, partly reflecting fears of political instability. 3
In our forecast, we have assumed spreads over German bond yields continue to narrow in all Euro Area countries, and that this process resumes in Greece by the end of this year. In the case of Portugal, we have taken into account its exit from its international bail-out programme in May 2014, which caused a modest jump in its funding costs in the near term, as a result of the return to market sources for funding. The implicit assumption underlying this is that the Euro Area continues to hold together in its current form and further progress will be made towards establishing a banking union.
Government spending assumptions(a)
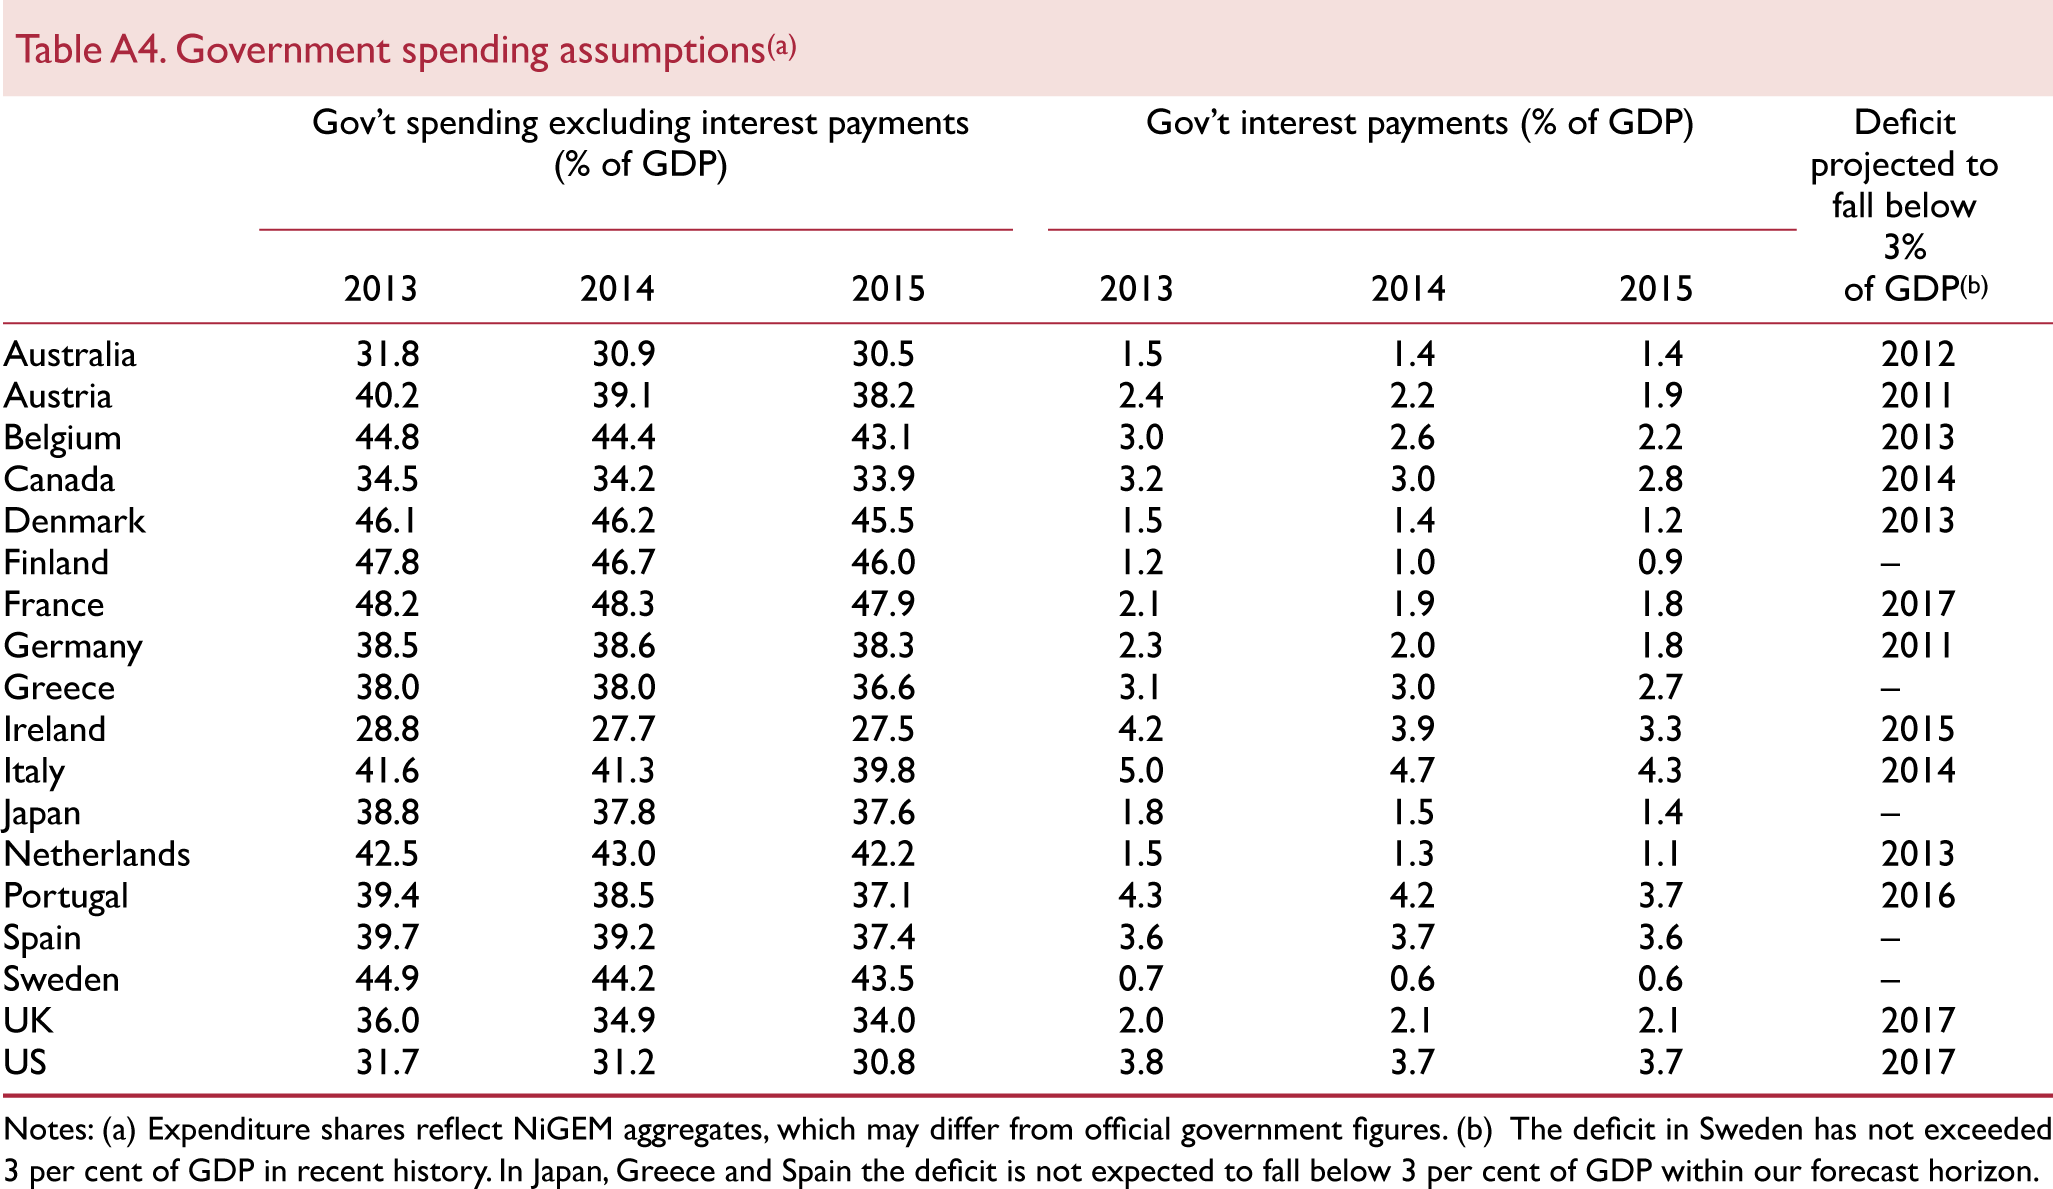
Expenditure shares reflect NiGEM aggregates, which may differ from official government figures.
The deficit in Sweden has not exceeded 3 per cent of GDP in recent history. In Japan, Greece and Spain the deficit is not expected to fall below 3 per cent of GDP within our forecast horizon.
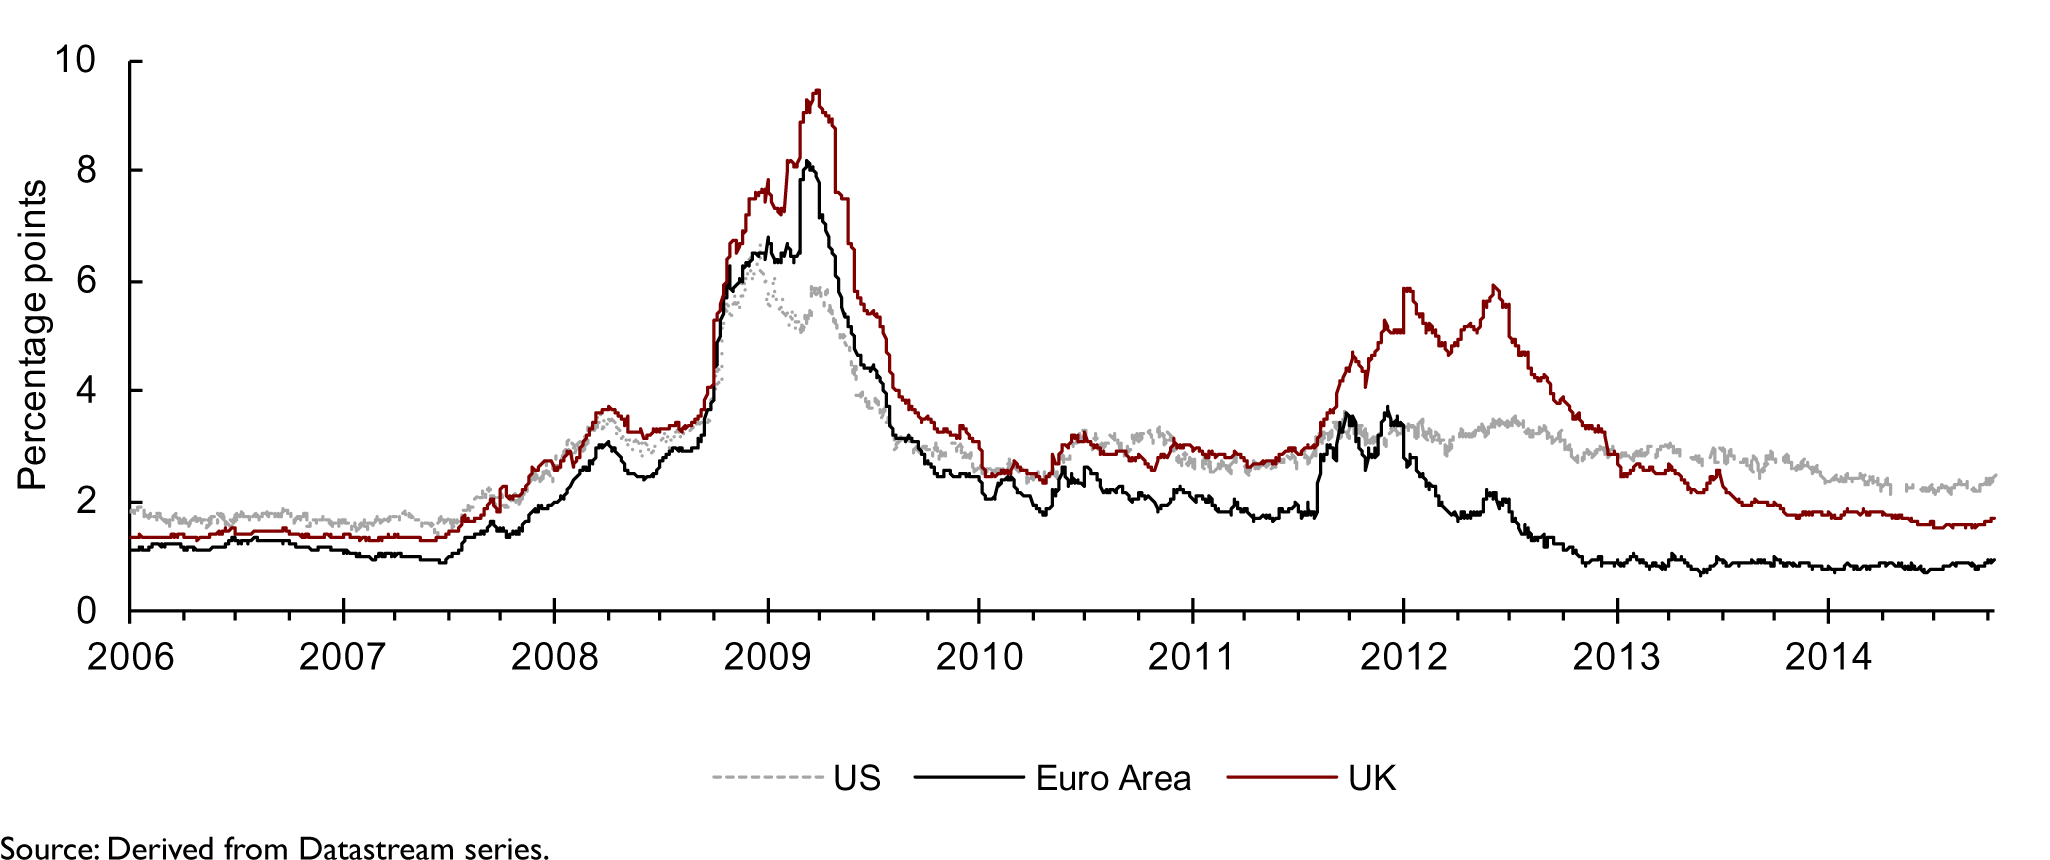
Corporate bond spreads. Spread between BAA corporate and 10-year government bond yields
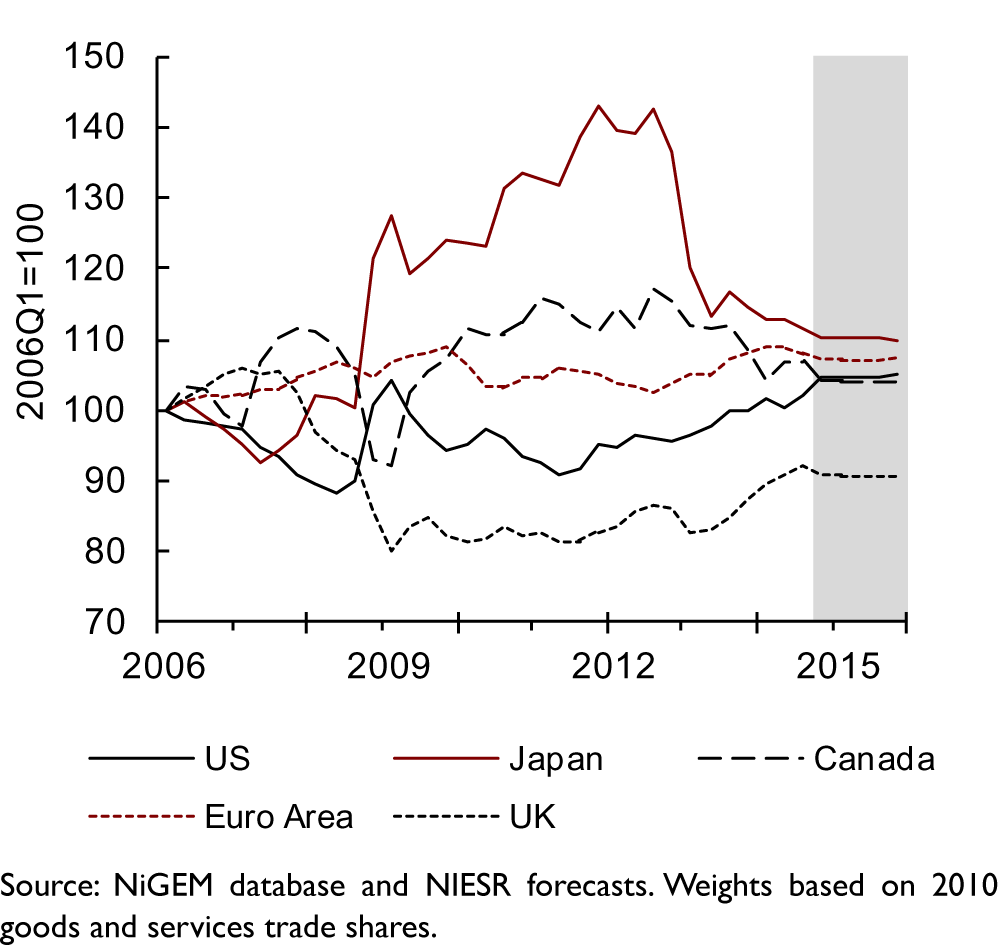
Effective exchange rates
Share prices
Figure A3 reports the spread of corporate bond yields over government bond yields in the US, UK and Euro Area. This acts as a proxy for the margin between private sector and ‘risk free’ borrowing costs. Private sector borrowing costs have risen more or less in line with the observed rise in government bond yields since the second half of 2013, illustrated by the stability of these spreads in the US, Euro Area and the UK. Our forecast assumption for corporate spreads is that they gradually converge towards their long-term equilibrium level from 2015.
Nominal exchange rates against the US dollar are generally assumed to remain constant at the rate prevailing on 14 October 2014 until the end of June 2015. After that, they follow a backward-looking uncovered–interest parity condition, based on interest rate differentials relative to the US. We have modified this assumption for China, assuming that the exchange rate target continues to follow a gradual appreciation against the US$, of about 2½ per cent annually from end 2014 to 2016.
Our oil price assumptions for the short term are based on those of the US Energy Information Administration, who use information from forward markets as well as an evaluation of supply conditions, and are reported in table 1 at the beginning of this chapter. Increases in oil prices due to crises in Iraq as well as Ukraine were short lived. Partly reflecting weakness in the global economy and partly due to a glut in supply, the price of oil has fallen since the beginning of September 2014, dropping by about 20 per cent since the beginning of the year. We assume the price of oil to remains relatively stable through to the end of 2014. Overall, oil price expectations for the end of this year have dropped by more than $10 per barrel, compared to expectations formed just three months ago. Over the medium term, oil price growth will be restrained, in part, by the rise in new extraction methods for oil and gas, especially in the US (see the discussion in February 2013 National Institute Economic Review and Chojna et al., 2013).
Our equity price assumptions for the US reflect the expected return on capital. Other equity markets are assumed to move in line with the US market, but are adjusted for different exchange rate movements and shifts in country-specific equity risk premia. Figure A5 illustrates the key equity price assumptions underlying our current forecast. Global share prices had performed well since the beginning of 2013, irrespective of a short lived drop – a reaction to the QE tapering signals emanating from the Federal Reserve last summer – and continued to increase in most countries through the first half of 2014. Recently, however, concerns about weak growth and low inflation seem to have induced a fall in share prices globally (the few exceptions to this include India, Vietnam and Poland). The scale of the drop varied significantly between countries. The fall in Greece was particularly sharp. Equity prices there fell by in excess of 26 per cent between the end of July and mid-October.
Fiscal policy assumptions for 2014–15 follow announced policies as of 1 October 2014. Average personal sector tax rates and effective corporate tax rate assumptions underlying the projections are reported in table A3.
Our forecast also incorporates planned/enacted changes in VAT rates in 2013–14 for Canada, Finland, France, Italy and Japan. Government spending is expected to decline as a share of GDP between 2014 and 2015 in the majority of Euro Area countries reported in the table. Recent policy announcements in Portugal, Spain, Italy and elsewhere suggest that the commitment to fiscal austerity in Europe may be waning. A policy loosening relative to our current assumptions poses an upside risk to the short-term outlook in Europe. For a discussion of fiscal multipliers and the impact of fiscal policy on the macroeconomy based on NiGEM simulations, see Barrell, Holland and Hurst (2013).
Footnotes
1
Interest rate assumptions are based on information available for the period to 14 October 2014, inclusive, and do not include the 25 basis point increase by the Central Bank of Brazil on 30 October 2014 and the 25 basis point reduction by the Swedish Central Bank on 28 October 2014.
2
Federal Open Market Committee statement, the Federal Reserve, 19 March 2014.
3
Yields on 10-year Greek bonds rose back above 8 per cent for three days in the middle of October 2014. At the time of writing they are below but remain close to 8 per cent.