
Abstract

The forecasts for the world and the UK economy reported in this Review are produced using the National Institute's model, NiGEM. The NiGEM model has been in use at NIESR for forecasting and policy analysis since 1987, and is also used by a group of about 40 model subscribers, mainly in the policy community. Most countries in the OECD are modelled separately, 1 and there are also separate models of China, India, Russia, Brazil, Hong Kong, Taiwan, Indonesia, Singapore, Vietnam, South Africa, Latvia, Lithuania, Romania and Bulgaria. The rest of the world is modelled through regional blocks so that the model is global in scope. All models contain the determinants of domestic demand, export and import volumes, prices, current accounts and net assets. Output is tied down in the long run by factor inputs and technical progress interacting through production functions, but is driven by demand in the short to medium term. Economies are linked through trade, competitiveness and financial markets and are fully simultaneous. Further details on the NiGEM model are available at http://nimodel.niesr.ac.uk/.
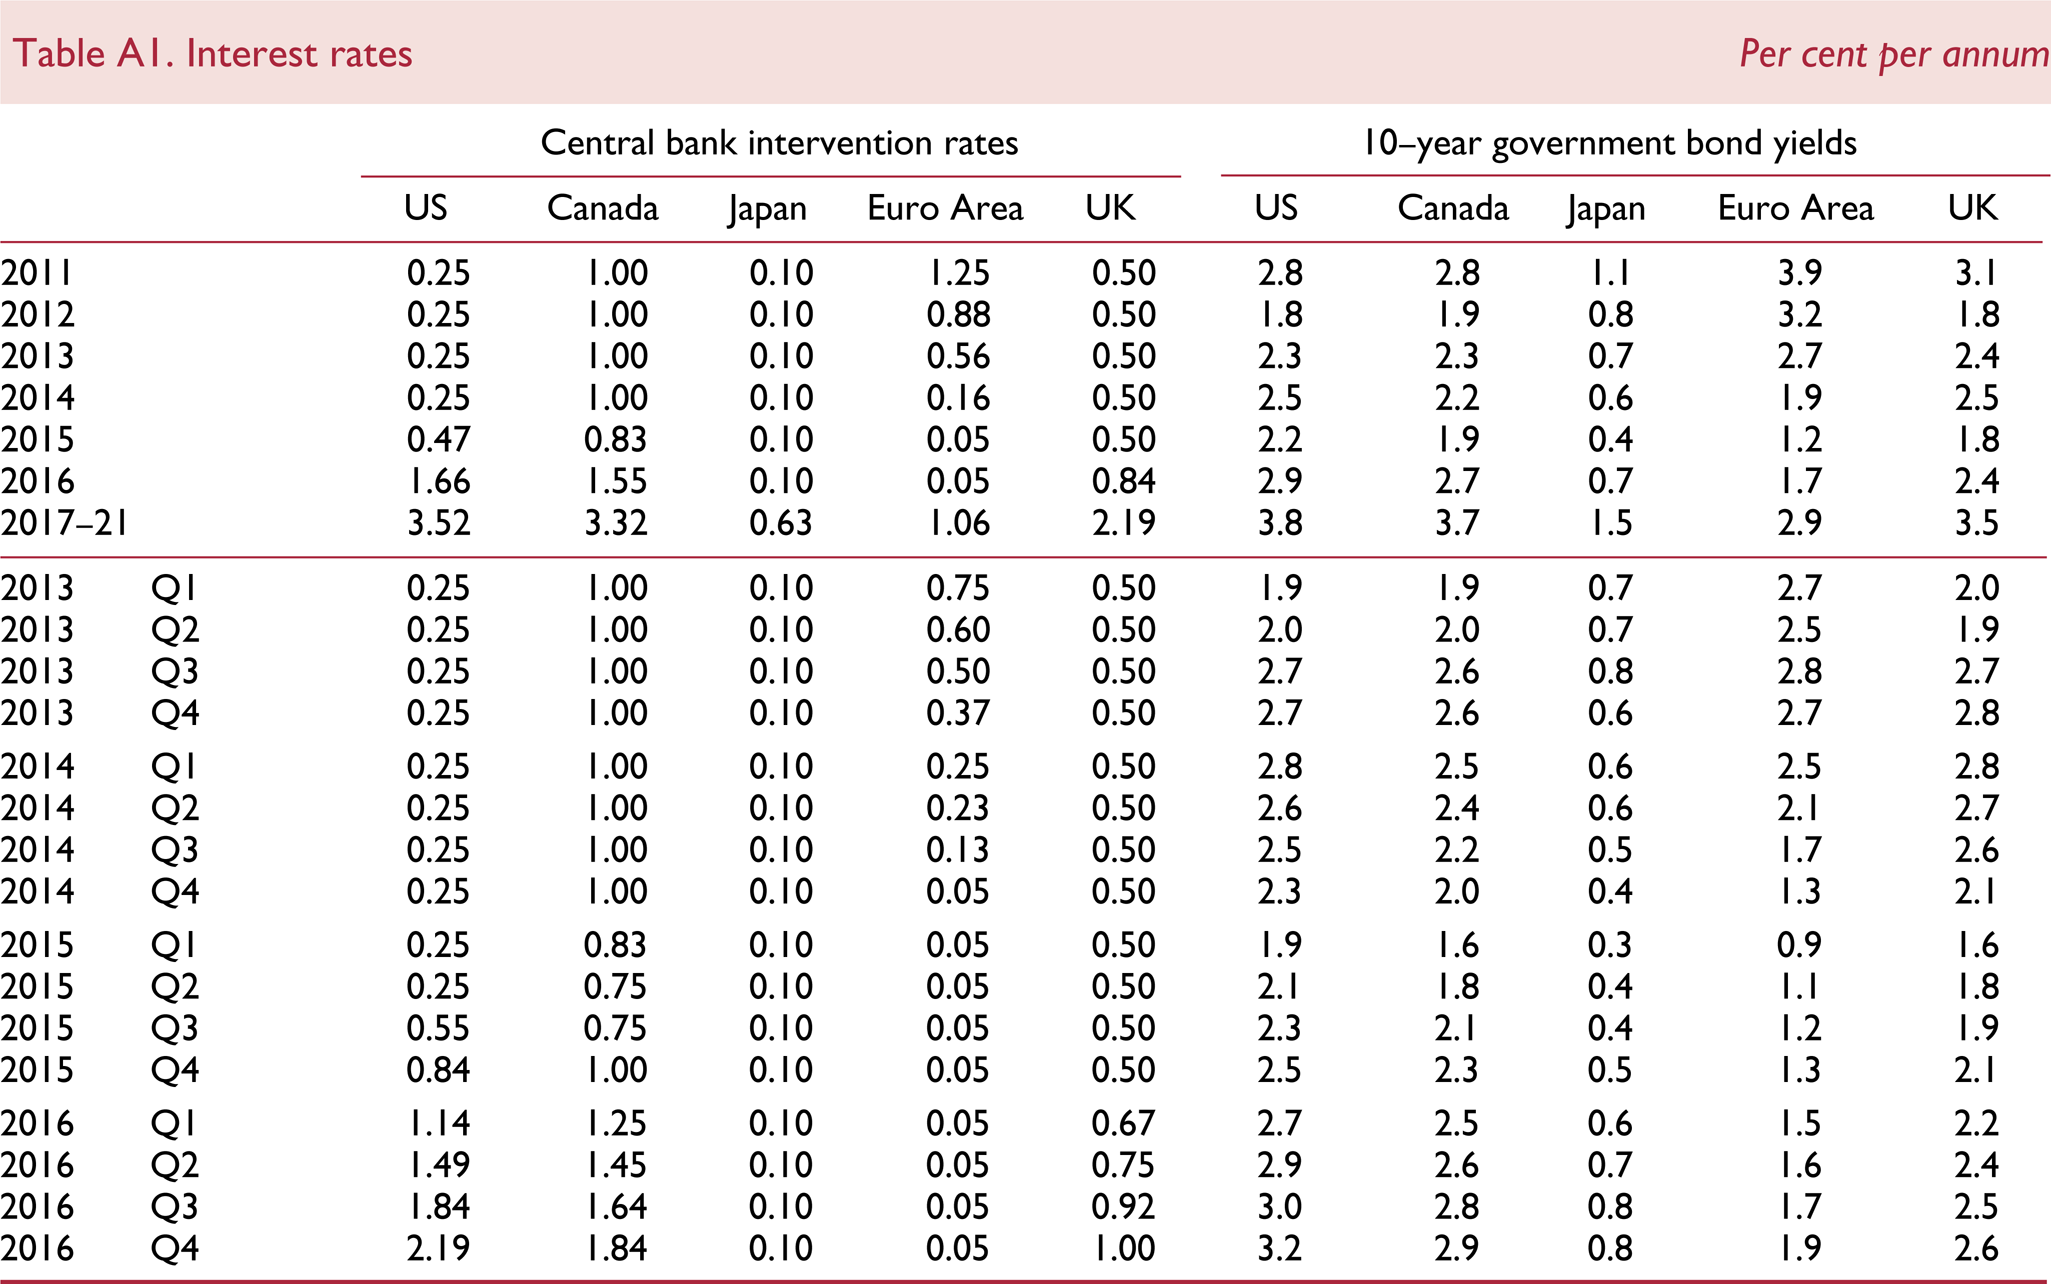
The key interest rate and exchange rate assumptions underlying our current forecast are shown in tables A1–A2. Our short-term interest rate assumptions are generally based on current financial market expectations, as implied by the rates of return on treasury bills and government bonds of different maturities. Long-term interest rate assumptions are consistent with forward estimates of short-term interest rates, allowing for a country-specific term premium in the Euro Area. Policy rates in the major advanced economies are expected to remain at extremely low levels, at least in the first half of 2015. The Reserve Bank of Australia reduced interest rates by 50 basis points through 2013 and has kept them unchanged since. After lowering its policy rates by 150 basis points in four steps between mid-2013 and June 2014, the Mexican central bank has kept them unchanged. The Bank of Korea and the central bank of Sweden reduced interest rates by 50 and 75 basis points correspondingly in two steps in the second half of last year. The central bank of Turkey has cut its policy rate by 225 basis points over four rounds since April 2014. Both the central banks of Hungary and Romania have lowered their interest rates. Since last summer, the Romanian central bank has reduced theirs by 250 basis points in nine steps. The central bank of Hungary brought them down by 365 basis points in nineteen rounds between the beginning of 2013 and July 2014. The central banks of Norway and Poland lowered their policy interest rates by 25 and 50 basis points, respectively, in the fourth quarter of 2014, the first reductions since 2012 in Norway and summer 2013 in Poland. The central banks of Canada, India and Switzerland lowered their benchmark interest rates by 25 basis points in January 2015, while Denmark's central bank reduced them by 15 basis points to 5 basis points above zero. While for the central banks of India and Denmark it was the first rate cut since May 2013, for the Canadian central bank is was the first since 2009. In contrast, several emerging market economies have tightened monetary policy in response to inflationary and financial market pressures, most notably in Brazil, Indonesia, Russia and South Africa. Since 2013, Brazil and Russia have raised their policy rates in six rounds, by 2.25 and 11.5 percentage points respectively. South Africa and Indonesia increased interest rates in 2014. The central bank of New Zealand has increased its policy rate by a total of 100 basis points in four steps throughout 2014. 2 A reduction in interest rates will mitigate, somewhat, the risk of short real rates turning positive in some of these emerging market countries. However, for the economies that are already experiencing falling price levels, modest cuts in interest rates will probably not be enough to stop a switch to positive real interest rates. This is especially the case for many members of the Euro Area.
Policymakers in the US and UK are expected to begin to raise interest rates in the second half of 2015 and at the beginning of 2016 respectively, pre-empting rate rises in the Euro Area by at least five quarters. For the US, this is broadly consistent with the interest rate path signalled by the Federal Open Market Committee (FOMC). The Federal Reserve ended its ‘QE3’ programme of asset purchases in October 2014. The timing of increases in the Fed's short-term interest rates remains uncertain. Recent economic developments have not diminished the case, set out in our November Review, for waiting until there are clear signs that the future underlying inflation rate will probably rise above the 2 per cent objective, before embarking on the gradual path to interest rate normalisation. In its policy statement of 28 January 2015, the Fed reiterated its message that, based on its current assessment, it could be “patient in beginning to normalize the stance of policy”.
In contrast, the ECB and the central bank of Japan are introducing additional rounds of balance sheet expansion. With its benchmark interest rates already close to, or below, zero, the ECB has proceeded to implement the programmes of financial market operations announced last June and September, designed to provide additional monetary stimulus through the expansion of its balance sheet (see Reviews of August and November 2014). In addition, on 22 January, it announced a major expansion of the asset purchase programme under which the Eurosystem – comprising the ECB and the Area's national central banks – will begin in March 2015 to purchase, in the secondary market, euro-denominated investment-grade securities issued by Euro Area governments and government agencies, and by European institutions. The purchases will be coordinated by the ECB. Including the covered bond and asset-backed securities purchase programmes introduced last year, combined monthly purchases will amount to EUR 60 billion. The expanded purchase programme is open-ended: it will continue until “at least September 2016 and in any case until the Governing Council sees a sustained adjustment in the path of inflation that is consistent with its aim of achieving inflation rates below, but close to, 2 per cent over the medium term”. The purchases planned between March 2015 and September 2016 will amount to EUR 1.14 trillion (about 11 per cent of Euro Area GDP).
Figure A1 illustrates the recent movement in, and our projections for, 10-year government bond yields in the US, Euro Area, the UK and Japan. Government bond yields in the US, Euro Area and the UK picked up marginally towards the end of December 2013, but have drifted down since, with the largest reduction in bond yields materialising in the Euro Area. Convergence in Euro Area bond yields towards those in the US, observed since the start of 2013, reversed at the beginning of this year. Since February 2014, the margin between Euro Area and US bond yields started to increase, remaining on average at about 100 basis points (in absolute terms) since August last year. The expectations for bond yields throughout 2015 are lower than expectations formed just three months ago, for the US, Euro Area, UK and Japan. However, while the expectations for yields in Japan are marginally lower, by about 30 basis points, expectations of yields in the US, Euro Area and the UK have fallen by more: by approximately 55 basis points in the Euro Area, between 50–65 basis points in the US and in a range of 65–80 basis points in the UK.
Interest rates Per cent per annum
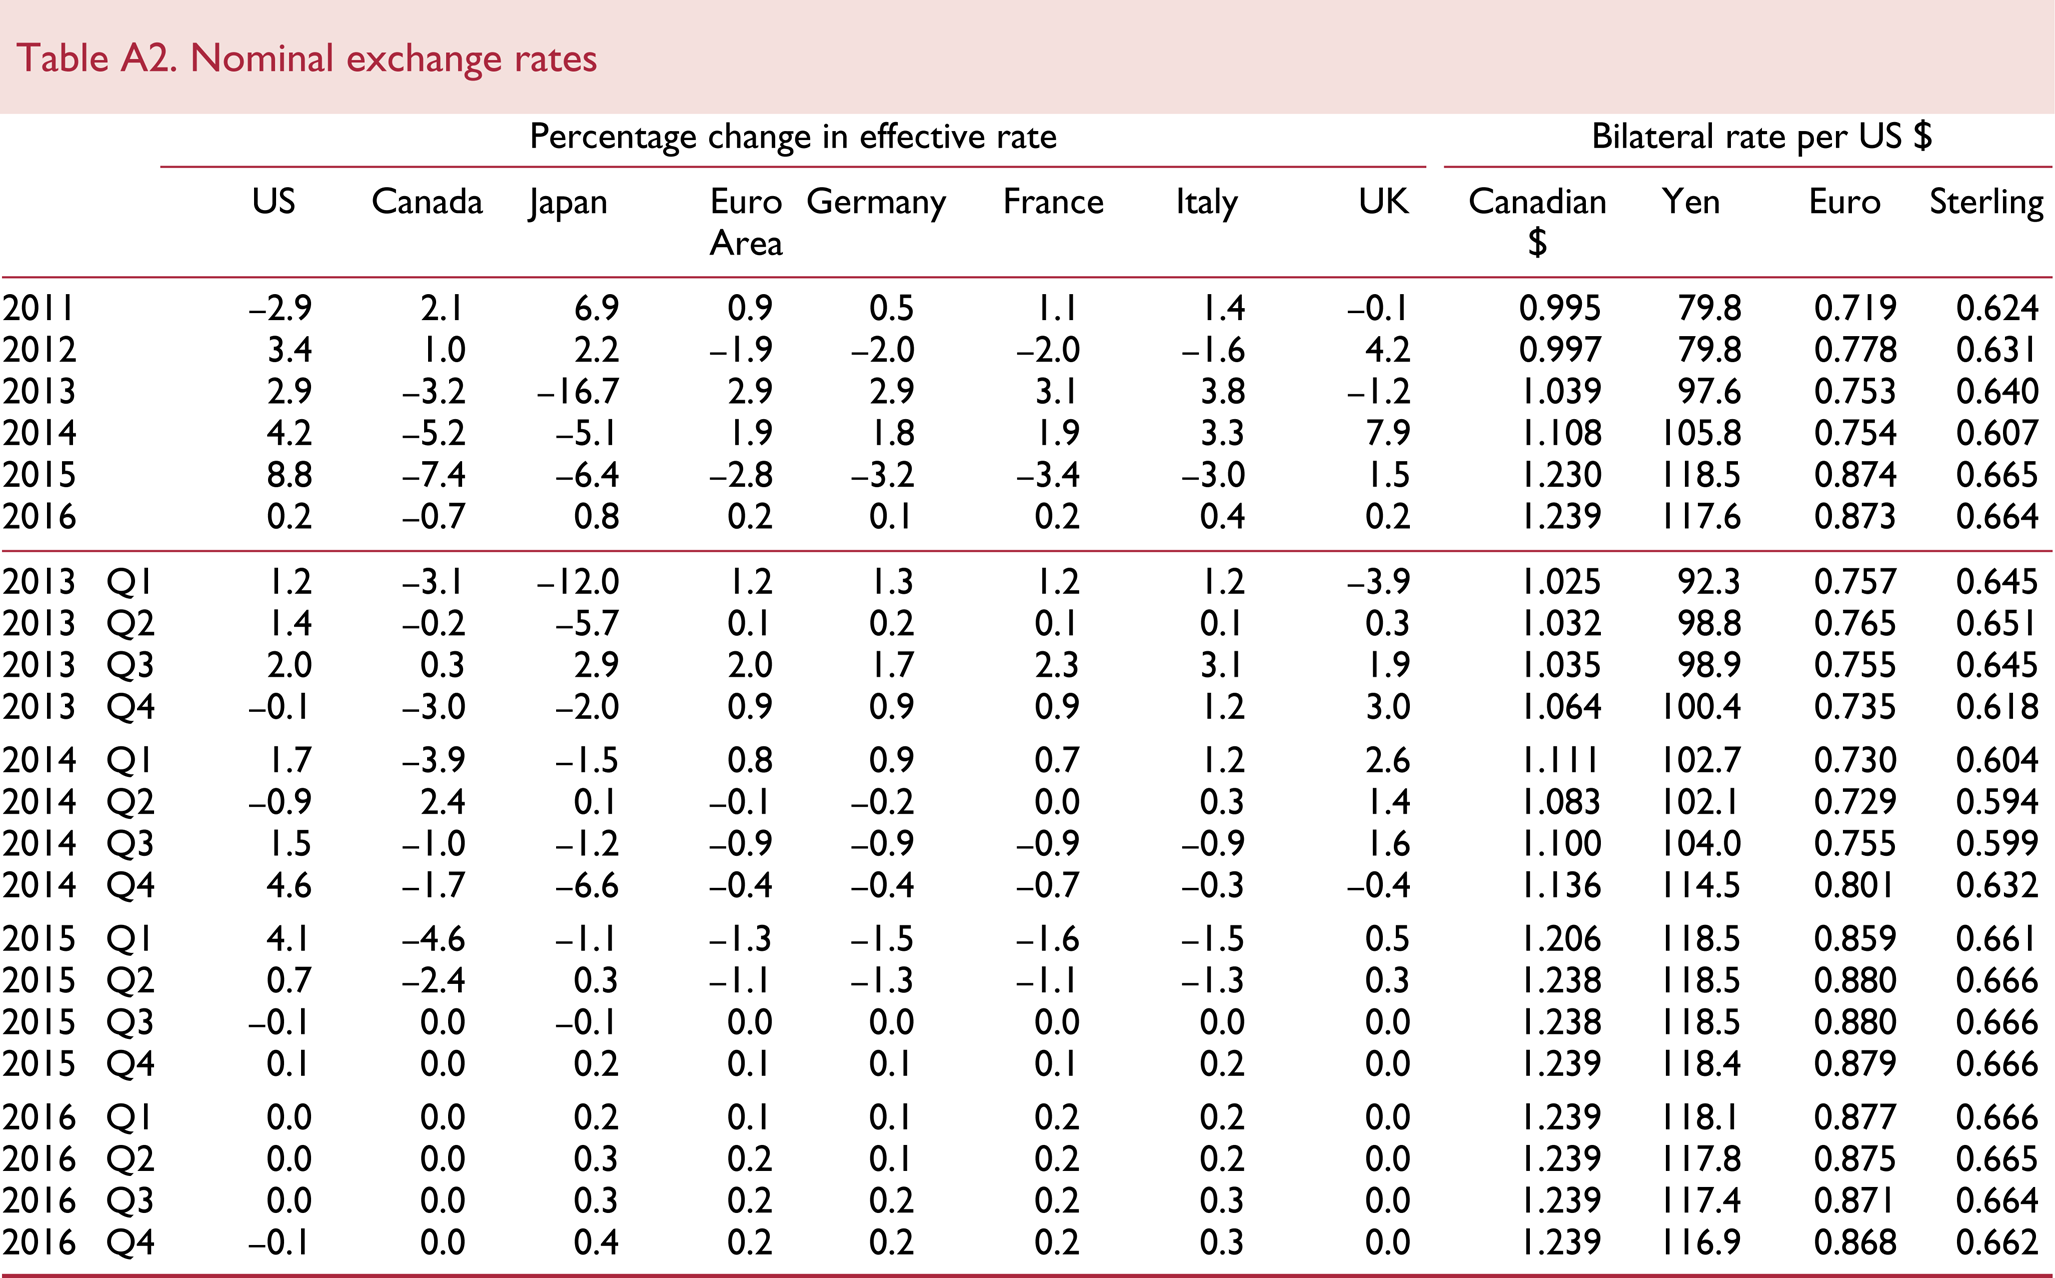
Nominal exchange rates
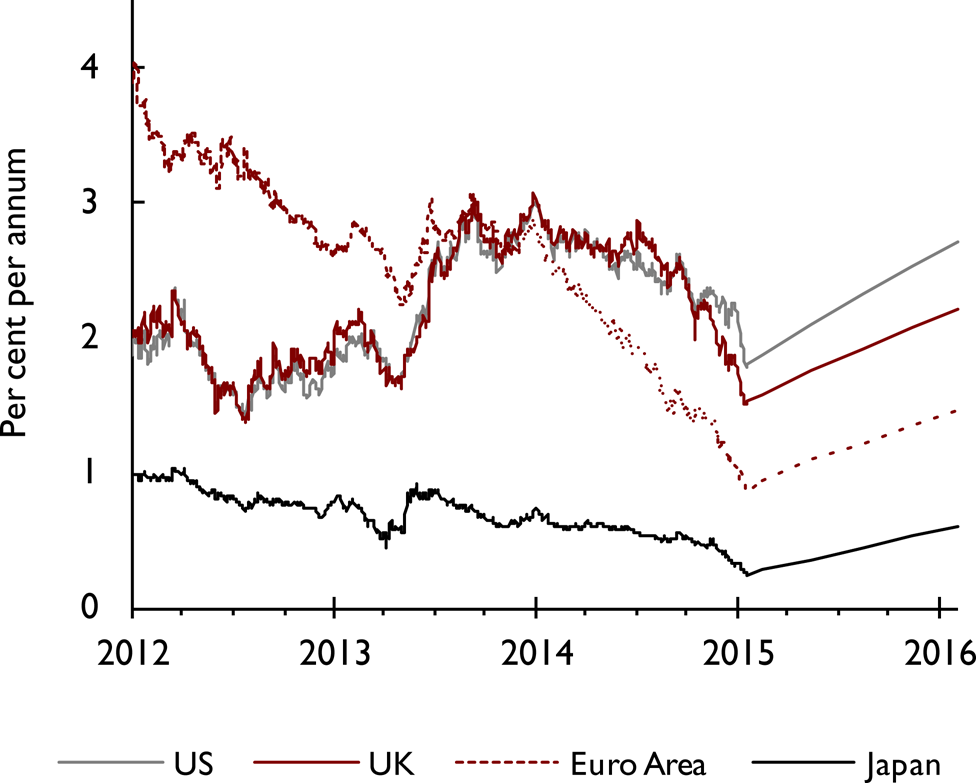
10-year government bond yields
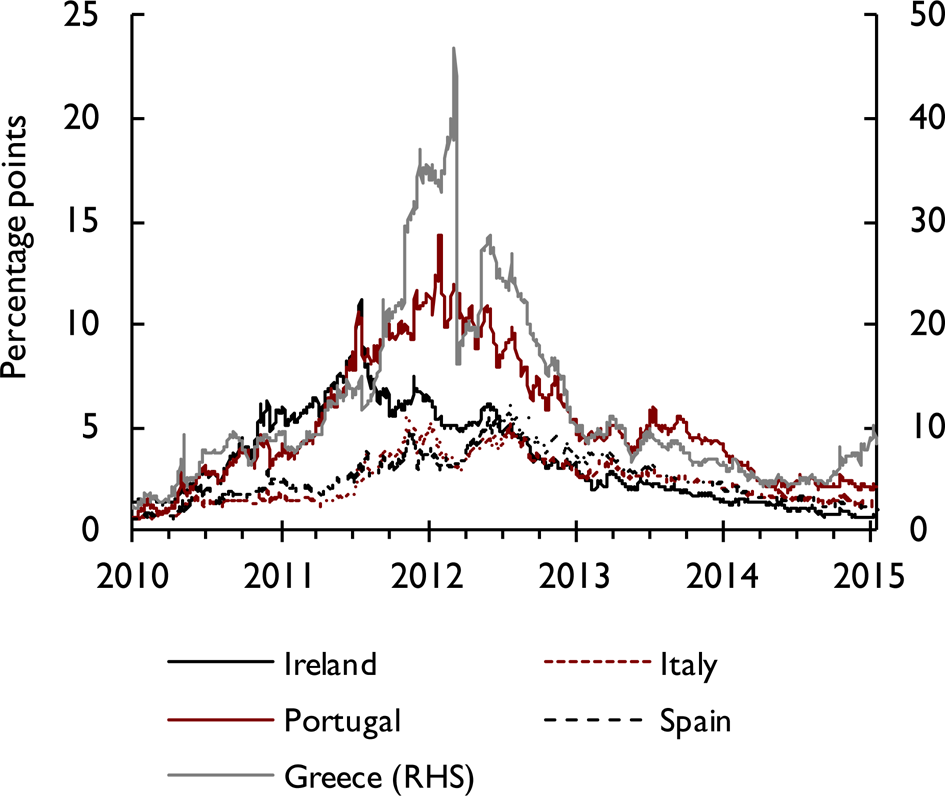
Spreads over 10-year German government bond yields
Government revenue assumptions
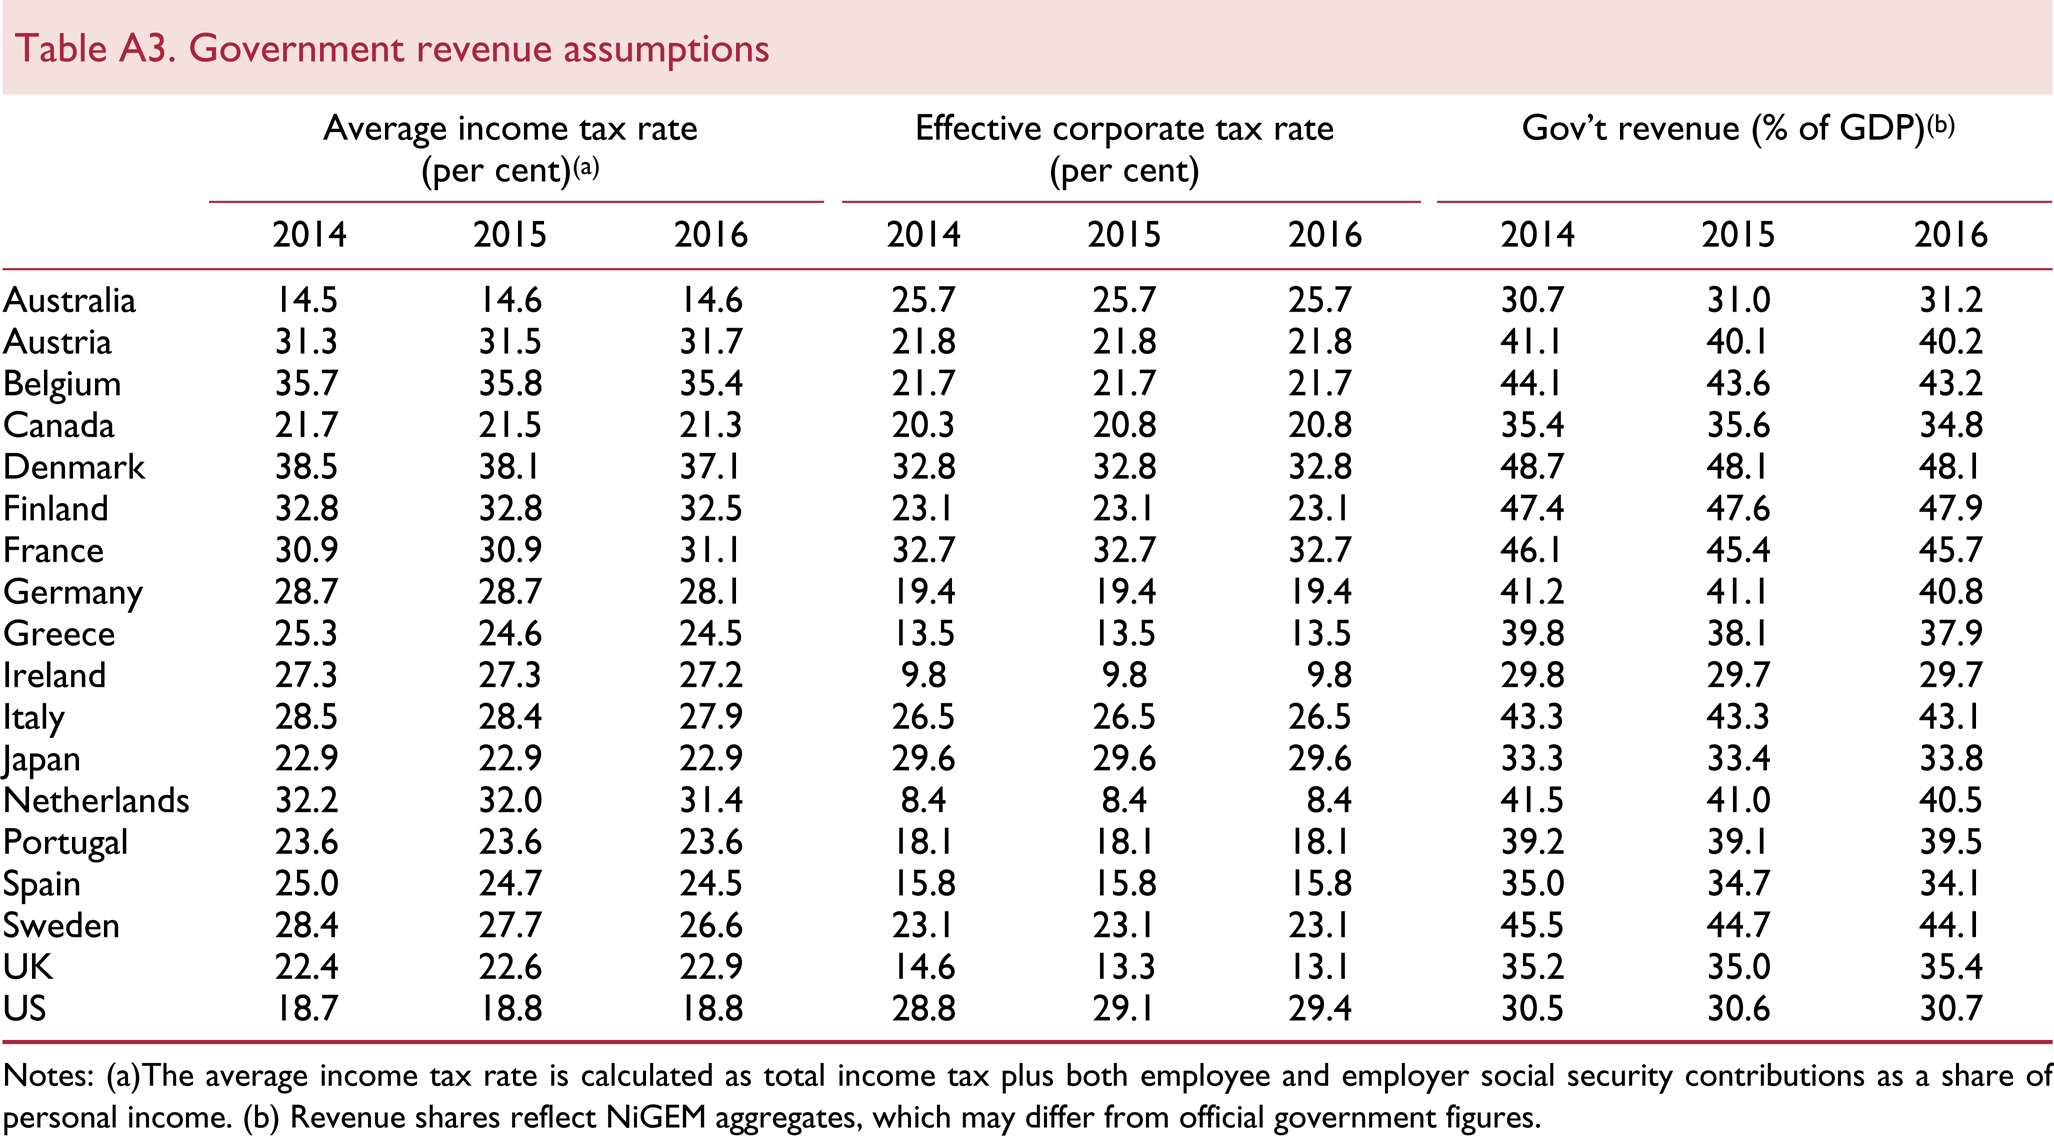
The average income tax rate is calculated as total income tax plus both employee and employer social security contributions as a share of personal income.
Revenue shares reflect NiGEM aggregates, which may differ from official government figures.
Sovereign risks in the Euro Area have been a major macroeconomic issue for the global economy and financial markets over the past three years. Figure A2 depicts the spread between the 10-year government bond yields of Spain, Italy, Portugal, Ireland and Greece over Germany's. The final agreement on Private Sector Involvement in the Greek government debt restructuring in February 2012 and the potential for Outright Money Transactions (OMT) announced by the ECB in August 2012 brought some relief to bond yields in these vulnerable economies. During the summer of 2013 there was some upward pressure on yields in Portugal, related to uncertainty over its fiscal austerity programme, parts of which were declared unconstitutional by the Portuguese Constitutional Court. However, better than expected GDP figures for the second quarter of 2013 calmed the financial markets somewhat and bond spreads narrowed. In June 2014, as foreshadowed in preceding weeks by its officials, the ECB announced a number of measures aimed at providing additional monetary accommodation and at supporting bank lending to the private sector, with the ultimate aim of increasing aggregate demand and raising inflation nearer to the target of ‘below, but close to, 2 per cent’. Sovereign spreads have changed little in most cases from late July 2014, the most notable exception being a marked widening of Greek spreads, reflecting uncertainty over its fiscal stance and debt repayment since the recent formation of a government dominated by a political party elected on an anti-austerity manifesto. 3 In our forecast, we have assumed spreads over German bond yields continue to narrow in all Euro Area countries, and that this process resumes in Greece by the end of this year. The implicit assumption underlying the forecast is that the Euro Area continues to hold together in its current form.
Figure A3 reports the spread of corporate bond yields over government bond yields in the US, UK and Euro Area. This acts as a proxy for the margin between private sector and ‘risk free’ borrowing costs. Private sector borrowing costs have risen more or less in line with the observed rise in government bond yields since the second half of 2013, illustrated by the stability of these spreads in the US, Euro Area and the UK. Our forecast assumption for corporate spreads is that they gradually converge towards their long-term equilibrium level from 2015.
Government spending assumptions(a)
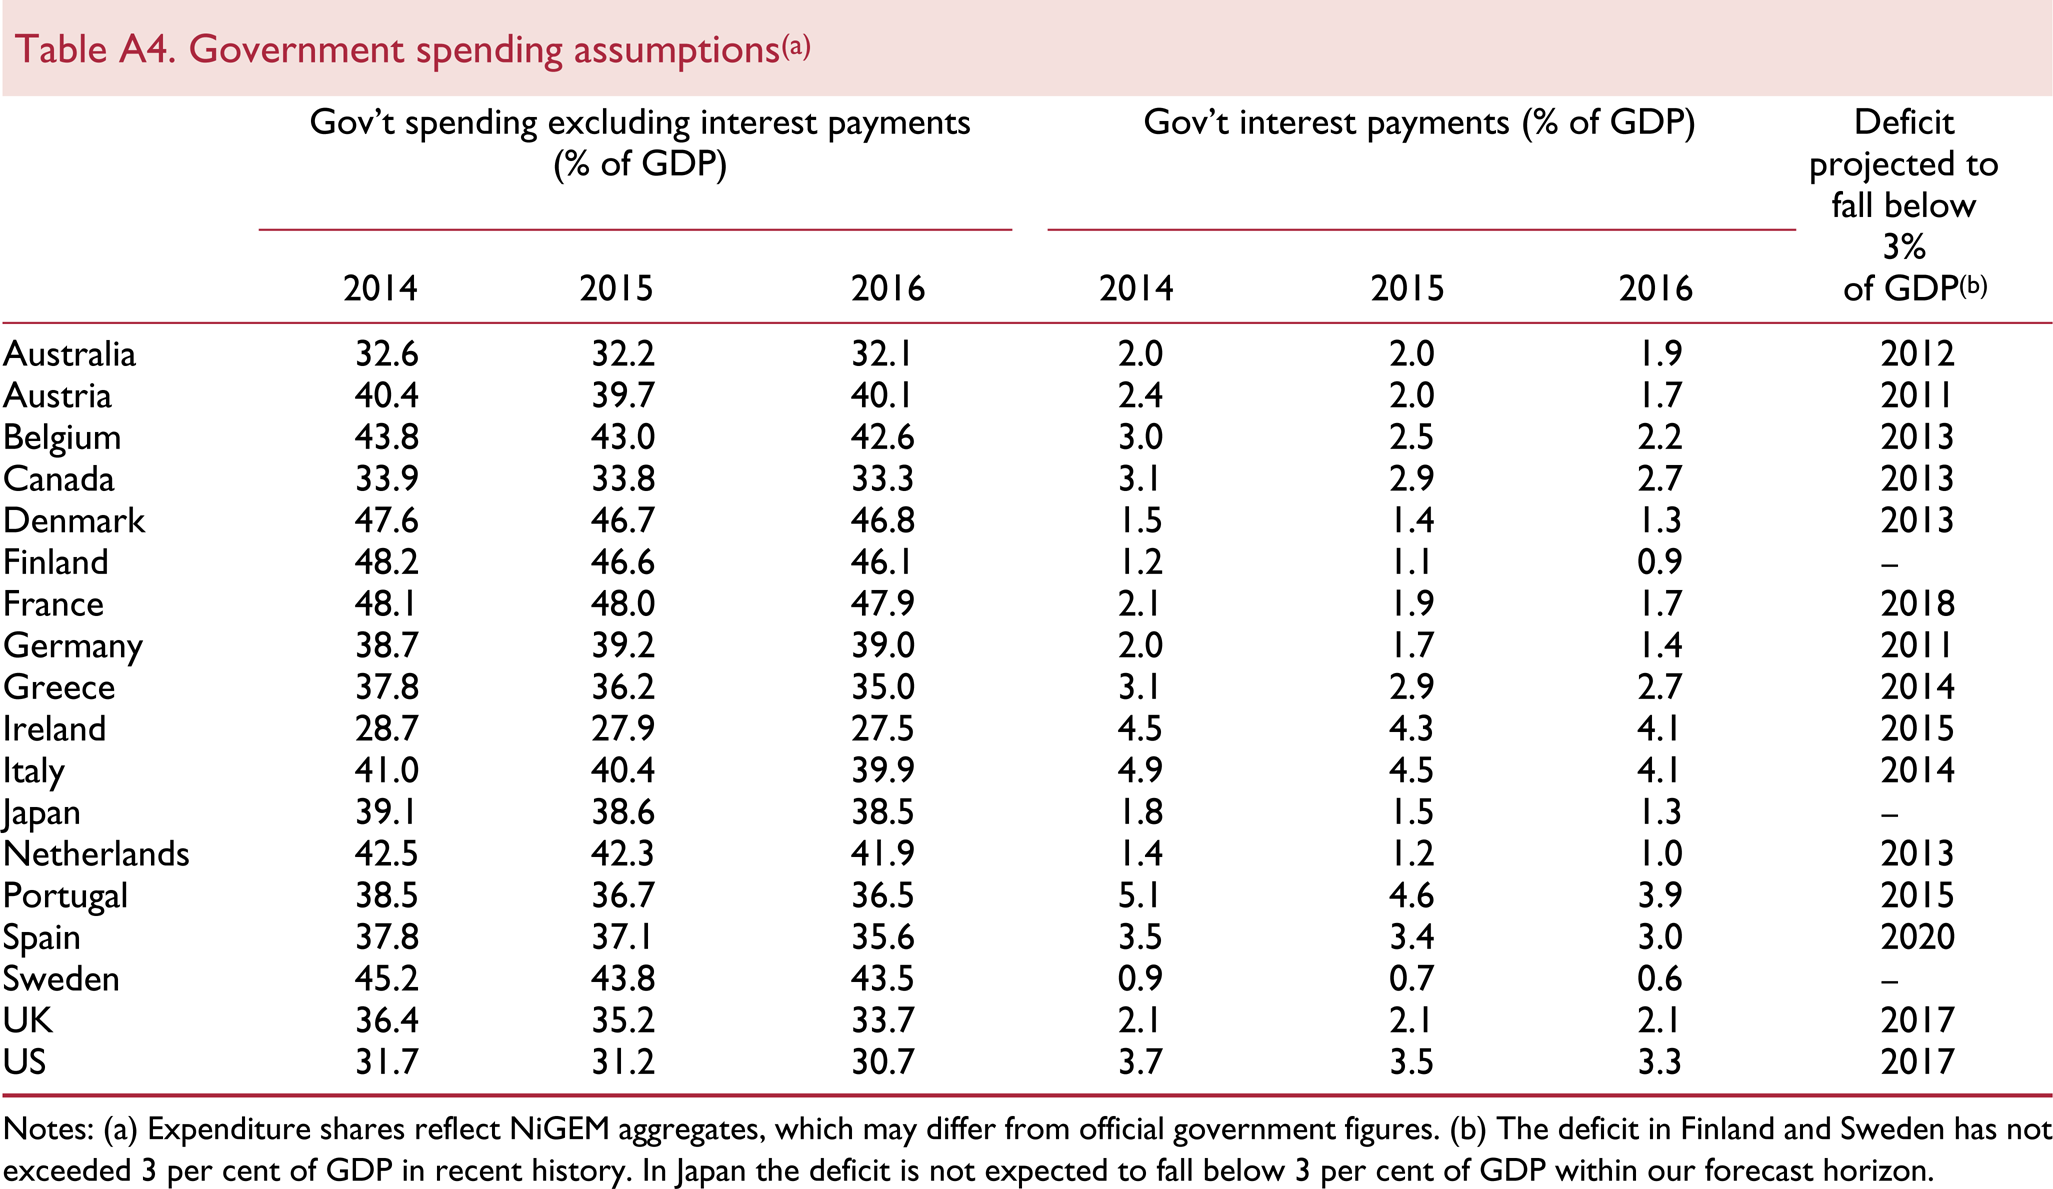
Expenditure shares reflect NiGEM aggregates, which may differ from official government figures.
The deficit in Finland and Sweden has not exceeded 3 per cent of GDP in recent history. In Japan the deficit is not expected to fall below 3 per cent of GDP within our forecast horizon.
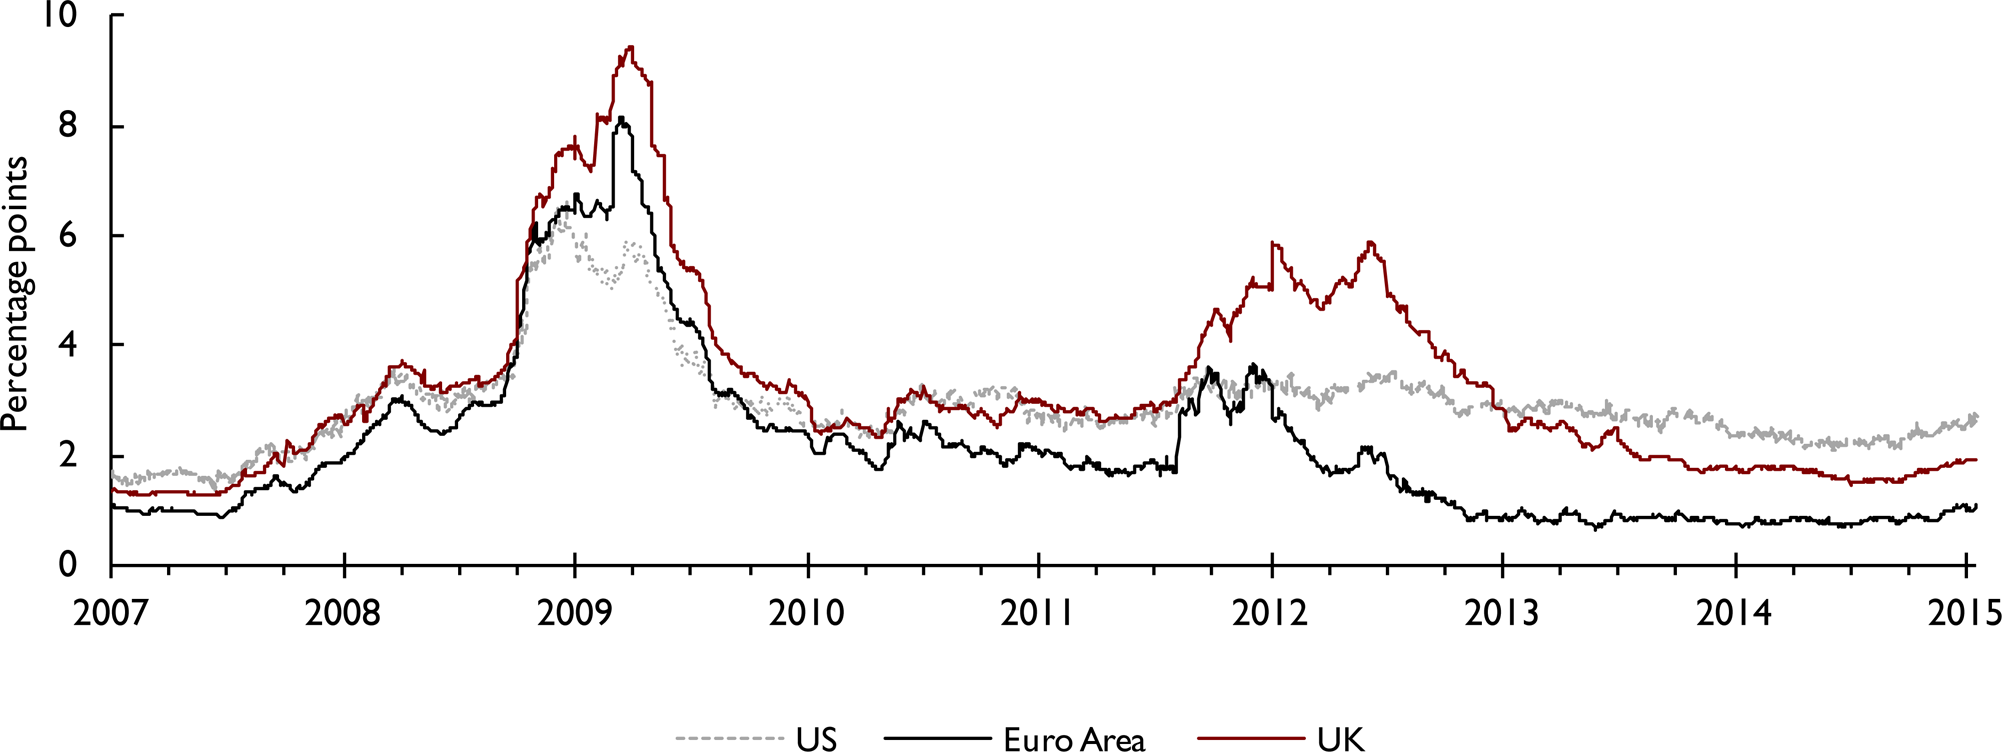
Corporate bond spreads. Spread between BAA corporate and 10-year government bond yields
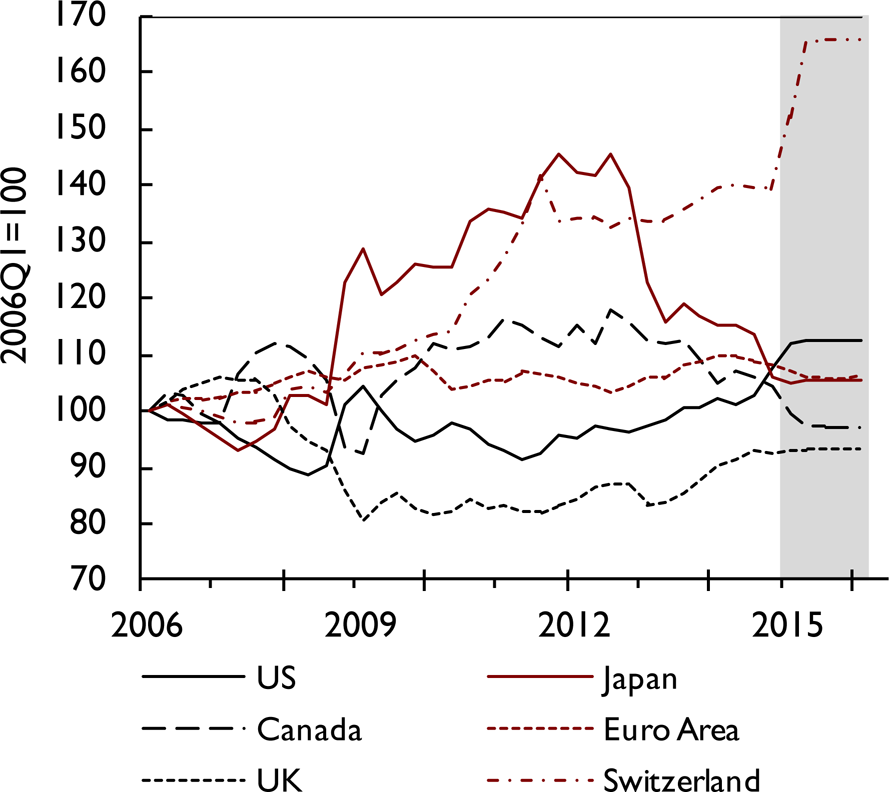
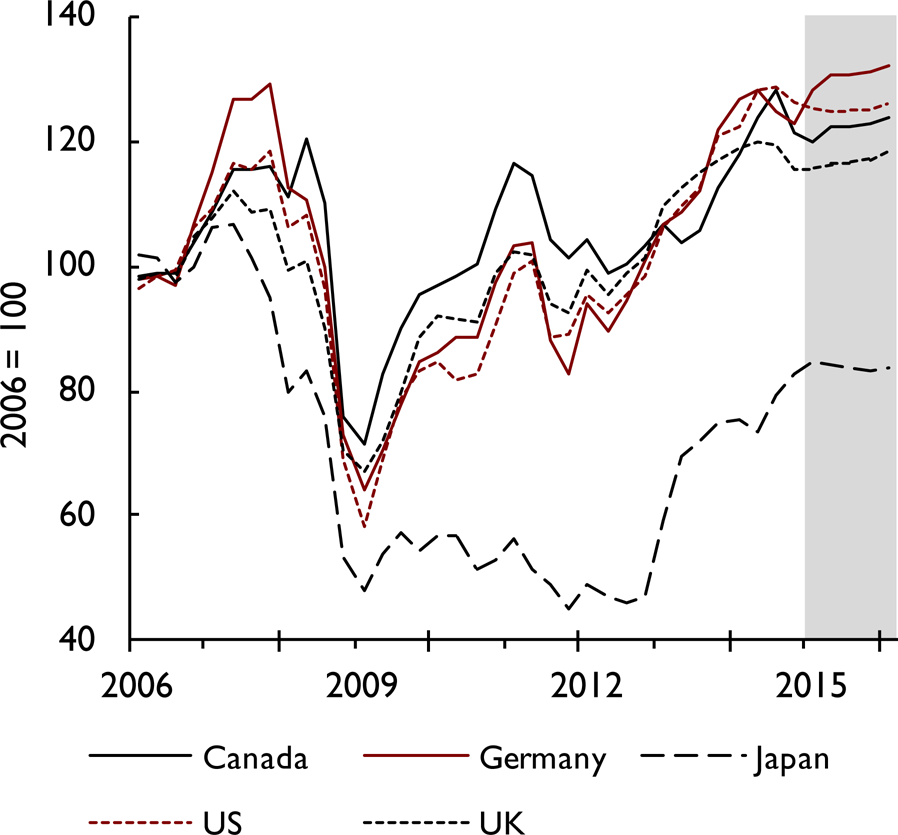
Effective exchange rates
Source: NiGEM database and NIESR forecasts. Weights based on 2010 goods and services trade shares.
Share prices
Nominal exchange rates against the US dollar are generally assumed to remain constant at the rate prevailing on 23 January 2014 until the end of September 2015. After that, they follow a backward-looking uncovered-interest parity condition, based on interest rate differentials relative to the US. We have modified this assumption for China, assuming that the exchange rate target continues to follow a gradual appreciation against the US$, of about 2½ per cent annually from end-2014 to 2016. Figure A4 plots recent history as well as our forecast of the effective exchange rate indices for Canada, the Euro Area, Japan, Switzerland, the UK and the US. Reflecting relative cyclical positions and associated expectations of monetary policy developments, the US dollar has appreciated by about 9 per cent against most other major currencies in effective terms since the end of the third quarter of 2014. The most notable exception to the US dollar's appreciation is the movement of the Swiss franc, appreciating in effective terms by about 9 per cent since the end of last year. This reflects the Swiss National Bank's removal, on 15 January, of the franc's cap against the euro, which was not anticipated by markets. Partly owing to the appreciation of the dollar and partly to the recent cut in policy rates, Canada's effective exchange rate has depreciated by about 5 per cent since the end of 2014.
Our oil price assumptions for the short term are based on those of the US Energy Information Administration (EIA), who use information from forward markets as well as an evaluation of supply conditions, and are reported in table 1 at the beginning of this chapter. Increases in oil prices due to crises in Iraq and other oil producers as well as in Ukraine were short-lived. Partly reflecting weakness in the global economy and partly due to a glut in supply, the price of oil has fallen sharply since the beginning of September 2014. We assume the price of oil remains relatively stable through to the end of 2015. Overall, oil price expectations for the end of this year have dropped by about 30 per cent, compared with expectations formed just three months ago. EIA projections show an expectation of a 31 per cent increase in oil prices, on average, in 2016. This leaves oil prices around $30 below their nominal level in mid-2014. Beyond this, oil price growth is expected to be restrained, in part, by the rise in new extraction methods for oil and gas, especially in the US (see the discussion in February 2013 National Institute Economic Review and Chojna et al., 2013).
Our equity price assumptions for the US reflect the expected return on capital. Other equity markets are assumed to move in line with the US market, but are adjusted for different exchange rate movements and shifts in country-specific equity risk premia. Figure A5 illustrates the key equity price assumptions underlying our current forecast. Global share prices performed well throughout 2013, irrespective of a short-lived drop – a reaction to the QE tapering signals emanating from the Federal Reserve in summer 2013 – and continued to increase in most countries during the first half of 2014. However, concerns about weak growth and low inflation seem to have induced a fall in share prices in many countries in the second half of 2014, with the scale of the drop varying significantly between economies. Recent developments in equity prices have been mixed, with some countries recovering somewhat from a decline experienced in the second half of 2014, while for others prices are still declining. The fall in Greece continues to be particularly sharp. Equity prices there have fallen by about 37 per cent since the beginning of 2014. Among large developed economies the most significant gains have been in Japan (by about 15 per cent), despite falls in the second quarter of 2014.
Fiscal policy assumptions for 2015 follow announced policies as of 1 January 2014. Average personal sector tax rates and effective corporate tax rate assumptions underlying the projections are reported in table A3, while table A4 lists assumptions for government spending, which is expected to decline as a share of GDP between 2014 and 2015 in the majority of Euro Area countries reported in the table. Recent policy announcements in Portugal, Spain, Italy and elsewhere, as well as the election of the anti-austerity government in Greece, suggest that the commitment to fiscal austerity in Europe may be waning. A policy loosening relative to our current assumptions poses an upside risk to the short-term outlook in Europe. For a discussion of fiscal multipliers and the impact of fiscal policy on the macroeconomy based on NiGEM simulations, see Barrell, Holland and Hurst (2013).
Footnotes
1
With the exception of Chile, Iceland and Israel.
2
Interest rate assumptions are based on information available for the period to 23 January 2015 and do not include the 200 basis point cut by the Central Bank of Russia on 30 January 2015, or the 25 basis point reduction by the Reserve Bank of Australia, on 3 February 2015, which we assumed would happen in the second quarter of this year.
3
Yields on 10-year Greek bonds rose back to above 10 per cent on several occasions during January 2015. At the time of writing they remain close to 9 per cent.