
Abstract

Real GDP growth and inflation
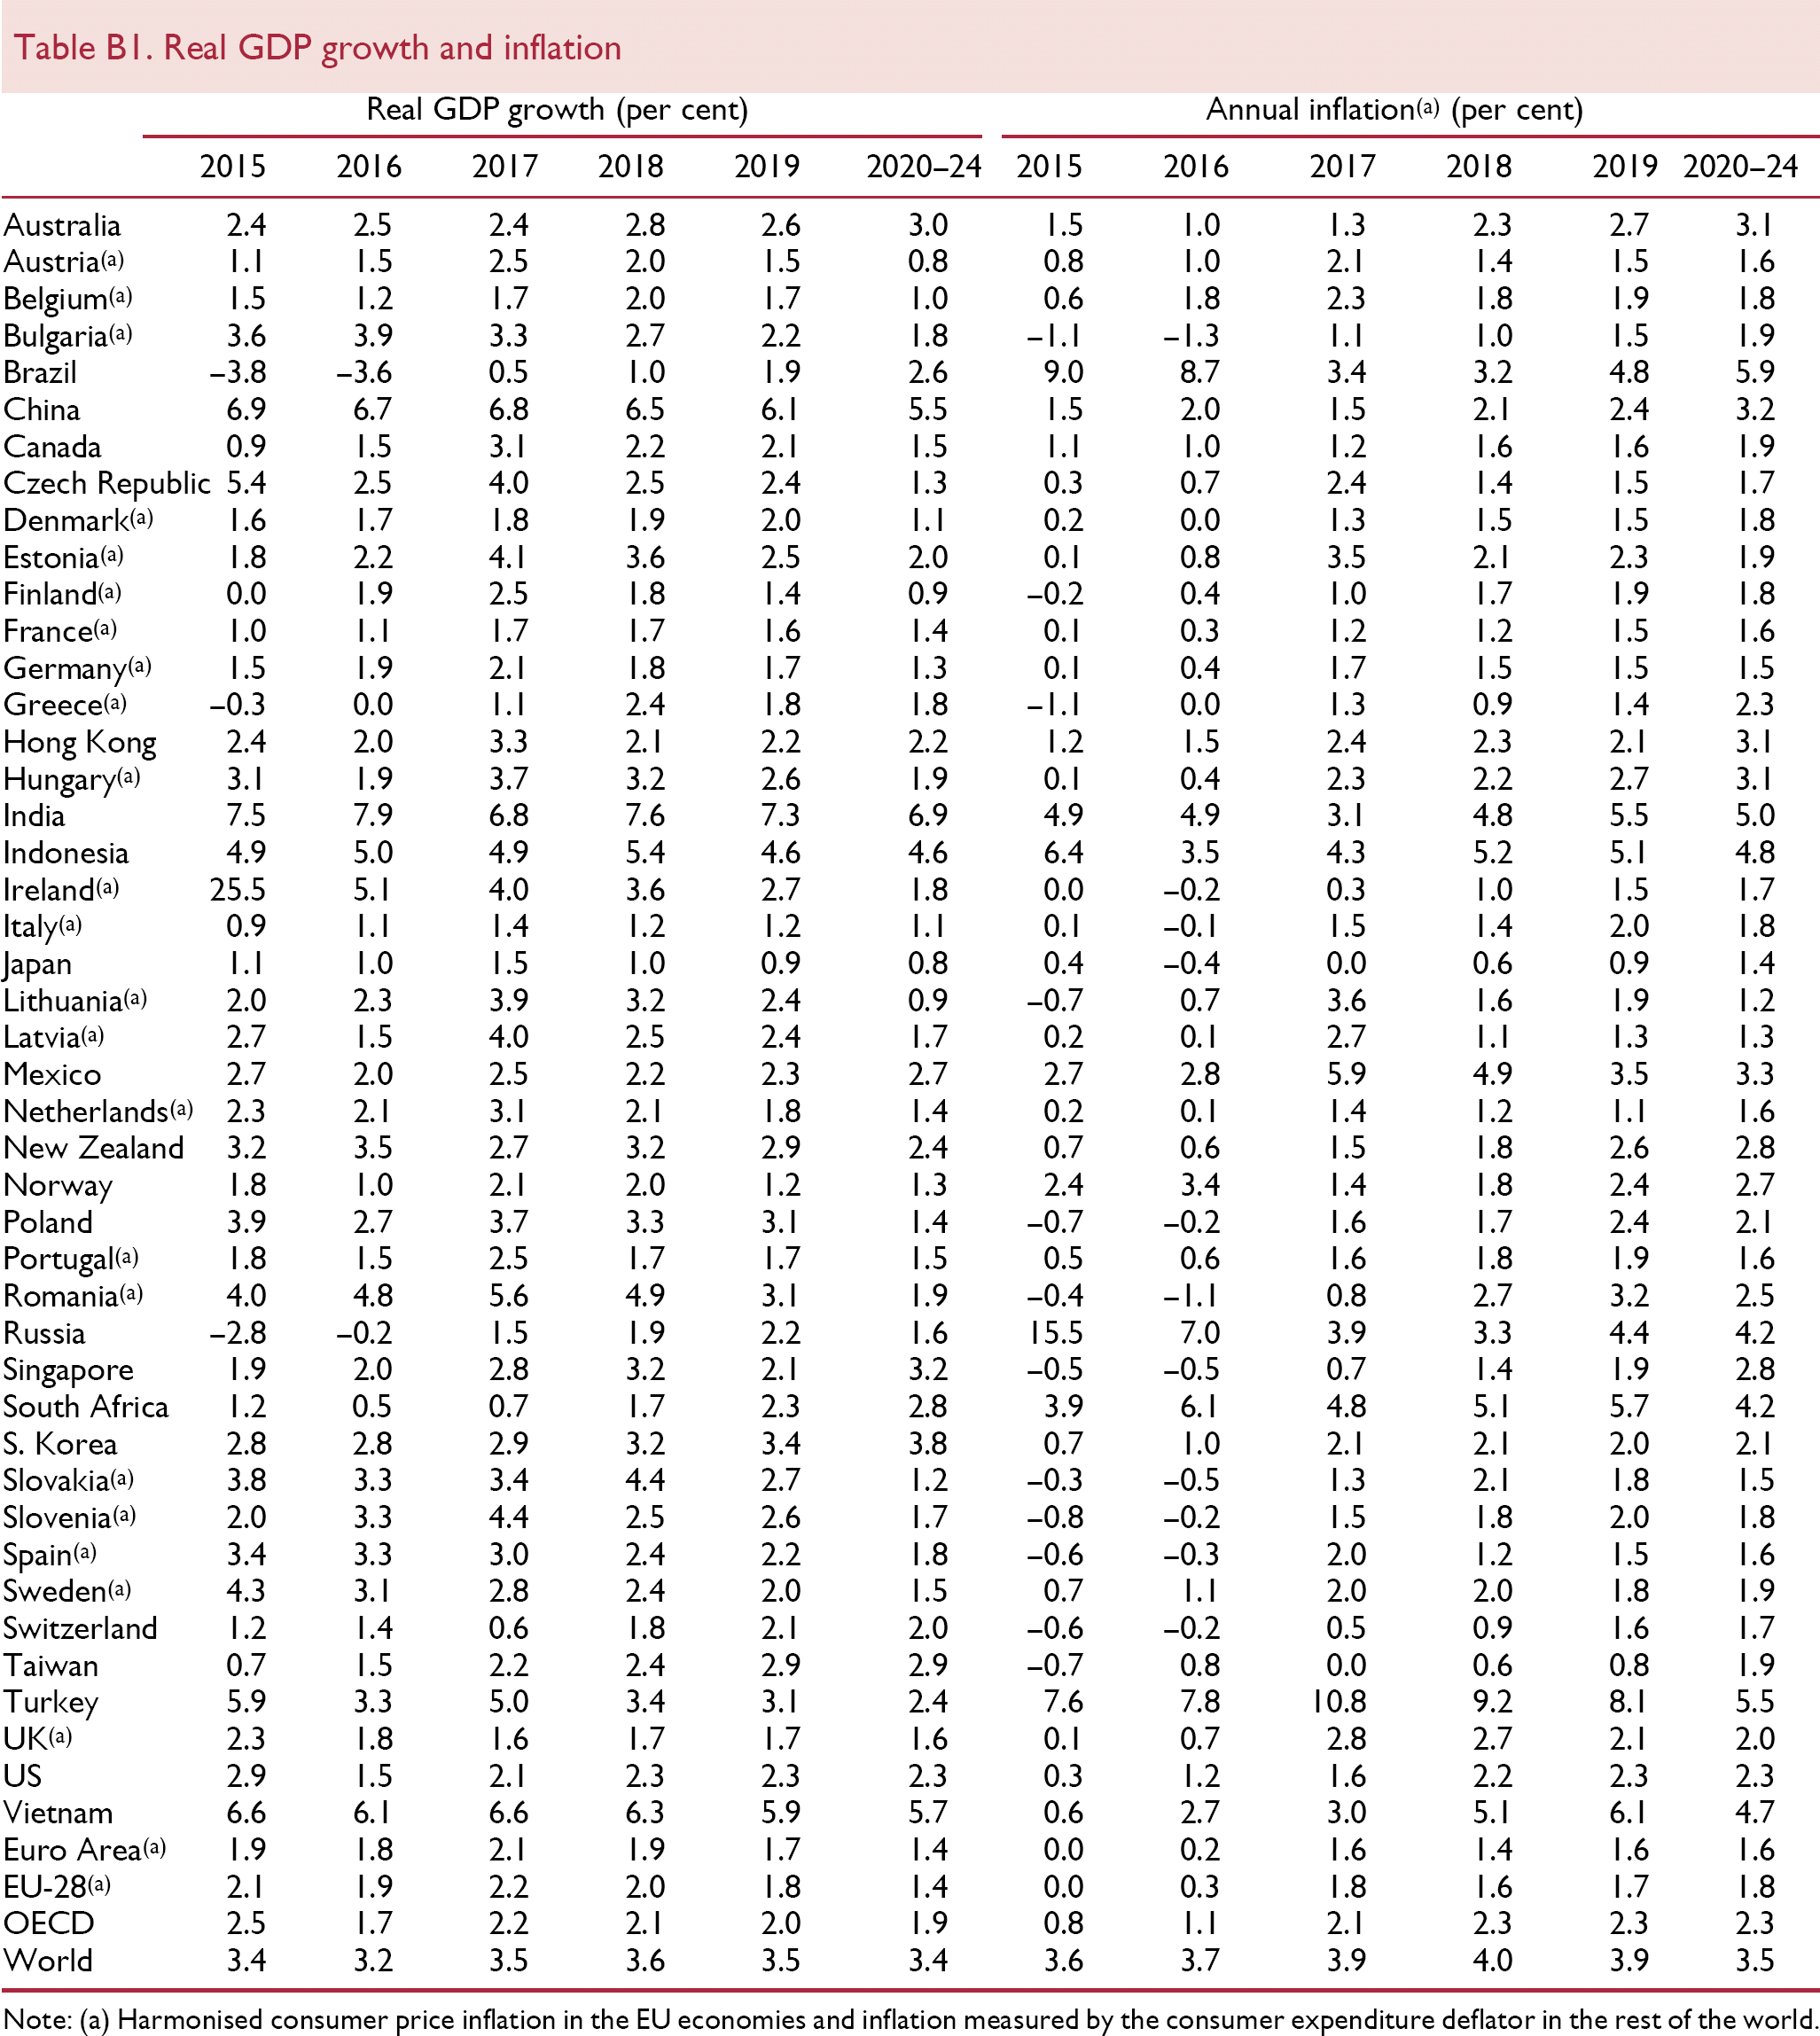
| Real GDP growth (per cent) | Annual inflation(a) (per cent) | |||||||||||
|---|---|---|---|---|---|---|---|---|---|---|---|---|
| 2015 | 2016 | 2017 | 2018 | 2019 | 2020–24 | 2015 | 2016 | 2017 | 2018 | 209 | 2020–24 | |
| Australia | 2.4 | 2.5 | 2.4 | 2.8 | 2.6 | 3.0 | 1.5 | 1.0 | 1.3 | 2.3 | 2.7 | 3.1 |
| Austria(a) | 1.1 | 1.5 | 2.5 | 2.0 | 1.5 | 0.8 | 0.8 | 1.0 | 2.1 | 1.4 | 1.5 | 1.6 |
| Belgium(a) | 1.5 | 1.2 | 1.7 | 2.0 | 1.7 | 1.0 | 0.6 | 1.8 | 2.3 | 1.8 | 1.9 | 1.8 |
| Bulgaria(a) | 3.6 | 3.9 | 3.3 | 2.7 | 2.2 | 1.8 | –1.1 | –1.3 | 1.1 | 1.0 | 1.5 | 1.9 |
| Brazil | –3.8 | –3.6 | 0.5 | 1.0 | 1.9 | 2.6 | 9.0 | 8.7 | 3.4 | 3.2 | 4.8 | 5.9 |
| China | 6.9 | 6.7 | 6.8 | 6.5 | 6.1 | 5.5 | 1.5 | 2.0 | 1.5 | 2.1 | 2.4 | 3.2 |
| Canada | 0.9 | 1.5 | 3.1 | 2.2 | 2.1 | 1.5 | 1.1 | 1.0 | 1.2 | 1.6 | 1.6 | 1.9 |
| Czech Republic | 5.4 | 2.5 | 4.0 | 2.5 | 2.4 | 1.3 | 0.3 | 0.7 | 2.4 | 1.4 | 1.5 | 1.7 |
| Denmark(a) | 1.6 | 1.7 | 1.8 | 1.9 | 2.0 | 1.1 | 0.2 | 0.0 | 1.3 | 1.5 | 1.5 | 1.8 |
| Estonia(a) | 1.8 | 2.2 | 4.1 | 3.6 | 2.5 | 2.0 | 0.1 | 0.8 | 3.5 | 2.1 | 2.3 | 1.9 |
| Finland(a) | 0.0 | 1.9 | 2.5 | 1.8 | 1.4 | 0.9 | –0.2 | 0.4 | 1.0 | 1.7 | 1.9 | 1.8 |
| France(a) | 1.0 | 1.1 | 1.7 | 1.7 | 1.6 | 1.4 | 0.1 | 0.3 | 1.2 | 1.2 | 1.5 | 1.6 |
| Germany(a) | 1.5 | 1.9 | 2.1 | 1.8 | 1.7 | 1.3 | 0.1 | 0.4 | 1.7 | 1.5 | 1.5 | 1.5 |
| Greece(a) | –0.3 | 0.0 | 1.1 | 2.4 | 1.8 | 1.8 | –1.1 | 0.0 | 1.3 | 0.9 | 1.4 | 2.3 |
| Hong Kong | 2.4 | 2.0 | 3.3 | 2.1 | 2.2 | 2.2 | 1.2 | 1.5 | 2.4 | 2.3 | 2.1 | 3.1 |
| Hungary(a) | 3.1 | 1.9 | 3.7 | 3.2 | 2.6 | 1.9 | 0.1 | 0.4 | 2.3 | 2.2 | 2.7 | 3.1 |
| India | 7.5 | 7.9 | 6.8 | 7.6 | 7.3 | 6.9 | 4.9 | 4.9 | 3.1 | 4.8 | 5.5 | 5.0 |
| Indonesia | 4.9 | 5.0 | 4.9 | 5.4 | 4.6 | 4.6 | 6.4 | 3.5 | 4.3 | 5.2 | 5.1 | 4.8 |
| Ireland(a) | 25.5 | 5.1 | 4.0 | 3.6 | 2.7 | 1.8 | 0.0 | –0.2 | 0.3 | 1.0 | 1.5 | 1.7 |
| Italy(a) | 0.9 | 1.1 | 1.4 | 1.2 | 1.2 | 1.1 | 0.1 | –0.1 | 1.5 | 1.4 | 2.0 | 1.8 |
| Japan | 1.1 | 1.0 | 1.5 | 1.0 | 0.9 | 0.8 | 0.4 | –0.4 | 0.0 | 0.6 | 0.9 | 1.4 |
| Lithuania(a) | 2.0 | 2.3 | 3.9 | 3.2 | 2.4 | 0.9 | –0.7 | 0.7 | 3.6 | 1.6 | 1.9 | 1.2 |
| Latvia(a) | 2.7 | 1.5 | 4.0 | 2.5 | 2.4 | 1.7 | 0.2 | 0.1 | 2.7 | 1.1 | 1.3 | 1.3 |
| Mexico | 2.7 | 2.0 | 2.5 | 2.2 | 2.3 | 2.7 | 2.7 | 2.8 | 5.9 | 4.9 | 3.5 | 3.3 |
| Netherlands(a) | 2.3 | 2.1 | 3.1 | 2.1 | 1.8 | 1.4 | 0.2 | 0.1 | 1.4 | 1.2 | 1.1 | 1.6 |
| New Zealand | 3.2 | 3.5 | 2.7 | 3.2 | 2.9 | 2.4 | 0.7 | 0.6 | 1.5 | 1.8 | 2.6 | 2.8 |
| Norway | 1.8 | 1.0 | 2.1 | 2.0 | 1.2 | 1.3 | 2.4 | 3.4 | 1.4 | 1.8 | 2.4 | 2.7 |
| Poland | 3.9 | 2.7 | 3.7 | 3.3 | 3.1 | 1.4 | –0.7 | –0.2 | 1.6 | 1.7 | 2.4 | 2.1 |
| Portugal(a) | 1.8 | 1.5 | 2.5 | 1.7 | 1.7 | 1.5 | 0.5 | 0.6 | 1.6 | 1.8 | 1.9 | 1.6 |
| Romania(a) | 4.0 | 4.8 | 5.6 | 4.9 | 3.1 | 1.9 | –0.4 | –1.1 | 0.8 | 2.7 | 3.2 | 2.5 |
| Russia | –2.8 | –0.2 | 1.5 | 1.9 | 2.2 | 1.6 | 15.5 | 7.0 | 3.9 | 3.3 | 4.4 | 4.2 |
| Singapore | 1.9 | 2.0 | 2.8 | 3.2 | 2.1 | 3.2 | –0.5 | –0.5 | 0.7 | 1.4 | 1.9 | 2.8 |
| South Africa | 1.2 | 0.5 | 0.7 | 1.7 | 2.3 | 2.8 | 3.9 | 6.1 | 4.8 | 5.1 | 5.7 | 4.2 |
| S. Korea | 2.8 | 2.8 | 2.9 | 3.2 | 3.4 | 3.8 | 0.7 | 1.0 | 2.1 | 2.1 | 2.0 | 2.1 |
| Slovakia(a) | 3.8 | 3.3 | 3.4 | 4.4 | 2.7 | 1.2 | –0.3 | –0.5 | 1.3 | 2.1 | 1.8 | 1.5 |
| Slovenia(a) | 2.0 | 3.3 | 4.4 | 2.5 | 2.6 | 1.7 | –0.8 | –0.2 | 1.5 | 1.8 | 2.0 | 1.8 |
| Spain(a) | 3.4 | 3.3 | 3.0 | 2.4 | 2.2 | 1.8 | –0.6 | –0.3 | 2.0 | 1.2 | 1.5 | 1.6 |
| Sweden(a) | 4.3 | 3.1 | 2.8 | 2.4 | 2.0 | 1.5 | 0.7 | 1.1 | 2.0 | 2.0 | 1.8 | 1.9 |
| Switzerland | 1.2 | 1.4 | 0.6 | 1.8 | 2.1 | 2.0 | –0.6 | –0.2 | 0.5 | 0.9 | 1.6 | 1.7 |
| Taiwan | 0.7 | 1.5 | 2.2 | 2.4 | 2.9 | 2.9 | –0.7 | 0.8 | 0.0 | 0.6 | 0.8 | 1.9 |
| Turkey | 5.9 | 3.3 | 5.0 | 3.4 | 3.1 | 2.4 | 7.6 | 7.8 | 10.8 | 9.2 | 8.1 | 5.5 |
| UK(a) | 2.3 | 1.8 | 1.6 | 1.7 | 1.7 | 1.6 | 0.1 | 0.7 | 2.8 | 2.7 | 2.1 | 2.0 |
| US | 2.9 | 1.5 | 2.1 | 2.3 | 2.3 | 2.3 | 0.3 | 1.2 | 1.6 | 2.2 | 2.3 | 2.3 |
| Vietnam | 6.6 | 6.1 | 6.6 | 6.3 | 5.9 | 5.7 | 0.6 | 2.7 | 3.0 | 5.1 | 6.1 | 4.7 |
| Euro Area(a) | 1.9 | 1.8 | 2.1 | 1.9 | 1.7 | 1.4 | 0.0 | 0.2 | 1.6 | 1.4 | 1.6 | 1.6 |
| EU-28(a) | 2.1 | 1.9 | 2.2 | 2.0 | 1.8 | 1.4 | 0.0 | 0.3 | 1.8 | 1.6 | 1.7 | 1.8 |
| OECD | 2.5 | 1.7 | 2.2 | 2.1 | 2.0 | 1.9 | 0.8 | 1.1 | 2.1 | 2.3 | 2.3 | 2.3 |
| World | 3.4 | 3.2 | 3.5 | 3.6 | 3.5 | 3.4 | 3.6 | 3.7 | 3.9 | 4.0 | 3.9 | 3.5 |
Note: (a) Harmonised consumer price inflation in the EU economies and inflation measured by the consumer expenditure deflator in the rest of the world.
Fiscal balance and government debt
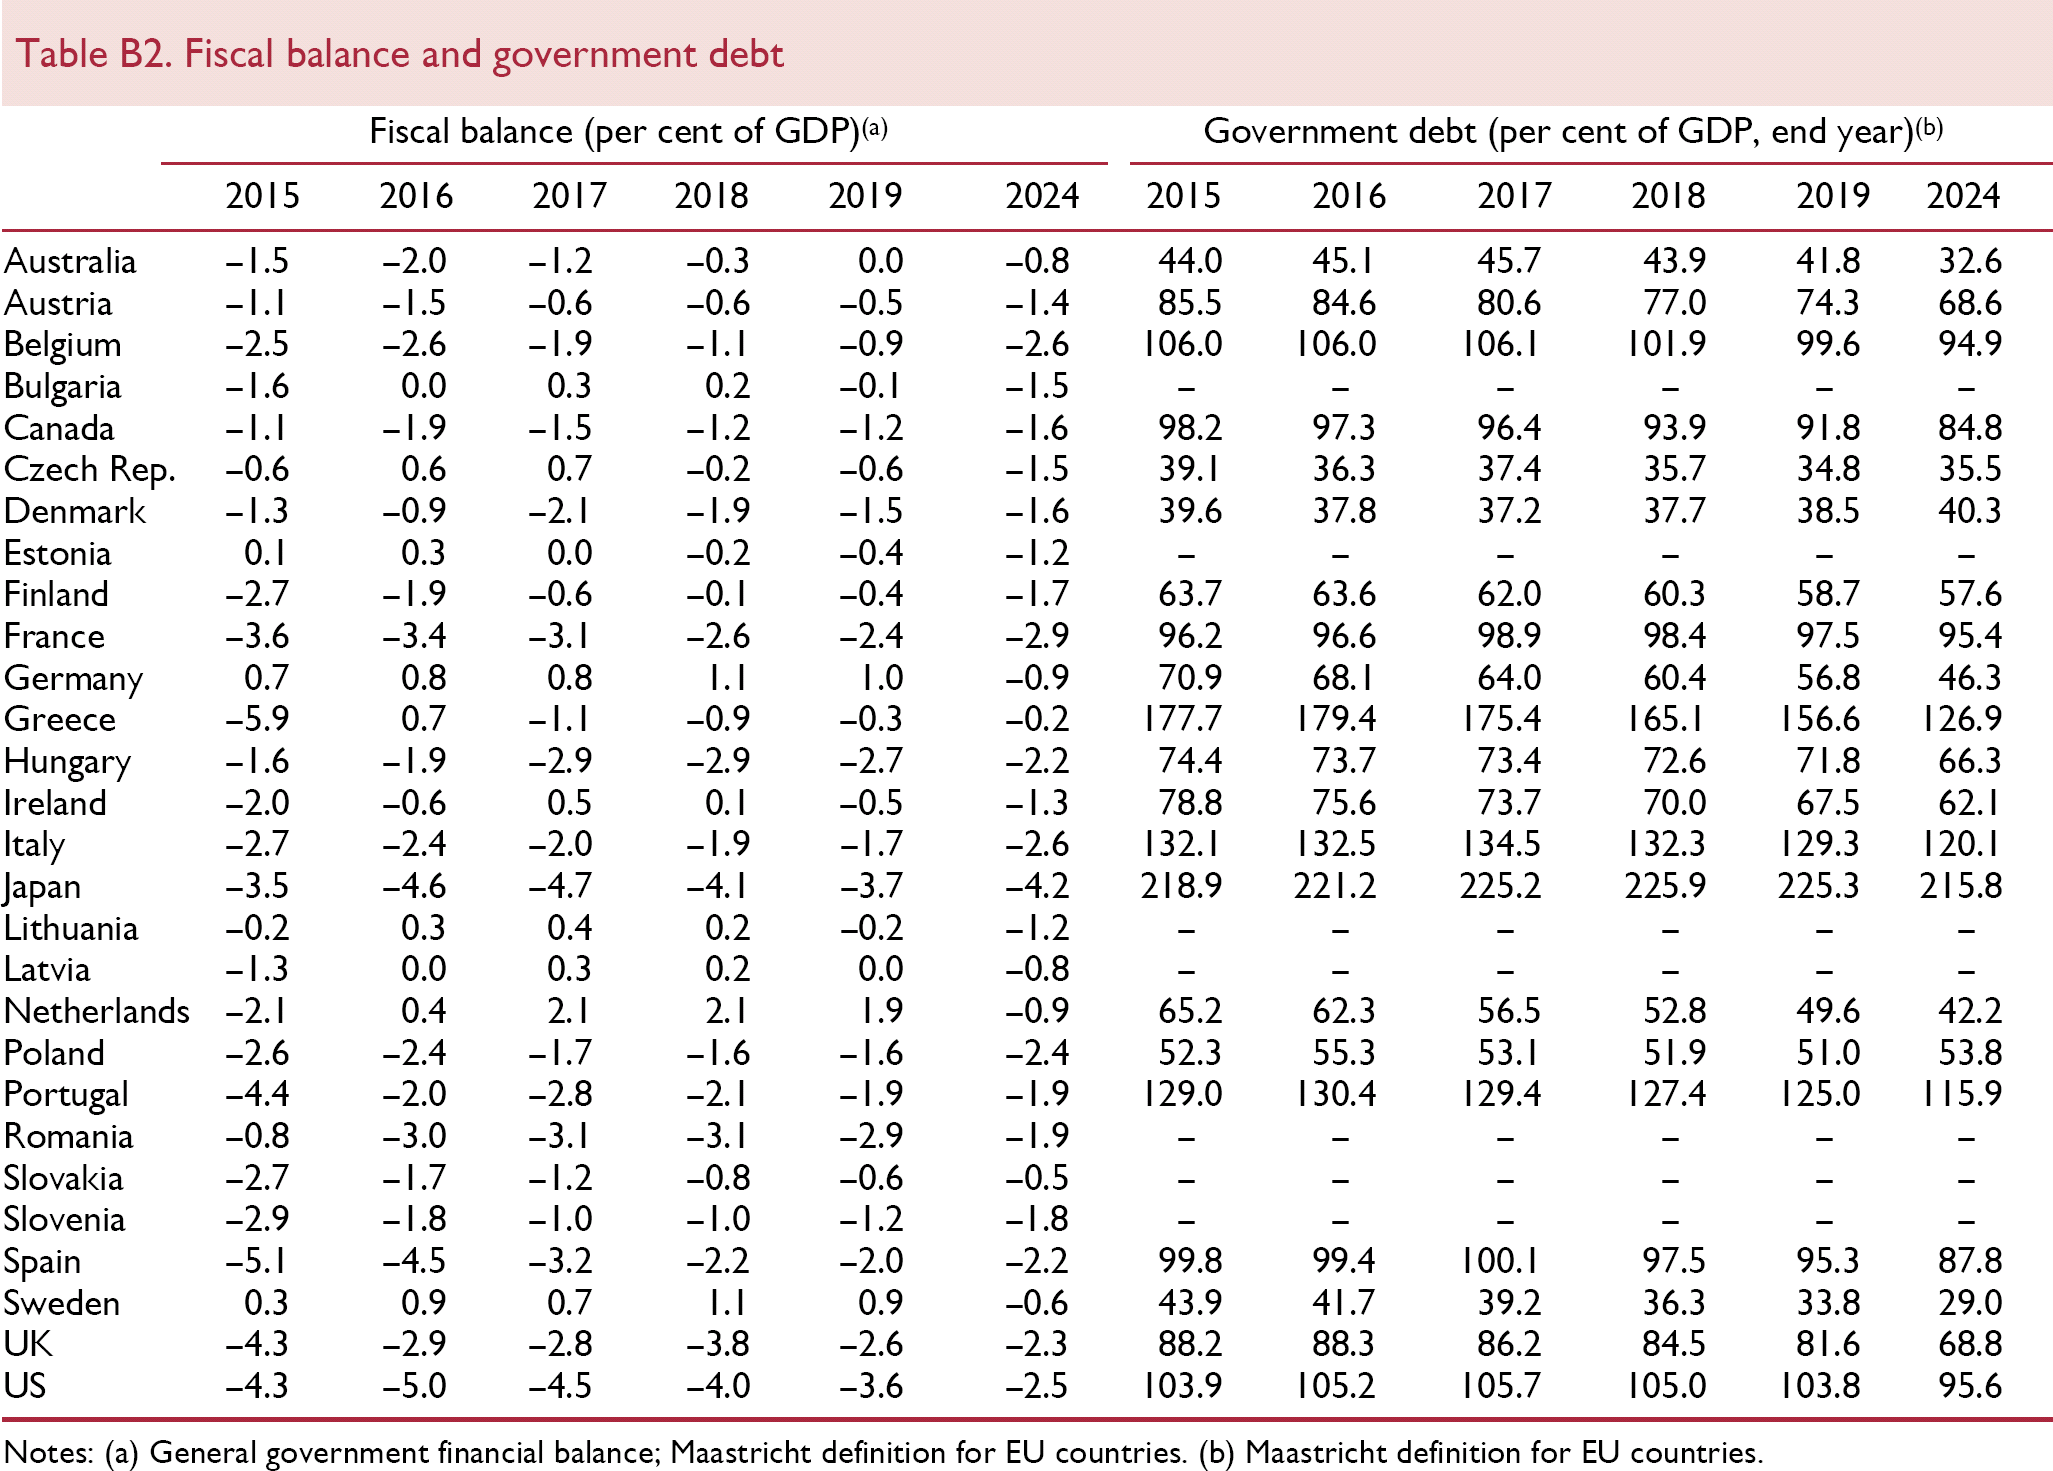
| Fiscal balance (per cent of GDP)(a) | Government debt (per cent of GDP, end year)(b) | |||||||||||
|---|---|---|---|---|---|---|---|---|---|---|---|---|
| 2015 | 2016 | 2017 | 2018 | 2019 | 2024 | 2015 | 2016 | 2017 | 2018 | 2019 | 2024 | |
| Australia | –1.5 | –2.0 | –1.2 | –0.3 | 0.0 | –0.8 | 44.0 | 45.1 | 45.7 | 43.9 | 41.8 | 32.6 |
| Austria | –1.1 | –1.5 | –0.6 | –0.6 | –0.5 | –1.4 | 85.5 | 84.6 | 80.6 | 77.0 | 74.3 | 68.6 |
| Belgium | –2.5 | –2.6 | –1.9 | –1.1 | –0.9 | –2.6 | 106.0 | 106.0 | 106.1 | 101.9 | 99.6 | 94.9 |
| Bulgaria | –1.6 | 0.0 | 0.3 | 0.2 | –0.1 | –1.5 | – | – | – | – | – | – |
| Canada | –1.1 | –1.9 | –1.5 | –1.2 | –1.2 | –1.6 | 98.2 | 97.3 | 96.4 | 93.9 | 91.8 | 84.8 |
| Czech Rep. | –0.6 | 0.6 | 0.7 | –0.2 | –0.6 | –1.5 | 39.1 | 36.3 | 37.4 | 35.7 | 34.8 | 35.5 |
| Denmark | –1.3 | –0.9 | –2.1 | –1.9 | –1.5 | –1.6 | 39.6 | 37.8 | 37.2 | 37.7 | 38.5 | 40.3 |
| Estonia | 0.1 | 0.3 | 0.0 | –0.2 | –0.4 | –1.2 | – | – | – | – | – | – |
| Finland | –2.7 | –1.9 | –0.6 | –0.1 | –0.4 | –1.7 | 63.7 | 63.6 | 62.0 | 60.3 | 58.7 | 57.6 |
| France | –3.6 | –3.4 | –3.1 | –2.6 | –2.4 | –2.9 | 96.2 | 96.6 | 98.9 | 98.4 | 97.5 | 95.4 |
| Germany | 0.7 | 0.8 | 0.8 | 1.1 | 1.0 | –0.9 | 70.9 | 68.1 | 64.0 | 60.4 | 56.8 | 46.3 |
| Greece | –5.9 | 0.7 | –1.1 | –0.9 | –0.3 | –0.2 | 177.7 | 179.4 | 175.4 | 165.1 | 156.6 | 126.9 |
| Hungary | –1.6 | –1.9 | –2.9 | –2.9 | –2.7 | –2.2 | 74.4 | 73.7 | 73.4 | 72.6 | 71.8 | 66.3 |
| Ireland | –2.0 | –0.6 | 0.5 | 0.1 | –0.5 | –1.3 | 78.8 | 75.6 | 73.7 | 70.0 | 67.5 | 62.1 |
| Italy | –2.7 | –2.4 | –2.0 | –1.9 | –1.7 | –2.6 | 132.1 | 132.5 | 134.5 | 132.3 | 129.3 | 120.1 |
| Japan | –3.5 | –4.6 | –4.7 | –4.1 | –3.7 | –4.2 | 218.9 | 221.2 | 225.2 | 225.9 | 225.3 | 215.8 |
| Lithuania | –0.2 | 0.3 | 0.4 | 0.2 | –0.2 | –1.2 | – | – | – | – | – | – |
| Latvia | –1.3 | 0.0 | 0.3 | 0.2 | 0.0 | –0.8 | – | – | – | – | – | – |
| Netherlands | –2.1 | 0.4 | 2.1 | 2.1 | 1.9 | –0.9 | 65.2 | 62.3 | 56.5 | 52.8 | 49.6 | 42.2 |
| Poland | –2.6 | –2.4 | –1.7 | –1.6 | –1.6 | –2.4 | 52.3 | 55.3 | 53.1 | 51.9 | 51.0 | 53.8 |
| Portugal | –4.4 | –2.0 | –2.8 | –2.1 | –1.9 | –1.9 | 129.0 | 130.4 | 129.4 | 127.4 | 125.0 | 115.9 |
| Romania | –0.8 | –3.0 | –3.1 | –3.1 | –2.9 | –1.9 | – | – | – | – | – | – |
| Slovakia | –2.7 | –1.7 | –1.2 | –0.8 | –0.6 | –0.5 | – | – | – | – | – | – |
| Slovenia | –2.9 | –1.8 | –1.0 | –1.0 | –1.2 | –1.8 | – | – | – | – | – | – |
| Spain | –5.1 | –4.5 | –3.2 | –2.2 | –2.0 | –2.2 | 99.8 | 99.4 | 100.1 | 97.5 | 95.3 | 87.8 |
| Sweden | 0.3 | 0.9 | 0.7 | 1.1 | 0.9 | –0.6 | 43.9 | 41.7 | 39.2 | 36.3 | 33.8 | 29.0 |
| UK | –4.3 | –2.9 | –2.8 | –3.8 | –2.6 | –2.3 | 88.2 | 88.3 | 86.2 | 84.5 | 81.6 | 68.8 |
| US | –4.3 | –5.0 | –4.5 | –4.0 | –3.6 | –2.5 | 103.9 | 105.2 | 105.7 | 105.0 | 103.8 | 95.6 |
Notes: (a) General government financial balance; Maastricht definition for EU countries.
Maastricht definition for EU countries.
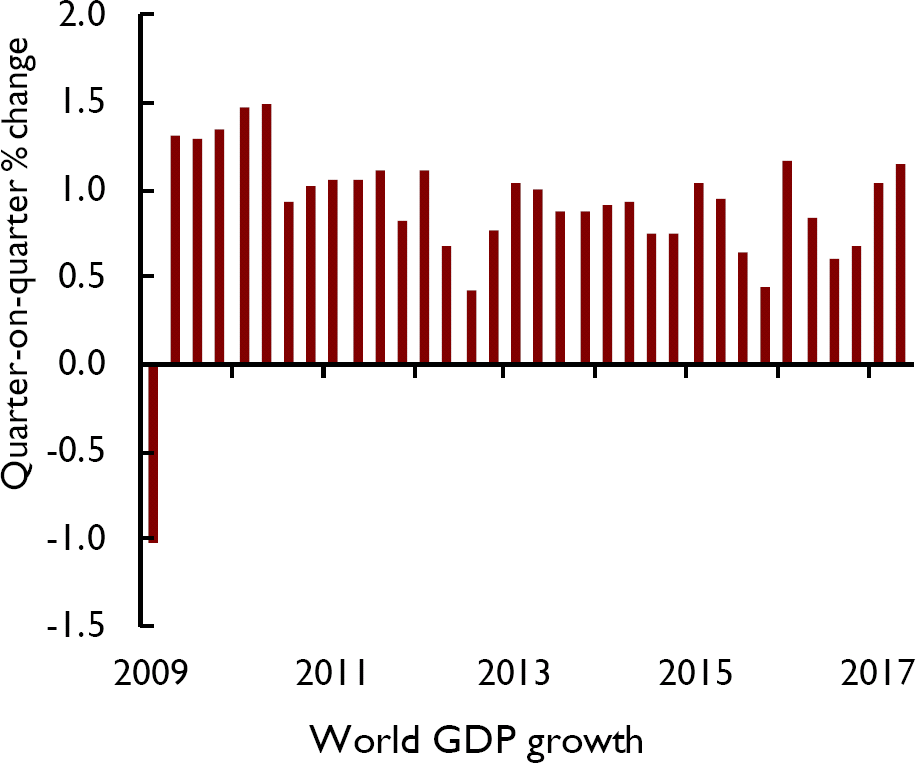
World GDP is estimated to have expanded by 1.2 per cent in the second quarter of 2017
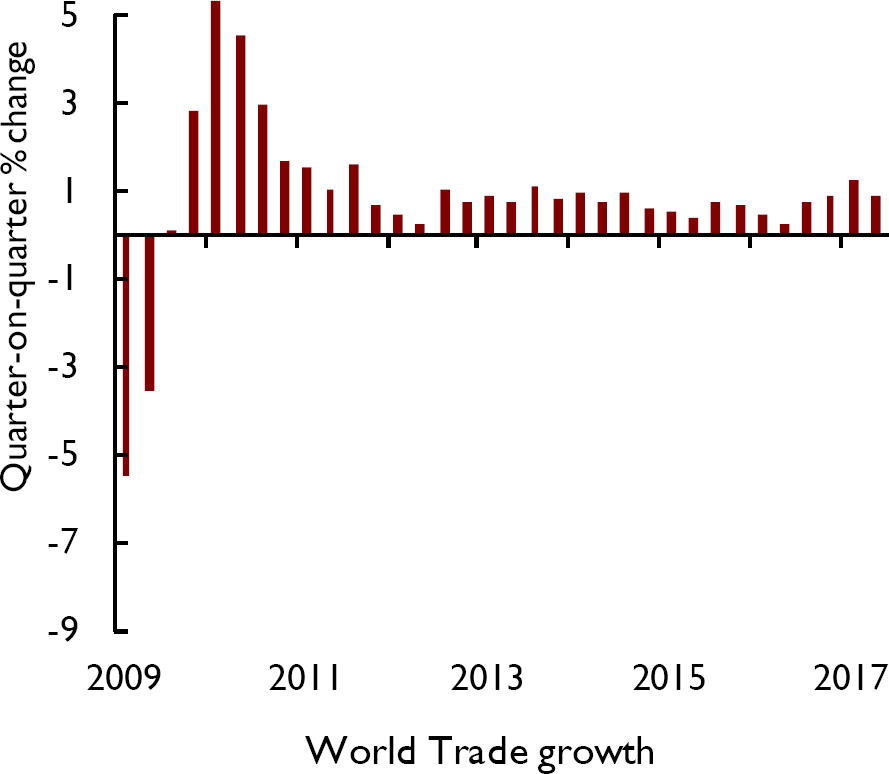
NIESR estimates that world trade grew by 0.9 per cent in 2017Q2
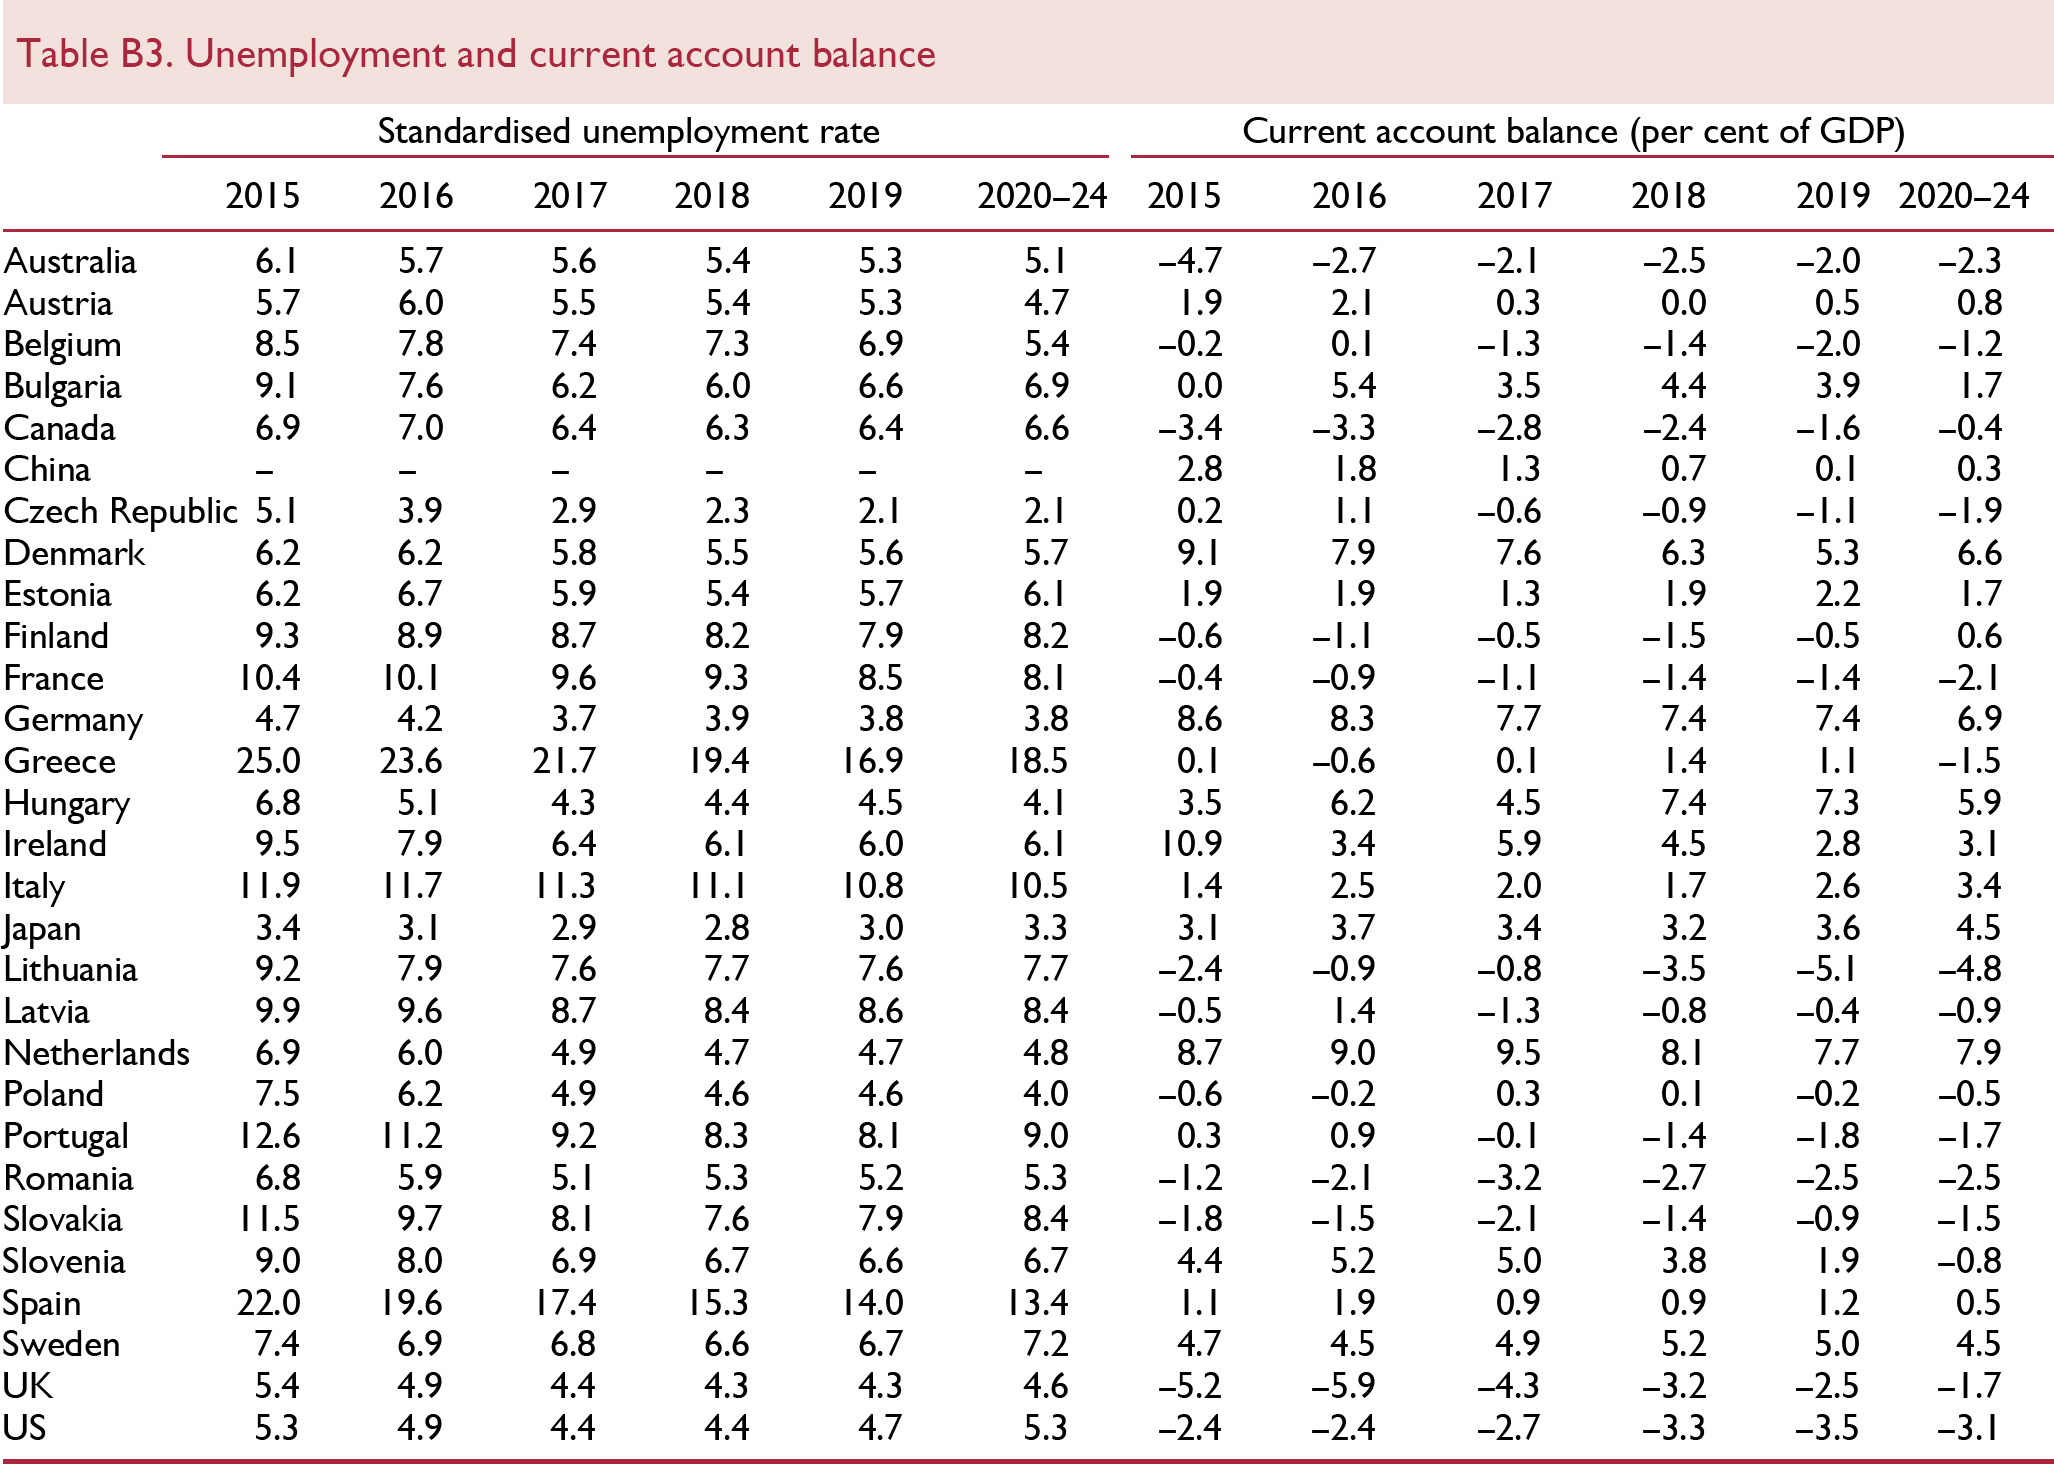
Unemployment and current account balance
| Standardised unemployment rate | Current account balance (per cent of GDP) | |||||||||||
|---|---|---|---|---|---|---|---|---|---|---|---|---|
| 2015 | 2016 | 2017 | 2018 | 2019 | 2020–24 | 2015 | 2016 | 2017 | 2018 | 2019 | 2020–24 | |
| Australia | 6.1 | 5.7 | 5.6 | 5.4 | 5.3 | 5.1 | –4.7 | –2.7 | –2.1 | –2.5 | –2.0 | –2.3 |
| Austria | 5.7 | 6.0 | 5.5 | 5.4 | 5.3 | 4.7 | 1.9 | 2.1 | 0.3 | 0.0 | 0.5 | 0.8 |
| Belgium | 8.5 | 7.8 | 7.4 | 7.3 | 6.9 | 5.4 | –0.2 | 0.1 | –1.3 | –1.4 | –2.0 | –1.2 |
| Bulgaria | 9.1 | 7.6 | 6.2 | 6.0 | 6.6 | 6.9 | 0.0 | 5.4 | 3.5 | 4.4 | 3.9 | 1.7 |
| Canada | 6.9 | 7.0 | 6.4 | 6.3 | 6.4 | 6.6 | –3.4 | –3.3 | –2.8 | –2.4 | –1.6 | –0.4 |
| China | – | – | – | – | – | – | 2.8 | 1.8 | 1.3 | 0.7 | 0.1 | 0.3 |
| Czech Republic | 5.1 | 3.9 | 2.9 | 2.3 | 2.1 | 2.1 | 0.2 | 1.1 | –0.6 | –0.9 | –1.1 | –1.9 |
| Denmark | 6.2 | 6.2 | 5.8 | 5.5 | 5.6 | 5.7 | 9.1 | 7.9 | 7.6 | 6.3 | 5.3 | 6.6 |
| Estonia | 6.2 | 6.7 | 5.9 | 5.4 | 5.7 | 6.1 | 1.9 | 1.9 | 1.3 | 1.9 | 2.2 | 1.7 |
| Finland | 9.3 | 8.9 | 8.7 | 8.2 | 7.9 | 8.2 | –0.6 | –1.1 | –0.5 | –1.5 | –0.5 | 0.6 |
| France | 10.4 | 10.1 | 9.6 | 9.3 | 8.5 | 8.1 | –0.4 | –0.9 | –1.1 | –1.4 | –1.4 | –2.1 |
| Germany | 4.7 | 4.2 | 3.7 | 3.9 | 3.8 | 3.8 | 8.6 | 8.3 | 7.7 | 7.4 | 7.4 | 6.9 |
| Greece | 25.0 | 23.6 | 21.7 | 19.4 | 16.9 | 18.5 | 0.1 | –0.6 | 0.1 | 1.4 | 1.1 | –1.5 |
| Hungary | 6.8 | 5.1 | 4.3 | 4.4 | 4.5 | 4.1 | 3.5 | 6.2 | 4.5 | 7.4 | 7.3 | 5.9 |
| Ireland | 9.5 | 7.9 | 6.4 | 6.1 | 6.0 | 6.1 | 10.9 | 3.4 | 5.9 | 4.5 | 2.8 | 3.1 |
| Italy | 11.9 | 11.7 | 11.3 | 11.1 | 10.8 | 10.5 | 1.4 | 2.5 | 2.0 | 1.7 | 2.6 | 3.4 |
| Japan | 3.4 | 3.1 | 2.9 | 2.8 | 3.0 | 3.3 | 3.1 | 3.7 | 3.4 | 3.2 | 3.6 | 4.5 |
| Lithuania | 9.2 | 7.9 | 7.6 | 7.7 | 7.6 | 7.7 | –2.4 | –0.9 | –0.8 | –3.5 | –5.1 | –4.8 |
| Latvia | 9.9 | 9.6 | 8.7 | 8.4 | 8.6 | 8.4 | –0.5 | 1.4 | –1.3 | –0.8 | –0.4 | –0.9 |
| Netherlands | 6.9 | 6.0 | 4.9 | 4.7 | 4.7 | 4.8 | 8.7 | 9.0 | 9.5 | 8.1 | 7.7 | 7.9 |
| Poland | 7.5 | 6.2 | 4.9 | 4.6 | 4.6 | 4.0 | –0.6 | –0.2 | 0.3 | 0.1 | –0.2 | –0.5 |
| Portugal | 12.6 | 11.2 | 9.2 | 8.3 | 8.1 | 9.0 | 0.3 | 0.9 | –0.1 | –1.4 | –1.8 | –1.7 |
| Romania | 6.8 | 5.9 | 5.1 | 5.3 | 5.2 | 5.3 | –1.2 | –2.1 | –3.2 | –2.7 | –2.5 | –2.5 |
| Slovakia | 11.5 | 9.7 | 8.1 | 7.6 | 7.9 | 8.4 | –1.8 | –1.5 | –2.1 | –1.4 | –0.9 | –1.5 |
| Slovenia | 9.0 | 8.0 | 6.9 | 6.7 | 6.6 | 6.7 | 4.4 | 5.2 | 5.0 | 3.8 | 1.9 | –0.8 |
| Spain | 22.0 | 19.6 | 17.4 | 15.3 | 14.0 | 13.4 | 1.1 | 1.9 | 0.9 | 0.9 | 1.2 | 0.5 |
| Sweden | 7.4 | 6.9 | 6.8 | 6.6 | 6.7 | 7.2 | 4.7 | 4.5 | 4.9 | 5.2 | 5.0 | 4.5 |
| UK | 5.4 | 4.9 | 4.4 | 4.3 | 4.3 | 4.6 | –5.2 | –5.9 | –4.3 | –3.2 | –2.5 | –1.7 |
| US | 5.3 | 4.9 | 4.4 | 4.4 | 4.7 | 5.3 | –2.4 | –2.4 | –2.7 | –3.3 | –3.5 | –3.1 |
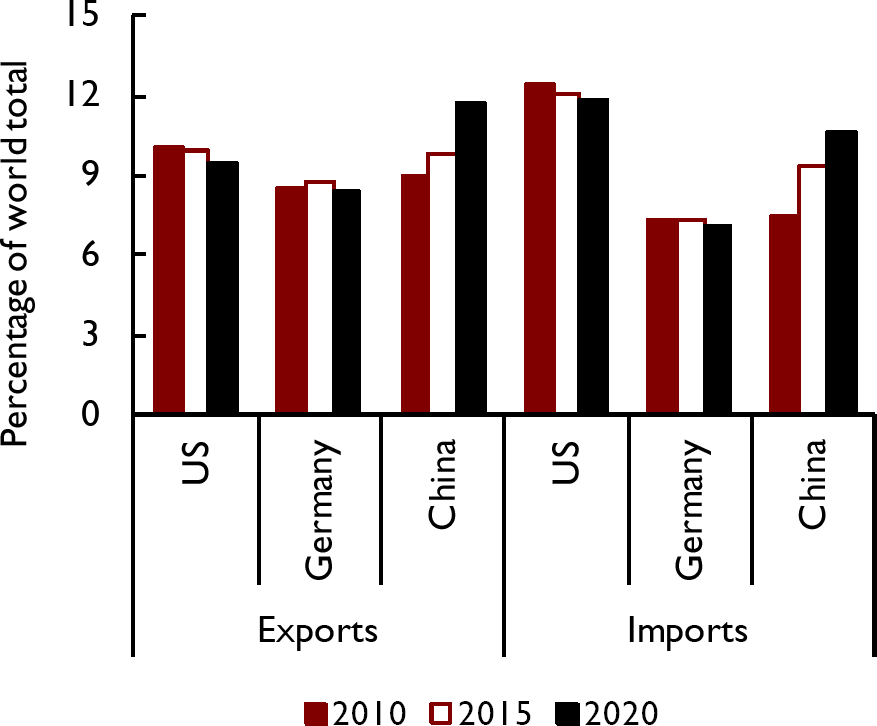
China is not expected to become the world's biggest importer of goods and services in the next 5 years
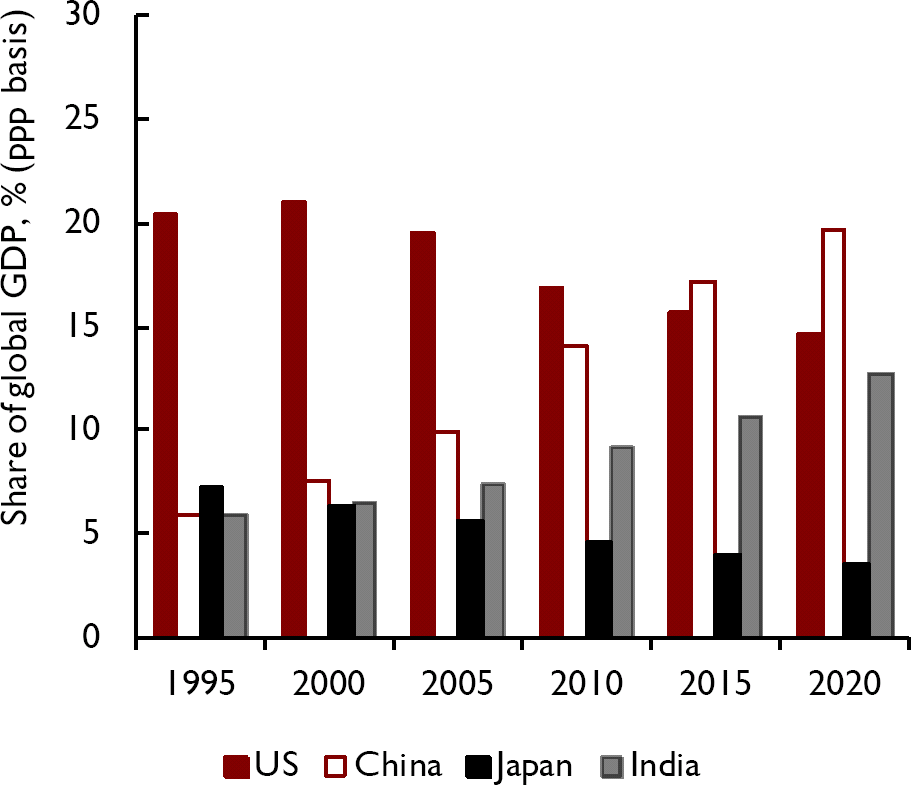
China has overtaken the US as the world's largest economy in 2014
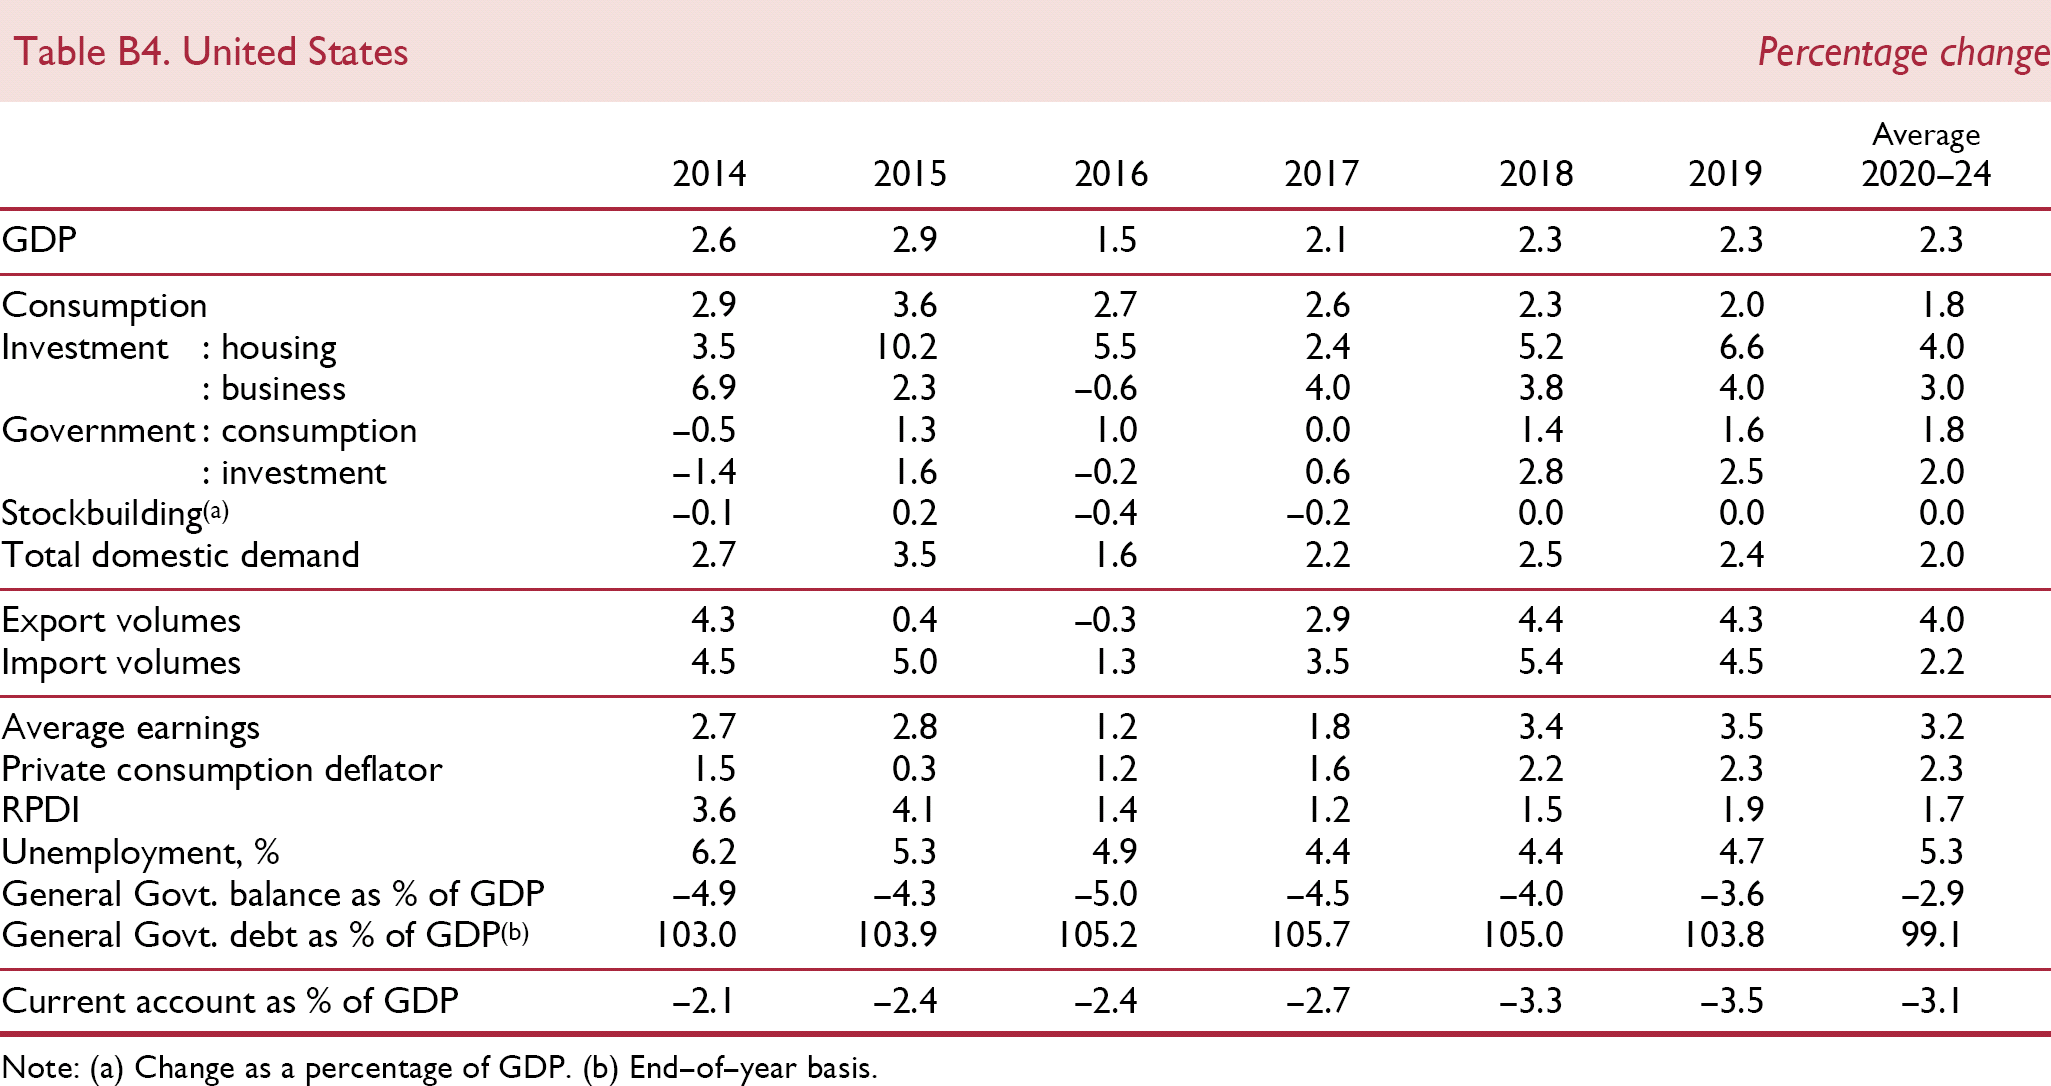
United States Percentage change
| 2014 | 2015 | 2016 | 2017 | 2018 | 2019 | Average 2020–24 | |
|---|---|---|---|---|---|---|---|
| GDP | 2.6 | 2.9 | 1.5 | 2.1 | 2.3 | 2.3 | 2.3 |
| Consumption | 2.9 | 3.6 | 2.7 | 2.6 | 2.3 | 2.0 | 1.8 |
| Investment : housing | 3.5 | 10.2 | 5.5 | 2.4 | 5.2 | 6.6 | 4.0 |
| : business | 6.9 | 2.3 | –0.6 | 4.0 | 3.8 | 4.0 | 3.0 |
| Government : consumption | –0.5 | 1.3 | 1.0 | 0.0 | 1.4 | 1.6 | 1.8 |
| : investment | –1.4 | 1.6 | –0.2 | 0.6 | 2.8 | 2.5 | 2.0 |
| Stockbuilding(a) | –0.1 | 0.2 | –0.4 | –0.2 | 0.0 | 0.0 | 0.0 |
| Total domestic demand | 2.7 | 3.5 | 1.6 | 2.2 | 2.5 | 2.4 | 2.0 |
| Export volumes | 4.3 | 0.4 | –0.3 | 2.9 | 4.4 | 4.3 | 4.0 |
| Import volumes | 4.5 | 5.0 | 1.3 | 3.5 | 5.4 | 4.5 | 2.2 |
| Average earnings | 2.7 | 2.8 | 1.2 | 1.8 | 3.4 | 3.5 | 3.2 |
| Private consumption deflator | 1.5 | 0.3 | 1.2 | 1.6 | 2.2 | 2.3 | 2.3 |
| RPDI | 3.6 | 4.1 | 1.4 | 1.2 | 1.5 | 1.9 | 1.7 |
| Unemployment, % | 6.2 | 5.3 | 4.9 | 4.4 | 4.4 | 4.7 | 5.3 |
| General Govt. balance as % of GDP | –4.9 | –4.3 | –5.0 | –4.5 | –4.0 | –3.6 | –2.9 |
| General Govt. debt as % of GDP(b) | 103.0 | 103.9 | 105.2 | 105.7 | 105.0 | 103.8 | 99.1 |
| Current account as % of GDP | –2.1 | –2.4 | –2.4 | –2.7 | –3.3 | –3.5 | –3.1 |
Note: (a) Change as a percentage of GDP.
End–of–year basis.
Canada Percentage change
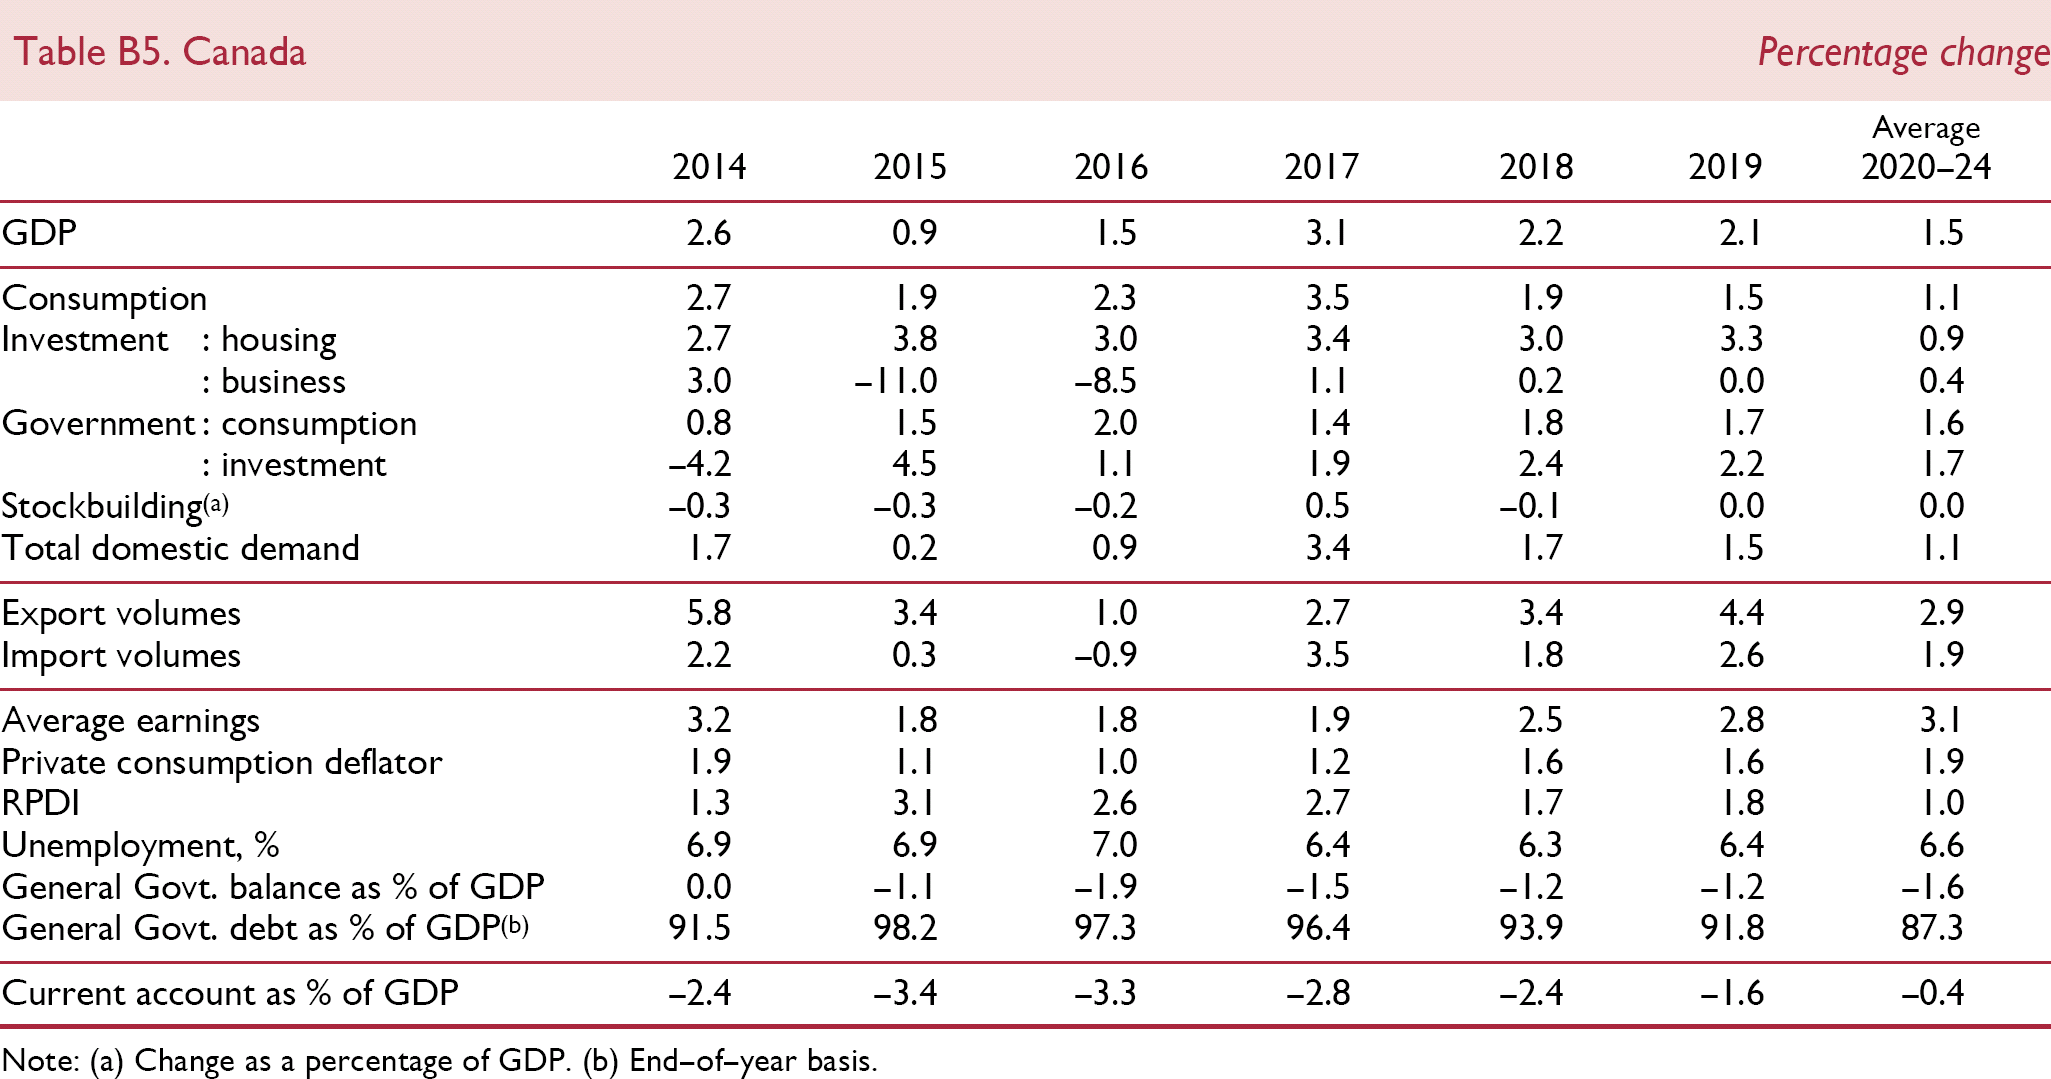
| 2014 | 2015 | 2016 | 2017 | 2018 | 2019 | Average 2020–24 | |
|---|---|---|---|---|---|---|---|
| GDP | 2.6 | 0.9 | 1.5 | 3.1 | 2.2 | 2.1 | 1.5 |
| Consumption | 2.7 | 1.9 | 2.3 | 3.5 | 1.9 | 1.5 | 1.1 |
| Investment : housing | 2.7 | 3.8 | 3.0 | 3.4 | 3.0 | 3.3 | 0.9 |
| : business | 3.0 | –11.0 | –8.5 | 1.1 | 0.2 | 0.0 | 0.4 |
| Government : consumption | 0.8 | 1.5 | 2.0 | 1.4 | 1.8 | 1.7 | 1.6 |
| : investment | –4.2 | 4.5 | 1.1 | 1.9 | 2.4 | 2.2 | 1.7 |
| Stockbuilding(a) | –0.3 | –0.3 | –0.2 | 0.5 | –0.1 | 0.0 | 0.0 |
| Total domestic demand | 1.7 | 0.2 | 0.9 | 3.4 | 1.7 | 1.5 | 1.1 |
| Export volumes | 5.8 | 3.4 | 1.0 | 2.7 | 3.4 | 4.4 | 2.9 |
| Import volumes | 2.2 | 0.3 | –0.9 | 3.5 | 1.8 | 2.6 | 1.9 |
| Average earnings | 3.2 | 1.8 | 1.8 | 1.9 | 2.5 | 2.8 | 3.1 |
| Private consumption deflator | 1.9 | 1.1 | 1.0 | 1.2 | 1.6 | 1.6 | 1.9 |
| RPDI | 1.3 | 3.1 | 2.6 | 2.7 | 1.7 | 1.8 | 1.0 |
| Unemployment, % | 6.9 | 6.9 | 7.0 | 6.4 | 6.3 | 6.4 | 6.6 |
| General Govt. balance as % of GDP | 0.0 | –1.1 | –1.9 | –1.5 | –1.2 | –1.2 | –1.6 |
| General Govt. debt as % of GDP(b) | 91.5 | 98.2 | 97.3 | 96.4 | 93.9 | 91.8 | 87.3 |
| Current account as % of GDP | –2.4 | –3.4 | –3.3 | –2.8 | –2.4 | –1.6 | –0.4 |
Note: (a) Change as a percentage of GDP.
End–of–year basis.
Japan Percentage change
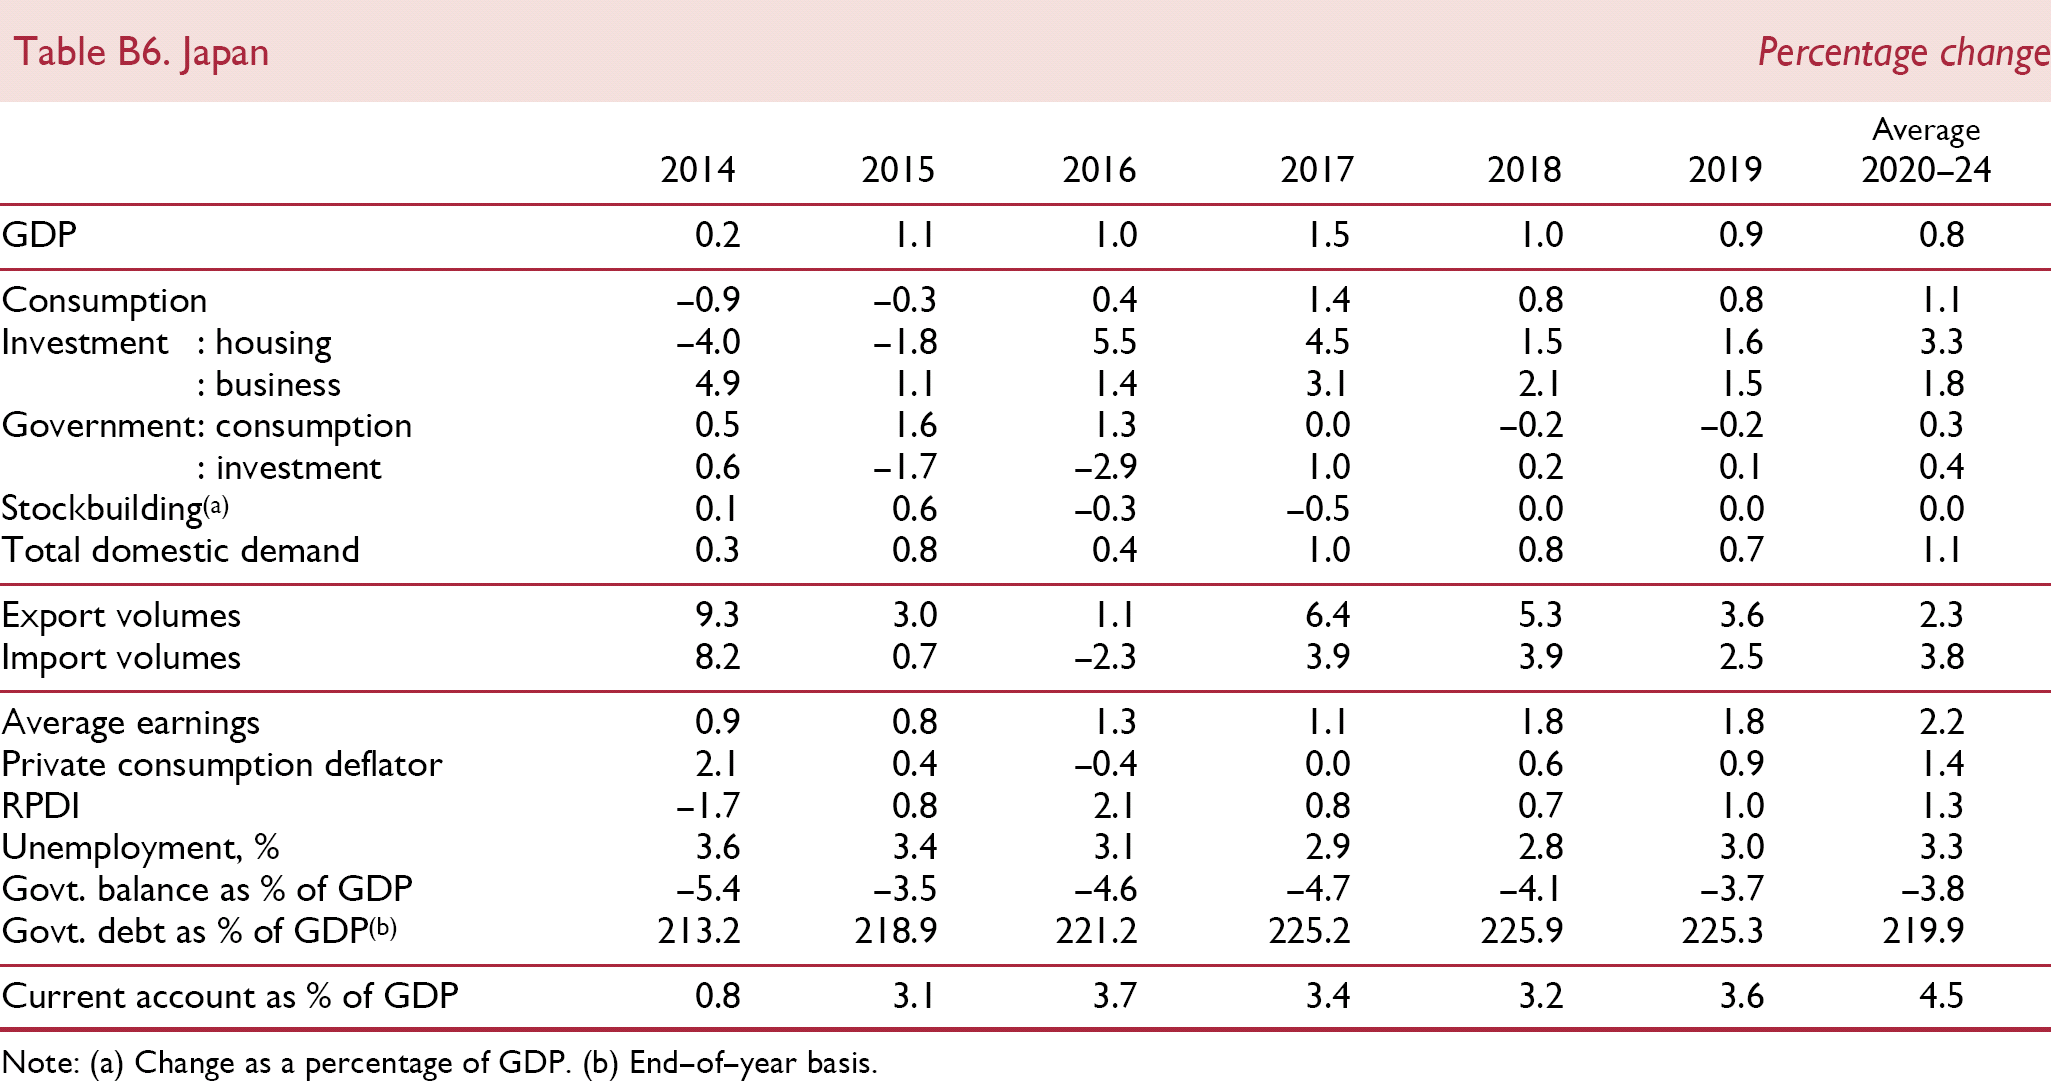
| 2014 | 2015 | 2016 | 2017 | 2018 | 2019 | Average 2020–24 | |
|---|---|---|---|---|---|---|---|
| GDP | 0.2 | 1.1 | 1.0 | 1.5 | 1.0 | 0.9 | 0.8 |
| Consumption | –0.9 | –0.3 | 0.4 | 1.4 | 0.8 | 0.8 | 1.1 |
| Investment : housing | –4.0 | –1.8 | 5.5 | 4.5 | 1.5 | 1.6 | 3.3 |
| : business | 4.9 | 1.1 | 1.4 | 3.1 | 2.1 | 1.5 | 1.8 |
| Government: consumption | 0.5 | 1.6 | 1.3 | 0.0 | –0.2 | –0.2 | 0.3 |
| : investment | 0.6 | –1.7 | –2.9 | 1.0 | 0.2 | 0.1 | 0.4 |
| Stockbuilding(a) | 0.1 | 0.6 | –0.3 | –0.5 | 0.0 | 0.0 | 0.0 |
| Total domestic demand | 0.3 | 0.8 | 0.4 | 1.0 | 0.8 | 0.7 | 1.1 |
| Export volumes | 9.3 | 3.0 | 1.1 | 6.4 | 5.3 | 3.6 | 2.3 |
| Import volumes | 8.2 | 0.7 | –2.3 | 3.9 | 3.9 | 2.5 | 3.8 |
| Average earnings | 0.9 | 0.8 | 1.3 | 1.1 | 1.8 | 1.8 | 2.2 |
| Private consumption deflator | 2.1 | 0.4 | –0.4 | 0.0 | 0.6 | 0.9 | 1.4 |
| RPDI | –1.7 | 0.8 | 2.1 | 0.8 | 0.7 | 1.0 | 1.3 |
| Unemployment, % | 3.6 | 3.4 | 3.1 | 2.9 | 2.8 | 3.0 | 3.3 |
| Govt. balance as % of GDP | –5.4 | –3.5 | –4.6 | –4.7 | –4.1 | –3.7 | –3.8 |
| Govt. debt as % of GDP(b) | 213.2 | 218.9 | 221.2 | 225.2 | 225.9 | 225.3 | 219.9 |
| Current account as % of GDP | 0.8 | 3.1 | 3.7 | 3.4 | 3.2 | 3.6 | 4.5 |
Note: (a) Change as a percentage of GDP.
End–of–year basis.
Euro Area Percentage change
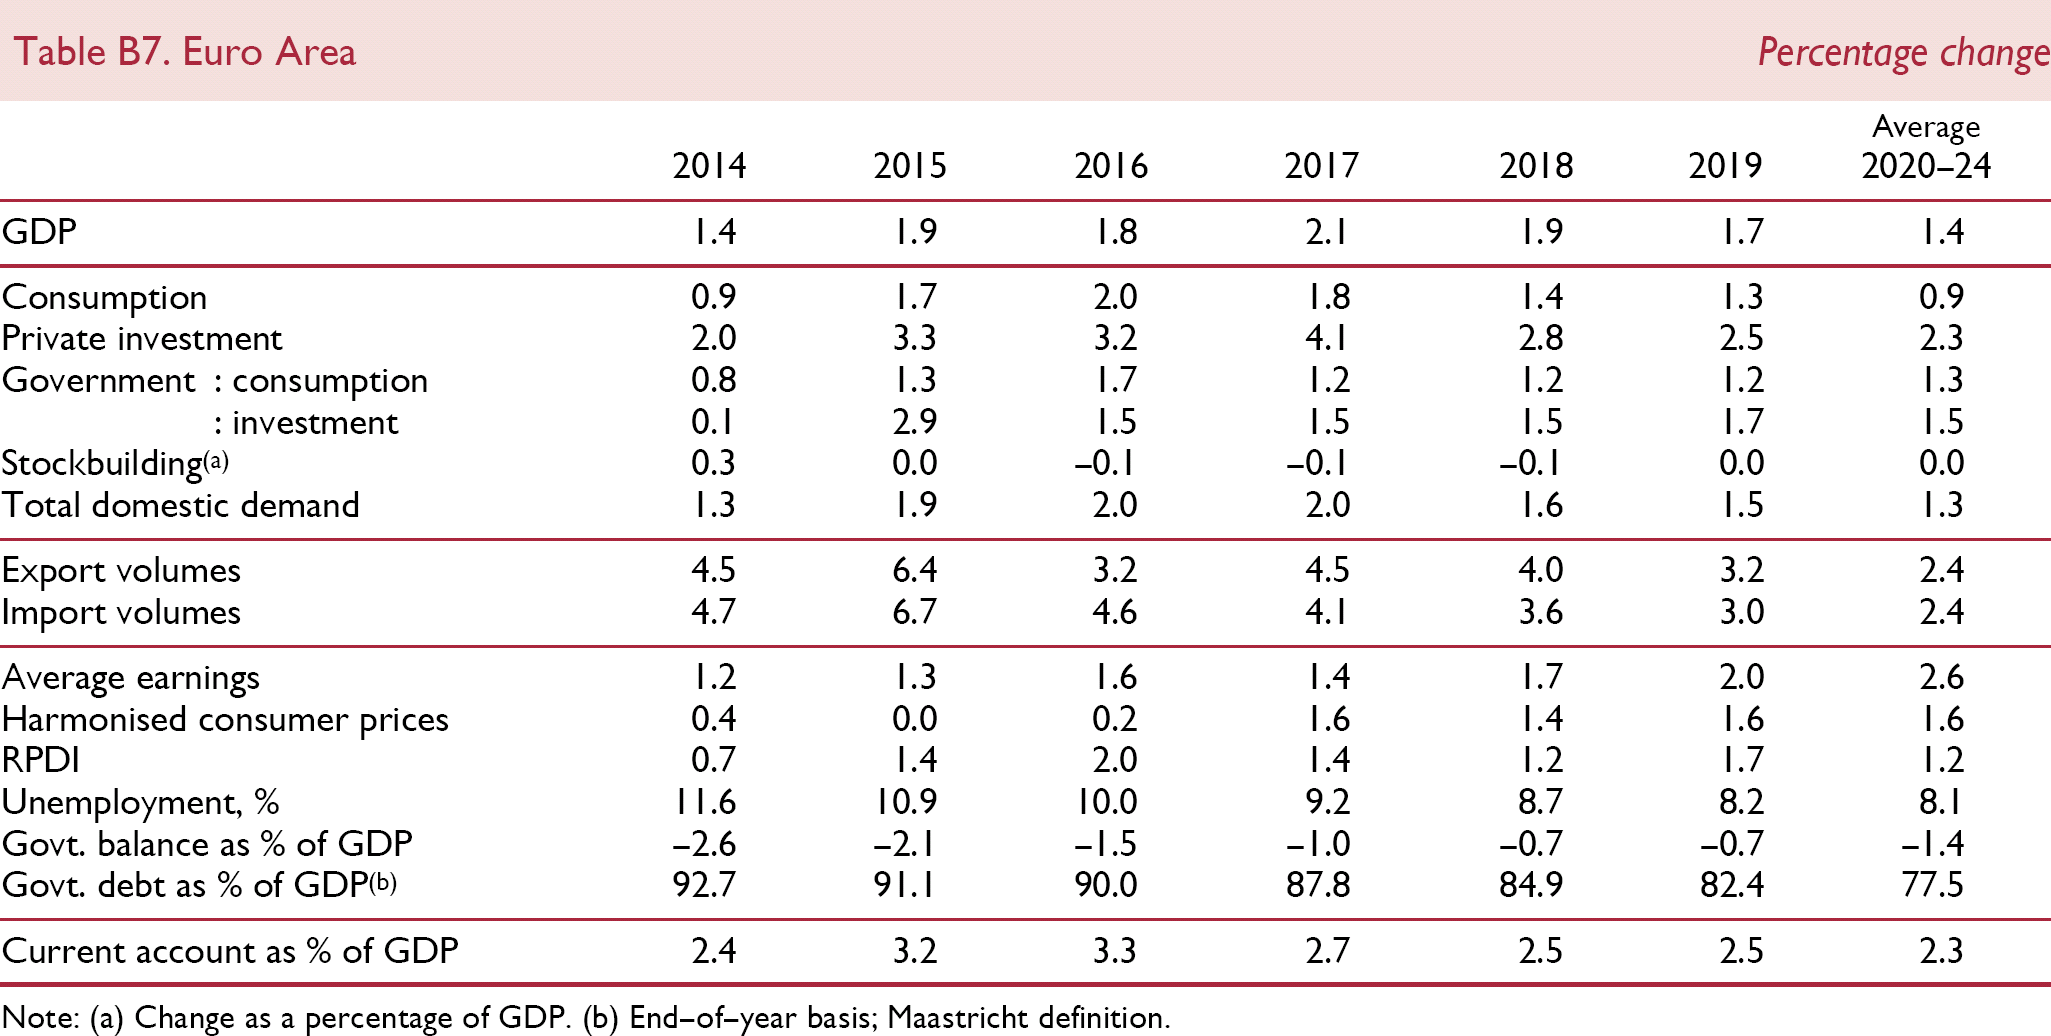
| 2014 | 2015 | 2016 | 2017 | 2018 | 2019 | Average 2020–24 | |
|---|---|---|---|---|---|---|---|
| GDP | 1.4 | 1.9 | 1.8 | 2.1 | 1.9 | 1.7 | 1.4 |
| Consumption | 0.9 | 1.7 | 2.0 | 1.8 | 1.4 | 1.3 | 0.9 |
| Private investment | 2.0 | 3.3 | 3.2 | 4.1 | 2.8 | 2.5 | 2.3 |
| Government : consumption | 0.8 | 1.3 | 1.7 | 1.2 | 1.2 | 1.2 | 1.3 |
| : investment | 0.1 | 2.9 | 1.5 | 1.5 | 1.5 | 1.7 | 1.5 |
| Stockbuilding(a) | 0.3 | 0.0 | –0.1 | –0.1 | –0.1 | 0.0 | 0.0 |
| Total domestic demand | 1.3 | 1.9 | 2.0 | 2.0 | 1.6 | 1.5 | 1.3 |
| Export volumes | 4.5 | 6.4 | 3.2 | 4.5 | 4.0 | 3.2 | 2.4 |
| Import volumes | 4.7 | 6.7 | 4.6 | 4.1 | 3.6 | 3.0 | 2.4 |
| Average earnings | 1.2 | 1.3 | 1.6 | 1.4 | 1.7 | 2.0 | 2.6 |
| Harmonised consumer prices | 0.4 | 0.0 | 0.2 | 1.6 | 1.4 | 1.6 | 1.6 |
| RPDI | 0.7 | 1.4 | 2.0 | 1.4 | 1.2 | 1.7 | 1.2 |
| Unemployment, % | 11.6 | 10.9 | 10.0 | 9.2 | 8.7 | 8.2 | 8.1 |
| Govt. balance as % of GDP | –2.6 | –2.1 | –1.5 | –1.0 | –0.7 | –0.7 | –1.4 |
| Govt. debt as % of GDP(b) | 92.7 | 91.1 | 90.0 | 87.8 | 84.9 | 82.4 | 77.5 |
| Current account as % of GDP | 2.4 | 3.2 | 3.3 | 2.7 | 2.5 | 2.5 | 2.3 |
Note: (a) Change as a percentage of GDP.
End–of–year basis; Maastricht definition.
Germany Percentage change
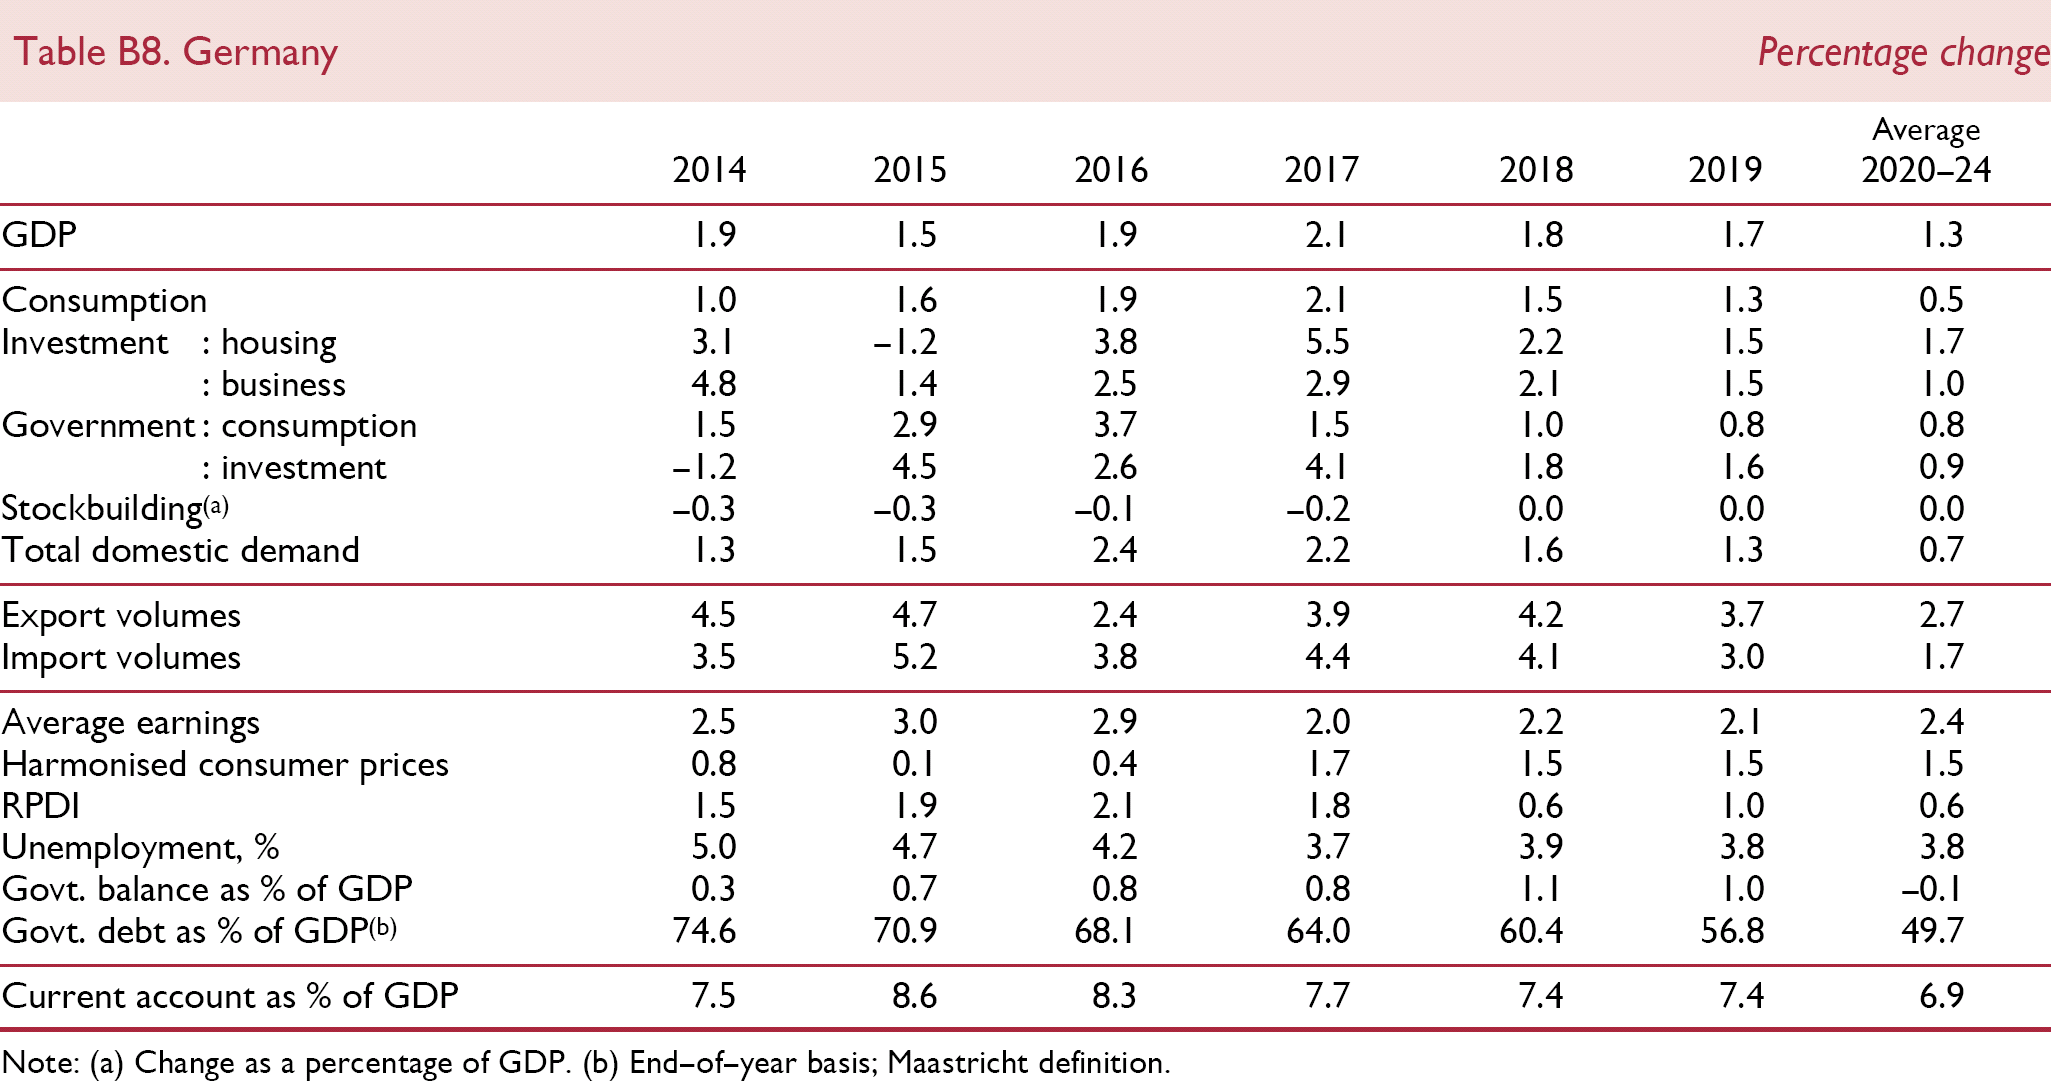
| 2014 | 2015 | 2016 | 2017 | 2018 | 2019 | Average 2020–24 | |
|---|---|---|---|---|---|---|---|
| GDP | 1.9 | 1.5 | 1.9 | 2.1 | 1.8 | 1.7 | 1.3 |
| Consumption | 1.0 | 1.6 | 1.9 | 2.1 | 1.5 | 1.3 | 0.5 |
| Investment : housing | 3.1 | –1.2 | 3.8 | 5.5 | 2.2 | 1.5 | 1.7 |
| : business | 4.8 | 1.4 | 2.5 | 2.9 | 2.1 | 1.5 | 1.0 |
| Government : consumption | 1.5 | 2.9 | 3.7 | 1.5 | 1.0 | 0.8 | 0.8 |
| : investment | –1.2 | 4.5 | 2.6 | 4.1 | 1.8 | 1.6 | 0.9 |
| Stockbuilding(a) | –0.3 | –0.3 | –0.1 | –0.2 | 0.0 | 0.0 | 0.0 |
| Total domestic demand | 1.3 | 1.5 | 2.4 | 2.2 | 1.6 | 1.3 | 0.7 |
| Export volumes | 4.5 | 4.7 | 2.4 | 3.9 | 4.2 | 3.7 | 2.7 |
| Import volumes | 3.5 | 5.2 | 3.8 | 4.4 | 4.1 | 3.0 | 1.7 |
| Average earnings | 2.5 | 3.0 | 2.9 | 2.0 | 2.2 | 2.1 | 2.4 |
| Harmonised consumer prices | 0.8 | 0.1 | 0.4 | 1.7 | 1.5 | 1.5 | 1.5 |
| RPDI | 1.5 | 1.9 | 2.1 | 1.8 | 0.6 | 1.0 | 0.6 |
| Unemployment, % | 5.0 | 4.7 | 4.2 | 3.7 | 3.9 | 3.8 | 3.8 |
| Govt. balance as % of GDP | 0.3 | 0.7 | 0.8 | 0.8 | 1.1 | 1.0 | –0.1 |
| Govt. debt as % of GDP(b) | 74.6 | 70.9 | 68.1 | 64.0 | 60.4 | 56.8 | 49.7 |
| Current account as % of GDP | 7.5 | 8.6 | 8.3 | 7.7 | 7.4 | 7.4 | 6.9 |
Note: (a) Change as a percentage of GDP.
End–of–year basis; Maastricht definition.
France Percentage change
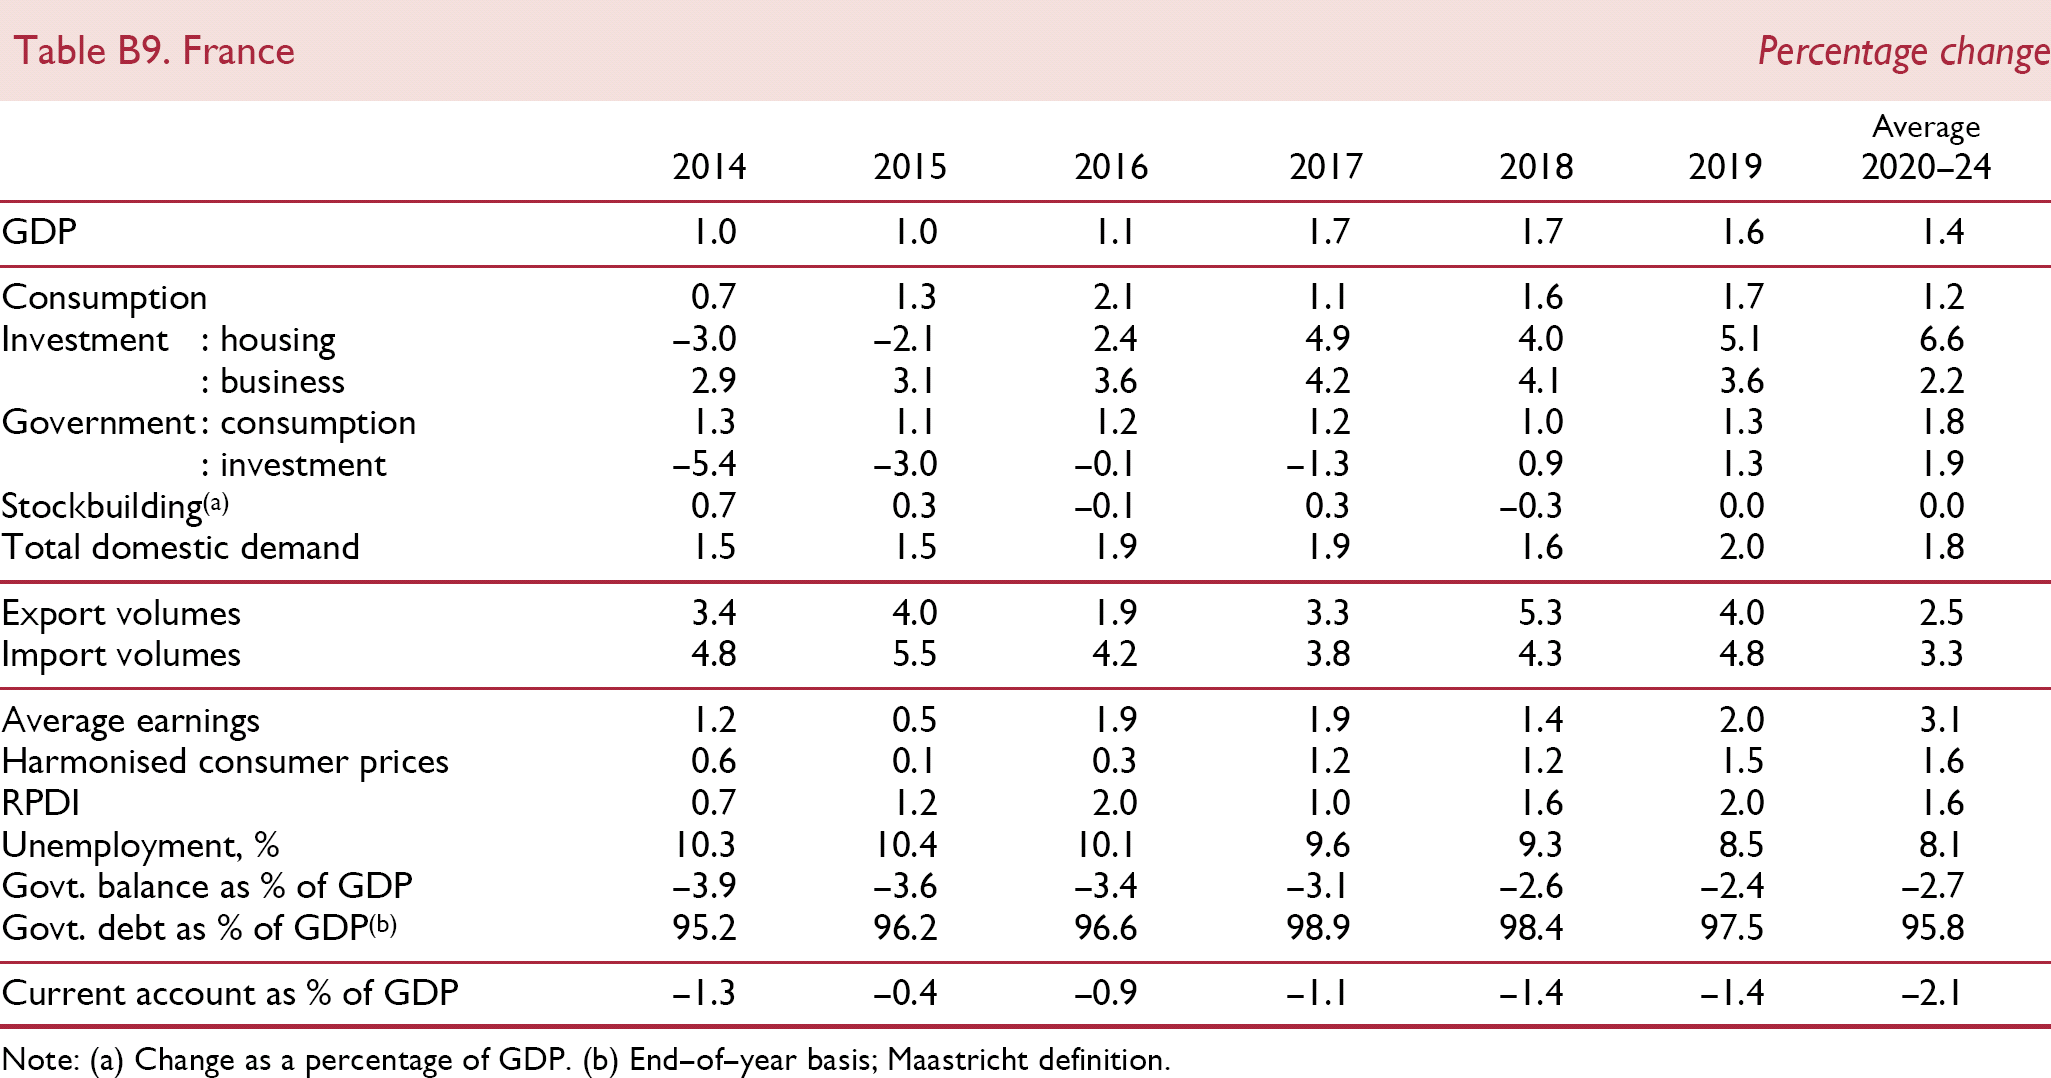
| 2014 | 2015 | 2016 | 2017 | 2018 | 2019 | Average 2020–24 | |
|---|---|---|---|---|---|---|---|
| GDP | 1.0 | 1.0 | 1.1 | 1.7 | 1.7 | 1.6 | 1.4 |
| Consumption | 0.7 | 1.3 | 2.1 | 1.1 | 1.6 | 1.7 | 1.2 |
| Investment : housing | –3.0 | –2.1 | 2.4 | 4.9 | 4.0 | 5.1 | 6.6 |
| : business | 2.9 | 3.1 | 3.6 | 4.2 | 4.1 | 3.6 | 2.2 |
| Government : consumption | 1.3 | 1.1 | 1.2 | 1.2 | 1.0 | 1.3 | 1.8 |
| : investment | –5.4 | –3.0 | –0.1 | –1.3 | 0.9 | 1.3 | 1.9 |
| Stockbuilding(a) | 0.7 | 0.3 | –0.1 | 0.3 | –0.3 | 0.0 | 0.0 |
| Total domestic demand | 1.5 | 1.5 | 1.9 | 1.9 | 1.6 | 2.0 | 1.8 |
| Export volumes | 3.4 | 4.0 | 1.9 | 3.3 | 5.3 | 4.0 | 2.5 |
| Import volumes | 4.8 | 5.5 | 4.2 | 3.8 | 4.3 | 4.8 | 3.3 |
| Average earnings | 1.2 | 0.5 | 1.9 | 1.9 | 1.4 | 2.0 | 3.1 |
| Harmonised consumer prices | 0.6 | 0.1 | 0.3 | 1.2 | 1.2 | 1.5 | 1.6 |
| RPDI | 0.7 | 1.2 | 2.0 | 1.0 | 1.6 | 2.0 | 1.6 |
| Unemployment, % | 10.3 | 10.4 | 10.1 | 9.6 | 9.3 | 8.5 | 8.1 |
| Govt. balance as % of GDP | –3.9 | –3.6 | –3.4 | –3.1 | –2.6 | –2.4 | –2.7 |
| Govt. debt as % of GDP(b) | 95.2 | 96.2 | 96.6 | 98.9 | 98.4 | 97.5 | 95.8 |
| Current account as % of GDP | –1.3 | –0.4 | –0.9 | –1.1 | –1.4 | –1.4 | –2.1 |
Note: (a) Change as a percentage of GDP.
End–of–year basis; Maastricht definition.
Italy Percentage change
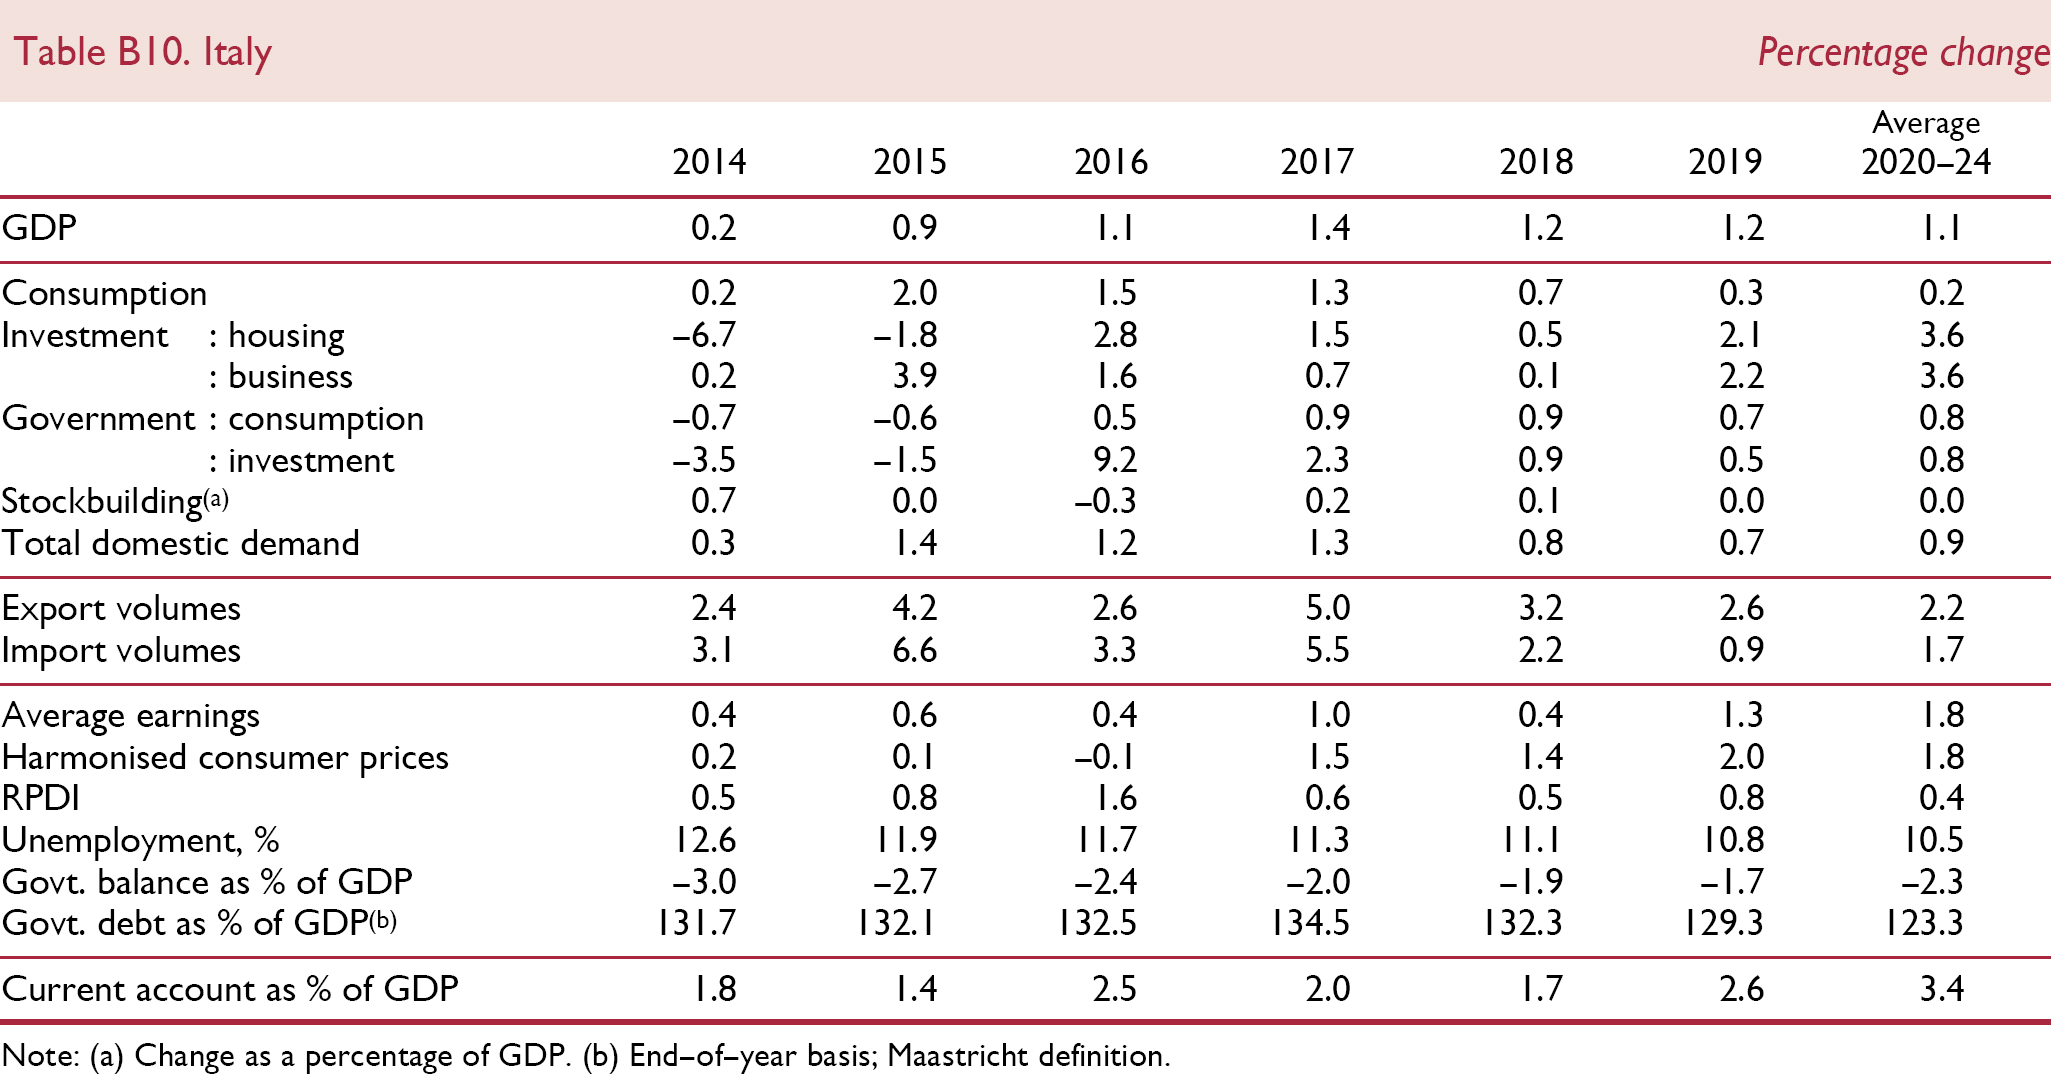
| 2014 | 2015 | 2016 | 2017 | 2018 | 2019 | Average 2020–24 | |
|---|---|---|---|---|---|---|---|
| GDP | 0.2 | 0.9 | 1.1 | 1.4 | 1.2 | 1.2 | 1.1 |
| Consumption | 0.2 | 2.0 | 1.5 | 1.3 | 0.7 | 0.3 | 0.2 |
| Investment : housing | –6.7 | –1.8 | 2.8 | 1.5 | 0.5 | 2.1 | 3.6 |
| : business | 0.2 | 3.9 | 1.6 | 0.7 | 0.1 | 2.2 | 3.6 |
| Government : consumption | –0.7 | –0.6 | 0.5 | 0.9 | 0.9 | 0.7 | 0.8 |
| : investment | –3.5 | –1.5 | 9.2 | 2.3 | 0.9 | 0.5 | 0.8 |
| Stockbuilding(a) | 0.7 | 0.0 | –0.3 | 0.2 | 0.1 | 0.0 | 0.0 |
| Total domestic demand | 0.3 | 1.4 | 1.2 | 1.3 | 0.8 | 0.7 | 0.9 |
| Export volumes | 2.4 | 4.2 | 2.6 | 5.0 | 3.2 | 2.6 | 2.2 |
| Import volumes | 3.1 | 6.6 | 3.3 | 5.5 | 2.2 | 0.9 | 1.7 |
| Average earnings | 0.4 | 0.6 | 0.4 | 1.0 | 0.4 | 1.3 | 1.8 |
| Harmonised consumer prices | 0.2 | 0.1 | –0.1 | 1.5 | 1.4 | 2.0 | 1.8 |
| RPDI | 0.5 | 0.8 | 1.6 | 0.6 | 0.5 | 0.8 | 0.4 |
| Unemployment, % | 12.6 | 11.9 | 11.7 | 11.3 | 11.1 | 10.8 | 10.5 |
| Govt. balance as % of GDP | –3.0 | –2.7 | –2.4 | –2.0 | –1.9 | –1.7 | –2.3 |
| Govt. debt as % of GDP(b) | 131.7 | 132.1 | 132.5 | 134.5 | 132.3 | 129.3 | 123.3 |
| Current account as % of GDP | 1.8 | 1.4 | 2.5 | 2.0 | 1.7 | 2.6 | 3.4 |
Note: (a) Change as a percentage of GDP.
End–of–year basis; Maastricht definition.
Spain Percentage change

| 2014 | 2015 | 2016 | 2017 | 2018 | 2019 | Average 2020–24 | |
|---|---|---|---|---|---|---|---|
| GDP | 1.4 | 3.4 | 3.3 | 3.0 | 2.4 | 2.2 | 1.8 |
| Consumption | 1.5 | 3.0 | 3.0 | 2.4 | 1.9 | 1.8 | 1.4 |
| Investment : housing | 6.2 | 3.1 | 3.7 | 6.5 | 2.4 | 2.1 | 2.8 |
| : business | –0.5 | 4.0 | 6.0 | 3.7 | 3.7 | 2.2 | 2.1 |
| Government: consumption | –0.3 | 2.1 | 0.8 | 1.1 | 1.4 | 1.9 | 2.0 |
| : investment | 12.8 | 16.1 | –1.5 | 2.8 | 1.9 | 3.0 | 2.0 |
| Stockbuilding(a) | 0.2 | 0.4 | 0.0 | –0.1 | 0.0 | 0.0 | 0.0 |
| Total domestic demand | 2.0 | 4.0 | 2.6 | 2.5 | 2.0 | 2.0 | 1.7 |
| Export volumes | 4.3 | 4.2 | 4.8 | 5.8 | 4.7 | 4.1 | 3.0 |
| Import volumes | 6.6 | 5.9 | 2.7 | 4.6 | 3.7 | 3.7 | 3.0 |
| Average earnings | 0.0 | 1.3 | 0.3 | 0.7 | 2.0 | 2.0 | 2.8 |
| Harmonised consumer prices | –0.2 | –0.6 | –0.3 | 2.0 | 1.2 | 1.5 | 1.6 |
| RPDI | 0.9 | 1.9 | 2.6 | 1.2 | 2.2 | 2.3 | 1.5 |
| Unemployment, % | 24.5 | 22.0 | 19.6 | 17.4 | 15.3 | 14.0 | 13.4 |
| Govt. balance as % of GDP | –6.0 | –5.1 | –4.5 | –3.2 | –2.2 | –2.0 | –2.2 |
| Govt. debt as % of GDP(b) | 100.4 | 99.8 | 99.4 | 100.1 | 97.5 | 95.3 | 90.4 |
| Current account as % of GDP | 1.0 | 1.1 | 1.9 | 0.9 | 0.9 | 1.2 | 0.5 |
Note: (a) Change as a percentage of GDP.
End-of-year basis; Maastricht definition.