
Abstract

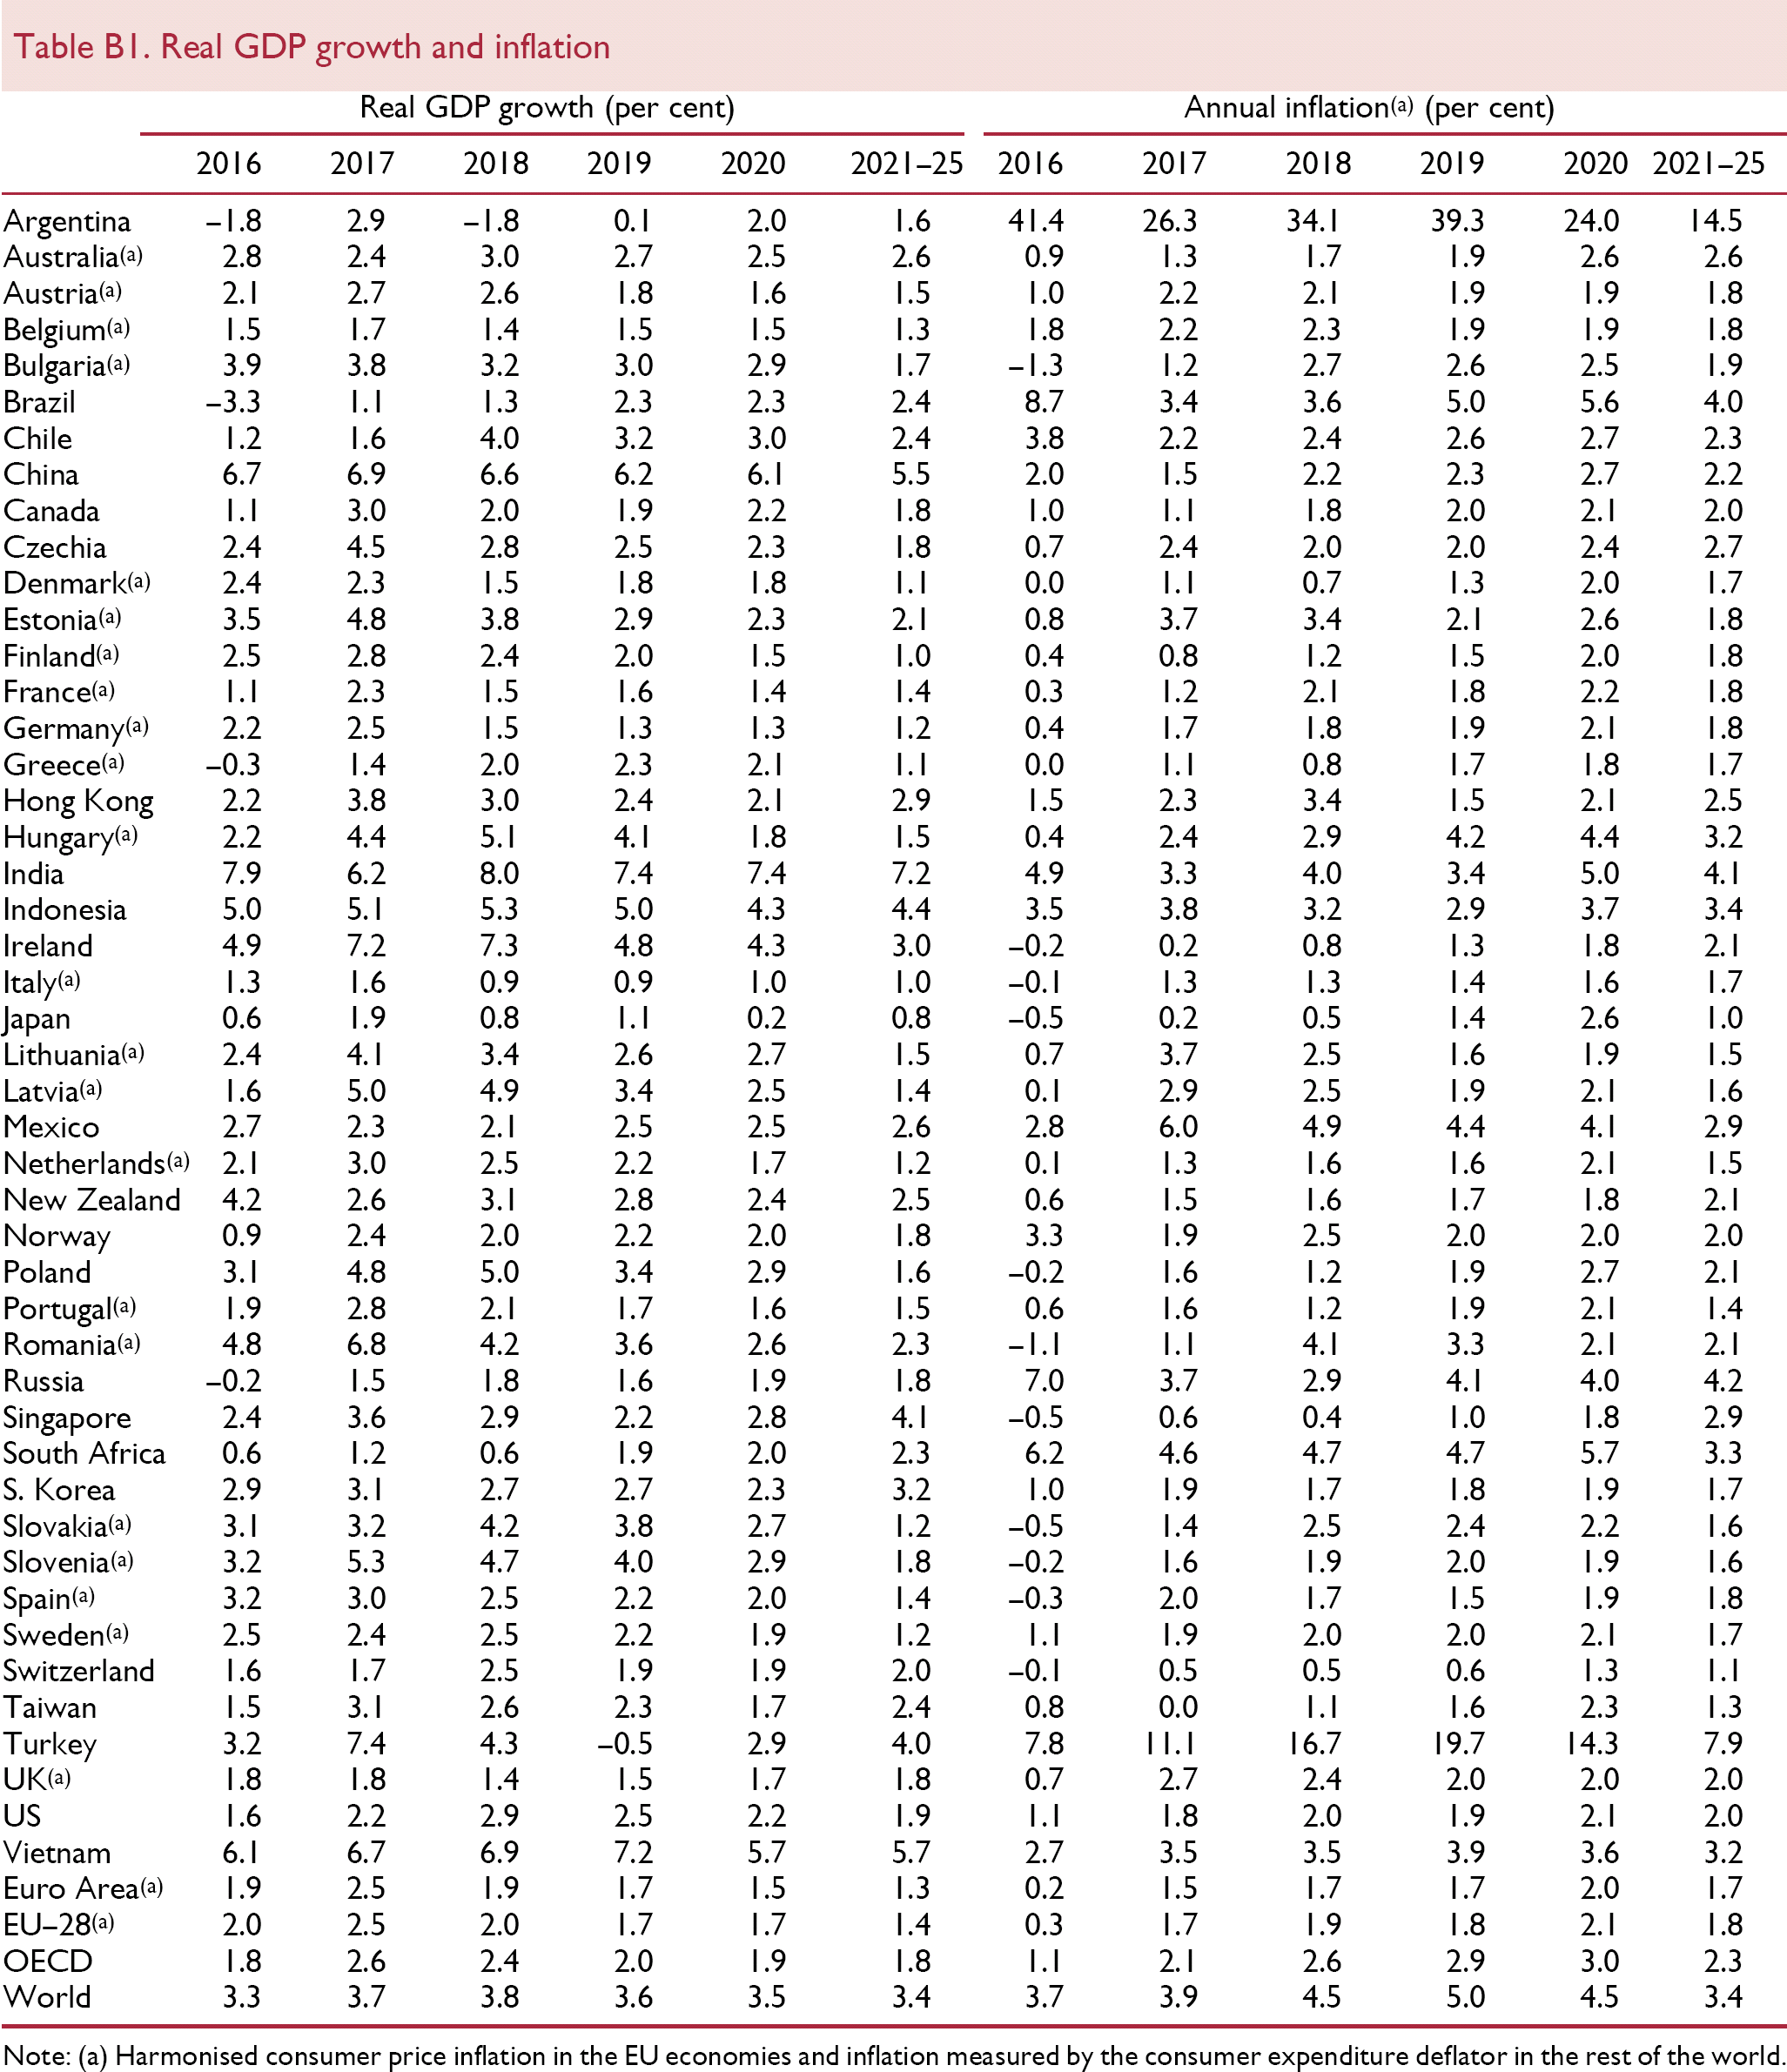
Real GDP growth and inflation
| Real GDP growth (per cent) | Annual inflation(a) (per cent) | |||||||||||
|---|---|---|---|---|---|---|---|---|---|---|---|---|
| 2016 | 2017 | 2018 | 2019 | 2020 | 2021–25 | 2016 | 2017 | 2018 | 2019 | 2020 | 2021–25 | |
| Argentina | −1.8 | 2.9 | −1.8 | 0.1 | 2.0 | 1.6 | 41.4 | 26.3 | 34.1 | 39.3 | 24.0 | 14.5 |
| Australia(a) | 2.8 | 2.4 | 3.0 | 2.7 | 2.5 | 2.6 | 0.9 | 1.3 | 1.7 | 1.9 | 2.6 | 2.6 |
| Austria(a) | 2.1 | 2.7 | 2.6 | 1.8 | 1.6 | 1.5 | 1.0 | 2.2 | 2.1 | 1.9 | 1.9 | 1.8 |
| Belgium(a) | 1.5 | 1.7 | 1.4 | 1.5 | 1.5 | 1.3 | 1.8 | 2.2 | 2.3 | 1.9 | 1.9 | 1.8 |
| Bulgaria(a) | 3.9 | 3.8 | 3.2 | 3.0 | 2.9 | 1.7 | −1.3 | 1.2 | 2.7 | 2.6 | 2.5 | 1.9 |
| Brazil | −3.3 | 1.1 | 1.3 | 2.3 | 2.3 | 2.4 | 8.7 | 3.4 | 3.6 | 5.0 | 5.6 | 4.0 |
| Chile | 1.2 | 1.6 | 4.0 | 3.2 | 3.0 | 2.4 | 3.8 | 2.2 | 2.4 | 2.6 | 2.7 | 2.3 |
| China | 6.7 | 6.9 | 6.6 | 6.2 | 6.1 | 5.5 | 2.0 | 1.5 | 2.2 | 2.3 | 2.7 | 2.2 |
| Canada | 1.1 | 3.0 | 2.0 | 1.9 | 2.2 | 1.8 | 1.0 | 1.1 | 1.8 | 2.0 | 2.1 | 2.0 |
| Czechia | 2.4 | 4.5 | 2.8 | 2.5 | 2.3 | 1.8 | 0.7 | 2.4 | 2.0 | 2.0 | 2.4 | 2.7 |
| Denmark(a) | 2.4 | 2.3 | 1.5 | 1.8 | 1.8 | 1.1 | 0.0 | 1.1 | 0.7 | 1.3 | 2.0 | 1.7 |
| Estonia(a) | 3.5 | 4.8 | 3.8 | 2.9 | 2.3 | 2.1 | 0.8 | 3.7 | 3.4 | 2.1 | 2.6 | 1.8 |
| Finland(a) | 2.5 | 2.8 | 2.4 | 2.0 | 1.5 | 1.0 | 0.4 | 0.8 | 1.2 | 1.5 | 2.0 | 1.8 |
| France(a) | 1.1 | 2.3 | 1.5 | 1.6 | 1.4 | 1.4 | 0.3 | 1.2 | 2.1 | 1.8 | 2.2 | 1.8 |
| Germany(a) | 2.2 | 2.5 | 1.5 | 1.3 | 1.3 | 1.2 | 0.4 | 1.7 | 1.8 | 1.9 | 2.1 | 1.8 |
| Greece(a) | −0.3 | 1.4 | 2.0 | 2.3 | 2.1 | 1.1 | 0.0 | 1.1 | 0.8 | 1.7 | 1.8 | 1.7 |
| Hong Kong | 2.2 | 3.8 | 3.0 | 2.4 | 2.1 | 2.9 | 1.5 | 2.3 | 3.4 | 1.5 | 2.1 | 2.5 |
| Hungary(a) | 2.2 | 4.4 | 5.1 | 4.1 | 1.8 | 1.5 | 0.4 | 2.4 | 2.9 | 4.2 | 4.4 | 3.2 |
| India | 7.9 | 6.2 | 8.0 | 7.4 | 7.4 | 7.2 | 4.9 | 3.3 | 4.0 | 3.4 | 5.0 | 4.1 |
| Indonesia | 5.0 | 5.1 | 5.3 | 5.0 | 4.3 | 4.4 | 3.5 | 3.8 | 3.2 | 2.9 | 3.7 | 3.4 |
| Ireland | 4.9 | 7.2 | 7.3 | 4.8 | 4.3 | 3.0 | −0.2 | 0.2 | 0.8 | 1.3 | 1.8 | 2.1 |
| Italy(a) | 1.3 | 1.6 | 0.9 | 0.9 | 1.0 | 1.0 | −0.1 | 1.3 | 1.3 | 1.4 | 1.6 | 1.7 |
| Japan | 0.6 | 1.9 | 0.8 | 1.1 | 0.2 | 0.8 | −0.5 | 0.2 | 0.5 | 1.4 | 2.6 | 1.0 |
| Lithuania(a) | 2.4 | 4.1 | 3.4 | 2.6 | 2.7 | 1.5 | 0.7 | 3.7 | 2.5 | 1.6 | 1.9 | 1.5 |
| Latvia(a) | 1.6 | 5.0 | 4.9 | 3.4 | 2.5 | 1.4 | 0.1 | 2.9 | 2.5 | 1.9 | 2.1 | 1.6 |
| Mexico | 2.7 | 2.3 | 2.1 | 2.5 | 2.5 | 2.6 | 2.8 | 6.0 | 4.9 | 4.4 | 4.1 | 2.9 |
| Netherlands(a) | 2.1 | 3.0 | 2.5 | 2.2 | 1.7 | 1.2 | 0.1 | 1.3 | 1.6 | 1.6 | 2.1 | 1.5 |
| New Zealand | 4.2 | 2.6 | 3.1 | 2.8 | 2.4 | 2.5 | 0.6 | 1.5 | 1.6 | 1.7 | 1.8 | 2.1 |
| Norway | 0.9 | 2.4 | 2.0 | 2.2 | 2.0 | 1.8 | 3.3 | 1.9 | 2.5 | 2.0 | 2.0 | 2.0 |
| Poland | 3.1 | 4.8 | 5.0 | 3.4 | 2.9 | 1.6 | −0.2 | 1.6 | 1.2 | 1.9 | 2.7 | 2.1 |
| Portugal(a) | 1.9 | 2.8 | 2.1 | 1.7 | 1.6 | 1.5 | 0.6 | 1.6 | 1.2 | 1.9 | 2.1 | 1.4 |
| Romania(a) | 4.8 | 6.8 | 4.2 | 3.6 | 2.6 | 2.3 | −1.1 | 1.1 | 4.1 | 3.3 | 2.1 | 2.1 |
| Russia | −0.2 | 1.5 | 1.8 | 1.6 | 1.9 | 1.8 | 7.0 | 3.7 | 2.9 | 4.1 | 4.0 | 4.2 |
| Singapore | 2.4 | 3.6 | 2.9 | 2.2 | 2.8 | 4.1 | −0.5 | 0.6 | 0.4 | 1.0 | 1.8 | 2.9 |
| South Africa | 0.6 | 1.2 | 0.6 | 1.9 | 2.0 | 2.3 | 6.2 | 4.6 | 4.7 | 4.7 | 5.7 | 3.3 |
| S. Korea | 2.9 | 3.1 | 2.7 | 2.7 | 2.3 | 3.2 | 1.0 | 1.9 | 1.7 | 1.8 | 1.9 | 1.7 |
| Slovakia(a) | 3.1 | 3.2 | 4.2 | 3.8 | 2.7 | 1.2 | −0.5 | 1.4 | 2.5 | 2.4 | 2.2 | 1.6 |
| Slovenia(a) | 3.2 | 5.3 | 4.7 | 4.0 | 2.9 | 1.8 | −0.2 | 1.6 | 1.9 | 2.0 | 1.9 | 1.6 |
| Spain(a) | 3.2 | 3.0 | 2.5 | 2.2 | 2.0 | 1.4 | −0.3 | 2.0 | 1.7 | 1.5 | 1.9 | 1.8 |
| Sweden(a) | 2.5 | 2.4 | 2.5 | 2.2 | 1.9 | 1.2 | 1.1 | 1.9 | 2.0 | 2.0 | 2.1 | 1.7 |
| Switzerland | 1.6 | 1.7 | 2.5 | 1.9 | 1.9 | 2.0 | −0.1 | 0.5 | 0.5 | 0.6 | 1.3 | 1.1 |
| Taiwan | 1.5 | 3.1 | 2.6 | 2.3 | 1.7 | 2.4 | 0.8 | 0.0 | 1.1 | 1.6 | 2.3 | 1.3 |
| Turkey | 3.2 | 7.4 | 4.3 | −0.5 | 2.9 | 4.0 | 7.8 | 11.1 | 16.7 | 19.7 | 14.3 | 7.9 |
| UK(a) | 1.8 | 1.8 | 1.4 | 1.5 | 1.7 | 1.8 | 0.7 | 2.7 | 2.4 | 2.0 | 2.0 | 2.0 |
| US | 1.6 | 2.2 | 2.9 | 2.5 | 2.2 | 1.9 | 1.1 | 1.8 | 2.0 | 1.9 | 2.1 | 2.0 |
| Vietnam | 6.1 | 6.7 | 6.9 | 7.2 | 5.7 | 5.7 | 2.7 | 3.5 | 3.5 | 3.9 | 3.6 | 3.2 |
| Euro Area(a) | 1.9 | 2.5 | 1.9 | 1.7 | 1.5 | 1.3 | 0.2 | 1.5 | 1.7 | 1.7 | 2.0 | 1.7 |
| EU–28(a) | 2.0 | 2.5 | 2.0 | 1.7 | 1.7 | 1.4 | 0.3 | 1.7 | 1.9 | 1.8 | 2.1 | 1.8 |
| OECD | 1.8 | 2.6 | 2.4 | 2.0 | 1.9 | 1.8 | 1.1 | 2.1 | 2.6 | 2.9 | 3.0 | 2.3 |
| World | 3.3 | 3.7 | 3.8 | 3.6 | 3.5 | 3.4 | 3.7 | 3.9 | 4.5 | 5.0 | 4.5 | 3.4 |
Harmonised consumer price inflation in the EU economies and inflation measured by the consumer expenditure deflator in the rest of the world.
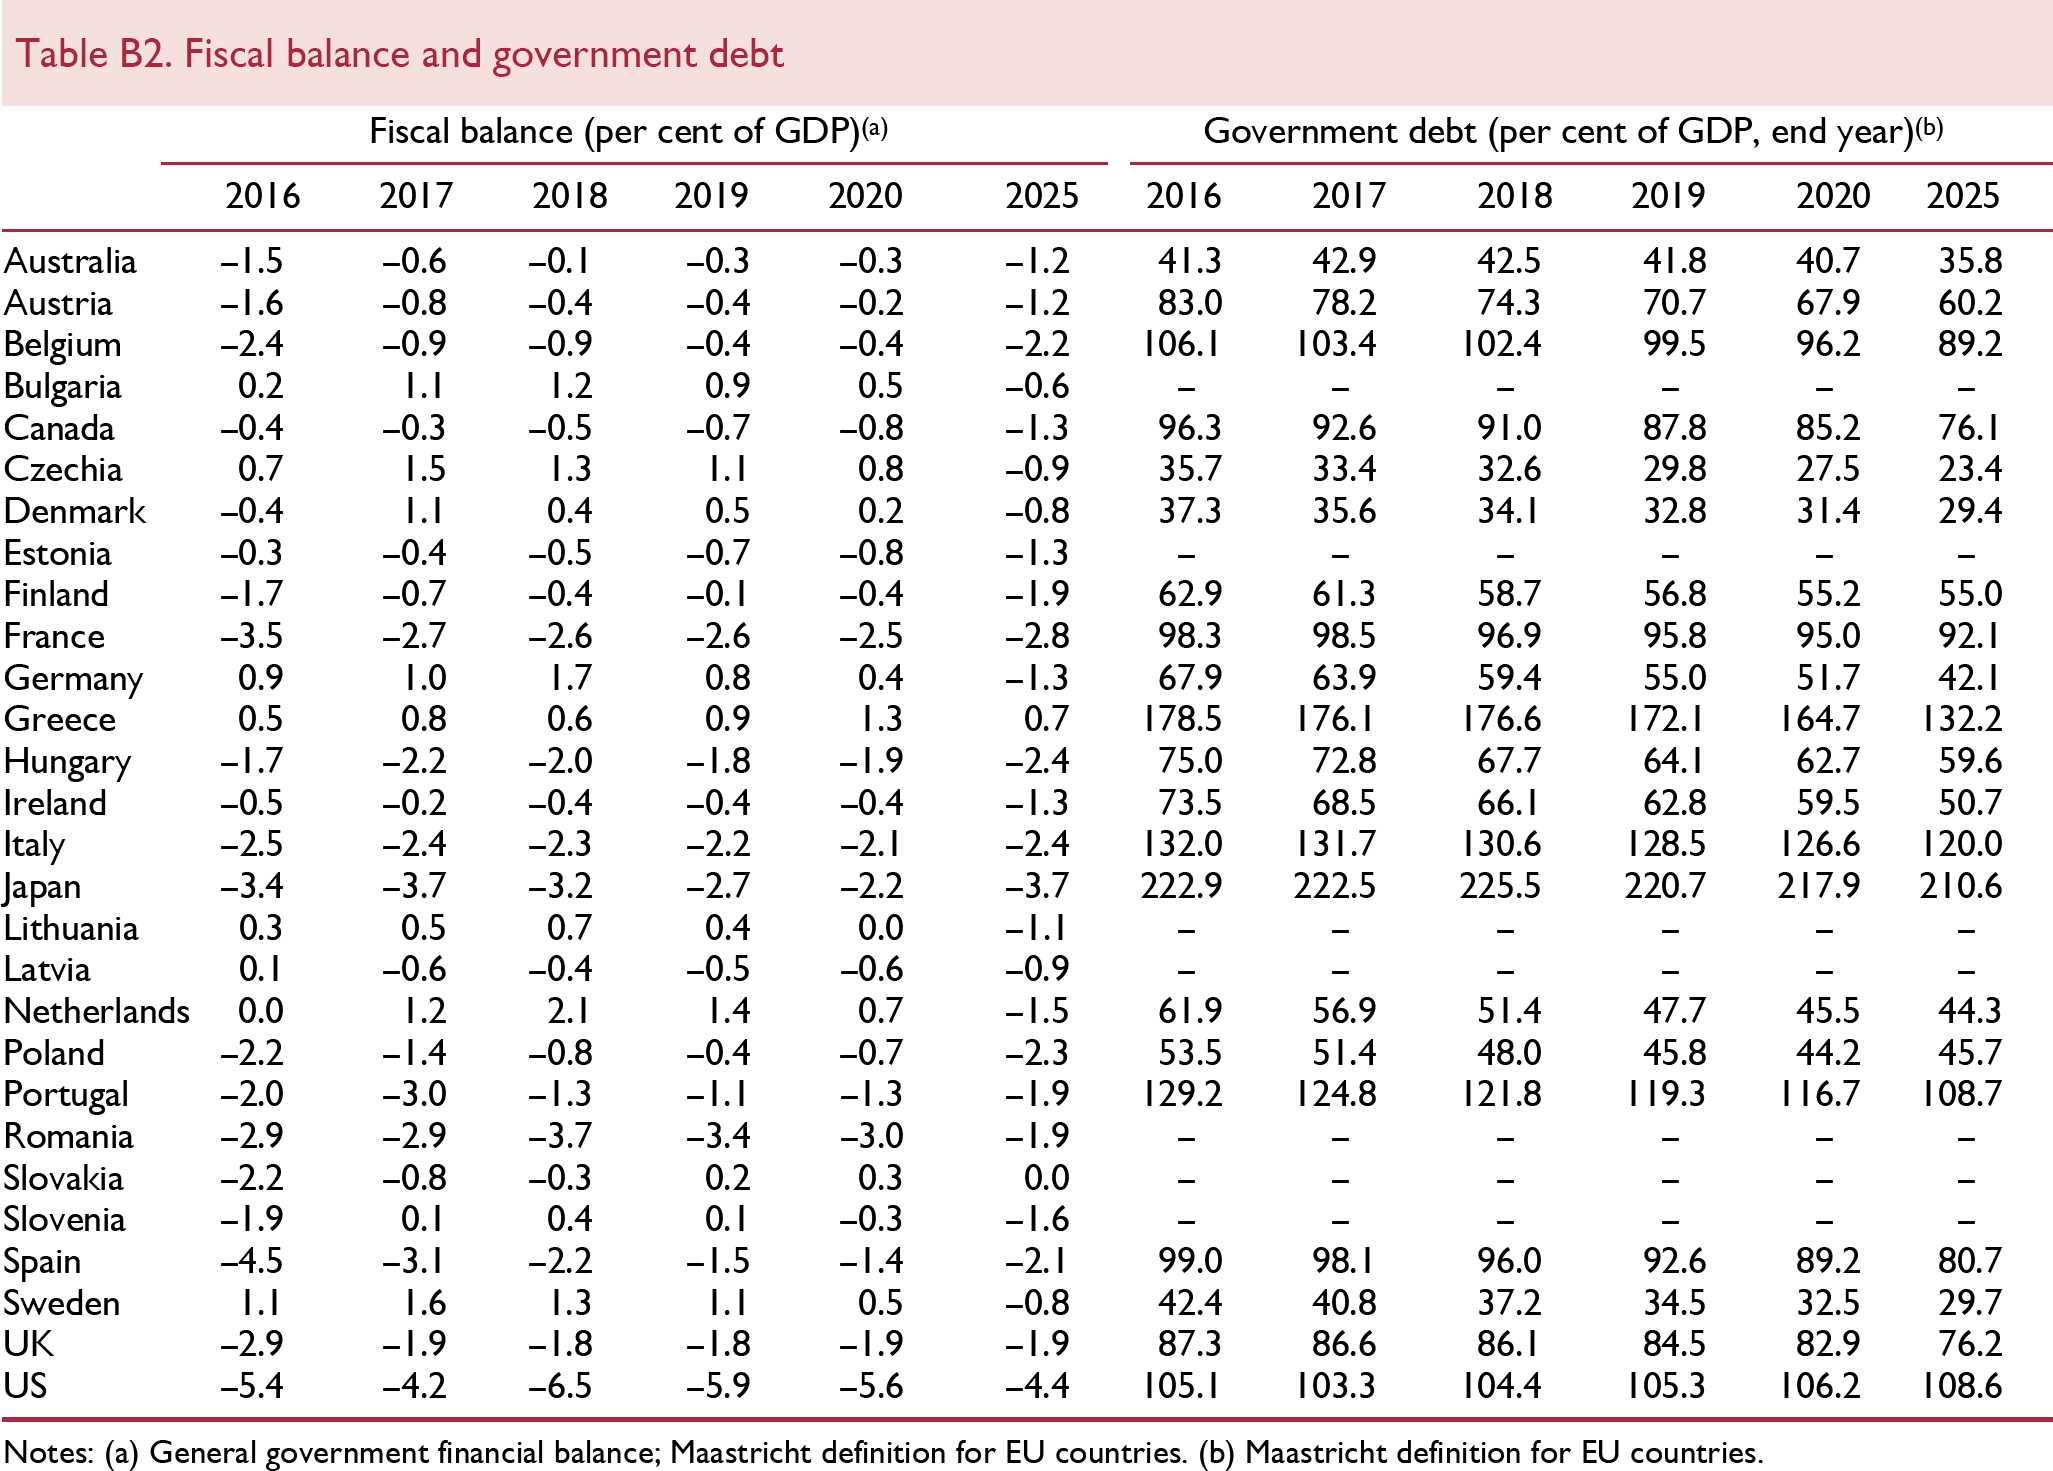
Fiscal balance and government debt
| Fiscal balance (per cent of GDP)(a) | Government debt (per cent of GDP, end year)(b) | |||||||||||
|---|---|---|---|---|---|---|---|---|---|---|---|---|
| 2016 | 2017 | 2018 | 2019 | 2020 | 2025 | 2016 | 2017 | 2018 | 2019 | 2020 | 2025 | |
| Australia | −1.5 | −0.6 | −0.1 | −0.3 | −0.3 | −1.2 | 41.3 | 42.9 | 42.5 | 41.8 | 40.7 | 35.8 |
| Austria | −1.6 | −0.8 | −0.4 | −0.4 | −0.2 | −1.2 | 83.0 | 78.2 | 74.3 | 70.7 | 67.9 | 60.2 |
| Belgium | −2.4 | −0.9 | −0.9 | −0.4 | −0.4 | −2.2 | 106.1 | 103.4 | 102.4 | 99.5 | 96.2 | 89.2 |
| Bulgaria | 0.2 | 1.1 | 1.2 | 0.9 | 0.5 | −0.6 | – | – | – | – | – | – |
| Canada | −0.4 | −0.3 | −0.5 | −0.7 | −0.8 | −1.3 | 96.3 | 92.6 | 91.0 | 87.8 | 85.2 | 76.1 |
| Czechia | 0.7 | 1.5 | 1.3 | 1.1 | 0.8 | −0.9 | 35.7 | 33.4 | 32.6 | 29.8 | 27.5 | 23.4 |
| Denmark | −0.4 | 1.1 | 0.4 | 0.5 | 0.2 | −0.8 | 37.3 | 35.6 | 34.1 | 32.8 | 31.4 | 29.4 |
| Estonia | −0.3 | −0.4 | −0.5 | −0.7 | −0.8 | −1.3 | – | – | – | – | – | – |
| Finland | −1.7 | −0.7 | −0.4 | −0.1 | −0.4 | −1.9 | 62.9 | 61.3 | 58.7 | 56.8 | 55.2 | 55.0 |
| France | −3.5 | −2.7 | −2.6 | −2.6 | −2.5 | −2.8 | 98.3 | 98.5 | 96.9 | 95.8 | 95.0 | 92.1 |
| Germany | 0.9 | 1.0 | 1.7 | 0.8 | 0.4 | −1.3 | 67.9 | 63.9 | 59.4 | 55.0 | 51.7 | 42.1 |
| Greece | 0.5 | 0.8 | 0.6 | 0.9 | 1.3 | 0.7 | 178.5 | 176.1 | 176.6 | 172.1 | 164.7 | 132.2 |
| Hungary | −1.7 | −2.2 | −2.0 | −1.8 | −1.9 | −2.4 | 75.0 | 72.8 | 67.7 | 64.1 | 62.7 | 59.6 |
| Ireland | −0.5 | −0.2 | −0.4 | −0.4 | −0.4 | −1.3 | 73.5 | 68.5 | 66.1 | 62.8 | 59.5 | 50.7 |
| Italy | −2.5 | −2.4 | −2.3 | −2.2 | −2.1 | −2.4 | 132.0 | 131.7 | 130.6 | 128.5 | 126.6 | 120.0 |
| Japan | −3.4 | −3.7 | −3.2 | −2.7 | −2.2 | −3.7 | 222.9 | 222.5 | 225.5 | 220.7 | 217.9 | 210.6 |
| Lithuania | 0.3 | 0.5 | 0.7 | 0.4 | 0.0 | −1.1 | – | – | – | – | – | – |
| Latvia | 0.1 | −0.6 | −0.4 | −0.5 | −0.6 | −0.9 | – | – | – | – | – | – |
| Netherlands | 0.0 | 1.2 | 2.1 | 1.4 | 0.7 | −1.5 | 61.9 | 56.9 | 51.4 | 47.7 | 45.5 | 44.3 |
| Poland | −2.2 | −1.4 | −0.8 | −0.4 | −0.7 | −2.3 | 53.5 | 51.4 | 48.0 | 45.8 | 44.2 | 45.7 |
| Portugal | −2.0 | −3.0 | −1.3 | −1.1 | −1.3 | −1.9 | 129.2 | 124.8 | 121.8 | 119.3 | 116.7 | 108.7 |
| Romania | −2.9 | −2.9 | −3.7 | −3.4 | −3.0 | −1.9 | – | – | – | – | – | – |
| Slovakia | −2.2 | −0.8 | −0.3 | 0.2 | 0.3 | 0.0 | – | – | – | – | – | – |
| Slovenia | −1.9 | 0.1 | 0.4 | 0.1 | −0.3 | −1.6 | – | – | – | – | – | – |
| Spain | −4.5 | −3.1 | −2.2 | −1.5 | −1.4 | −2.1 | 99.0 | 98.1 | 96.0 | 92.6 | 89.2 | 80.7 |
| Sweden | 1.1 | 1.6 | 1.3 | 1.1 | 0.5 | −0.8 | 42.4 | 40.8 | 37.2 | 34.5 | 32.5 | 29.7 |
| UK | −2.9 | −1.9 | −1.8 | −1.8 | −1.9 | −1.9 | 87.3 | 86.6 | 86.1 | 84.5 | 82.9 | 76.2 |
| US | –5.4 | –4.2 | –6.5 | –5.9 | –5.6 | –4.4 | 105.1 | 103.3 | 104.4 | 105.3 | 106.2 | 108.6 |
General government financial balance; Maastricht definition for EU countries.
Maastricht definition for EU countries.
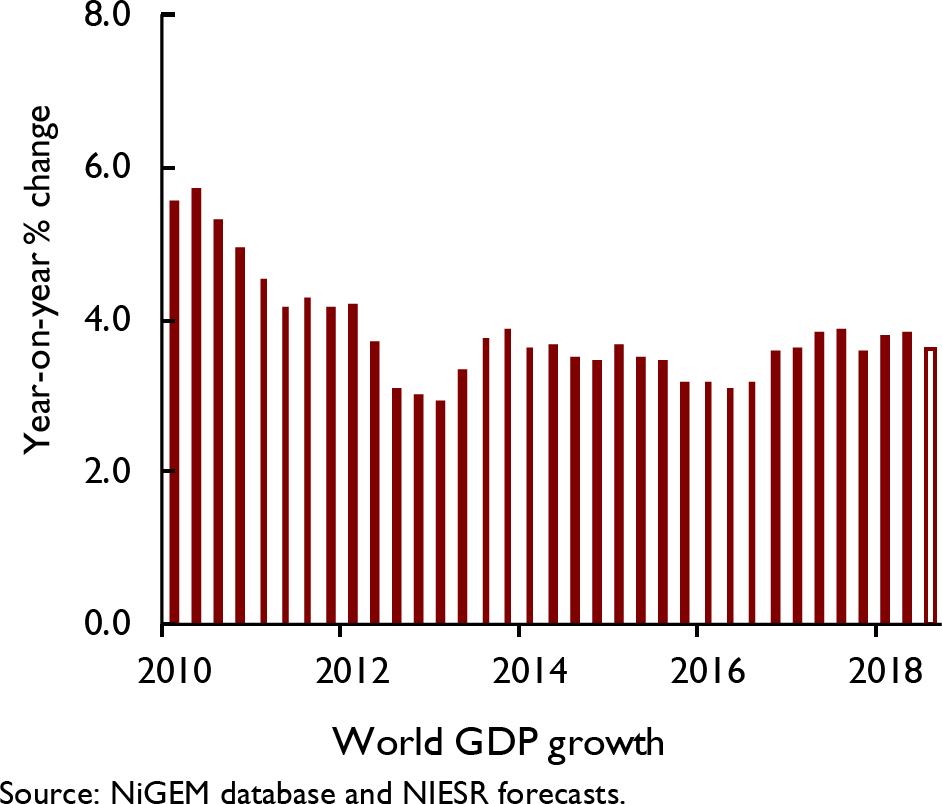
World GDP is estimated to have expanded by 3.6 per cent (year-on-year) in the third quarter of 2018
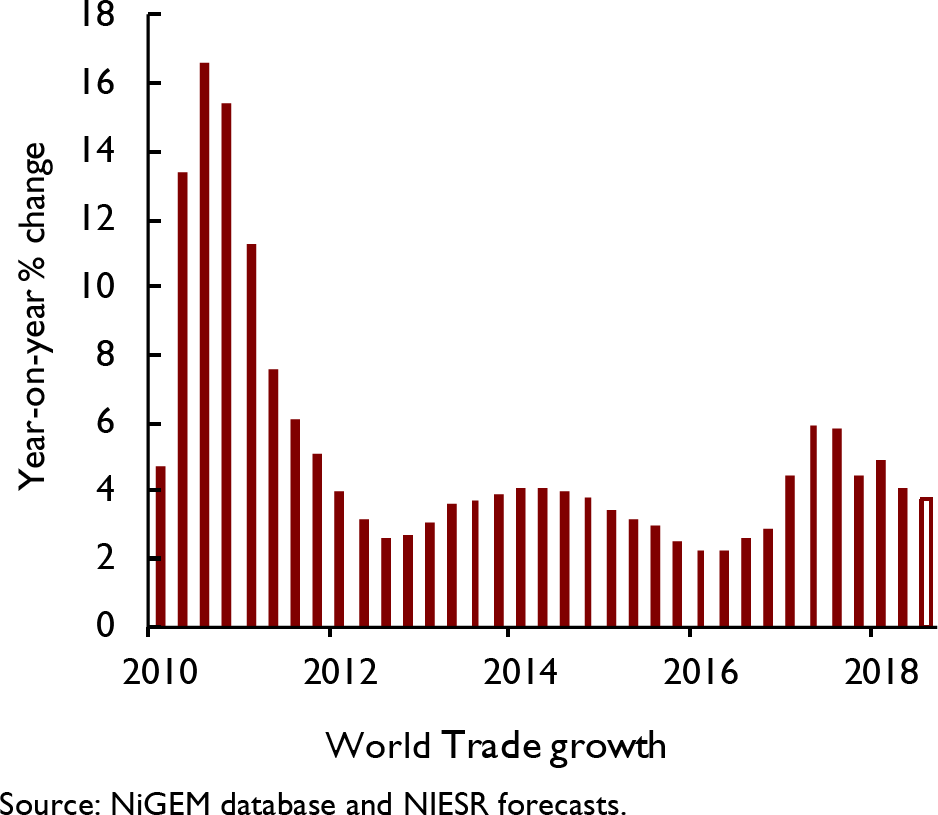
NIESR estimates that world trade grew by 3.8 per cent (year-on-year) in 2018Q3
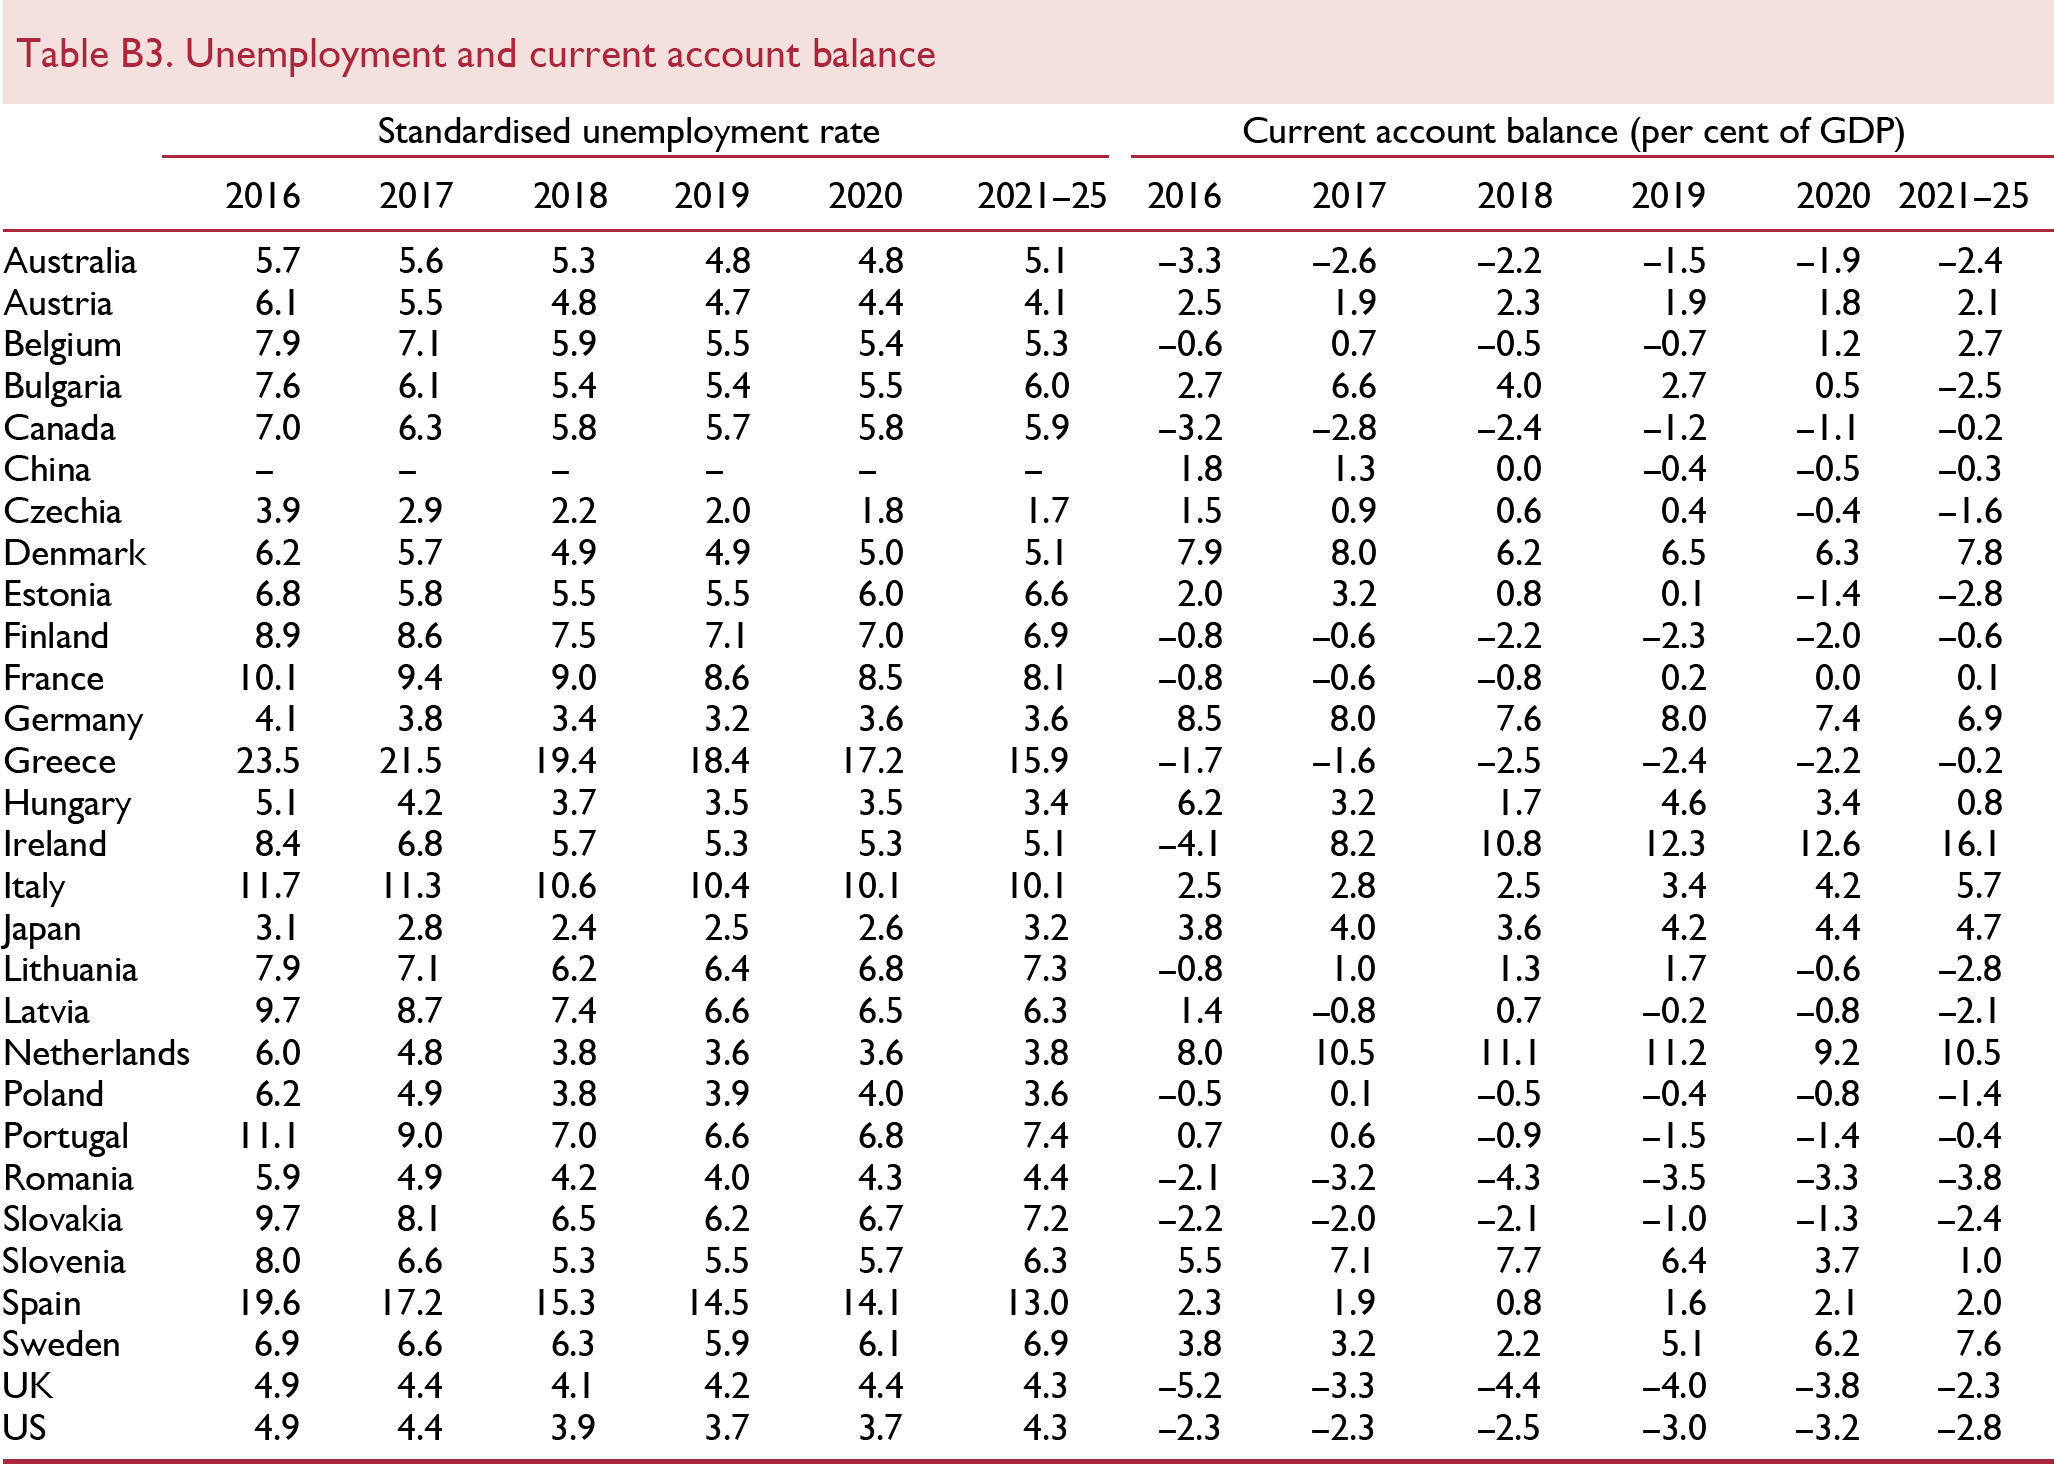
Unemployment and current account balance
| Standardised unemployment rate | Current account balance (per cent of GDP) | |||||||||||
|---|---|---|---|---|---|---|---|---|---|---|---|---|
| 2016 | 2017 | 2018 | 2019 | 2020 | 2021–25 | 2016 | 2017 | 2018 | 2019 | 2020 | 2021–25 | |
| Australia | 5.7 | 5.6 | 5.3 | 4.8 | 4.8 | 5.1 | −3.3 | −2.6 | −2.2 | −1.5 | −1.9 | −2.4 |
| Austria | 6.1 | 5.5 | 4.8 | 4.7 | 4.4 | 4.1 | 2.5 | 1.9 | 2.3 | 1.9 | 1.8 | 2.1 |
| Belgium | 7.9 | 7.1 | 5.9 | 5.5 | 5.4 | 5.3 | −0.6 | 0.7 | −0.5 | −0.7 | 1.2 | 2.7 |
| Bulgaria | 7.6 | 6.1 | 5.4 | 5.4 | 5.5 | 6.0 | 2.7 | 6.6 | 4.0 | 2.7 | 0.5 | −2.5 |
| Canada | 7.0 | 6.3 | 5.8 | 5.7 | 5.8 | 5.9 | −3.2 | −2.8 | −2.4 | −1.2 | −1.1 | −0.2 |
| China | - | - | - | - | - | - | 1.8 | 1.3 | 0.0 | −0.4 | −0.5 | −0.3 |
| Czechia | 3.9 | 2.9 | 2.2 | 2.0 | 1.8 | 1.7 | 1.5 | 0.9 | 0.6 | 0.4 | −0.4 | −1.6 |
| Denmark | 6.2 | 5.7 | 4.9 | 4.9 | 5.0 | 5.1 | 7.9 | 8.0 | 6.2 | 6.5 | 6.3 | 7.8 |
| Estonia | 6.8 | 5.8 | 5.5 | 5.5 | 6.0 | 6.6 | 2.0 | 3.2 | 0.8 | 0.1 | −1.4 | −2.8 |
| Finland | 8.9 | 8.6 | 7.5 | 7.1 | 7.0 | 6.9 | −0.8 | −0.6 | −2.2 | −2.3 | −2.0 | −0.6 |
| France | 10.1 | 9.4 | 9.0 | 8.6 | 8.5 | 8.1 | −0.8 | −0.6 | −0.8 | 0.2 | 0.0 | 0.1 |
| Germany | 4.1 | 3.8 | 3.4 | 3.2 | 3.6 | 3.6 | 8.5 | 8.0 | 7.6 | 8.0 | 7.4 | 6.9 |
| Greece | 23.5 | 21.5 | 19.4 | 18.4 | 17.2 | 15.9 | −1.7 | −1.6 | −2.5 | −2.4 | −2.2 | −0.2 |
| Hungary | 5.1 | 4.2 | 3.7 | 3.5 | 3.5 | 3.4 | 6.2 | 3.2 | 1.7 | 4.6 | 3.4 | 0.8 |
| Ireland | 8.4 | 6.8 | 5.7 | 5.3 | 5.3 | 5.1 | −4.1 | 8.2 | 10.8 | 12.3 | 12.6 | 16.1 |
| Italy | 11.7 | 11.3 | 10.6 | 10.4 | 10.1 | 10.1 | 2.5 | 2.8 | 2.5 | 3.4 | 4.2 | 5.7 |
| Japan | 3.1 | 2.8 | 2.4 | 2.5 | 2.6 | 3.2 | 3.8 | 4.0 | 3.6 | 4.2 | 4.4 | 4.7 |
| Lithuania | 7.9 | 7.1 | 6.2 | 6.4 | 6.8 | 7.3 | −0.8 | 1.0 | 1.3 | 1.7 | −0.6 | −2.8 |
| Latvia | 9.7 | 8.7 | 7.4 | 6.6 | 6.5 | 6.3 | 1.4 | −0.8 | 0.7 | −0.2 | −0.8 | −2.1 |
| Netherlands | 6.0 | 4.8 | 3.8 | 3.6 | 3.6 | 3.8 | 8.0 | 10.5 | 11.1 | 11.2 | 9.2 | 10.5 |
| Poland | 6.2 | 4.9 | 3.8 | 3.9 | 4.0 | 3.6 | −0.5 | 0.1 | −0.5 | −0.4 | −0.8 | −1.4 |
| Portugal | 11.1 | 9.0 | 7.0 | 6.6 | 6.8 | 7.4 | 0.7 | 0.6 | −0.9 | −1.5 | −1.4 | −0.4 |
| Romania | 5.9 | 4.9 | 4.2 | 4.0 | 4.3 | 4.4 | −2.1 | −3.2 | −4.3 | −3.5 | −3.3 | −3.8 |
| Slovakia | 9.7 | 8.1 | 6.5 | 6.2 | 6.7 | 7.2 | −2.2 | −2.0 | −2.1 | −1.0 | −1.3 | −2.4 |
| Slovenia | 8.0 | 6.6 | 5.3 | 5.5 | 5.7 | 6.3 | 5.5 | 7.1 | 7.7 | 6.4 | 3.7 | 1.0 |
| Spain | 19.6 | 17.2 | 15.3 | 14.5 | 14.1 | 13.0 | 2.3 | 1.9 | 0.8 | 1.6 | 2.1 | 2.0 |
| Sweden | 6.9 | 6.6 | 6.3 | 5.9 | 6.1 | 6.9 | 3.8 | 3.2 | 2.2 | 5.1 | 6.2 | 7.6 |
| UK | 4.9 | 4.4 | 4.1 | 4.2 | 4.4 | 4.3 | −5.2 | −3.3 | −4.4 | −4.0 | −3.8 | −2.3 |
| US | 4.9 | 4.4 | 3.9 | 3.7 | 3.7 | 4.3 | –2.3 | –2.3 | –2.5 | –3.0 | –3.2 | –2.8 |
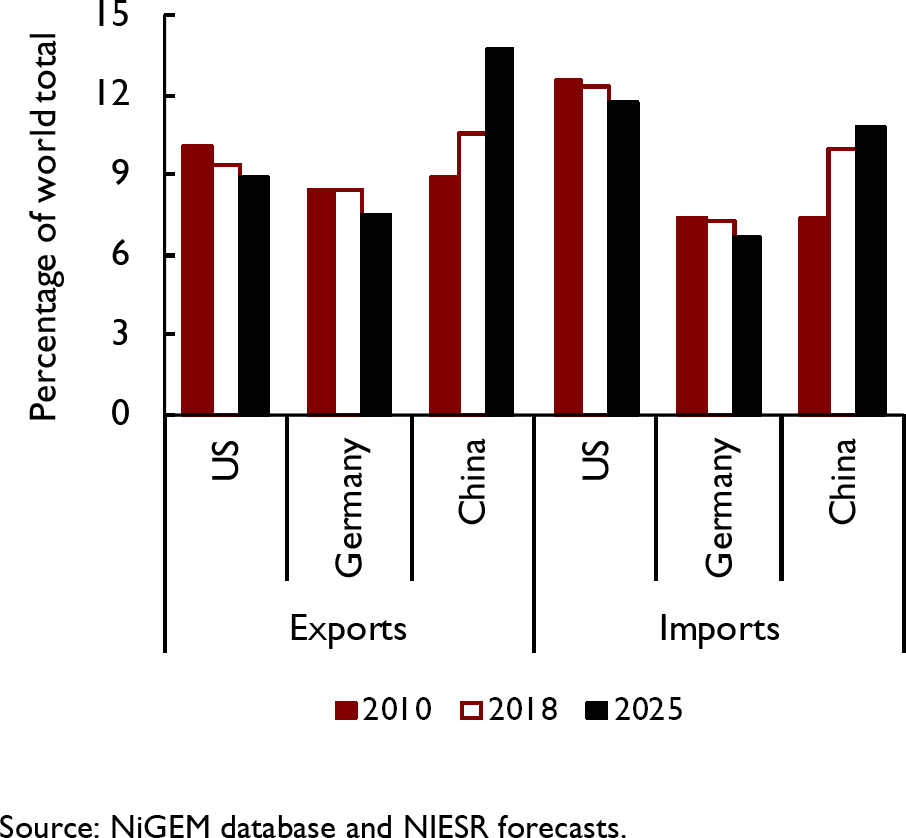
China is not expected to become the world's largest importer of goods and services before the end of our forecast horizon
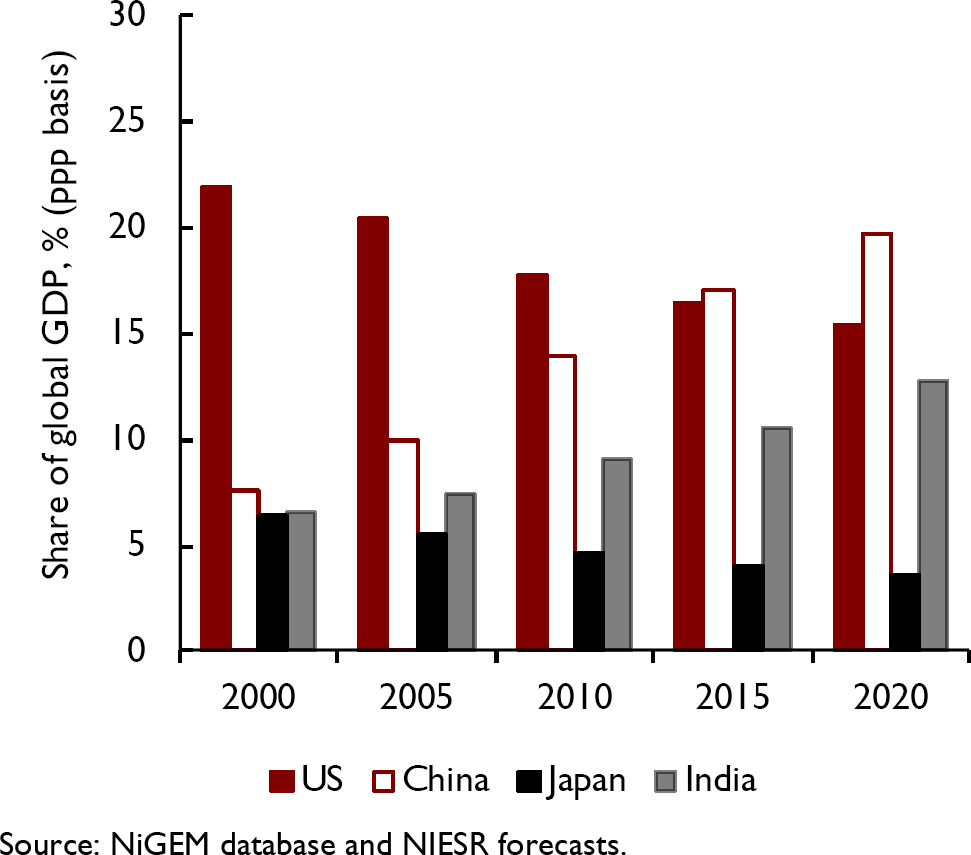
Since 2014, on a PPP basis, China has remained the world's largest economy
United States Percentage change

| 2015 | 2016 | 2017 | 2018 | 2019 | 2020 | Average 2021–25 | |
|---|---|---|---|---|---|---|---|
| GDP | 2.9 | 1.6 | 2.2 | 2.9 | 2.5 | 2.2 | 1.9 |
| Consumption | 3.7 | 2.7 | 2.5 | 2.7 | 2.8 | 2.5 | 1.9 |
| Investment : housing | 10.1 | 6.5 | 3.3 | 0.2 | 1.7 | 2.7 | 2.1 |
| : business | 1.8 | 0.5 | 5.3 | 7.0 | 4.6 | 3.2 | 1.6 |
| Government : consumption | 1.7 | 1.5 | −0.1 | 1.3 | 1.5 | 1.5 | 1.7 |
| : investment | 2.6 | 1.2 | 0.0 | 2.8 | 2.1 | 1.6 | 1.7 |
| Stockbuilding(a) | 0.3 | −0.6 | 0.0 | 0.1 | 0.3 | 0.0 | 0.0 |
| Total domestic demand | 3.5 | 1.7 | 2.5 | 3.1 | 3.0 | 2.4 | 1.8 |
| Export volumes | 0.6 | −0.1 | 3.0 | 4.1 | 2.8 | 2.7 | 3.1 |
| Import volumes | 5.5 | 1.9 | 4.6 | 5.0 | 5.5 | 3.8 | 2.4 |
| Average earnings | 2.8 | 1.0 | 2.8 | 2.2 | 3.0 | 3.5 | 3.3 |
| Private consumption deflator | 0.3 | 1.1 | 1.8 | 2.0 | 1.9 | 2.1 | 2.0 |
| RPDI | 4.0 | 1.7 | 2.5 | 2.6 | 2.5 | 2.4 | 1.7 |
| Unemployment, % | 5.3 | 4.9 | 4.4 | 3.9 | 3.7 | 3.7 | 4.3 |
| General Govt. balance as % of GDP | −4.7 | −5.4 | −4.2 | −6.5 | −5.9 | −5.6 | −4.8 |
| General Govt. debt as % of GDP(b) | 103.7 | 105.1 | 103.3 | 104.4 | 105.3 | 106.2 | 107.7 |
| Current account as % of GDP | –2.2 | –2.3 | –2.3 | –2.5 | –3.0 | –3.2 | –2.8 |
Change as a percentage of GDP.
End–of–year basis.
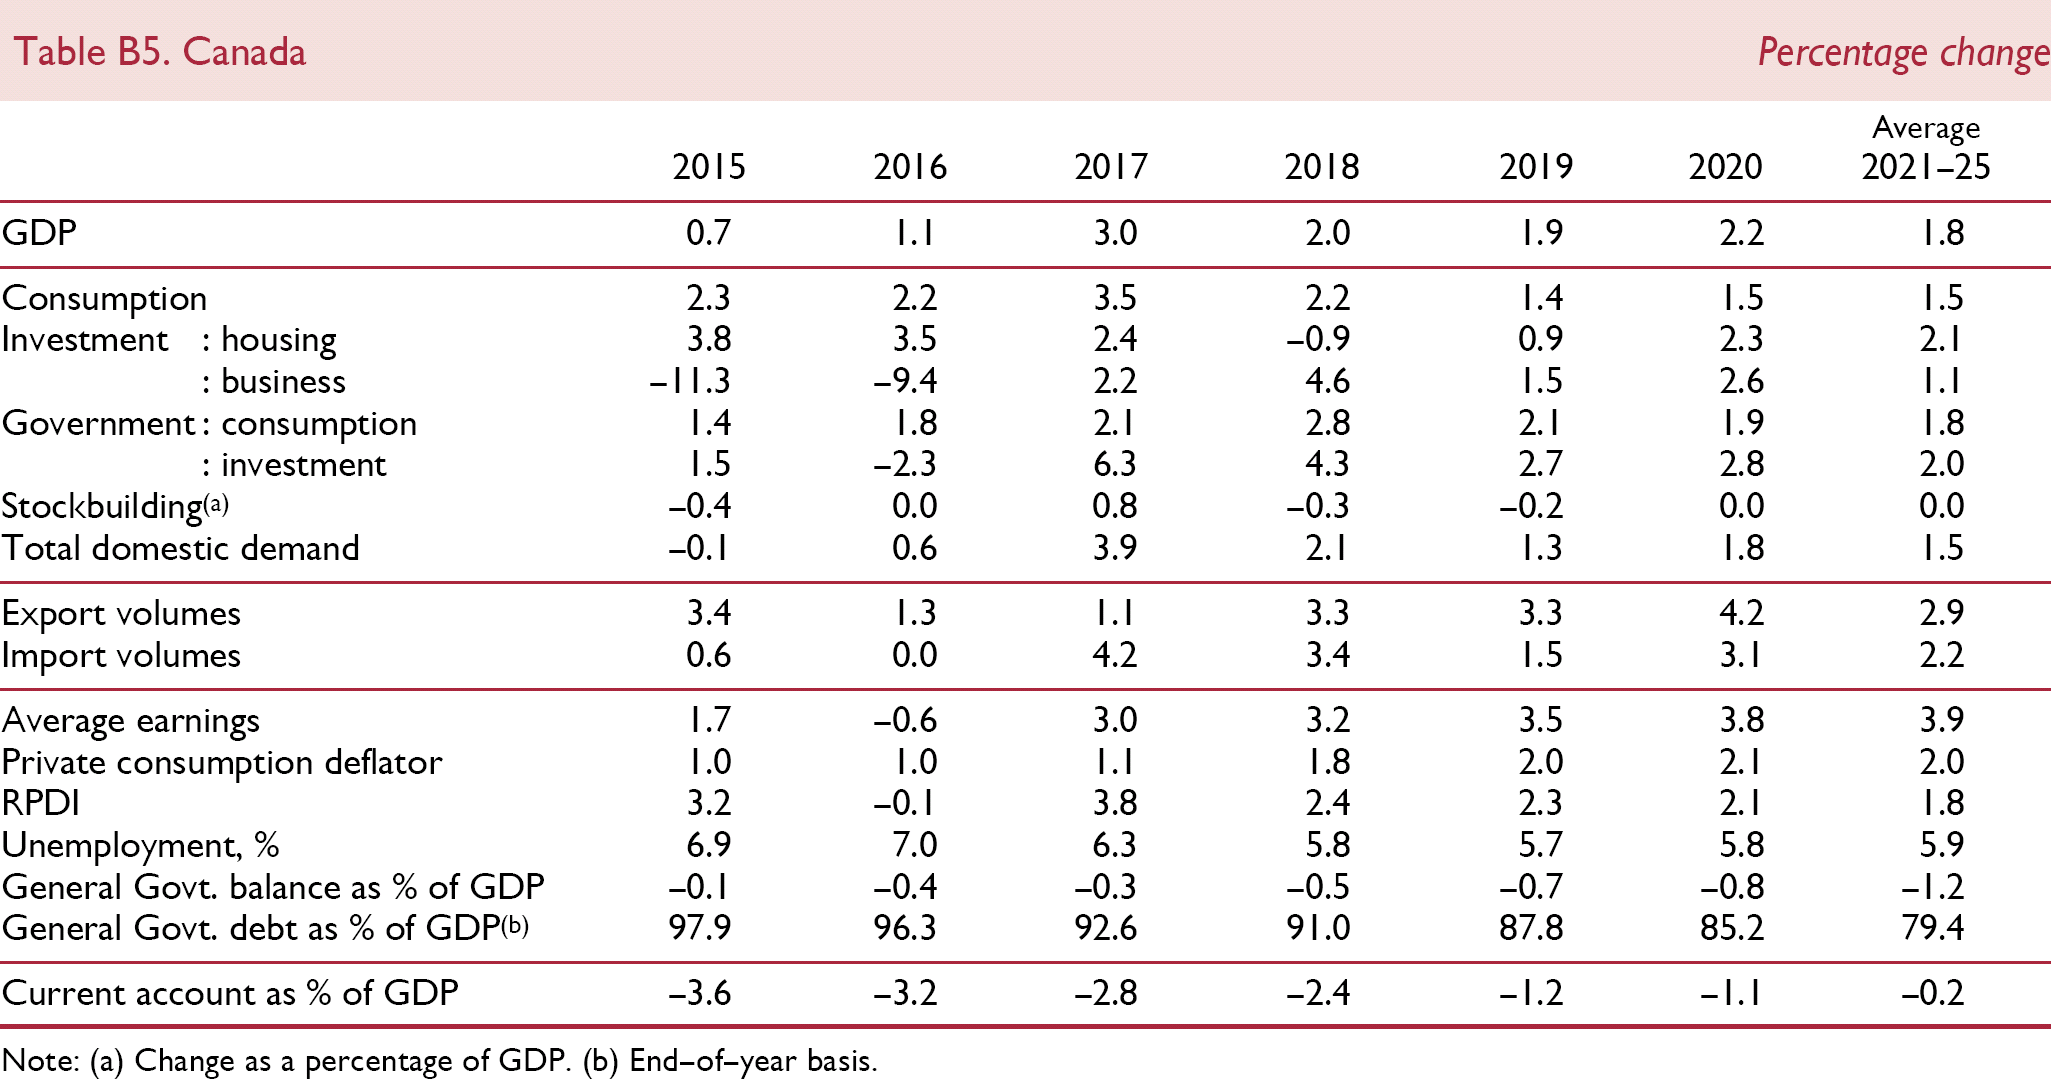
Canada Percentage change
| 2015 | 2016 | 2017 | 2018 | 2019 | 2020 | Average 2021–25 | |
|---|---|---|---|---|---|---|---|
| GDP | 0.7 | 1.1 | 3.0 | 2.0 | 1.9 | 2.2 | 1.8 |
| Consumption | 2.3 | 2.2 | 3.5 | 2.2 | 1.4 | 1.5 | 1.5 |
| Investment : housing | 3.8 | 3.5 | 2.4 | −0.9 | 0.9 | 2.3 | 2.1 |
| : business | −11.3 | −9.4 | 2.2 | 4.6 | 1.5 | 2.6 | 1.1 |
| Government : consumption | 1.4 | 1.8 | 2.1 | 2.8 | 2.1 | 1.9 | 1.8 |
| : investment | 1.5 | −2.3 | 6.3 | 4.3 | 2.7 | 2.8 | 2.0 |
| Stockbuilding(a) | −0.4 | 0.0 | 0.8 | −0.3 | −0.2 | 0.0 | 0.0 |
| Total domestic demand | –0.1 | 0.6 | 3.9 | 2.1 | 1.3 | 1.8 | 1.5 |
| Export volumes | 3.4 | 1.3 | 1.1 | 3.3 | 3.3 | 4.2 | 2.9 |
| Import volumes | 0.6 | 0.0 | 4.2 | 3.4 | 1.5 | 3.1 | 2.2 |
| Average earnings | 1.7 | −0.6 | 3.0 | 3.2 | 3.5 | 3.8 | 3.9 |
| Private consumption deflator | 1.0 | 1.0 | 1.1 | 1.8 | 2.0 | 2.1 | 2.0 |
| RPDI | 3.2 | −0.1 | 3.8 | 2.4 | 2.3 | 2.1 | 1.8 |
| Unemployment, % | 6.9 | 7.0 | 6.3 | 5.8 | 5.7 | 5.8 | 5.9 |
| General Govt. balance as % of GDP | −0.1 | −0.4 | −0.3 | −0.5 | −0.7 | −0.8 | −1.2 |
| General Govt. debt as % of GDP(b) | 97.9 | 96.3 | 92.6 | 91.0 | 87.8 | 85.2 | 79.4 |
| Current account as % of GDP | –3.6 | –3.2 | –2.8 | –2.4 | –1.2 | –1.1 | –0.2 |
Change as a percentage of GDP.
End–of–year basis.
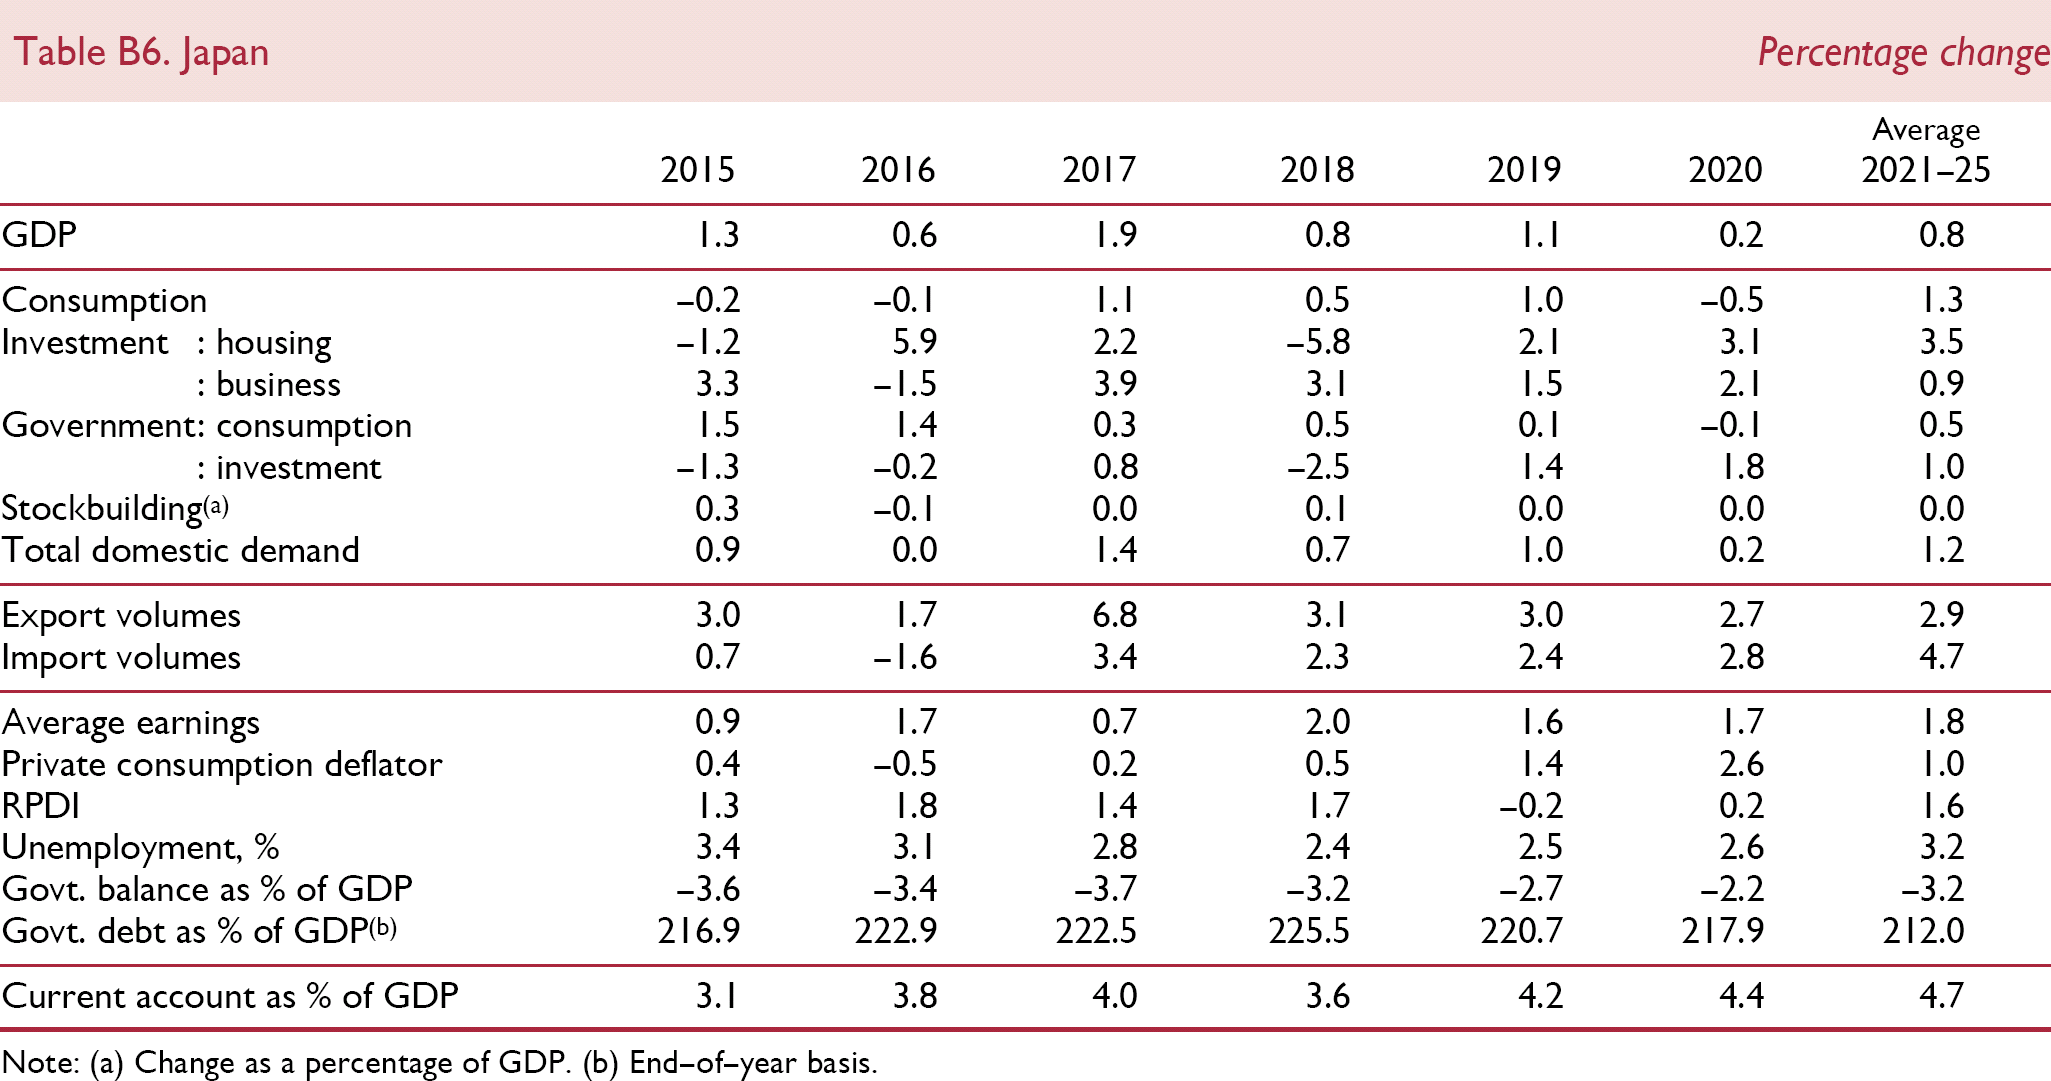
Japan Percentage change
| 2015 | 2016 | 2017 | 2018 | 2019 | 2020 | Average 2021–25 | |
|---|---|---|---|---|---|---|---|
| GDP | 1.3 | 0.6 | 1.9 | 0.8 | 1.1 | 0.2 | 0.8 |
| Consumption | −0.2 | −0.1 | 1.1 | 0.5 | 1.0 | −0.5 | 1.3 |
| Investment : housing | −1.2 | 5.9 | 2.2 | −5.8 | 2.1 | 3.1 | 3.5 |
| : business | 3.3 | −1.5 | 3.9 | 3.1 | 1.5 | 2.1 | 0.9 |
| Government: consumption | 1.5 | 1.4 | 0.3 | 0.5 | 0.1 | −0.1 | 0.5 |
| : investment | −1.3 | −0.2 | 0.8 | −2.5 | 1.4 | 1.8 | 1.0 |
| Stockbuilding(a) | 0.3 | −0.1 | 0.0 | 0.1 | 0.0 | 0.0 | 0.0 |
| Total domestic demand | 0.9 | 0.0 | 1.4 | 0.7 | 1.0 | 0.2 | 1.2 |
| Export volumes | 3.0 | 1.7 | 6.8 | 3.1 | 3.0 | 2.7 | 2.9 |
| Import volumes | 0.7 | –1.6 | 3.4 | 2.3 | 2.4 | 2.8 | 4.7 |
| Average earnings | 0.9 | 1.7 | 0.7 | 2.0 | 1.6 | 1.7 | 1.8 |
| Private consumption deflator | 0.4 | −0.5 | 0.2 | 0.5 | 1.4 | 2.6 | 1.0 |
| RPDI | 1.3 | 1.8 | 1.4 | 1.7 | −0.2 | 0.2 | 1.6 |
| Unemployment, % | 3.4 | 3.1 | 2.8 | 2.4 | 2.5 | 2.6 | 3.2 |
| Govt. balance as % of GDP | −3.6 | −3.4 | −3.7 | −3.2 | −2.7 | −2.2 | −3.2 |
| Govt. debt as % of GDP(b) | 216.9 | 222.9 | 222.5 | 225.5 | 220.7 | 217.9 | 212.0 |
| Current account as % of GDP | 3.1 | 3.8 | 4.0 | 3.6 | 4.2 | 4.4 | 4.7 |
Change as a percentage of GDP.
End–of–year basis.
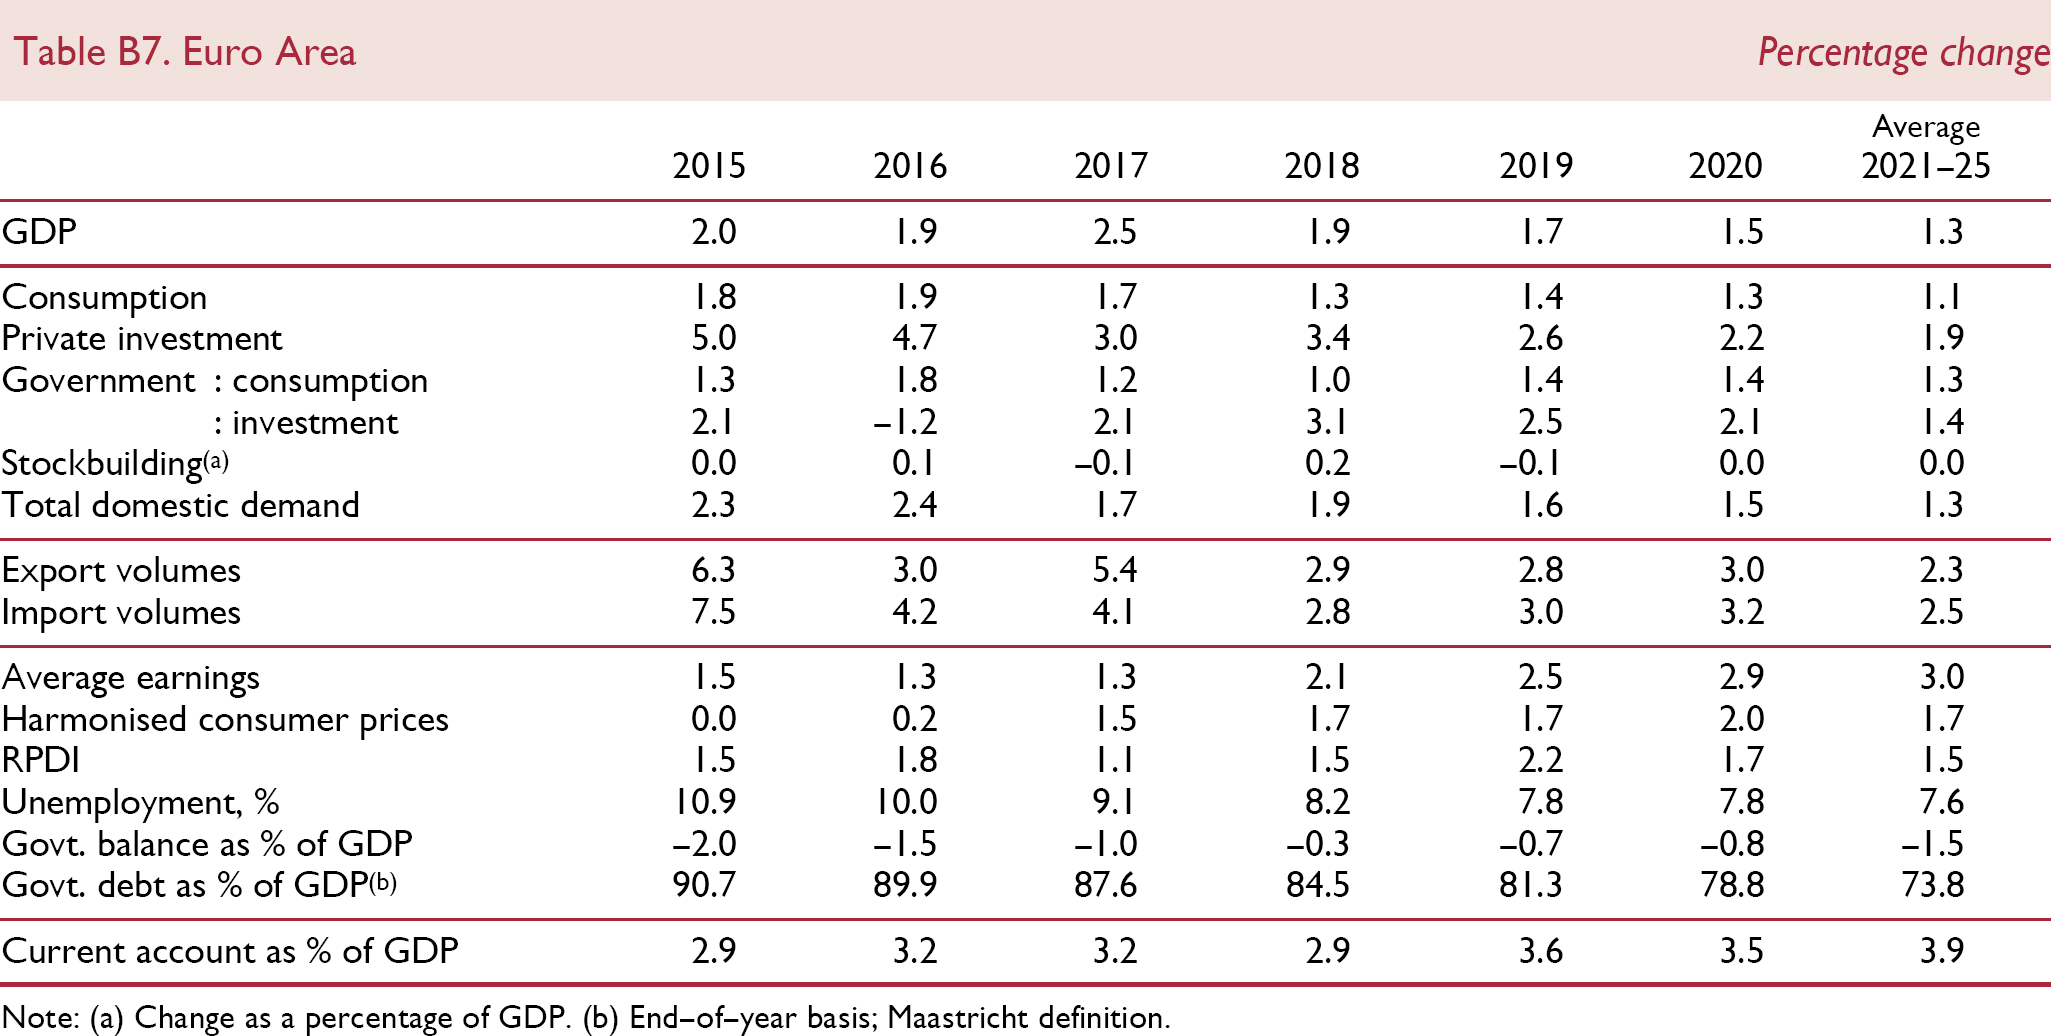
Euro Area Percentage change
| 2015 | 2016 | 2017 | 2018 | 2019 | 2020 | Average 2021–25 | |
|---|---|---|---|---|---|---|---|
| GDP | 2.0 | 1.9 | 2.5 | 1.9 | 1.7 | 1.5 | 1.3 |
| Consumption | 1.8 | 1.9 | 1.7 | 1.3 | 1.4 | 1.3 | 1.1 |
| Private investment | 5.0 | 4.7 | 3.0 | 3.4 | 2.6 | 2.2 | 1.9 |
| Government : consumption | 1.3 | 1.8 | 1.2 | 1.0 | 1.4 | 1.4 | 1.3 |
| : investment | 2.1 | −1.2 | 2.1 | 3.1 | 2.5 | 2.1 | 1.4 |
| Stockbuilding(a) | 0.0 | 0.1 | −0.1 | 0.2 | −0.1 | 0.0 | 0.0 |
| Total domestic demand | 2.3 | 2.4 | 1.7 | 1.9 | 1.6 | 1.5 | 1.3 |
| Export volumes | 6.3 | 3.0 | 5.4 | 2.9 | 2.8 | 3.0 | 2.3 |
| Import volumes | 7.5 | 4.2 | 4.1 | 2.8 | 3.0 | 3.2 | 2.5 |
| Average earnings | 1.5 | 1.3 | 1.3 | 2.1 | 2.5 | 2.9 | 3.0 |
| Harmonised consumer prices | 0.0 | 0.2 | 1.5 | 1.7 | 1.7 | 2.0 | 1.7 |
| RPDI | 1.5 | 1.8 | 1.1 | 1.5 | 2.2 | 1.7 | 1.5 |
| Unemployment, % | 10.9 | 10.0 | 9.1 | 8.2 | 7.8 | 7.8 | 7.6 |
| Govt. balance as % of GDP | −2.0 | −1.5 | −1.0 | −0.3 | −0.7 | −0.8 | −1.5 |
| Govt. debt as % of GDP(b) | 90.7 | 89.9 | 87.6 | 84.5 | 81.3 | 78.8 | 73.8 |
| Current account as % of GDP | 2.9 | 3.2 | 3.2 | 2.9 | 3.6 | 3.5 | 3.9 |
Change as a percentage of GDP.
End–of–year basis; Maastricht definition.
Germany Percentage change

| 2015 | 2016 | 2017 | 2018 | 2019 | 2020 | Average 2021–25 | |
|---|---|---|---|---|---|---|---|
| GDP | 1.5 | 2.2 | 2.5 | 1.5 | 1.3 | 1.3 | 1.2 |
| Consumption | 1.6 | 1.9 | 2.0 | 1.2 | 2.1 | 1.6 | 0.8 |
| Investment : housing | −1.3 | 4.7 | 3.8 | 4.0 | 2.5 | 2.4 | 4.5 |
| : business | 1.6 | 2.5 | 3.2 | 2.2 | 2.4 | 2.4 | 1.4 |
| Government : consumption | 2.9 | 4.0 | 1.6 | 0.9 | 1.8 | 1.4 | 0.8 |
| : investment | 4.3 | 5.0 | 5.3 | 5.5 | 4.2 | 2.5 | 0.8 |
| Stockbuilding(a) | −0.3 | 0.3 | −0.1 | 0.4 | −0.4 | 0.0 | 0.0 |
| Total domestic demand | 1.4 | 2.9 | 2.2 | 1.9 | 1.8 | 1.7 | 1.2 |
| Export volumes | 4.7 | 2.1 | 5.3 | 2.1 | 1.7 | 2.4 | 2.1 |
| Import volumes | 5.2 | 4.0 | 5.3 | 3.2 | 2.7 | 3.5 | 2.3 |
| Average earnings | 2.9 | 2.7 | 2.2 | 2.8 | 3.2 | 2.9 | 3.3 |
| Harmonised consumer prices | 0.1 | 0.4 | 1.7 | 1.8 | 1.9 | 2.1 | 1.8 |
| RPDI | 1.9 | 2.2 | 1.9 | 1.8 | 2.9 | 0.9 | 1.1 |
| Unemployment, % | 4.7 | 4.1 | 3.8 | 3.4 | 3.2 | 3.6 | 3.6 |
| Govt. balance as % of GDP | 0.8 | 0.9 | 1.0 | 1.7 | 0.8 | 0.4 | −0.7 |
| Govt. debt as % of GDP(b) | 70.8 | 67.9 | 63.9 | 59.4 | 55.0 | 51.7 | 45.0 |
| Current account as % of GDP | 8.9 | 8.5 | 8.0 | 7.6 | 8.0 | 7.4 | 6.9 |
Change as a percentage of GDP.
End–of–year basis; Maastricht definition.
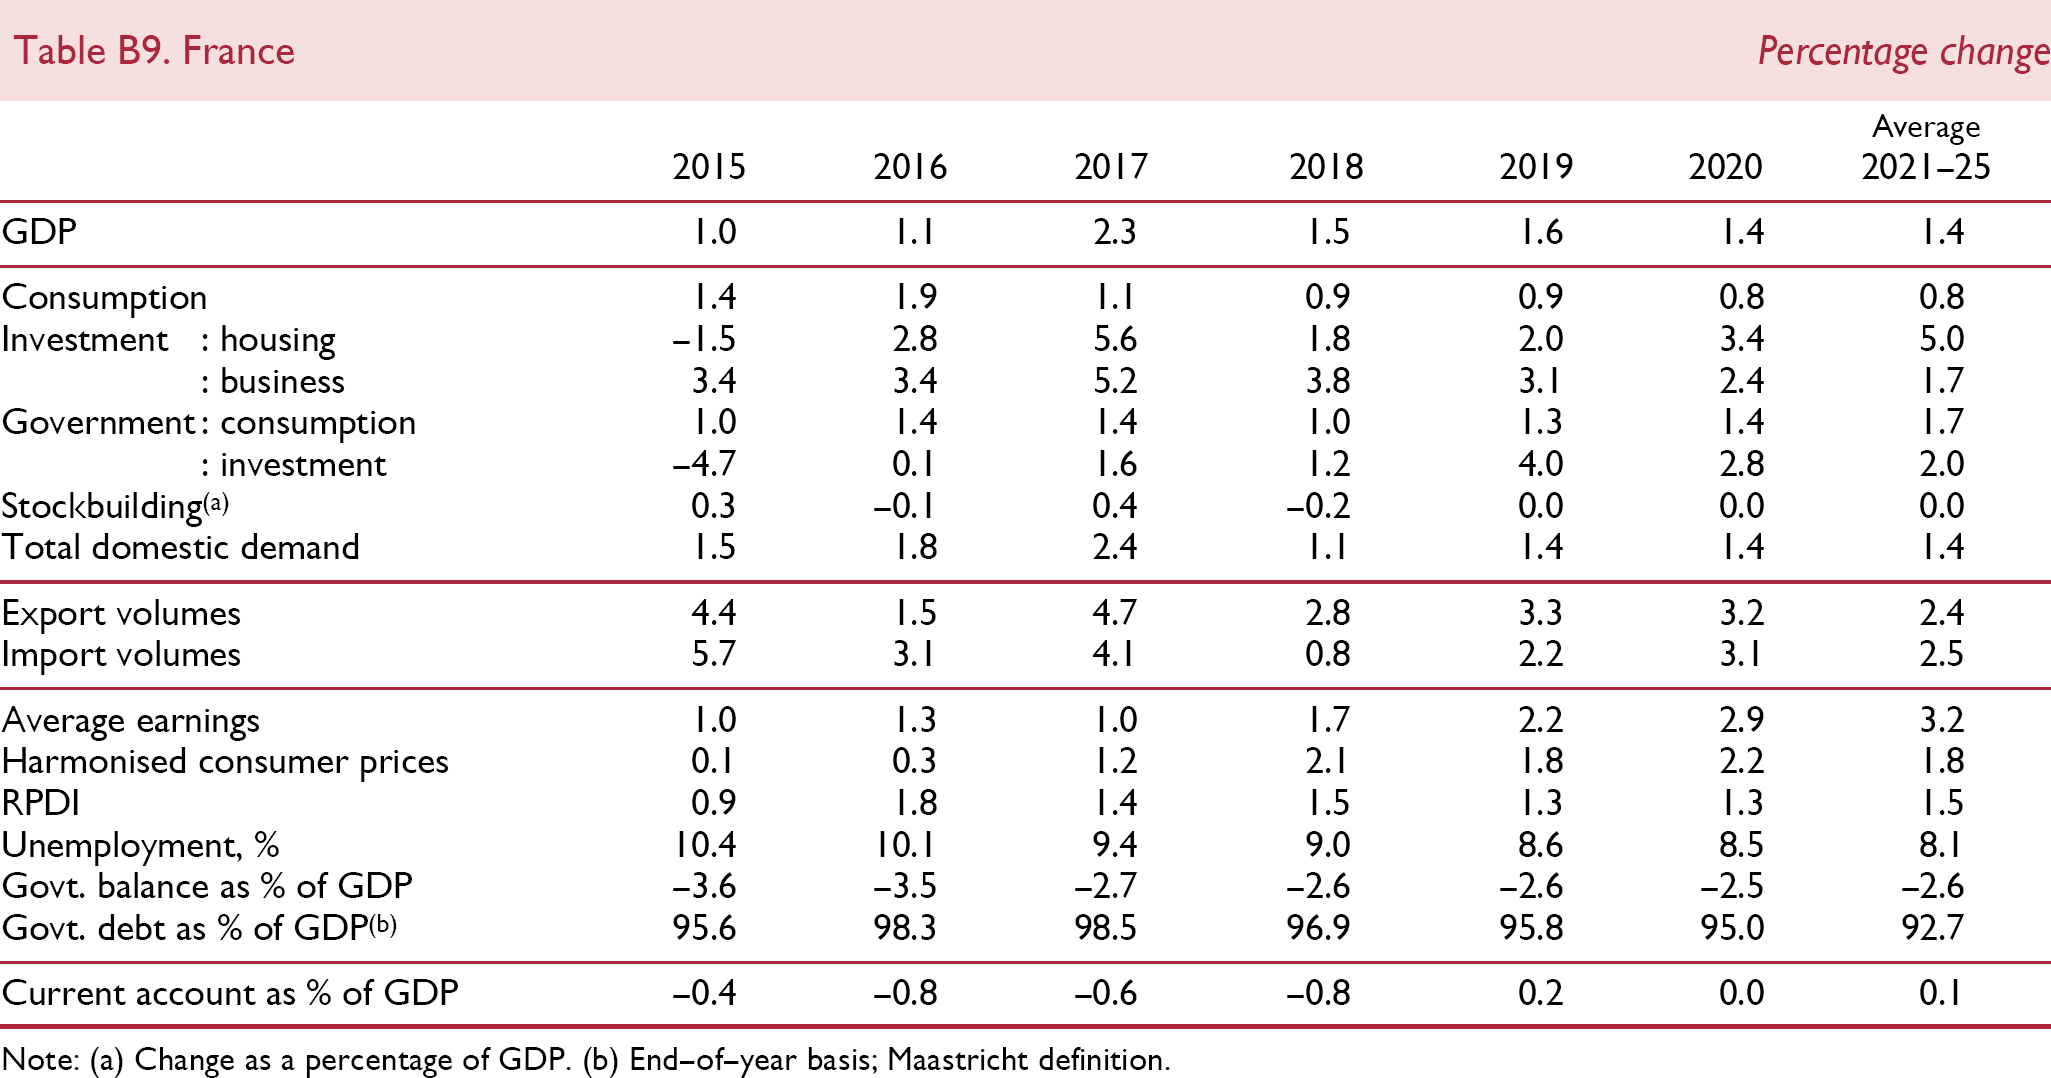
France Percentage change
| 2015 | 2016 | 2017 | 2018 | 2019 | 2020 | Average 2021–25 | |
|---|---|---|---|---|---|---|---|
| GDP | 1.0 | 1.1 | 2.3 | 1.5 | 1.6 | 1.4 | 1.4 |
| Consumption | 1.4 | 1.9 | 1.1 | 0.9 | 0.9 | 0.8 | 0.8 |
| Investment : housing | −1.5 | 2.8 | 5.6 | 1.8 | 2.0 | 3.4 | 5.0 |
| : business | 3.4 | 3.4 | 5.2 | 3.8 | 3.1 | 2.4 | 1.7 |
| Government : consumption | 1.0 | 1.4 | 1.4 | 1.0 | 1.3 | 1.4 | 1.7 |
| : investment | −4.7 | 0.1 | 1.6 | 1.2 | 4.0 | 2.8 | 2.0 |
| Stockbuilding(a) | 0.3 | −0.1 | 0.4 | −0.2 | 0.0 | 0.0 | 0.0 |
| Total domestic demand | 1.5 | 1.8 | 2.4 | 1.1 | 1.4 | 1.4 | 1.4 |
| Export volumes | 4.4 | 1.5 | 4.7 | 2.8 | 3.3 | 3.2 | 2.4 |
| Import volumes | 5.7 | 3.1 | 4.1 | 0.8 | 2.2 | 3.1 | 2.5 |
| Average earnings | 1.0 | 1.3 | 1.0 | 1.7 | 2.2 | 2.9 | 3.2 |
| Harmonised consumer prices | 0.1 | 0.3 | 1.2 | 2.1 | 1.8 | 2.2 | 1.8 |
| RPDI | 0.9 | 1.8 | 1.4 | 1.5 | 1.3 | 1.3 | 1.5 |
| Unemployment, % | 10.4 | 10.1 | 9.4 | 9.0 | 8.6 | 8.5 | 8.1 |
| Govt. balance as % of GDP | −3.6 | −3.5 | −2.7 | −2.6 | −2.6 | −2.5 | −2.6 |
| Govt. debt as % of GDP(b) | 95.6 | 98.3 | 98.5 | 96.9 | 95.8 | 95.0 | 92.7 |
| Current account as % of GDP | –0.4 | –0.8 | –0.6 | –0.8 | 0.2 | 0.0 | 0.1 |
Change as a percentage of GDP.
End–of–year basis; Maastricht definition.
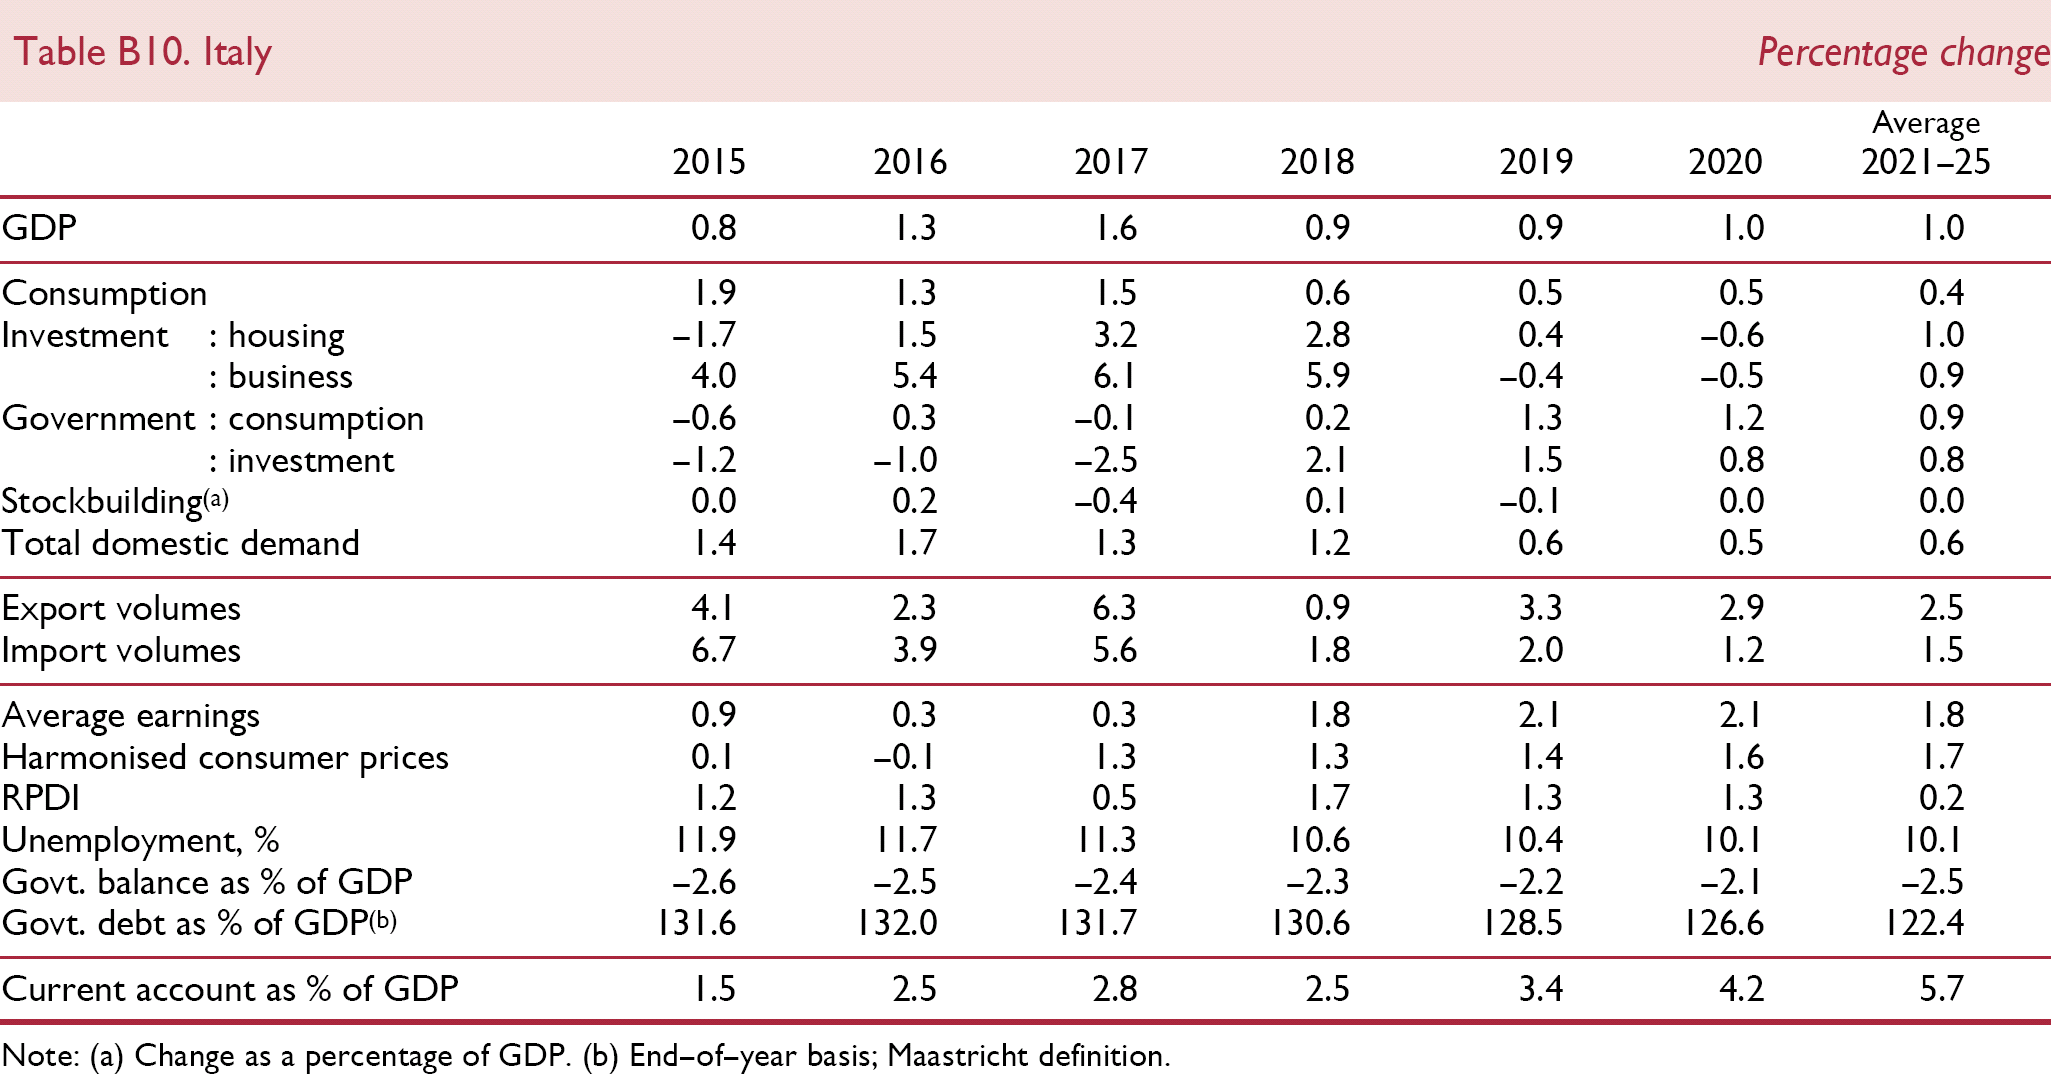
Italy Percentage change
| 2015 | 2016 | 2017 | 2018 | 2019 | 2020 | Average 2021–25 | |
|---|---|---|---|---|---|---|---|
| GDP | 0.8 | 1.3 | 1.6 | 0.9 | 0.9 | 1.0 | 1.0 |
| Consumption | 1.9 | 1.3 | 1.5 | 0.6 | 0.5 | 0.5 | 0.4 |
| Investment : housing | −1.7 | 1.5 | 3.2 | 2.8 | 0.4 | −0.6 | 1.0 |
| : business | 4.0 | 5.4 | 6.1 | 5.9 | −0.4 | −0.5 | 0.9 |
| Government : consumption | −0.6 | 0.3 | −0.1 | 0.2 | 1.3 | 1.2 | 0.9 |
| : investment | −1.2 | −1.0 | −2.5 | 2.1 | 1.5 | 0.8 | 0.8 |
| Stockbuilding(a) | 0.0 | 0.2 | −0.4 | 0.1 | −0.1 | 0.0 | 0.0 |
| Total domestic demand | 1.4 | 1.7 | 1.3 | 1.2 | 0.6 | 0.5 | 0.6 |
| Export volumes | 4.1 | 2.3 | 6.3 | 0.9 | 3.3 | 2.9 | 2.5 |
| Import volumes | 6.7 | 3.9 | 5.6 | 1.8 | 2.0 | 1.2 | 1.5 |
| Average earnings | 0.9 | 0.3 | 0.3 | 1.8 | 2.1 | 2.1 | 1.8 |
| Harmonised consumer prices | 0.1 | −0.1 | 1.3 | 1.3 | 1.4 | 1.6 | 1.7 |
| RPDI | 1.2 | 1.3 | 0.5 | 1.7 | 1.3 | 1.3 | 0.2 |
| Unemployment, % | 11.9 | 11.7 | 11.3 | 10.6 | 10.4 | 10.1 | 10.1 |
| Govt. balance as % of GDP | −2.6 | −2.5 | −2.4 | −2.3 | −2.2 | −2.1 | −2.5 |
| Govt. debt as % of GDP(b) | 131.6 | 132.0 | 131.7 | 130.6 | 128.5 | 126.6 | 122.4 |
| Current account as % of GDP | 1.5 | 2.5 | 2.8 | 2.5 | 3.4 | 4.2 | 5.7 |
Change as a percentage of GDP.
End–of–year basis; Maastricht definition.
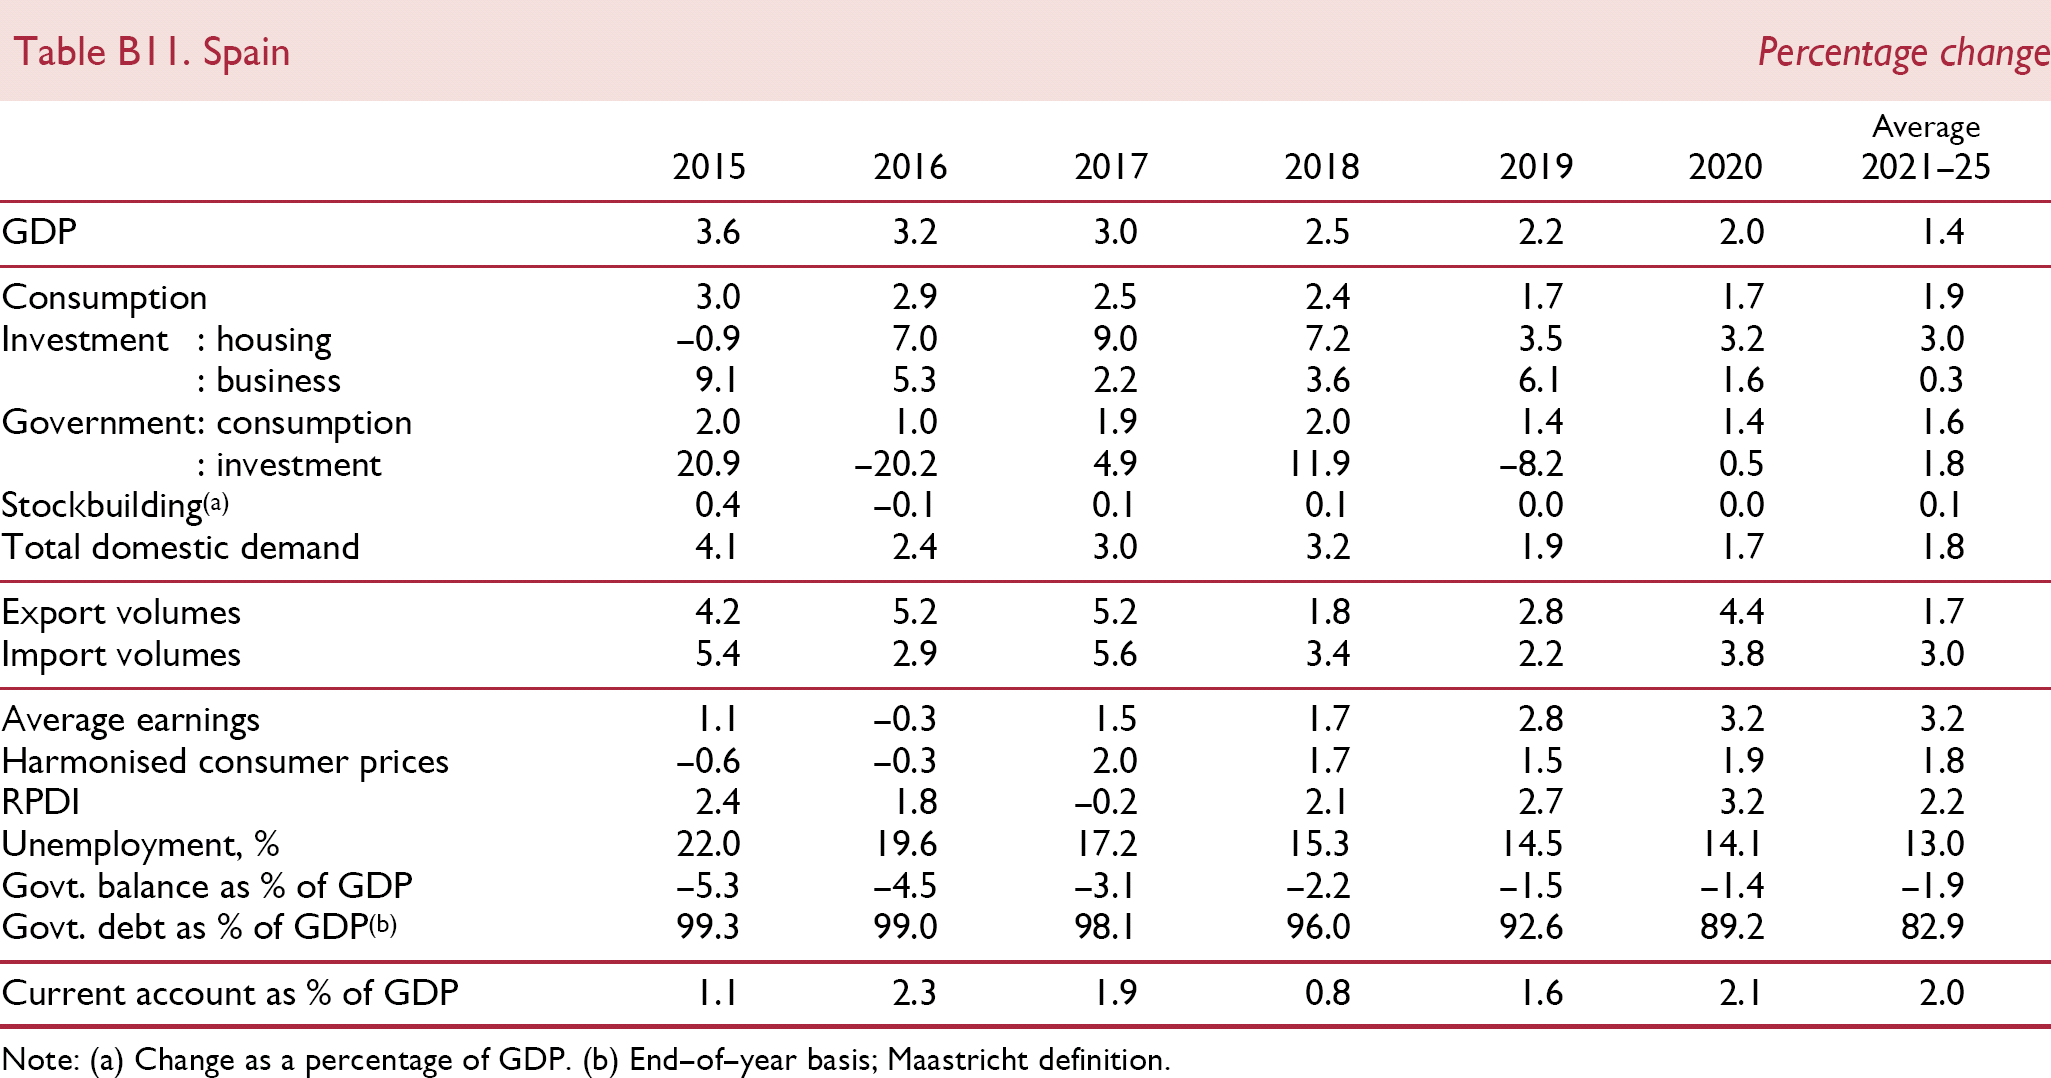
Spain Percentage change
| 2015 | 2016 | 2017 | 2018 | 2019 | 2020 | Average 2021–25 | |
|---|---|---|---|---|---|---|---|
| GDP | 3.6 | 3.2 | 3.0 | 2.5 | 2.2 | 2.0 | 1.4 |
| Consumption | 3.0 | 2.9 | 2.5 | 2.4 | 1.7 | 1.7 | 1.9 |
| Investment : housing | −0.9 | 7.0 | 9.0 | 7.2 | 3.5 | 3.2 | 3.0 |
| : business | 9.1 | 5.3 | 2.2 | 3.6 | 6.1 | 1.6 | 0.3 |
| Government : consumption | 2.0 | 1.0 | 1.9 | 2.0 | 1.4 | 1.4 | 1.6 |
| : investment | 20.9 | −20.2 | 4.9 | 11.9 | −8.2 | 0.5 | 1.8 |
| Stockbuilding(a) | 0.4 | −0.1 | 0.1 | 0.1 | 0.0 | 0.0 | 0.1 |
| Total domestic demand | 4.1 | 2.4 | 3.0 | 3.2 | 1.9 | 1.7 | 1.8 |
| Export volumes | 4.2 | 5.2 | 5.2 | 1.8 | 2.8 | 4.4 | 1.7 |
| Import volumes | 5.4 | 2.9 | 5.6 | 3.4 | 2.2 | 3.8 | 3.0 |
| Average earnings | 1.1 | −0.3 | 1.5 | 1.7 | 2.8 | 3.2 | 3.2 |
| Harmonised consumer prices | −0.6 | −0.3 | 2.0 | 1.7 | 1.5 | 1.9 | 1.8 |
| RPDI | 2.4 | 1.8 | −0.2 | 2.1 | 2.7 | 3.2 | 2.2 |
| Unemployment, % | 22.0 | 19.6 | 17.2 | 15.3 | 14.5 | 14.1 | 13.0 |
| Govt. balance as % of GDP | −5.3 | −4.5 | −3.1 | −2.2 | −1.5 | −1.4 | −1.9 |
| Govt. debt as % of GDP(b) | 99.3 | 99.0 | 98.1 | 96.0 | 92.6 | 89.2 | 82.9 |
| Current account as % of GDP | 1.1 | 2.3 | 1.9 | 0.8 | 1.6 | 2.1 | 2.0 |
Change as a percentage of GDP.
End-of-year basis; Maastricht definition.