
Abstract
Background
It has been claimed that the advent of modern antidepressants has reduced the suicide rate.
Aims
To examine the correlation between the suicide rate and the prescription of antidepressants.
Method
A dynamic regression was employed to analyze a 73-month-long, monthly time series between 2010 and 2016 in Hungary. The independent variable was the Defined Daily Dose value for the number of antidepressant (AD) prescriptions filled each month.
Results
The models failed to show a significant association between the prescription of antidepressants and age- and sex-specific monthly suicide rates.
Conclusions
The prescription of antidepressants in Hungary has had no impact on suicide rates.
Keywords
Introduction
During the past 30 years, a debate has developed between the followers of social psychiatry and the followers of biological psychiatry over the possible reasons for the marked decrease in suicide rates observed in many European countries. Adherents of the biological paradigm claim that the decrease in suicide rates is due to a more accurate and differentiated diagnosis of depression, wider access to treatment, and more effective antidepressants (ADs). These researchers conducted time-series analyses on aggregated data from several countries, using relatively simple methodology, and found a negative correlation between AD consumption and suicide rates. Since then, these significant negative correlations have been viewed, without criticism, as proof for the effectiveness of antidepressants for preventing suicide, even though the methodology was simple. The conducted time-series analyses frequently lacked technical and methodological rigor, and criticism was often swept aside or deemed insignificant. Apart from model specification and technical errors, more general methodological concerns can also be found. (Gusmão et al., 2013; Isacsson et al. 1996; Isacsson. 2000; Kalmar et al., 2008; Ludwig et al., 2009; Nakagawa et al., 2003)
From a sociological and social psychiatric perspective, these studies failed to consider socioeconomic changes (higher living standards, reduced inflation, economic growth, end of socialism, etc.) as determining factors behind the decrease in the suicide rates. (Baldessarini et al., 2007; De Leo, 2002, 2004; Kmetty et al., 2016; Mäkinen, 2000; Titelman et al., 2013; Zonda et al., 2016, 2019; Zhang et al., 2010)
Previously published results do not show a clear association between the aggregated (country-wide and annual) rates of AD purchases and suicide rates. A meta-analysis of 19 studies published between 1970 and 2007, found that only eight of these reported a significant negative correlation between the two variables (Baldessarini et al., 2007).
There are researchers who have found evidence that antidepressant treatment may cause an increased risk of suicidality (Healy, 2000; Reeves & Ladner, 2010; Teicher et al., 1990). According to Reeves and Ladner (2010), the United States Food and Drug Administration since 2007 has required that antidepressants carry a black box warning regarding an increased risk of suicidality in patients up to age 24. Similar warnings have been issued by European agencies. In 2003, U.K. drug authority (MHRA, Medicines and Healthcare products Authority) issued a warning about potential risk of SSRI (Selective Serotonin Reuptake Inhibitor) therapy. As well in 2005, the EU drug agency EMEA (European Medicines Agency) issued warning against SSRI therapy of under 18 year old patients. (O’ Sullivan et al., 2015)
Zonda, et al. (2019) drew attention to the fact that a substantial number of current ADs (46%) are not prescribed for depressive disorders. Furthermore, many studies do not take into account the effects of non-adherence and non-response among patients with depression, failing to distinguish between (1) being prescribed a medication, (2) filling the prescription, and (3) taking the medication.
The present study sought to examine the association between the prescribing of antidepressants and age- and sex-specific monthly suicide rates in Hungary utilizing more rigorous methodology than previous studies on the topic.
Methods
As mentioned above, previous aggregated annual time-series data on large regions and long time units has produced inconsistent results concerning the question under scrutiny. Therefore, we conducted an ecological analysis on data which was aggregated using markedly lower levels than in previously published research. Aggregation was modified in the following three respects: 1. We worked with data aggregated by month (rather than year), allowing us to examine whether the marked seasonal fluctuations in suicide rates correlate with changes in AD consumption. 2. We processed the data for AD consumption specific to age and sex (males ages 18–60, males ages 61+, and females ages 18+) enabling a comparison of age- and sex-specific suicide rates. Suicide numbers based on monthly aggregation did not allow for the female suicides to be differentiated by age. Given the greater number of male suicides, we could create two age groups. 3. We examined two AD groups with different mechanisms of action separately for their association with suicide rates. Group 1 consisted of “traditional” drugs (tricyclic and tetracyclic active ingredients), while Group 2 comprised “modern” drugs (SSRI inhibitors, Dual, MO inhibitor, etc.).
We generated separate models for each of the three sex-by-age groups with data aggregated by month. The dependent variable of the models was the average daily suicide rate per 10,000 people. All rates were calculated with the given year’s January 1 population. The independent variable was AD consumption (units of Defined Daily Dose/1000 people/day) separately aggregated based on active ingredient and according to sex and age. As we are using a linear model, the sum of the two active ingredient groups (that is, the total AD consumption) is contained in the model. If neither group is significant in the model, then their sum or any of their linear combinations will not be significant either. Thus, all three models had two exogenous independent variables.
Description of Data
Data concerning AD purchases (filled prescriptions) was obtained from the database of the Hungarian National Healthcare Service Center (ÁEEK). Nearly 23 million individual prescription transactions were processed under the following ATC codes: NO6AA, NO6AB, NO6AG, and NO6AX. (ATC codes. The Anatomical Therapeutic Chemical Classification System is a coding system applied and monitored by the WHO. It aims to categorize drug components based on anatomy, medicine, and chemistry. In the ATC, drugs are grouped according to the place of effect mechanism, the therapeutic attributes, and the chemical properties.) The collected data on purchases not only included prescription antidepressants (containing a neuropharmacological agent) but also medicinal herbs and homeopathic remedies (which do not contain active agents). The monthly data spanned the time-frame between January 2010 and January 2016, a total of 73 months.
We grouped consumption data according to sex and age (males ages 18–60, males ages 61+, and females ages 18+). In 1.1% of cases, the consumer’s age and/or sex were not identifiable, and we removed those data from the study. We linked data regarding AD purchase to the official ÁEEK drug database using the Társadalombiztosítási Támogatási Termék (TTT) code assigned to every drug, which includes information on its active ingredient, packaging quantity, and the active ingredient per packaging unit in milligrams. The TTT code: a nine-digit code assigned to each drug covered by social security in Hungary. From these data, we could calculate the consumption per month in milligrams for each active ingredient.
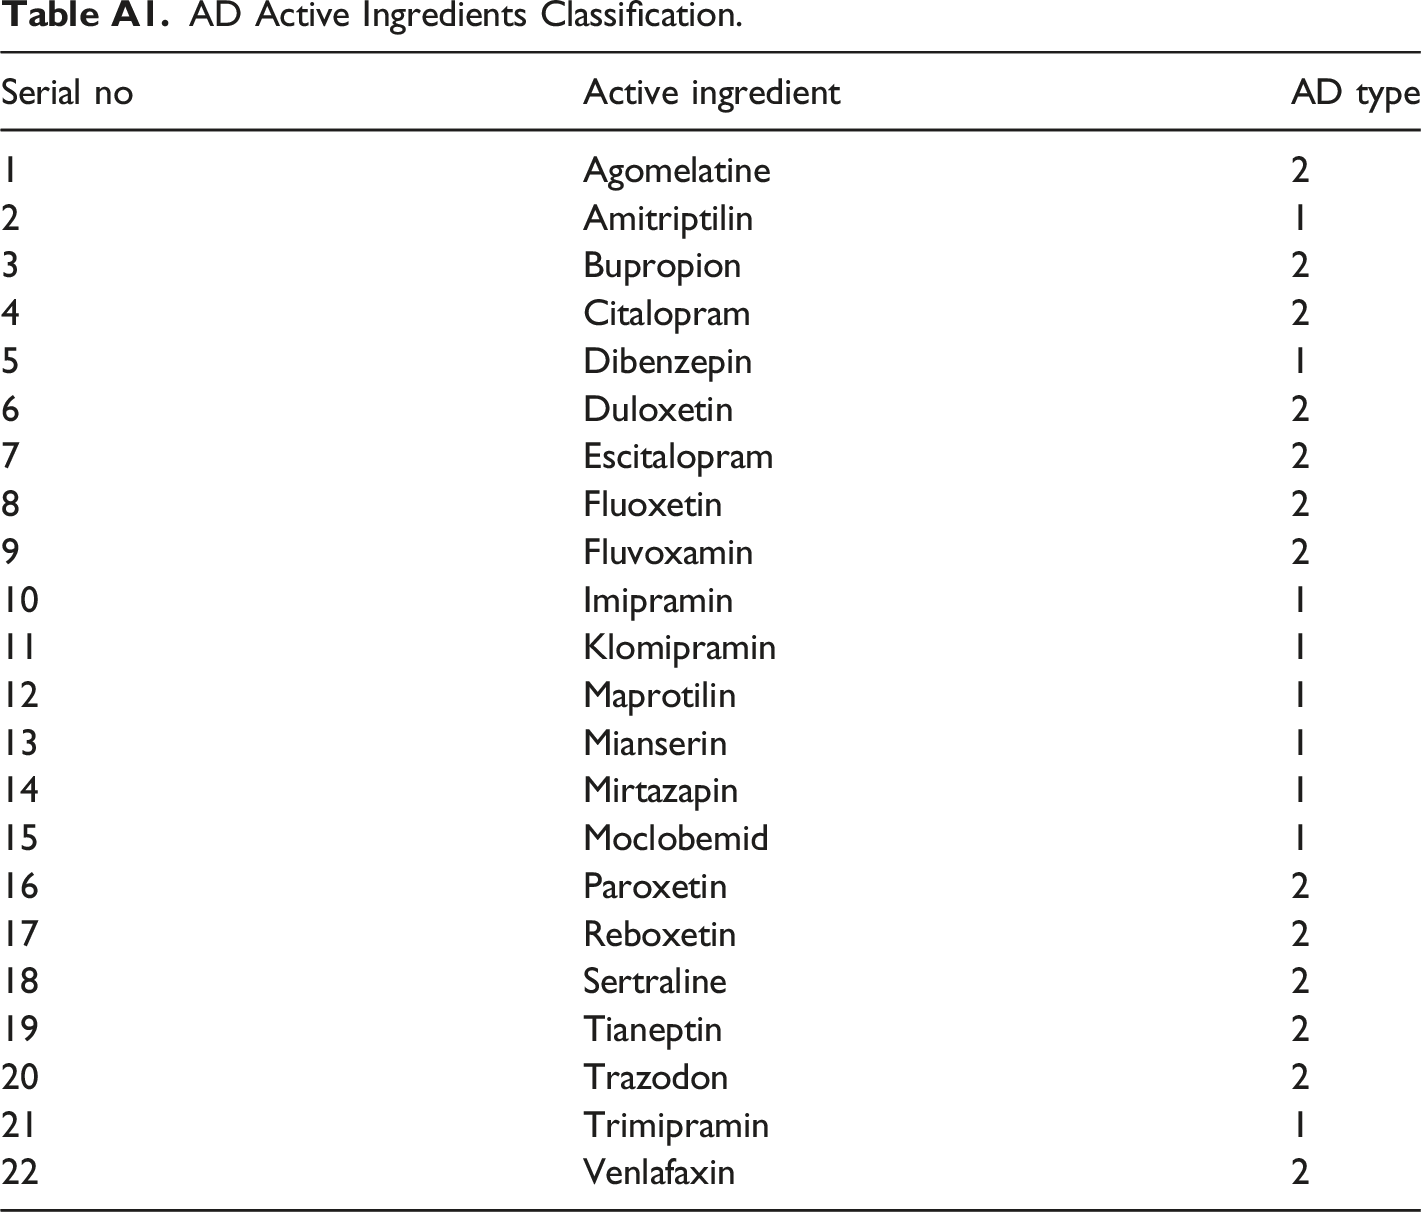
AD Active Ingredients Classification.
The time series of AD consumption DDD/1000 people/day (sum of AD groups 1 & 2) are shown in Figure 1. AD consumption Defined Daily Dose/1000 people/day (sum of AD groups 1&2) according to demographic groups by month in the span of January 2010–January 2016.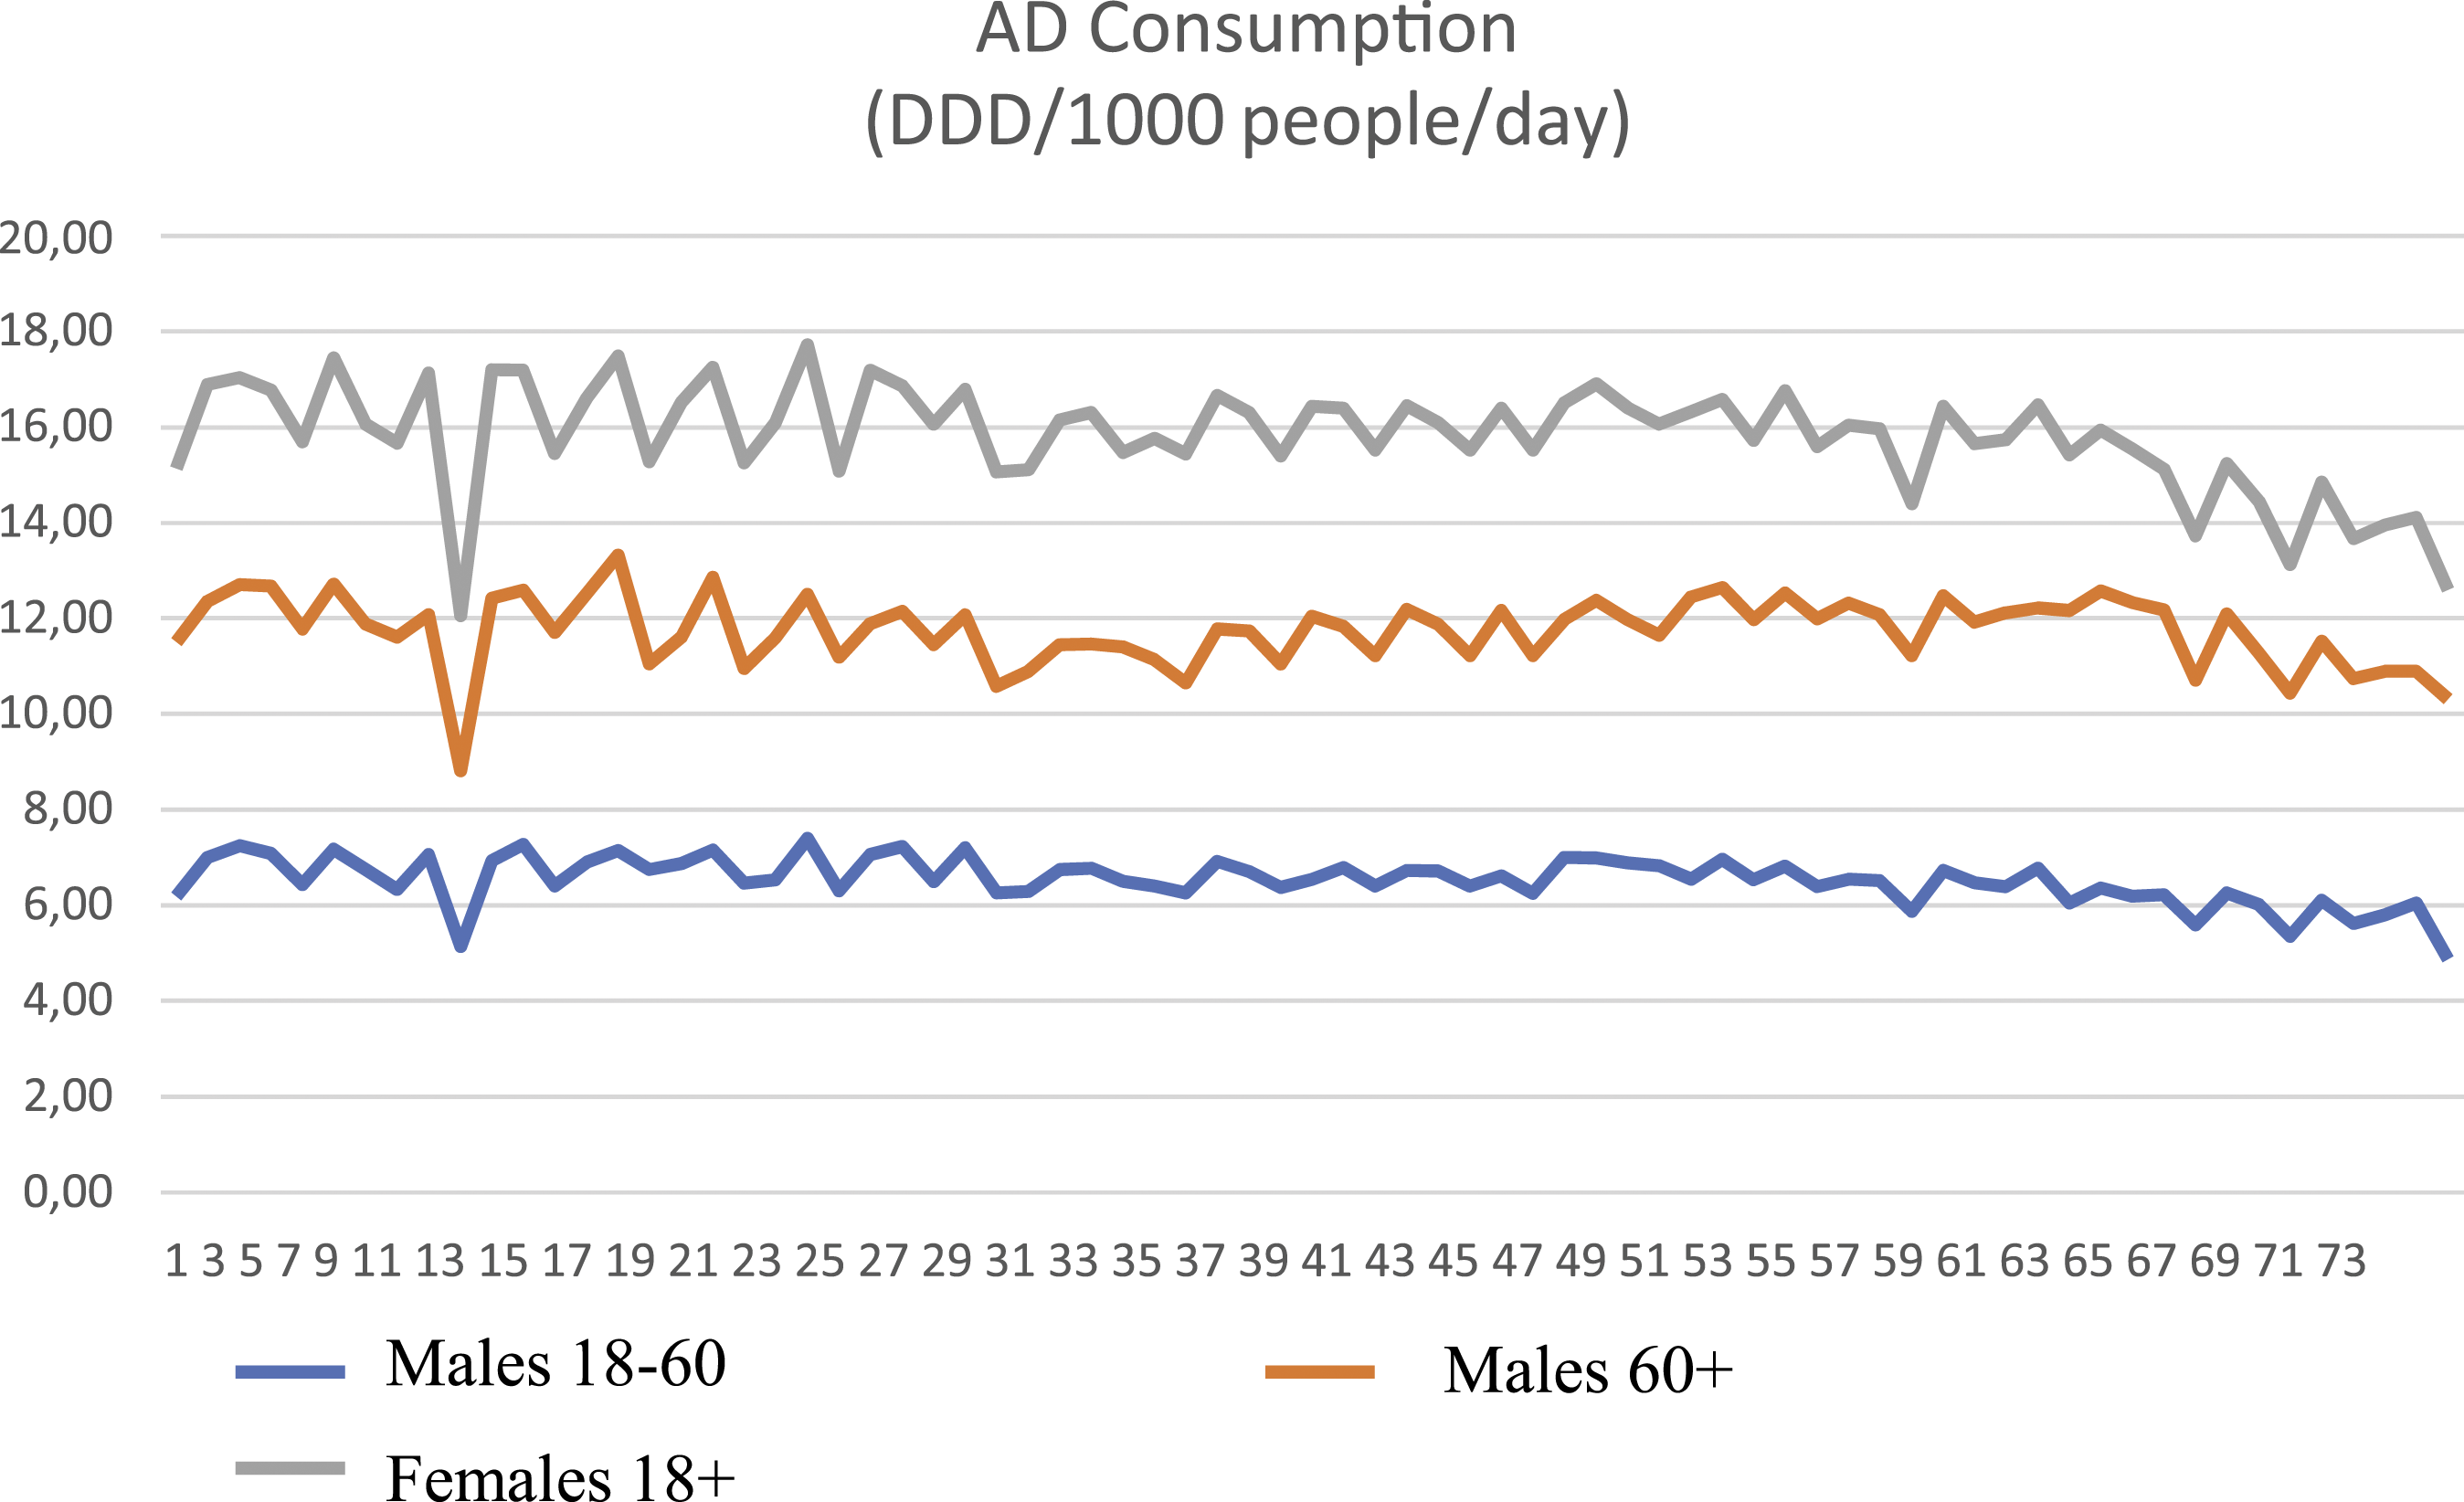
Cause of death statistics for the time period of January 2010 to January 2016 were provided by the KSH and considered as suicide if it fell within the range of ICD codes X60–X84. These were aggregated by month according to the previously specified demographic groups. In the time-frame under investigation, there were 13,213 suicides committed by persons over 18 years of age. In 11 cases, the age of the deceased was unknown and, therefore, these data were omitted from the study. The time series of monthly suicide rates are shown in Figure 2. Monthly average suicide rates according to demographic group.
Empirical Analysis
To ensure methodological precision, we first examined the Durbin–Watson test performed on the serial correlation of our data set. For middle-aged males, DW = .78, indicating strong first order autocorrelation. This provided sufficient grounds to carry out our analysis within the framework of time-series methodology.
Since we were looking for a potential causal relationship, or at least a genuine correlation, within the time series (between AD consumption measured in DDD and suicide rates), we had to eliminate all deterministic components possibly leading to spurious correlations. In theory, we cannot exclude the possibility that AD consumption has a delayed effect (a few months) on the suicide rates. Furthermore, as there can be linear components within the time series of the rates (autoregressive and/or moving average components), we fitted the class of dynamic regression model for ARIMA analysis (ARIMAX model) which considers the delayed temporal values of the dependent and independent variables as well.
We observed strong seasonal and trend components in the suicide data, impairing the time series stationarity. Therefore, prior to analysis, we eliminated the deterministic components using analytical detrending. Subsequent to removing the trend, we also removed seasonal components from the data. By these means, the dependent variables of the suicide rate in the dynamic regression model had no deterministic components. (In the case of females, none of the variables exhibited significant seasonal patterns and, therefore, in this instance, we performed only detrending, and there was no need for seasonal adjustment.)
The independent variables were the detrended, de-seasonalized stationary values of the DDD for the two AD types and their lag values.
Modeling Strategy
To avoid overfitting the models, since we had a total of 73 months of observations, we had to be vigilant when defining the class of models. The following dynamic regression equation can be applied to the Y endogenous variable and the X and Z exogenous variables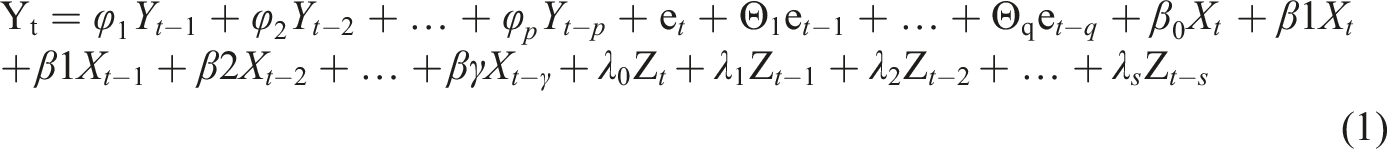
The equation did not include a constant component because we were working with detrended data, meaning that the expected values of all variables is zero and, consequently, the constant will always be zero.
In this specification, we can simultaneously evaluate the presence of genuine correlation and causal relationships. The correlation was considered to exist if the βo and/or λo parameters significantly differed from zero. If, however, alongside βo = 0 and λo = 0, we found β j and/or λ i parameters significantly differing from zero, we concluded that the exogenous variables of the given parameters were the Granger-causes of the endogenous variable.
According to the principles applied to statistical modeling (Babyak, 2004), to avoid overfitting the model, one should limit the estimated number of parameters to the number of available observations, in a way that the ratio of the number of observations and parameters is above 20, but never below 10.
The investigated period is 73 months long, and from this it follows that, while testing the causal model, optimally the condition of
We employed SPSS 25 “Expert Modeler” to choose the models that fit our data best. We aimed to minimize the Bayesian Information Criterion in model selection.
Since the suicide ratios were markedly higher among males than females, we will begin by examining the models fitted for the male groups.
Results
Males Ages 18–60
The temporal evolution of type 1 & 2 AD consumption and suicide rates among males aged 18–60 are shown in Figure 3. Temporal evolution of type 1&2 AD consumption and suicide rates among males aged 18–60.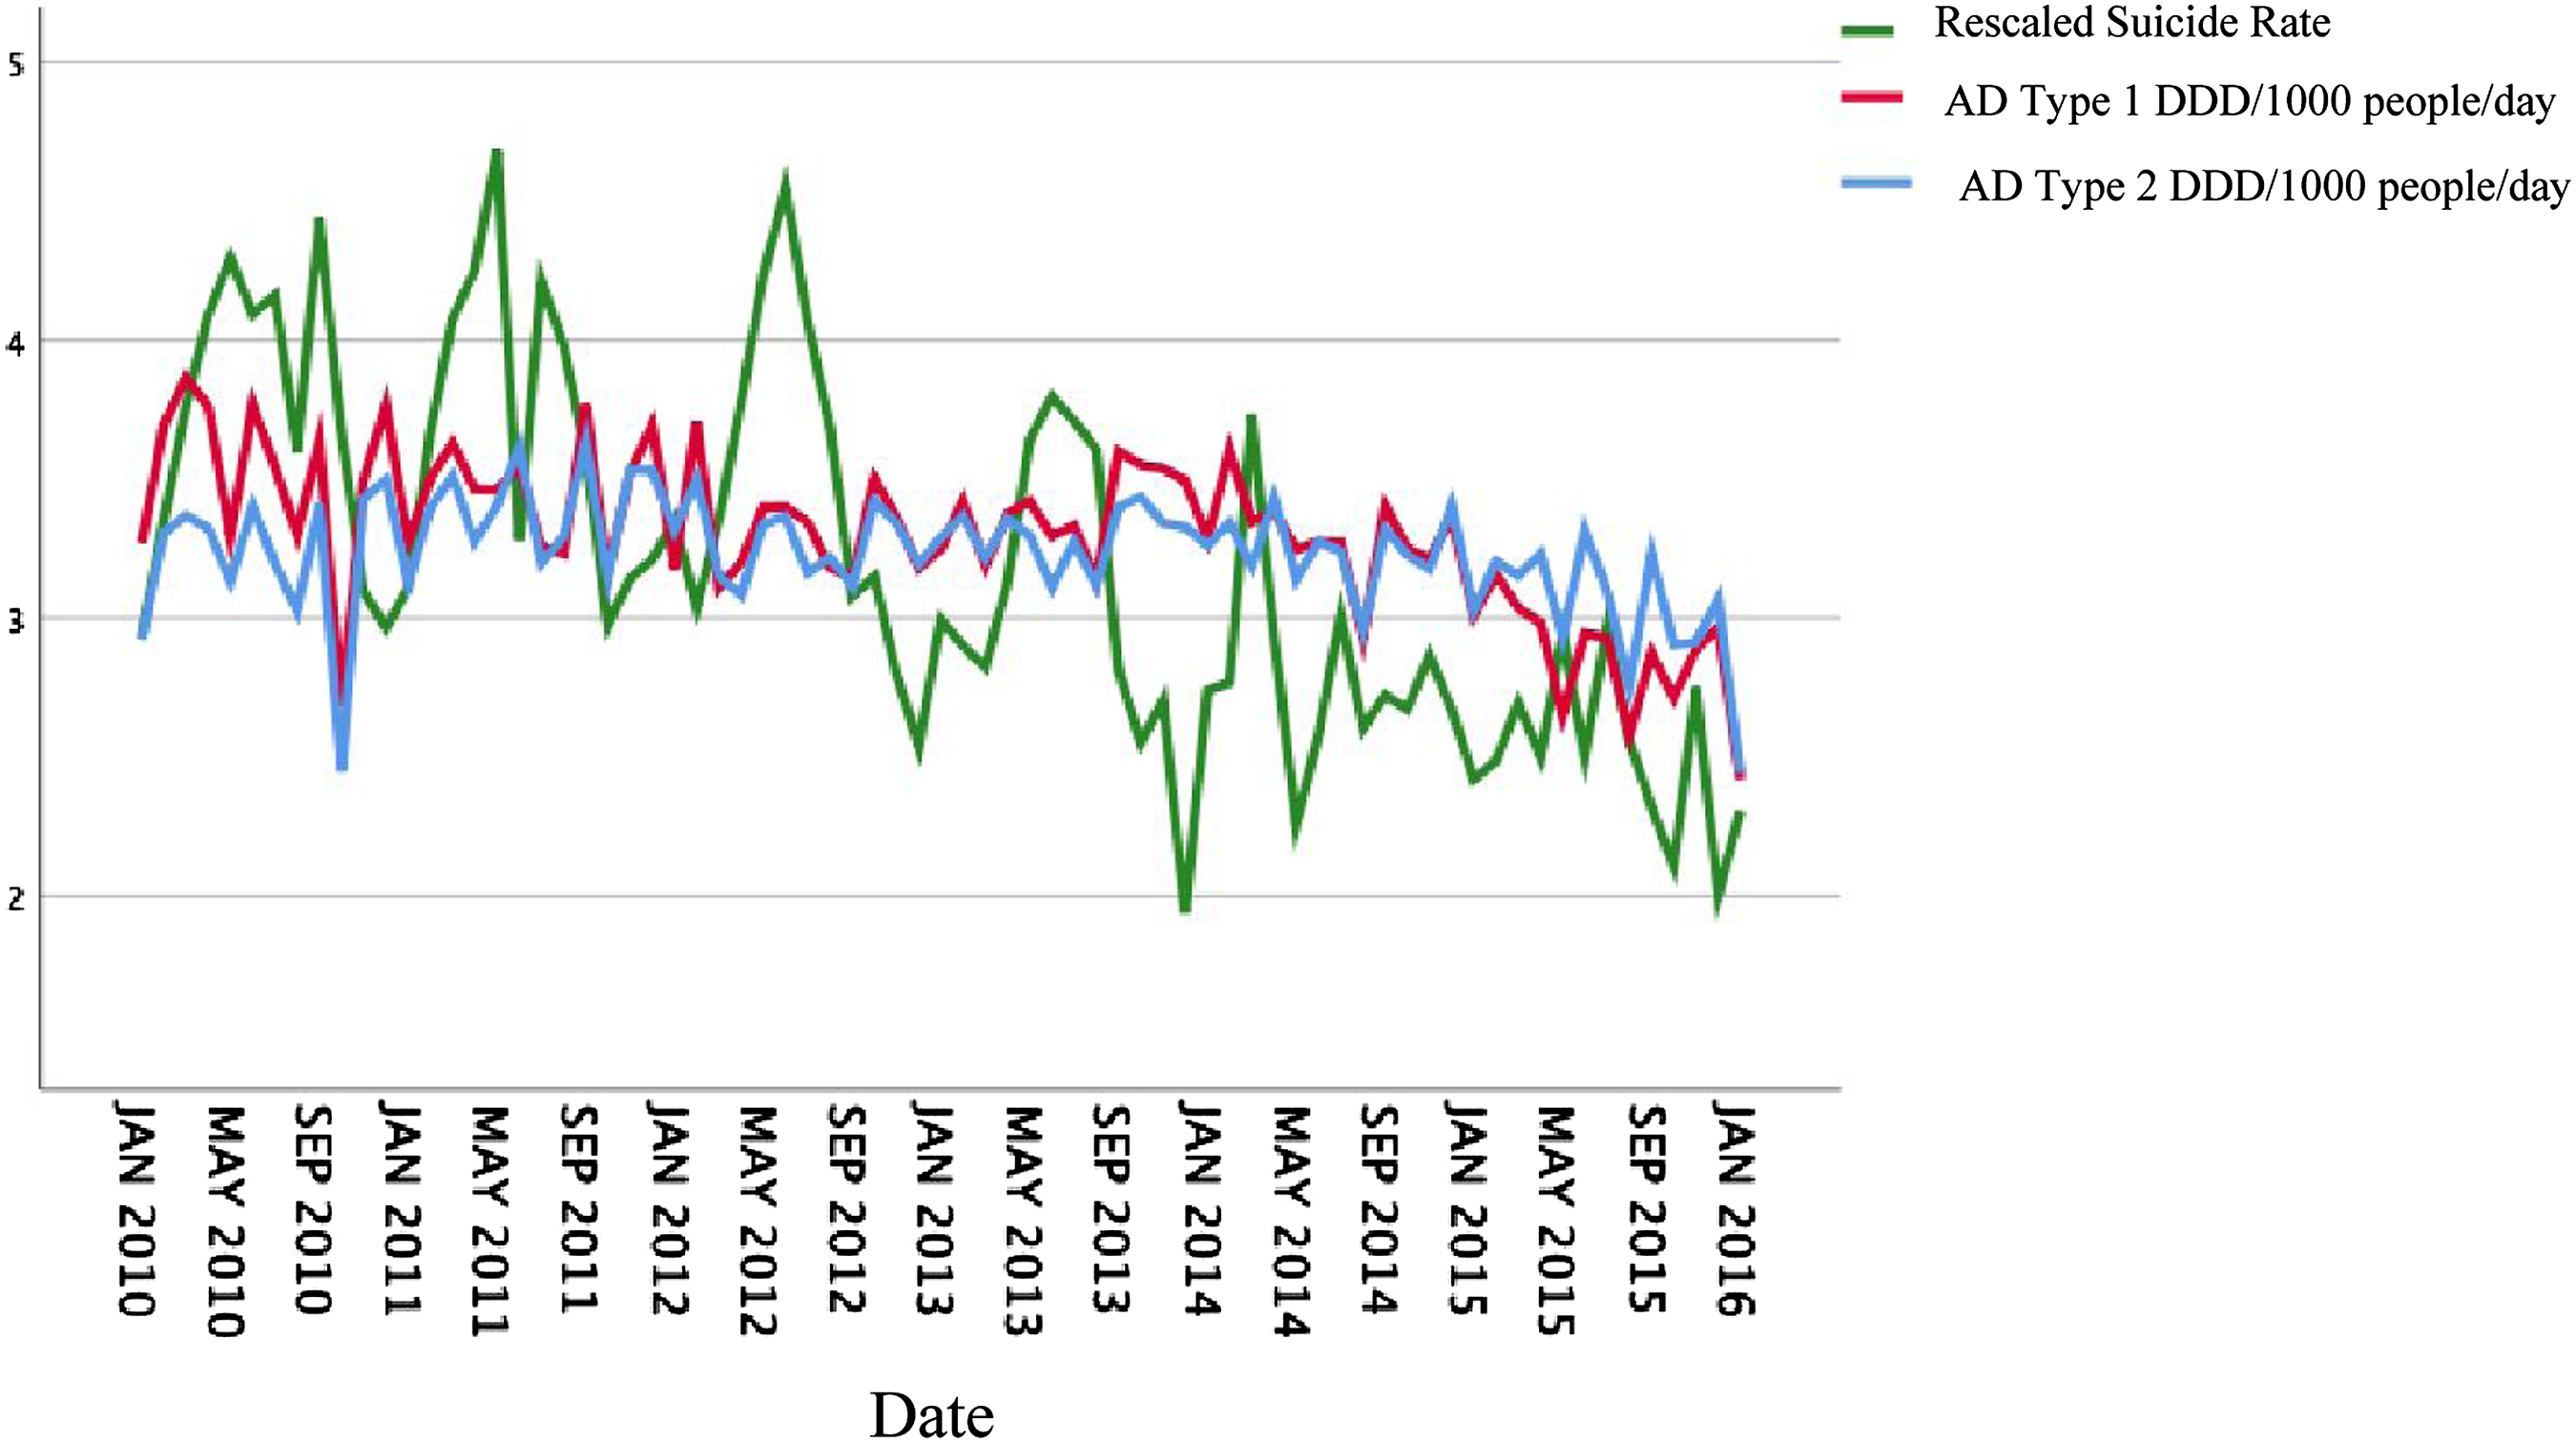
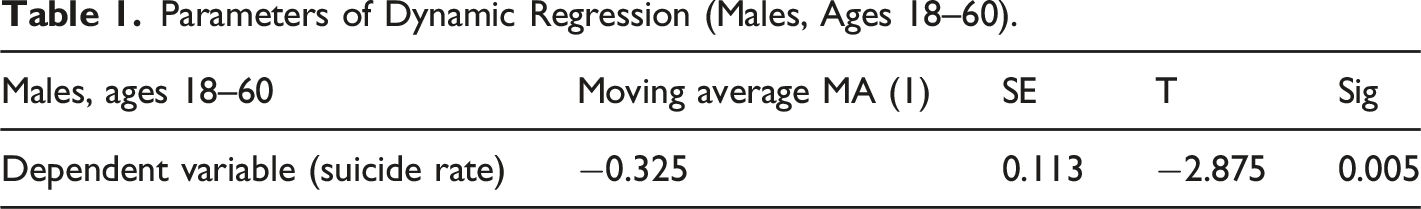
Parameters of Dynamic Regression (Males, Ages 18–60).
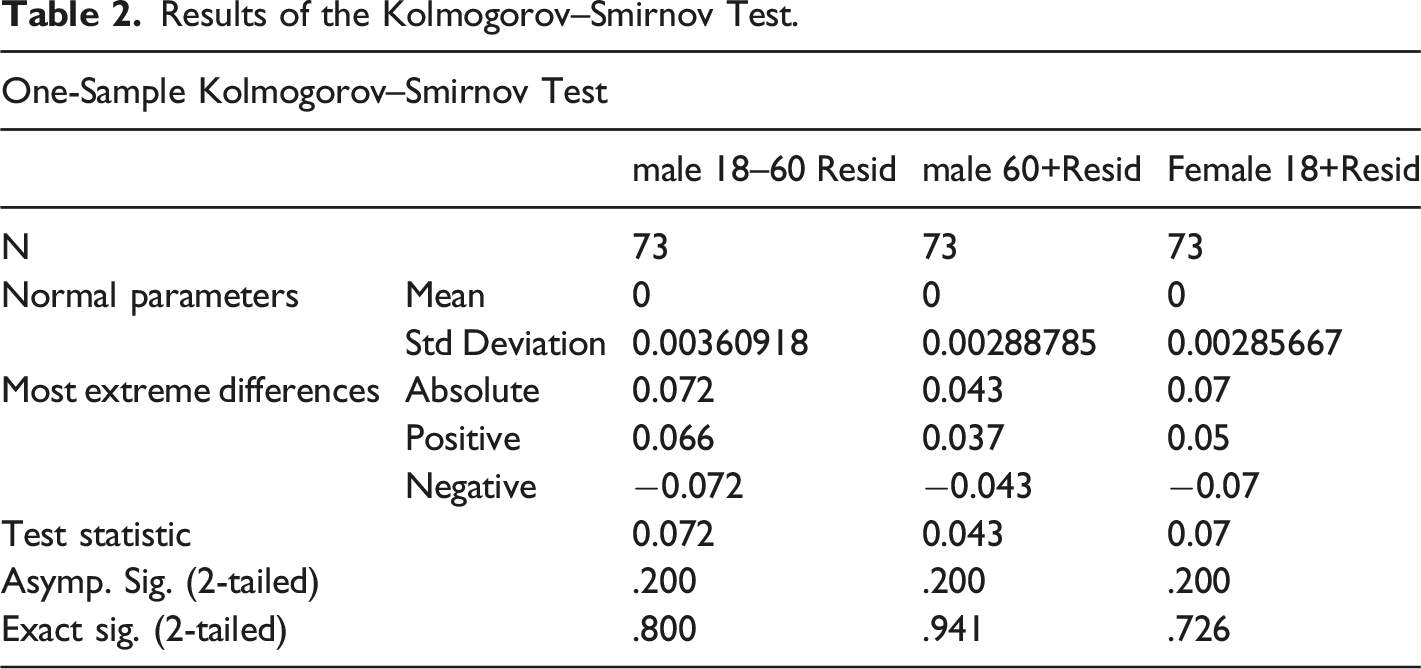
Results of the Kolmogorov–Smirnov Test.
To summarize our findings, over the scrutinized 73-month period, there was no statistically verifiable association between suicide rates and AD consumption among males aged 18–60. These are pivotal findings as this demographic group is the most affected by suicide in Hungary. Additionally, a first order moving average component can be observed in the monthly suicide rates which could potentially be utilized to develop a forecast system for preventing suicide.
Males Aged 60 and Above
The temporal evolution of type 1 and 2 AD consumption and suicide rates among males aged 60 and above are shown in Figure 4. Temporal evolution of type 1&2 AD consumption and suicide rates among males aged 60 and above.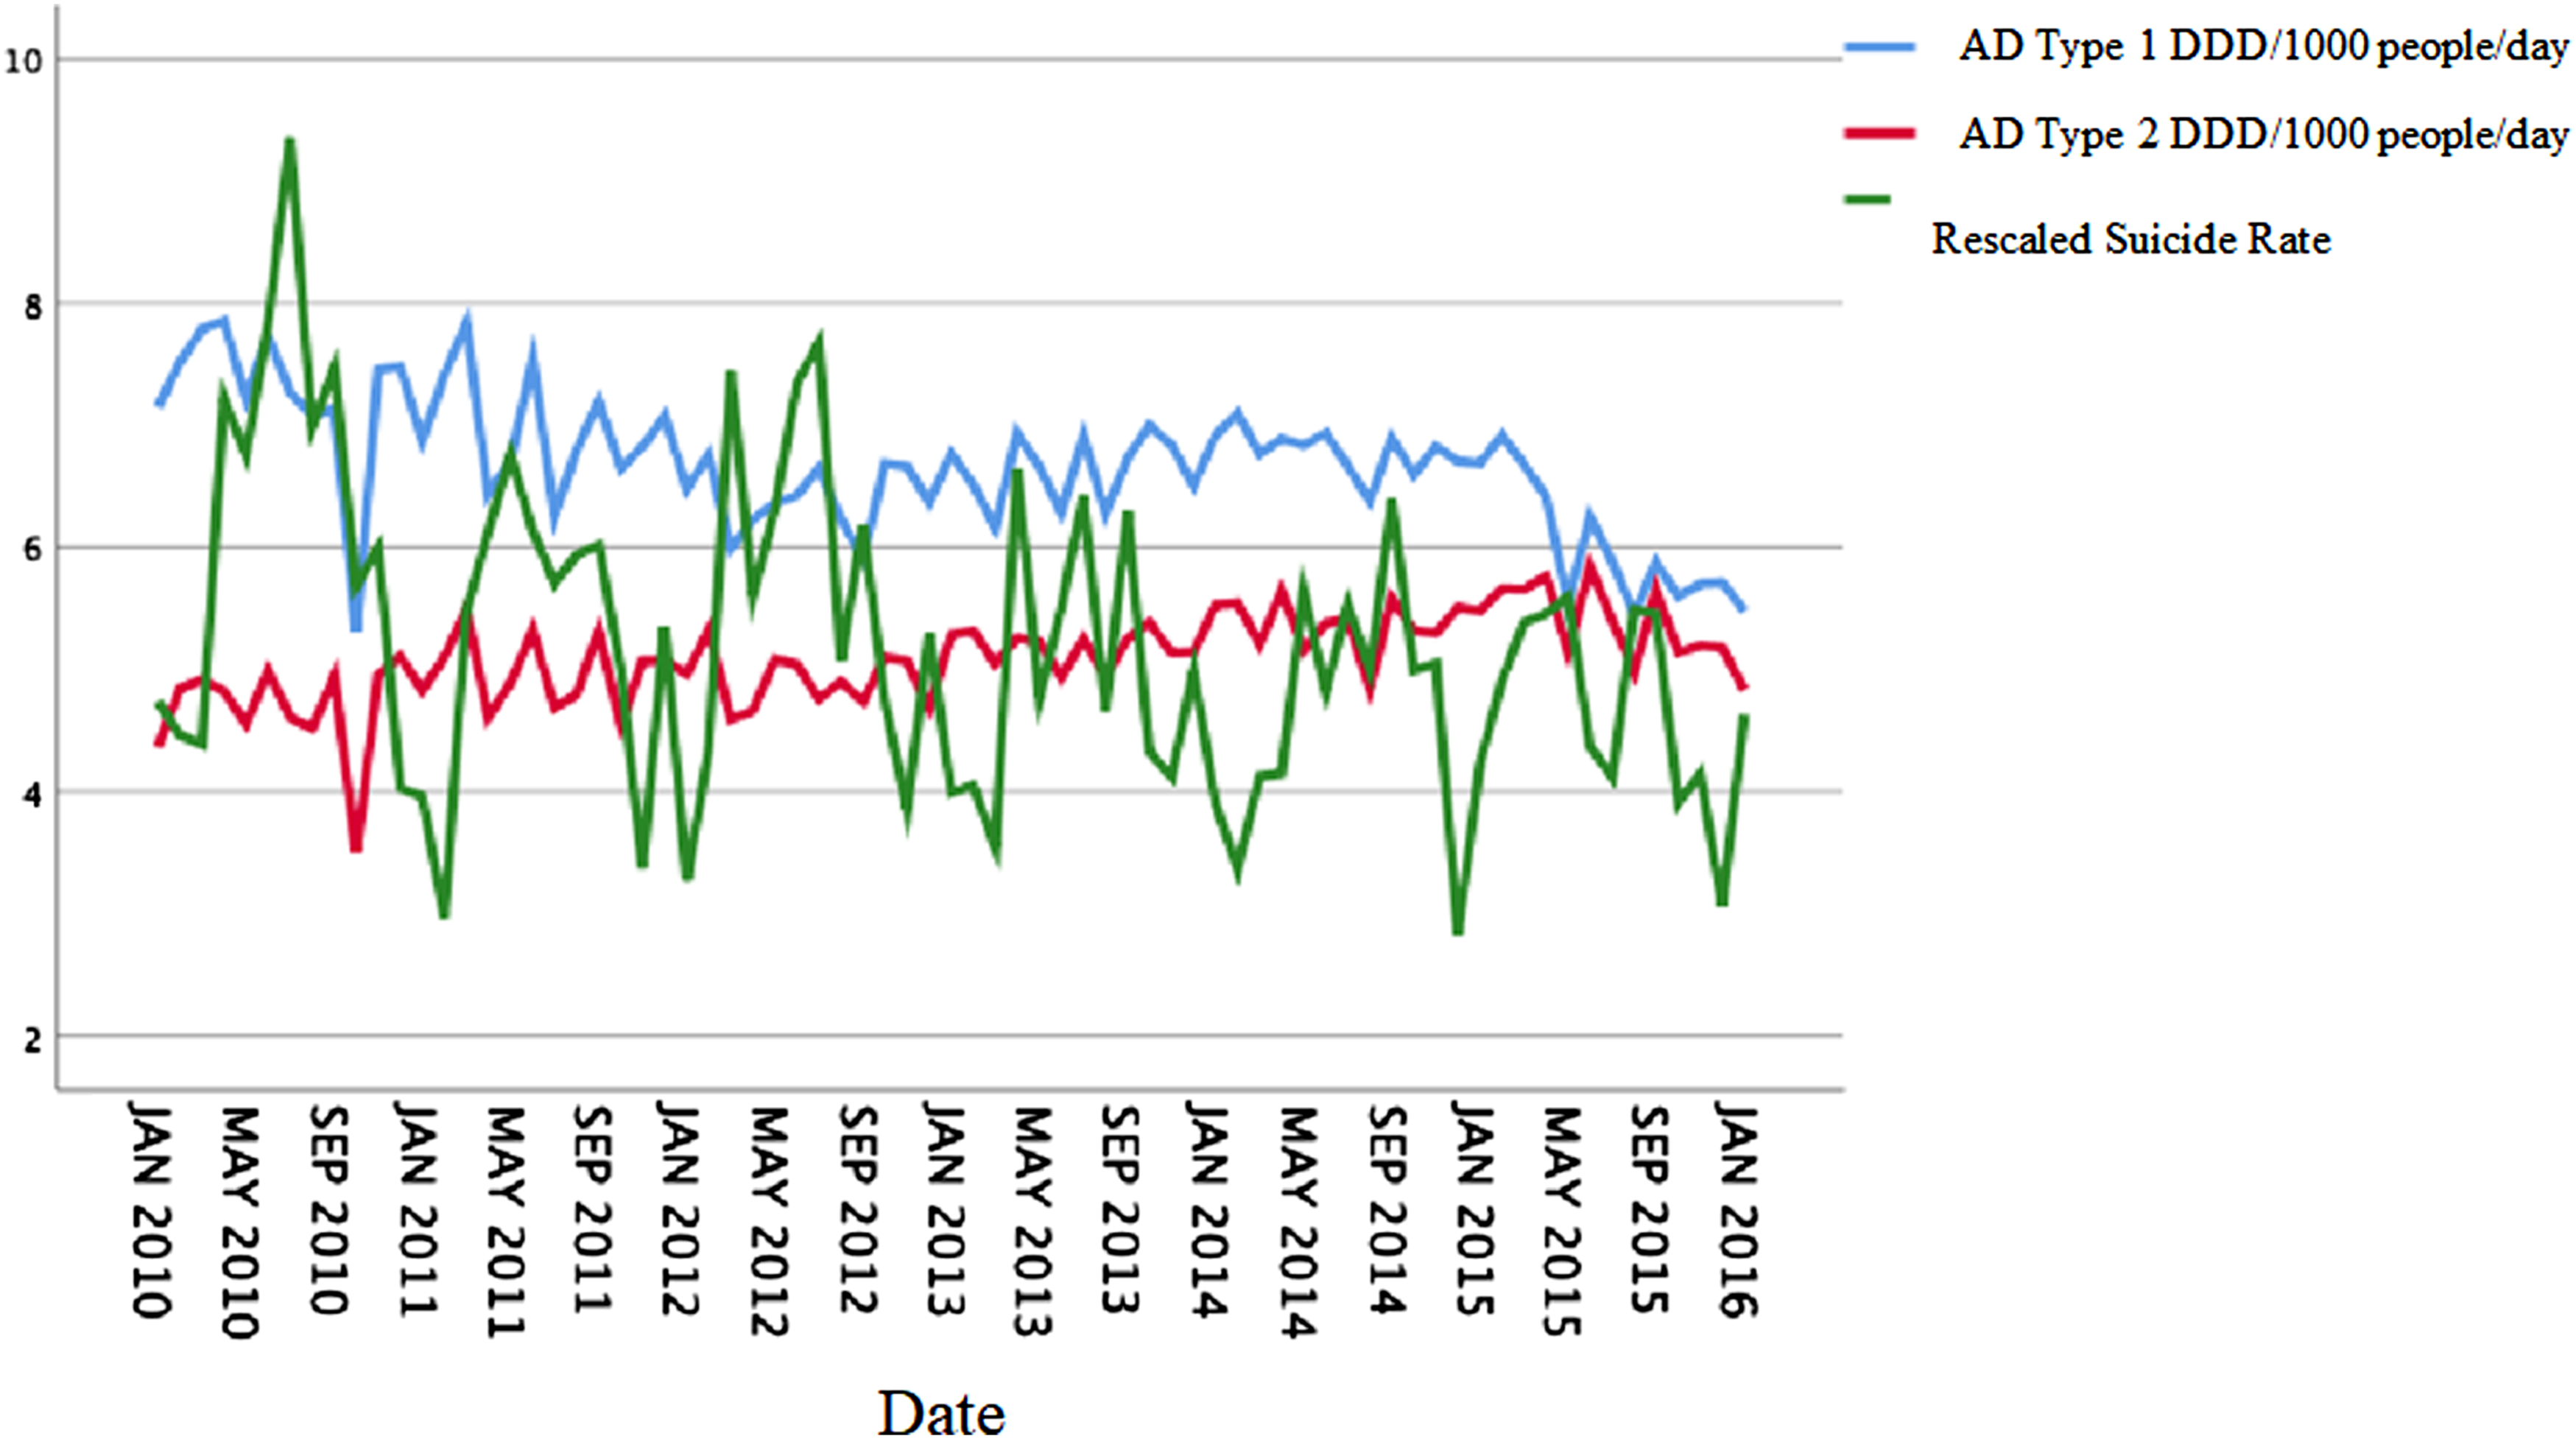
There was no unit root process in this group since, aside from the constant component, none of the parameters proved to be significant while fitting the dynamic regression model specified in equation (1). As none of the crucial parameters in the model were significant, the stationary correlation could not differ significantly from zero either. Thus, after removing the deterministic seasonal and trend components for males aged 60 and above, only independent error processes described by white noise were left in the model, which did not support a correlation or a causal relationship between endogenous and exogenous variables.
Residual diagnostics must be applied here as well in order to test how well specified the model is, but the residual distribution does not differ significantly from normal (see Table 2). The value of the Ljung–Box statistic is 17.63 and the significance level is .48. Therefore, we can consider that the residual process is free of autocorrelation. We can, therefore, accept the fitted model as part of the set of possible models, although it would be useful for future analyses to refit the model to a longer time series.
Females Aged 18 and Above
The temporal evolution of type 1 and 2 AD consumption and suicide rates among females aged 18 and are shown in Figure 5. Temporal evolution of type 1&2 AD consumption and suicide rates among females aged 18 and above.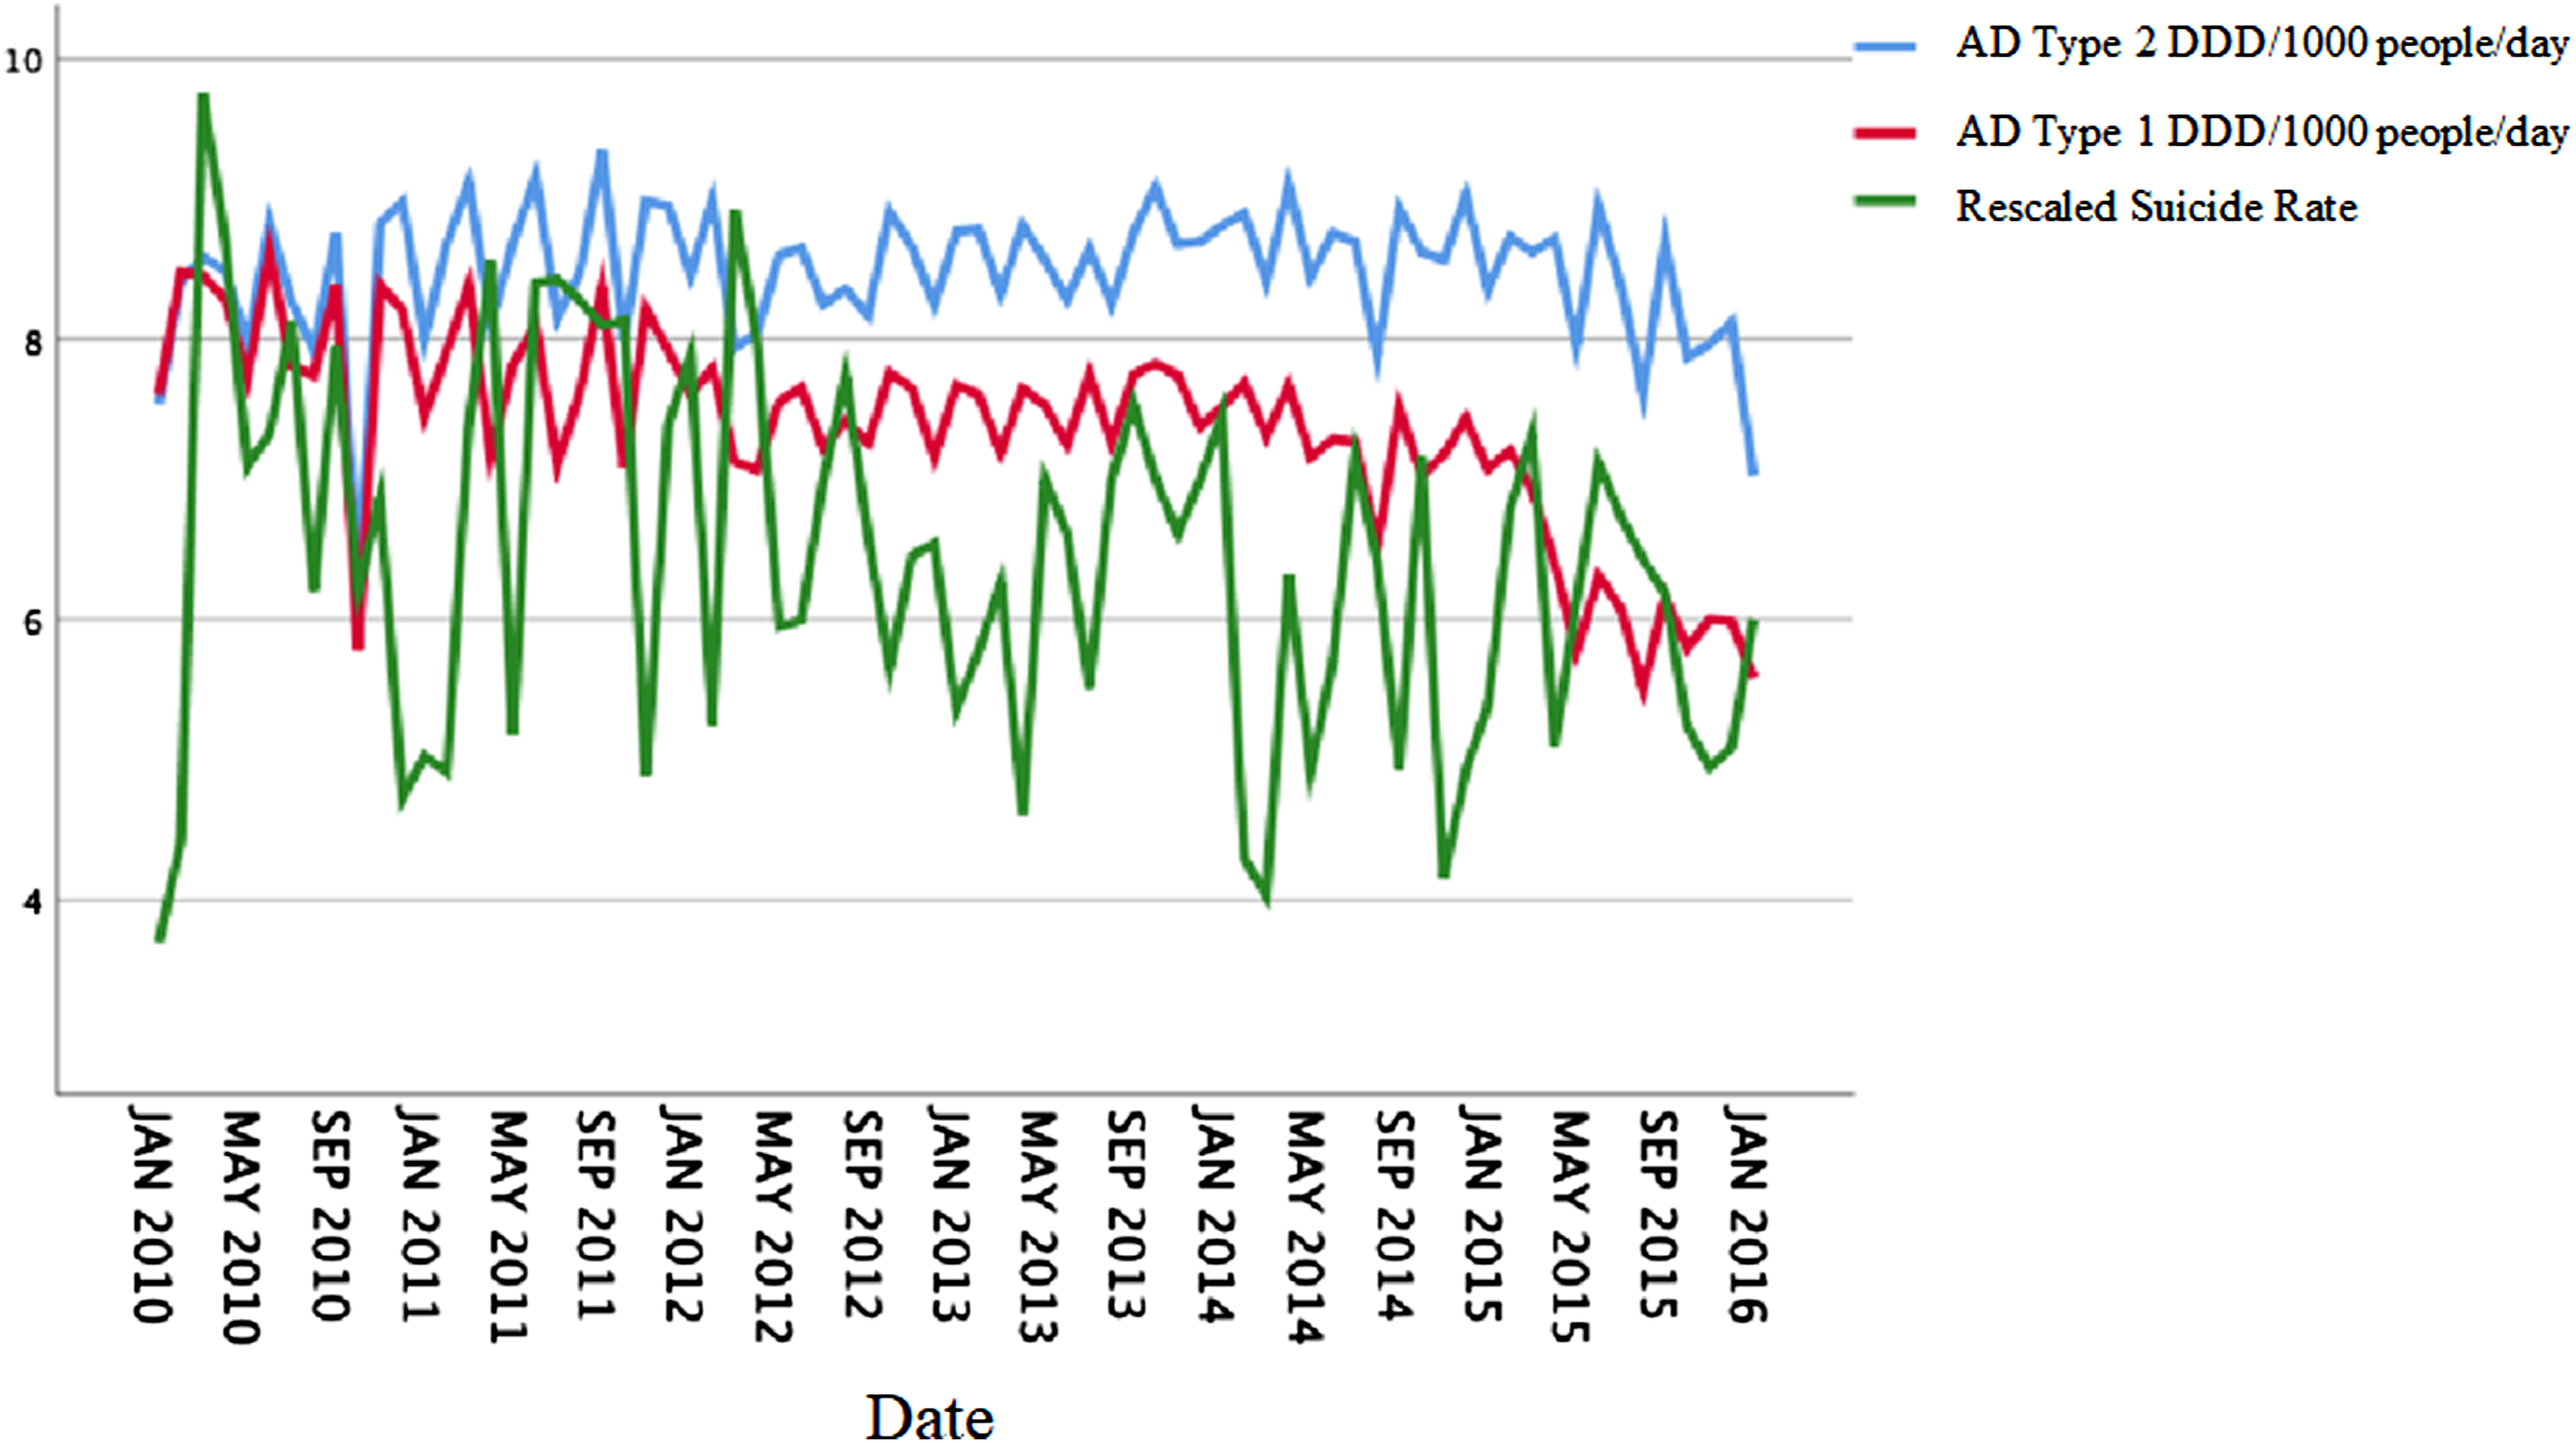
We applied the dynamic regression model specified in equation (1), and none of the parameters proved to be significant. Again, the stationary correlation did not differ significantly from zero. Thus, in the case of female adults, after removing seasonal and trend components, only error processes caused by white noise remained. Thus, there was no association between the endogenous and exogenous variables.
Residual diagnostics must be applied here also to test how well specified the model is. Residual distribution does not differ significantly from normal (see Table 2). The value of the Ljung–Box statistic is 16.2 and the significance level is .58, which indicates that our model is well specified.
Discussion
The detailed statistical analysis of the age- and sex-specific monthly suicide rates and AD consumption grouped according to active ingredient did not support an association between the rate of AD consumption and the decrease in number of suicides.
Our analysis improved on the methodological weaknesses of previously published results on aggregated data in the following ways: 1. We took the heterogeneity of suicidal behavior within different demographic groups into consideration (young/old, male/female), and we ran separate analysis for all three groups. 2. We analyzed traditional and modern ADs separately, based on their active ingredients. 3. We implemented a data model aggregated by month, which takes into account the seasonality of suicides. 4. We utilized a statistically correct model specification
Note that the SARIMAX class of the ARIMA models can be applied to data that have not been seasonally adjusted. We performed analyses with this method as well and arrived at the same conclusion: exogenous and endogenous variables are not statistically correlated. Due to the different model specifications, AR, MA, and SAR parameters of the endogenous variable retained a significant presence; but we did not perform a detailed analysis of these parameters since they did not constitute the focus of our study.
Therefore, we can conclude with confidence that, on the level of the aggregated data, there was no statistically verifiable association between AD consumption and changes in suicide rates. As aggregated AD consumption data appeared in the models based on their active ingredient, neither type 1 or 2, nor any weighed sum of the two (average) had any statistically significant effect on the suicide rates. We, therefore, concur with research findings that assume that socioeconomic reasons underlie the decreases in suicide rates rather than neuropharmacological ones.
An increase of AD consumption does not necessarily decrease suicide rates, as exemplified by the case of the USA. Based on data from the Centers for Disease Control and Prevention, there was a 33% increase in suicide rates in the USA between 1999 and 2014 (Curtin et al., 2016), while two other studies (Pratt, 2017; Winerman, 2017) showed that the proportion of AD consumers increased 64%, from 7.7% to 12.7%, between 1999 and 2014. Thus, it would seem that, despite individuals using more ADs each year in the USA, this did not produce a protective impact for suicide. The socioeconomic changes within the past 20 years in the USA have been markedly challenging. One could conclude that even increased AD consumption cannot compensate for the effects of a negative socioeconomic context.
Naturally, one must acknowledge that, at the individual level, there are obvious benefits to antidepressant pharmacotherapy. Nonetheless, these individual advantages may not have an effect on the improvement of societal-level suicide rates. This may at first seem contradictory, but a possible explanation may be that a proportion of those dying by suicide were not clinically depressed and, therefore, did not engage in antidepressant pharmacotherapy. Furthermore, only a fraction of depressed individuals who die by suicide actually receives therapy before taking their own life, a known barrier to suicide prevention observed around the world (Lester, 1990).
Limitations and Areas of Further Inquiry
As our data were aggregated, we cannot draw general conclusions on an individual level. For this, one would need to obtain precise clinical histories and perform a chemical analysis of brain samples from suicides and from a control group comprising victims of, for example, accidents. Conclusions could only be drawn subsequent to the statistical comparison of serotonin and noradrenaline levels. However, the execution of such an experimental design involves both legal and technical challenges.
The effectiveness of this ecological analysis can be enhanced by further extending the time series and including data from more countries and by fitting adequate space-time models. The limitations in obtaining international AD purchase data specific to age and sex hinder the realization of this research design.
Based on our findings, we can conclude that the mass deployment of antidepressants, despite their unquestionable therapeutic advantages, is not effective for individuals in facing suicide. Suicide prevention may be improved by strengthening the health care system and increasing social support in society’s micro-systems.
Footnotes
Declaration of Conflicting Interests
The author(s) declared no potential conflicts of interest with respect to the research, authorship, and/or publication of this article.
Funding
The author(s) received no financial support for the research, authorship, and/or publication of this article.