
Abstract
In future decades, the global demand for cereals will increase due to growing demand for food and feed and use of cereal crops as a source for biofuels. Some studies on cereal production within Europe have identified the Ukraine as a country with a large potential to increase production. However, the Ukraine is widely known for its high-quality soils, but its yield is relatively low. In principle, two routes for production growth exist: increasing yield (intensification) and/or converting more land into production (expansion). In this study, an assessment of the potential levels of wheat production that could be attained in the Ukraine at a regional level have been derived as well as quantifying the optimal levels of fertilizer application needed. The study identifies why farmers currently have low levels of motivation to intensify production and the reasons for increasing land using efficiency.
Introduction
Cereals are the most significant feedstock for the production of first-generation liquid biofuels (Nigam and Sing, 2011). In previous studies on food security and biomass production, the Ukraine is often highlighted for its large production potential (Götz et al., 2013; Schaffartzik et al., 2014; Stefanski et al., 2014). This viewpoint is in sharp contrast to trends observed over the last 20 years where total production in the country has dropped nearly 10 million tons (Mt), from 29.4 Mt in 1990 to 18.3 Mt in the last decade. This was caused by a general decline in productivity (yield) and a reduction in the harvested area (HA). However, there are significant differences between regions; production has hardly changed in some areas, while in other regions, it has halved. In this study, we consider the Ukraine as a country with a large agricultural potential as per relevant studies on production possibilities within Europe (Götz et al., 2013; Schaffartzik et al., 2014). For example, in 1990, wheat production peaked in the Ukraine at just over 30 Mt. Since then, it has shown a downward trend. The average production of 18.4 Mt (or 61% of 1990) is characteristic for the past two decades. At the same time, there has also been significant variability. For example, internal extremes vary between 10.2 Mt in 2001 and 22.3 Mt in 2011 and 2013. Therefore, it is reasonable to assume that the Ukraine has potential to increase output. At the same time, total domestic wheat consumption is estimated to be between 11.0 and 12.5 Mt in the short and medium term, according to national forecasts (Annual Report “Balance and consumption of basic foodstuffs population of Ukraine,” 2014). Wheat for food consumption represents 5.0–5.5 Mt, for livestock feed is 4.0–4.5 Mt, and seed stock and various losses are 2–2.5 Mt.
Primary data analysis shows two main reasons for a reduction in wheat production: a reduction in the HA (equivalent to about 1 million hectares) and reduced levels of fertilizer application (Figure 1). Thus, the rapid decline in fertilizer application from 149 kg/ha in 1990 to 10 kg/ha in 2000 has led to a decline in yield from 4.0 to 1.9 ton ha, respectively. This was the result of changes in farming systems, land reform, and the economic downturn as a consequence of the Soviet Union collapse. At a regional level, soil quality is often the main factor that determines most variation in grain production; therefore, natural soil fertility (NSF) is a major factor influencing yield variability (Figure 1). Information on soil fertility types was used as a basis for this study. According to the Ukrainian State Agency for Land Resources (USALR, 2010), agricultural land (AL) has two main soil fertility types: natural and enhanced. In the first case, crop production functions depend strongly upon climatic and/or environmental factors. Fertilizers are the key input influencing yield in the second case (Velichko, 2009). This provides an opportunity to estimate production increases in the short term due to fertilizer application (or intensification) and to evaluate the efficiency of their application.
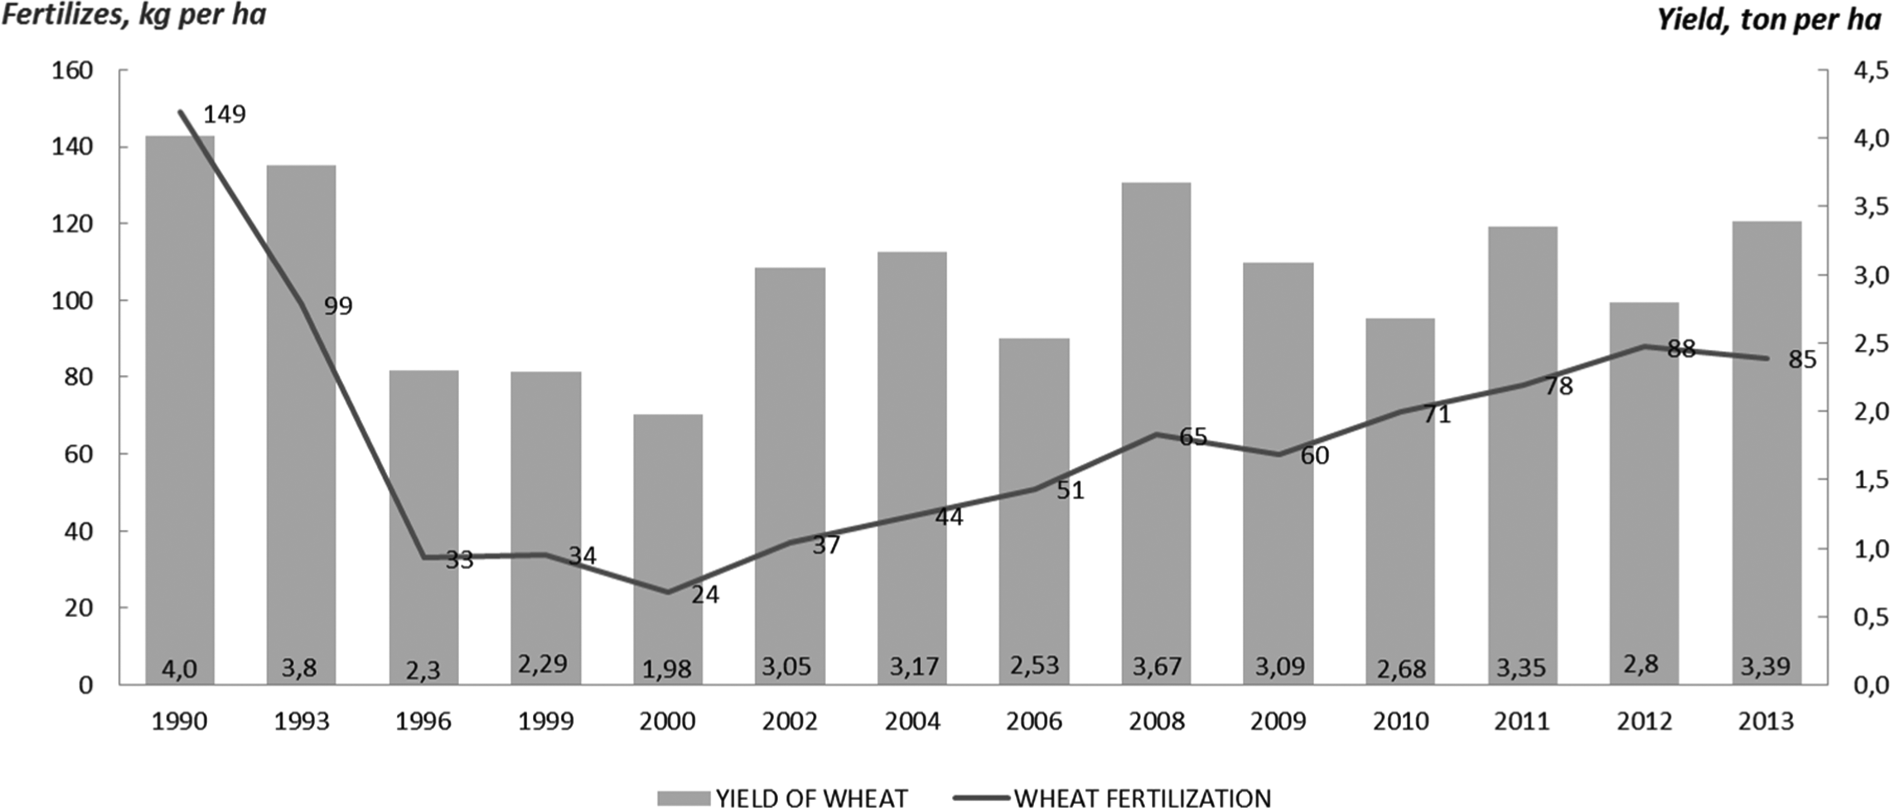
Wheat yield (ton/area) comparison with level of fertilizer application (kg/ha) for crop production in the Ukraine.
Recent research (Stefanski et al., 2014) suggests that abandoned AL in the Ukraine could be utilized for cereal production. In 2013, this amounted to 277,200 ha, or about 4.5% of the total wheat HA. Within different regions, this area varies between 2% and 23%. The expansion of production in these areas thus provides the basis for evaluating additional wheat production potential. The following two routes for production augmentation exist: improving yields (intensification) and/or converting more land into productive use (expansion) (Nonhebel, 2002). Combining both intensification and expansion provides possibilities to increase production potential of wheat in the short term. The principal objective of this study was therefore to assess this potential in the Ukraine to satisfy both internal and external consumption and to optimize the energy-food grain balance. For this, the following questions need to be addressed: (i) how soil fertility influences yield variability?, (ii) what wheat production levels may be achieved in terms of intensification and expansion?, (iii) is the efficiency of fertilization similar across different regions?, and (iv) how might the Ukrainian wheat production distribution map look after expansion?
In this article, wheat is used as an example crop to demonstrate the impact of optimizing fertilizer levels on to the crop production efficiency under typical environmental and soil conditions. However, the proposed methodology could be applied to estimate the production potential of all grains in the Ukraine. Two different methodologies were applied. The first adapts the experience of previous studies for production potential estimation. The other approach uses an econometric method for estimating a production function. The methodology is outlined as follows.
Materials and methods
Data sources
We used Ukraine specific data on land resources such as organic and enhanced soil fertility (ESF) and the area of abandoned land (AL), at a regional level, from the USALR (2013). Time series data for wheat production, yield, HA, fertilization and domestic cost were extracted from State Statistics Service of Ukraine Agriculture Report: crops—growing (1990–2013). The time period for data analysis was 18 years (1995–2013). Abandoned land data referred to 2013 supplemented with data from the Food and Agricultural Organization statistical data set (FAOSTAT, 2012). All calculations were conducted separately for each administrative region (excluding Crimea).
Determination of yield gap through soil fertility
The value of arable land is determined by soil quality according to the level of soil fertility (USALR, 2010). Consequently, uneven soil fertility results in a wide variation in wheat yields and determines the efficiency of its production. Ukrainian soils are very diverse in terms of their particle size, density, soil moisture, and other parameters related to soil genesis. These characteristics ultimately determine the soil fertility and influence yield variability. The diversity of soil fertility of Ukrainian arable land has previously been studied by Velichko (2009) for the main agricultural crops. Soil fertility may be categorized into two main types: either natural or enhanced. Natural Soil Fertility (NSF) is defined by the soil organic matter and environmental hydrothermal conditions such as humidity and temperature. However, natural soil fertility level will be different for different crop types in the same conditions. Enhanced Soil Fertility (ESF) is equal to NSF that has been improved through application fertilizer to optimal levels (Velichko, 2009). This study assumed the ESF correlates directly with the level of fertilizer use (Berzsenyi et al., 2000). The wide variety of soil types and environmental conditions that exist in the Ukraine result in seven main soil/environmental zones with corresponding levels of NSF and ESF (Velichko, 2009) (Tables 1 and 2).
Wheat yield (ton/ha) variability under different soil fertility conditions according to Ukrainian environmental zones.
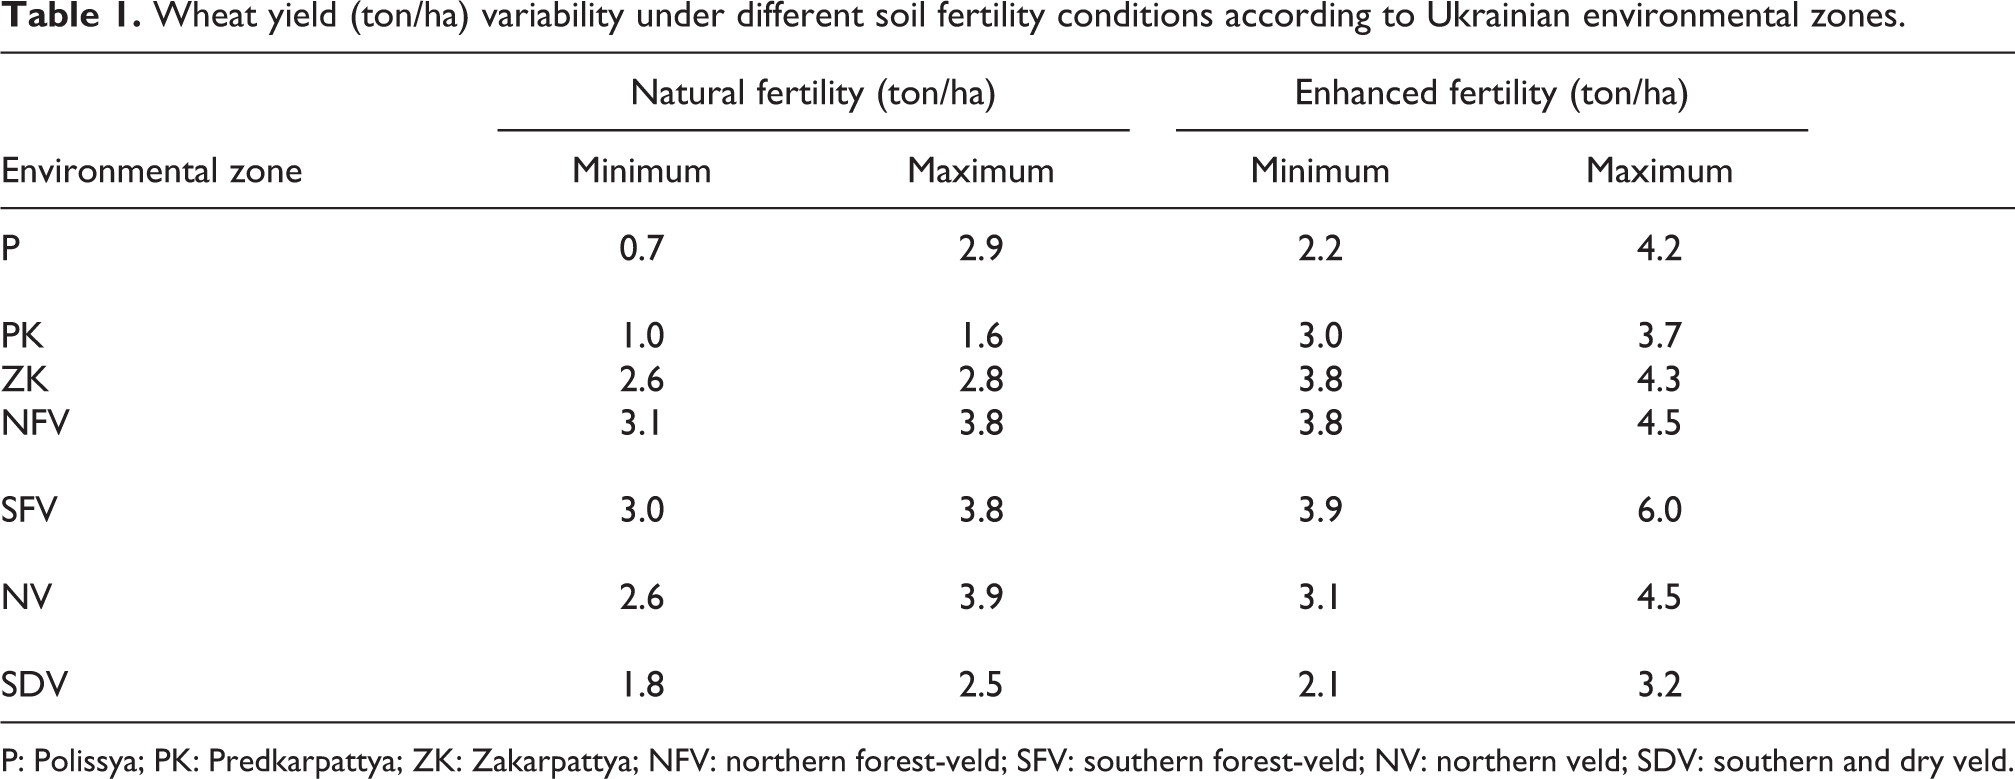
P: Polissya; PK: Predkarpattya; ZK: Zakarpattya; NFV: northern forest-veld; SFV: southern forest-veld; NV: northern veld; SDV: southern and dry veld.
Environmental zone harmonization in accordance to administrative map of Ukraine.
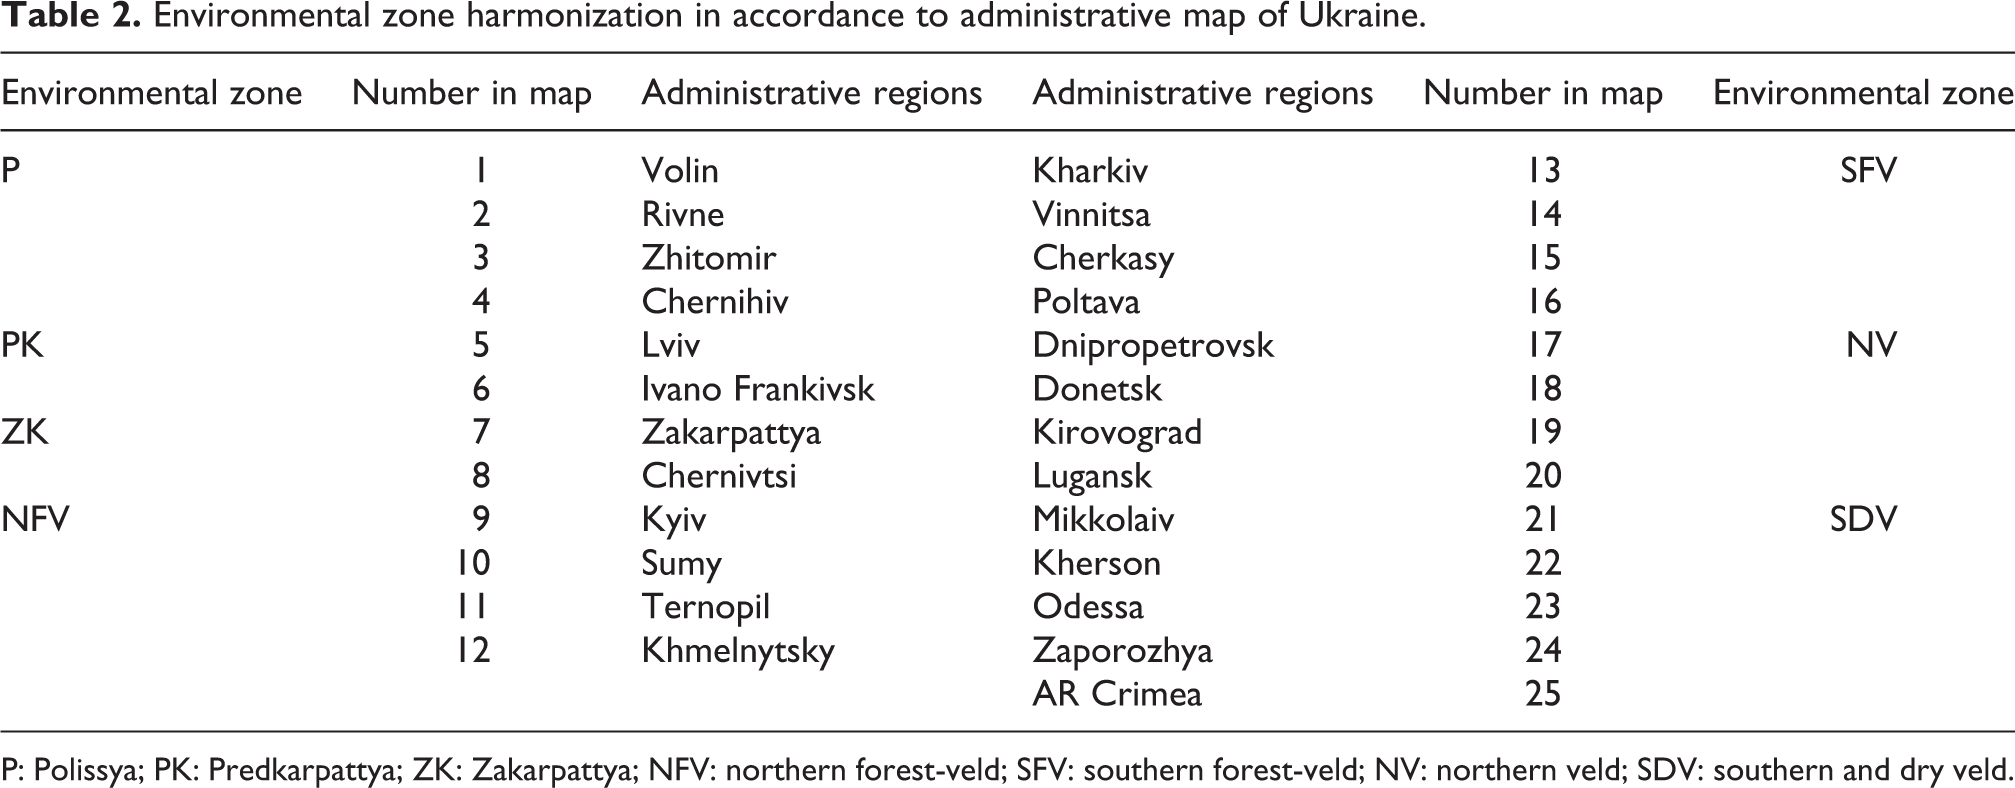
P: Polissya; PK: Predkarpattya; ZK: Zakarpattya; NFV: northern forest-veld; SFV: southern forest-veld; NV: northern veld; SDV: southern and dry veld.
Three categories of yield were defined for each zone: base, potential, and actual. (i) Base wheat yield (Yb) is determined by NSF and is defined as the lowest; (ii) potential wheat yield (Yp) is determined by the ESF condition and defined as the highest under optimal fertilization; and (iii) actual wheat yield (Ya) is the average yield based on crop cultivation between 1995 and 2013. Significant variability is inherent for wheat yields within the framework of NSF and ESF between different zones (Table 1). Both of them have two levels: a minimum and a maximum. As a result, four different variations can be derived for each crop within each zone. The biggest difference in production potential is observed between NSF and ESF yields in the Polissya zone. The maximum yield for ESF for the most productive zone southern forest-veld (SFV) can be up to 8.5 times higher compared to the minimum level of the poorest zone (P) under NSF. The same trend can be noticed within each environmental zone and productivity group for NSF and ESF (Table 1). In this study, the maximum yield under ESF was used to estimate wheat production potential. The maximum yield level is attained under optimal fertilization.
Determination of production potential
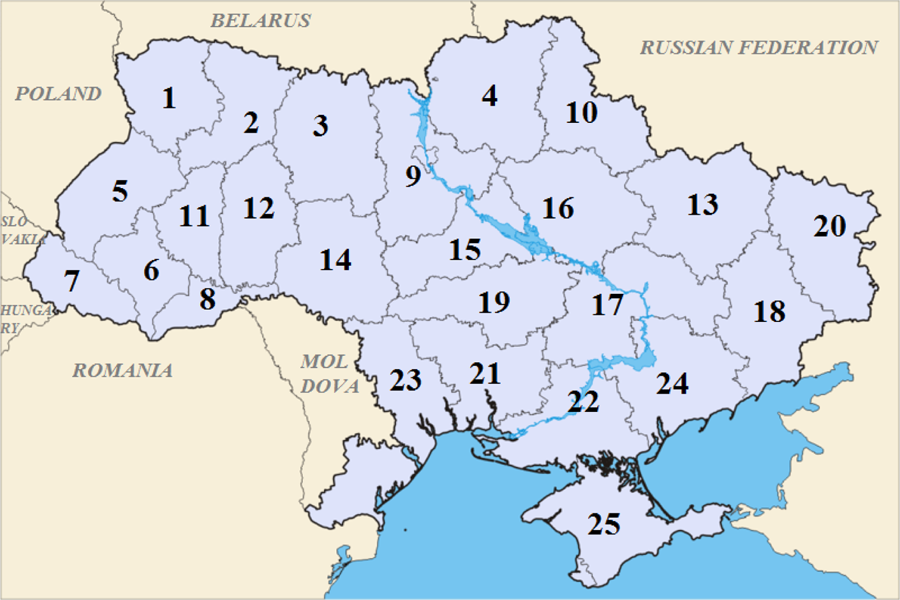
Two scenarios were used to estimate production potential: intensification (Pi) and expansion (Pe). Naturally, the yield and harvested area are the key variables which define wheat production. Harvested area (HA) variability reaches 31% with the maximum of about 2. 3 × 10⁶ hectares. The average HA per region was used to estimate Pi. For expansion, the abandoned land (AL) based on 2013 data was used for the Pe calculation. The potential productivity (Yp) and actual productivity (Ya) served as inputs for calculation of production potential. Yp was obtained from previous research by Velichko (2009) for different zones (Table 1). Ya is the actual data reported for 1995–2013 according to regions within zones (Figure 2 and Table 2). All other conditions that influence productivity such as soil fertility, climate, crop rotation, and seed bank were assumed to be constant. In this study, we adopted the crop production simulation model (Ozsabuncuoglu, 1998) that combines two approaches. For intensification, wheat production growth is a function of yield. We assumed a linear relationship between HA and Yp under the highest soil fertility condition (Bell and Fischer, 1994; Van Wart et al., 2013). For expansion, the average Ya for each region was used to estimate the production from current abandoned AL. Finally, total production potential (Pp) was calculated: Number of region with corresponding environmental zones and administrative map of the Ukraine.


Average actual wheat yield per region (Ya) was used to calculate Pe. We used 2013 yield values, as there were no data available on the productivity (natural or enhanced) for abandoned lands.
The following equation was used for assessing production differences (Pd):
where Pa (actual wheat production) was the average wheat production by zone/region between 1995 and 2013.
Potential increases in wheat production in response to intensification and/or expansion by zone are summarized in Table 3. Calculations were also applied to each region based on Figure 2 and Table 2; the results are summarized in Table 4.The wheat production data, including estimated changes in the Ukrainian wheat production for each scenario, by region, are shown in Figure 3, with maps showing (a) potential production, (b) differences between potential and actual production, (c) actual production, and (d) production in 1990. The map legend corresponds to different production levels. From Figure 3, it is possible to identify the total capacity of wheat production by region in the future (a) compared with production levels in 1990 (d) and average production levels between 1995 and 2013 (c). The data shows how the volume of wheat production might increase for each region compared to actual production levels and which regions have the highest potential to increase production.
Wheat production by environmental zone: actual and potential under intensification and expansion.
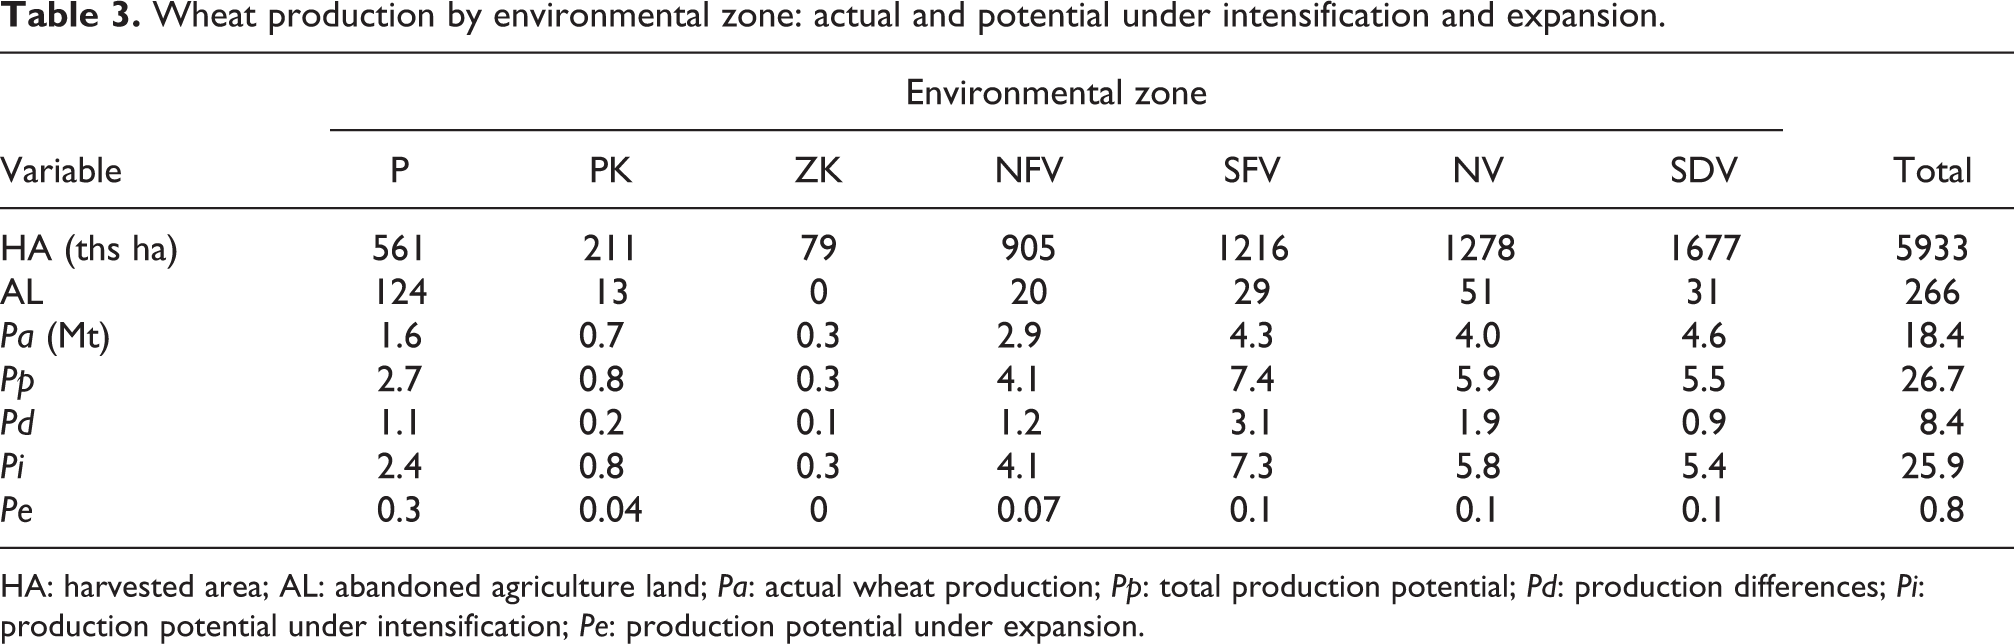
HA: harvested area; AL: abandoned agriculture land; Pa: actual wheat production; Pp: total production potential; Pd: production differences; Pi: production potential under intensification; Pe: production potential under expansion.
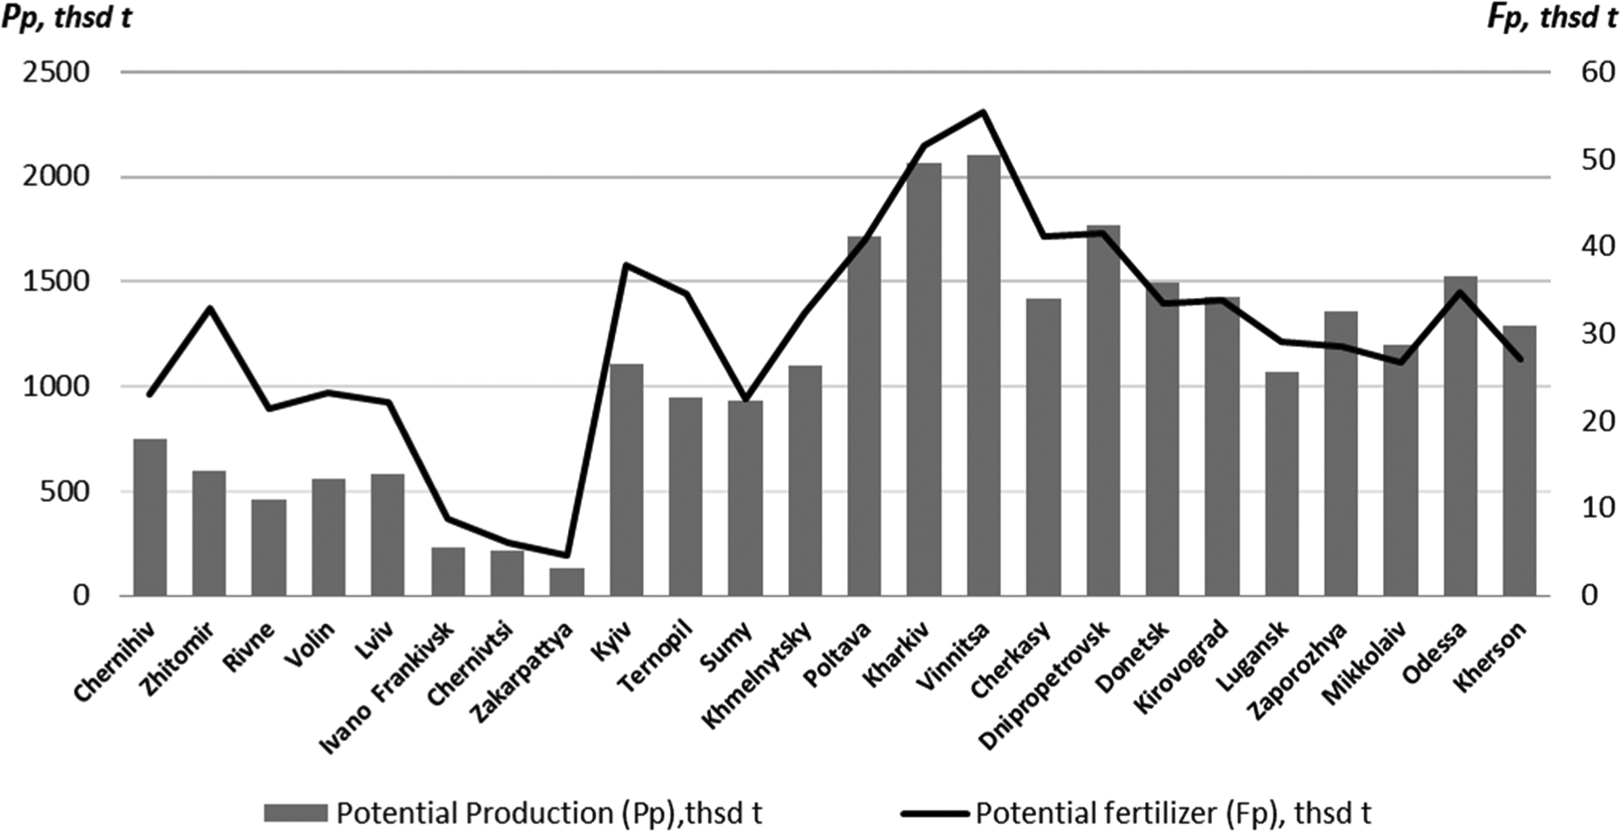
Wheat production and fertilizer application by region: actual and potential in terms of intensification and expansion.
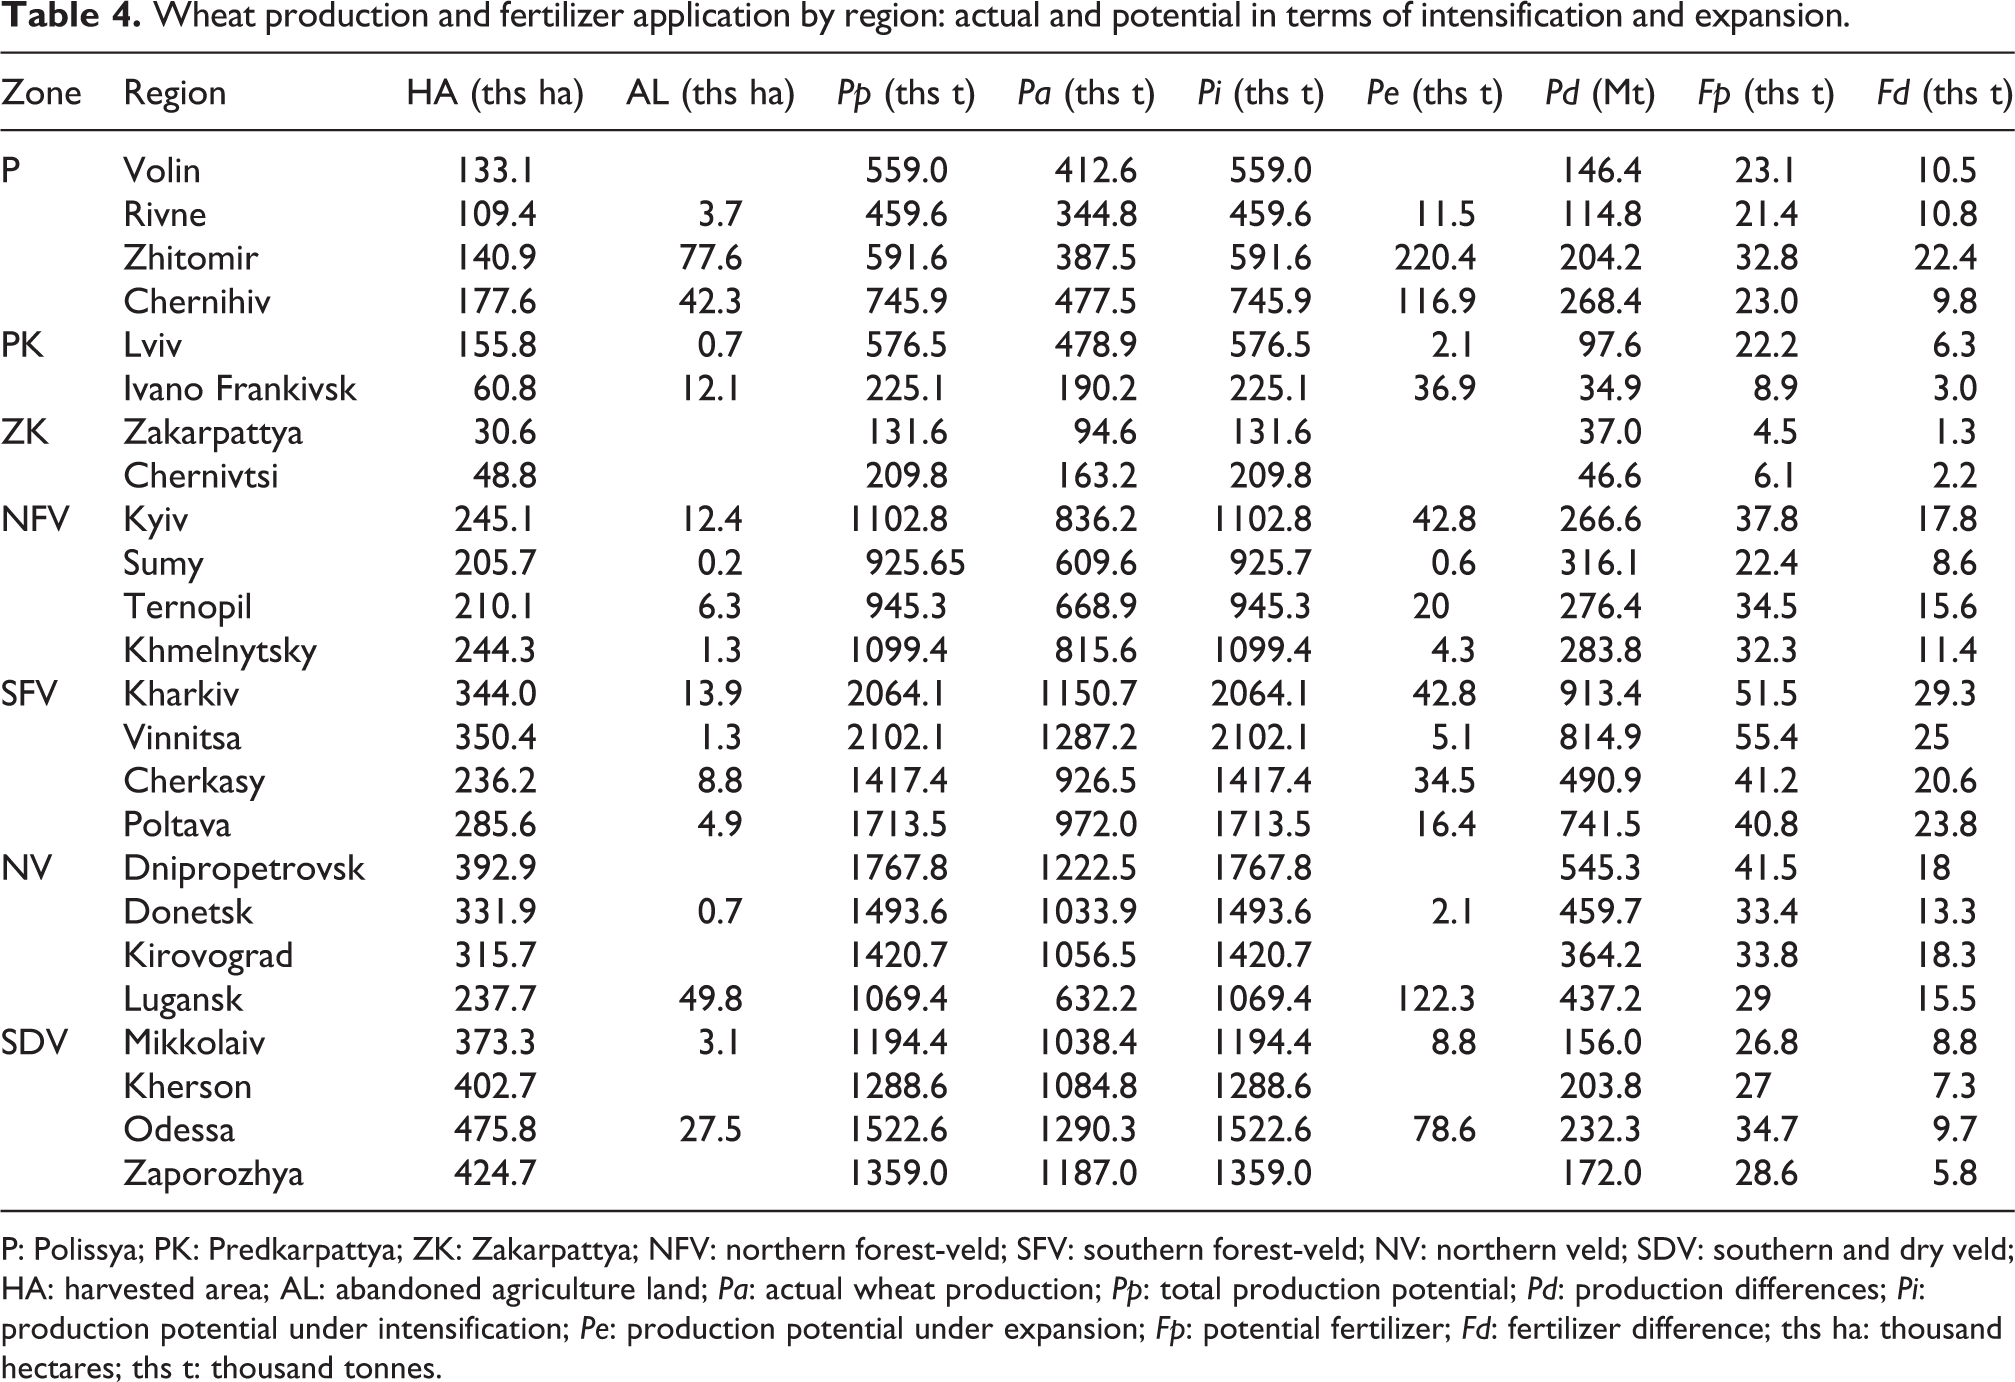
P: Polissya; PK: Predkarpattya; ZK: Zakarpattya; NFV: northern forest-veld; SFV: southern forest-veld; NV: northern veld; SDV: southern and dry veld; HA: harvested area; AL: abandoned agriculture land; Pa: actual wheat production; Pp: total production potential; Pd: production differences; Pi: production potential under intensification; Pe: production potential under expansion; Fp: potential fertilizer; Fd: fertilizer difference; ths ha: thousand hectares; ths t: thousand tonnes.
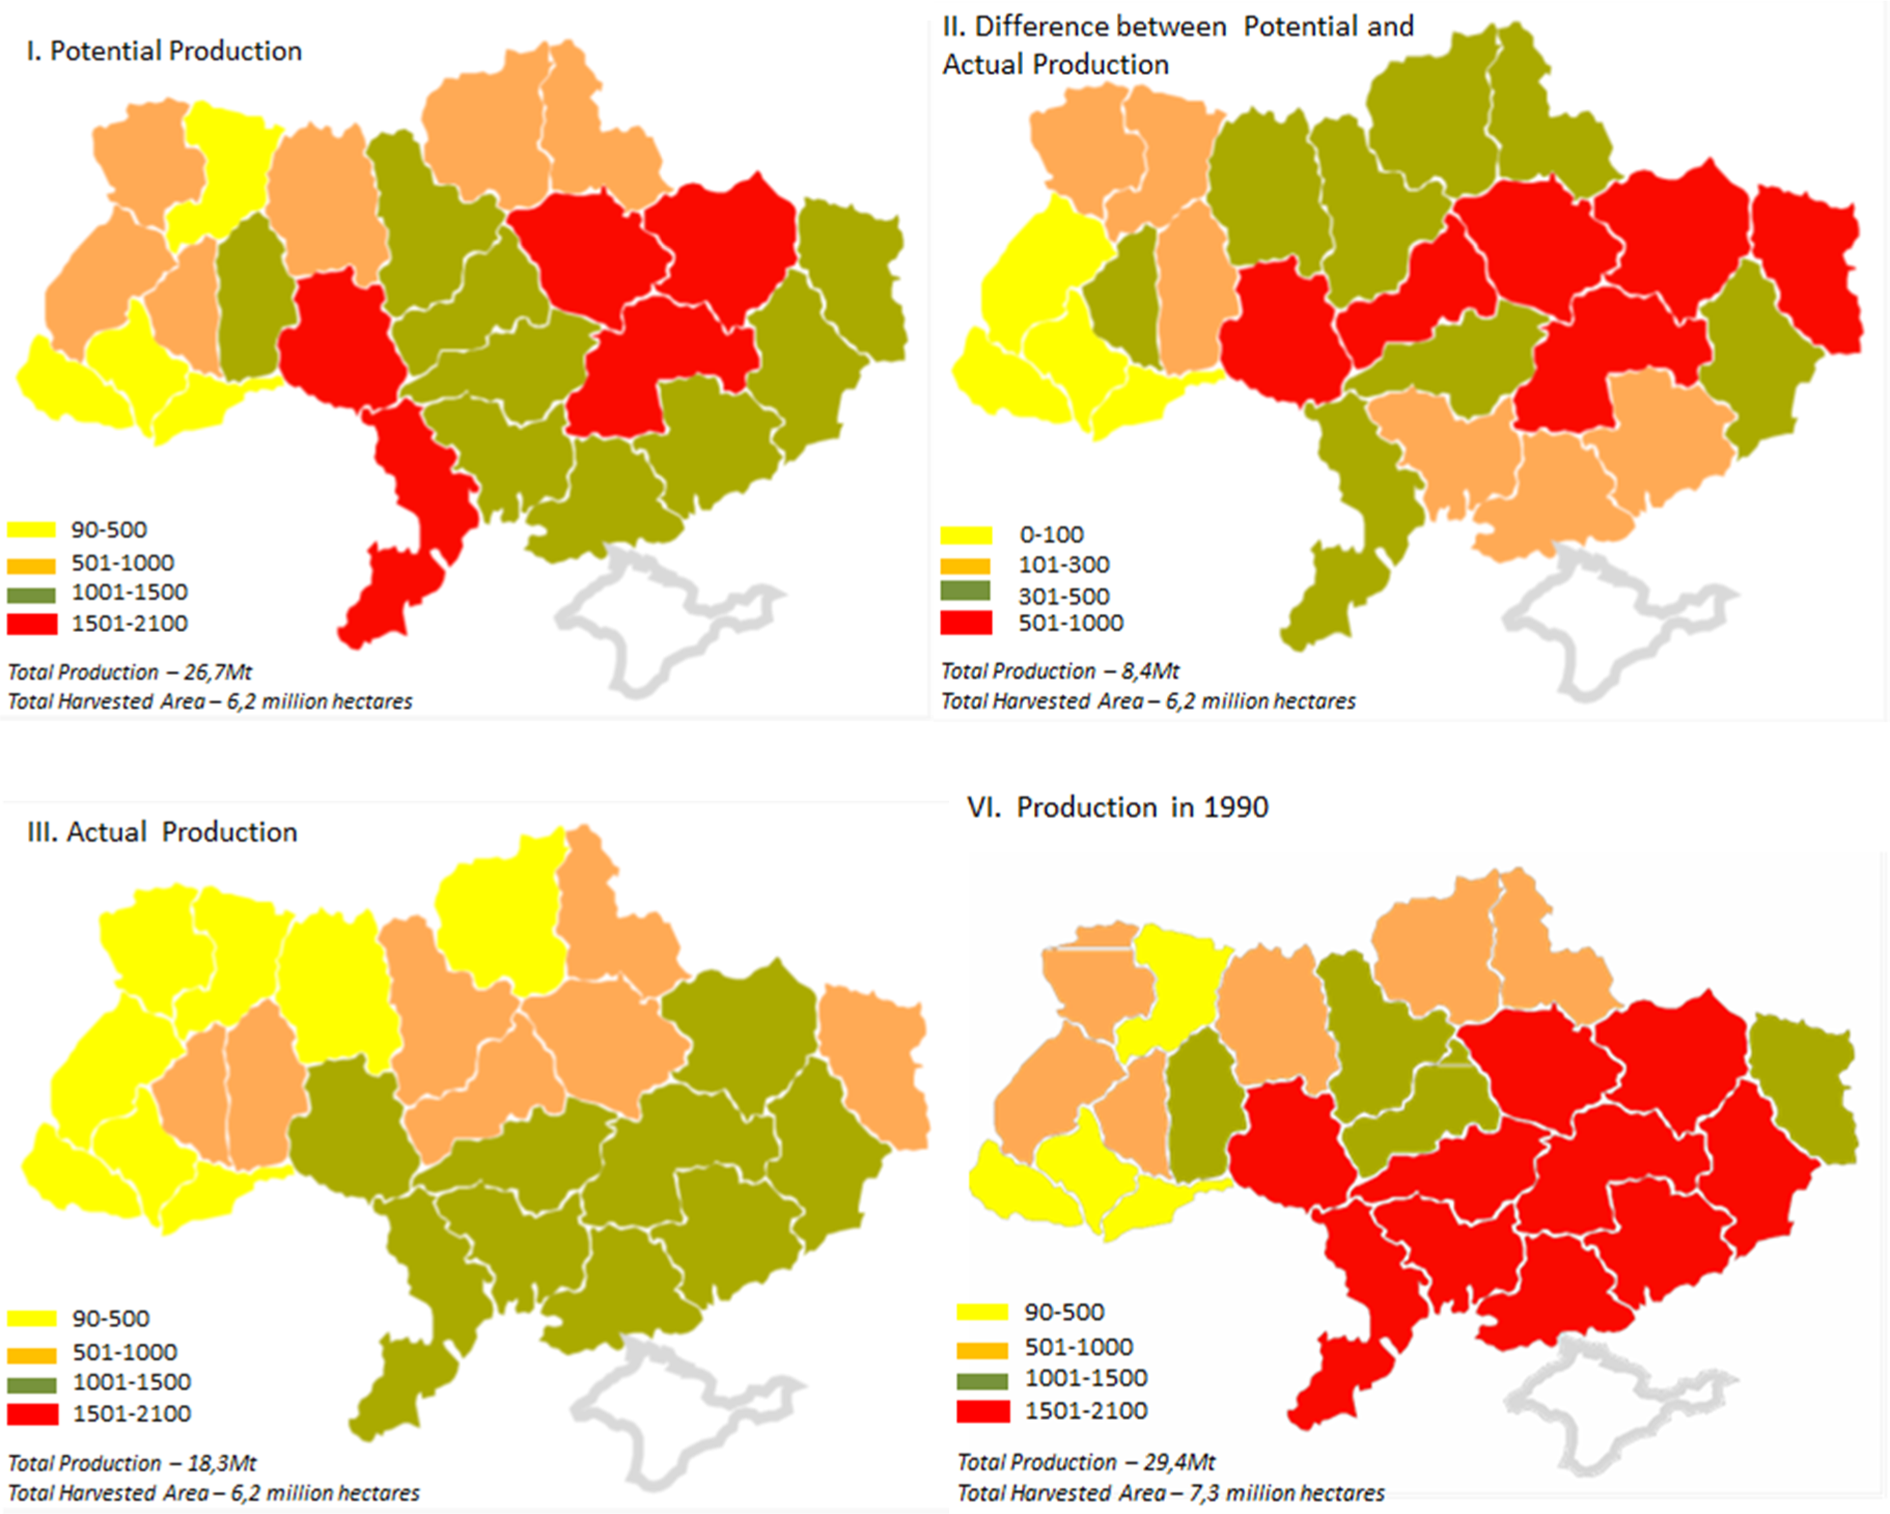
Actual and potential wheat production levels (thousand tonnes) by region in the Ukraine.
Fertilizer calculations
Taking into account, the differences in soil fertility between each zone, yield optimization can be achieved through optimal fertilization. This is the only parameter which accounts for differences between Yb and Yp after fallow rotation and provides scope for estimating intensification efficiency. In this study, intensification efficiency was determined by the increase in yield per unit of additional fertilizer (Velichko, 2009). Three fertilization options were considered. Actual fertilizer (Fb) is the quantity of fertilizer applied for actual yield (Ya). The fertilizer difference (Fd) represents the additional amount of fertilizer needed to achieve Yp. The potential fertilizer (Fp) was the total amount of fertilizer:

To determine the elasticity of Fd on national level yield, a factor production function was applied (McArthur, 2011). A linear approximation strategy based on a decreasing return was defined according to field level agronomic information. Accordingly, an arc elasticity equation for aligned data series of yield (Ya) was used based on Simon (2004).
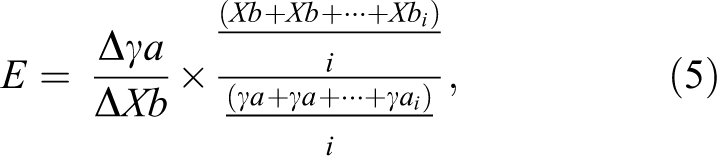
where E is the arc elasticity coefficient, Xbi is the independent variable, Fb per year (kg/ha), γa is the dependent variable, Ya per year (t/ha), Δγa is the relative change measure of yield, ΔXb is the relative change in fertilizer, and i is the series length. Finally, Fd is the required amount derived from the arc elasticity application defined as:
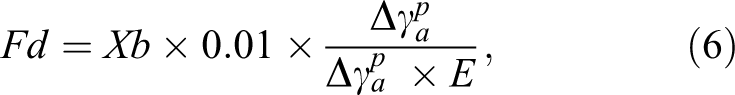
where Xb is the average of Fb, and
Wheat production potential (000 ton) under enhanced levels of soil fertility by region in the Ukraine.
Results and discussion
The level of fertilizer calculated in this study corresponds closely with observed data from previous periods (e.g. 1990). However, actual yields could be higher, taking into account the use of modern technologies for land cultivation and advances in sowing. Based on our calculations, it is projected that additional production could be as high as 8.4 Mt above the average production for the period studied (Table 3). The estimated extra average wheat production capacity in the short term is 7.6 Mt due to intensification and 0.8 Mt due to expansion. The wheat production increase due to expansion is approximately 10 times smaller than the increase through intensification. The wheat production increase ratio of the first (Pi) to second (Pe) is 98–2%, respectively. Thus, the expansion potential is highly questionable.
Total wheat production in the short term could reach 26.7 Mt per annum. Any quantity in excess of internal consumption needs could then be exported (assuming no legal export restrictions). Internal consumption is forecast to be 11.0–12.5 Mt. Thus, the total potential for wheat export could reach 14–15 Mt annually. Three zones which account for 70% of the HA and provide 70% of current production (Pa) are southern and dry veld (SDV), SFV, and northern veld (NV), respectively (Table 3). At present, SDV dominates and includes the following regions: Kherson, Mikkolaiv, Zaporozhya, and Odessa. Traditionally, the SDV zone was as leader in the production of wheat. High quality soil, wide harvesting areas (the cultivated agricultural land ratio is as high as 88% in some regions) and an accessible location all contributes to this. However, the prospects of the SDV zone’s going back to previous production levels are not very certain due to temperature increases, dry climate and high soil degradation. The threshold level of wheat production will therefore increase by 0.1–0.5 Mt. The previous production level (1.5–2.1 Mt) in the SVD zone could be achieved in only one region (Odessa) (Figure 3(a), Table 4). The dominant areas for production have shifted toward the NV and SFV zones. Their total production capacity is estimated to be around 13.3 Mt that amounts to half the total wheat production potential (Table 3). The SFV zone could provide almost 7.3 Mt. Under favorable climatic conditions (and the “poorest” soils), intensification could result in SFV becoming the dominant region in terms of wheat production.
Total Pp was found to be below 1990 levels by about 3 Mt (Figure 3(a) and (d)). The key reasons for this were a reduction in HA (by 1200 × 103 ha on average) and increase in proportion of other crops such as sunflower and corn in the grain production balance compared to the 1990 crop mix. So there is an evidence of a geographical shift in production patterns. The most promising areas for wheat production were identified (colored red in Figure 3), with six regions having potential to increase production by more than 0.5 Mt compared to current levels (Figure 3(a)). Forteen regions could produce more than 1 million tons representing 78% of total production though intensification (Figure 3(a)). The levels of production in 1990 could be reached in 13 regions despite the general trend in reduction of wheat HAs. Figure 3(a) shows a significant wheat production growth for six regions with each equating to c1.5–2 million tons. Figure 3(c) shows that no region has reached the 1990 wheat production levels (on average) in the past 18 years. The main production territorial boundaries will be defined in the central and southeastern parts of the country. Generally, the Ukraine could become the grain basket of Europe if wheat production levels were to reach 1990 levels, which could be achieved through applying optimal level of fertilizers. Currently, two main circumstances might achieve this: efficiency of the territorial production portfolio and grain export trade prospects. Each zone has a different potential production capacity. As highlighted earlier, fertilizers are the main cause of wheat yield variability (between natural and ESF; Table 1). Thus, each soil type (within the environmental zones) has an optimal level of fertilizer application. Hence, the production capacity of some zones/regions may be higher than others with the same fertilizer input. Boosting wheat production could also impact on internal markets and land use. To assess these transformations, the intensification efficiency of the production system was identified for each zone. The optimal level of fertilizer application for the maximum level of wheat yield was derived for each region (Table 4). Figure 4 shows the difference in fertilizer application efficiency between each region. It could be improved by up to 80% for some regions, while others are at the limit of their potential. For example, the P zone includes regions such as Zhitomir, Rivne, and Volin with the lowest levels of efficiency. Using full soil fertility potential needs significant fertilizer input (183 kg/ha on average). While the peak level for others has almost been reached, such as in Zaporozhya, Odessa, or Kherson. Their fertilizer application level is 2.5 times less with comparatively low levels of soil fertility (Table 1). Areas with marginal levels of fertilization are the SFV zone and the Dnipropetrovsk, Donetsk, and Mikkolaiv regions. However, the prospect of increasing wheat output in all regions through intensification is clear. According to current estimates, only three zones (SFV, NV, and SDV) would be able to achieve present production and efficiency levels. In this case, both options, including intensification and expansion, need to be implemented.
Concluding comments
The Ukraine could produce up to 26.7 Mt wheat per annum in the short term; however, while there is a great potential, higher yields are strongly dependent on appropriate levels of fertilization. Access to international grain markets is one of the main motivations to increase the productivity. However, the extra costs due to additional fertilization also need to be taken into account. To determine the economic efficiency of intensification, the internal price of wheat and external fertilizer price was obtained. According to 2013 data, the intensification efficiency varies between regions, but on average, income per hectare exceeds fertilizer costs 16 fold. Its (income) scale ranges from US$514/ha to US$1002/ha. This suggests that intensification would be effective for all arable land especially in the SFV zone. Furthermore, the Ukrainian internal prices and international market prices are markedly different with the latter being about 33% higher in 2013. As a result, exporting wheat remains a highly attractive option. The analysis here has shown that export potential could be about 14 Mt. Conversely, the expansion potential is likely to provide a negligible impact on production levels. Finally, it is also important to understand the regional consequences of intensification, as changes in land use lead to impacts on regional socioeconomics. The methodology presented here could also be applied to evaluate the potential yield growth for other important grain crops in the Ukraine and on wheat elsewhere internationally.
Footnotes
Declaration of conflicting interests
The author(s) declared no potential conflicts of interest with respect to the research, authorship, and/or publication of this article.
Funding
The author(s) received no financial support for the research, authorship, and/or publication of this article.